TBM VWAP Bands Style SetupA stripped down and modified version of the 'VWAP with Standard Deviation Bands' indicator by pmk07. The bands have been modified and styled to match those used on the Tradovate platform by Matt from the Trades By Matt youtube channel so if you would like to know how they should be used go to his youtube channel and watch his strategy explanation video.
Volume Weighted Average Price (VWAP)
rth vwap and midMidpoint and VWAP are often important inflection points in daytrading. I managed to find a script providing me with a 24 hour session midline by NorthStarDayTrading and a RTH VWAP script by LDBC. So I decided to merge those two to get a RTH mid and vwap.

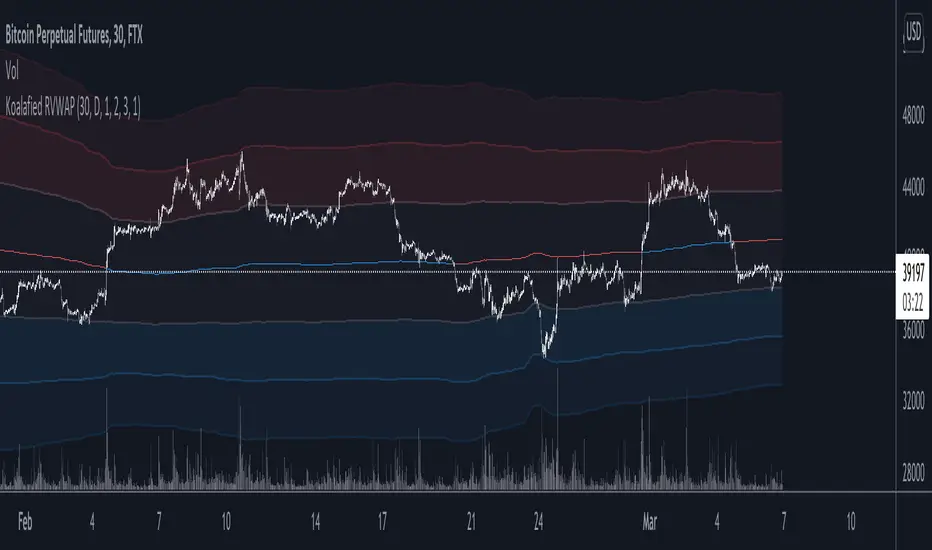
Koalafied RVWAPThis indicator shows both the Rolling VWAP and Standard Deviations as set by the user. The Rolling VWAP calculation is similar to the standard VWAP although it calculates the volume weighted average price over the specified period of time (lookback), resetting for each subsequent bar.
The unique aspect of this indicator is that instead of calculating the RVWAP over the current timeframes lookback period, the option is available to select a High-Time-Frame setting instead.
This has two different methods of calculation
1 - Based on HTF security requests (both repainting and non-repainting)
2 - Automatic calculation of number of current timeframe bars that make up the HTF lookback period (smoother and non-repainting plot)
Additionally a smooth function is included for the HTF input setting.
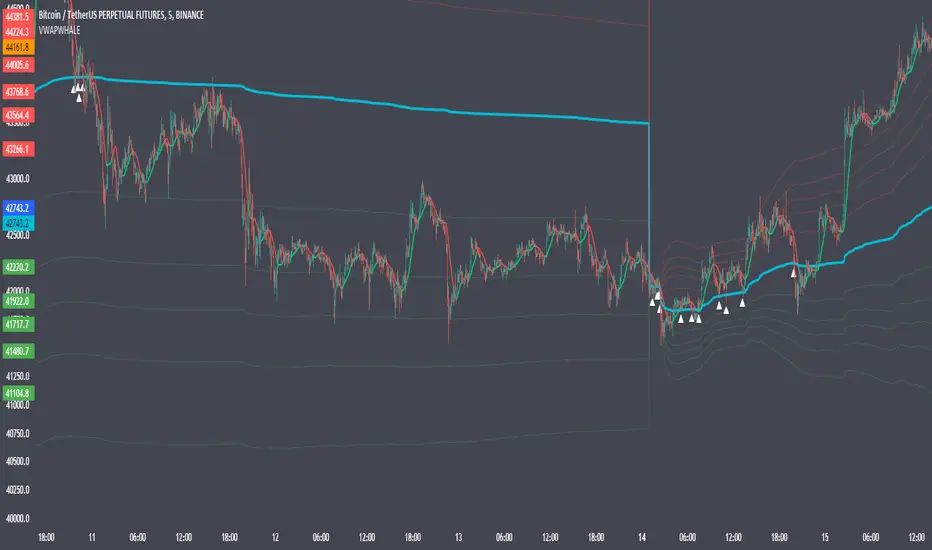
VwapWhaleBasically it is an indicator that is based on different vwap
You have the vwap of the day, of the week, and the vwap at overbought and oversold levels.
This will help you distribute the different buy and sell orders. think like a whale
You no longer have an excuse to make money.
You have a twap line with the volumes that are generated over the session. Every band can be used to help you to your target profits in every trade direction
Remember to put it in a "session" timeframe, as it is useful for scalping and daytrading.
Trading tips:
The vwap of the week, if it is below, acts as support. If it is above it acts as resistance, and gives you a slight idea of the market trend. During the day, the candles will be attracted to the different vwap , with the vwap of the session having greater weight. The different vwaps can be considered as zones of order diversification
Let me know if was useful for you :)
Thanks for the idea -
-dysrupt
-jaggedsoft
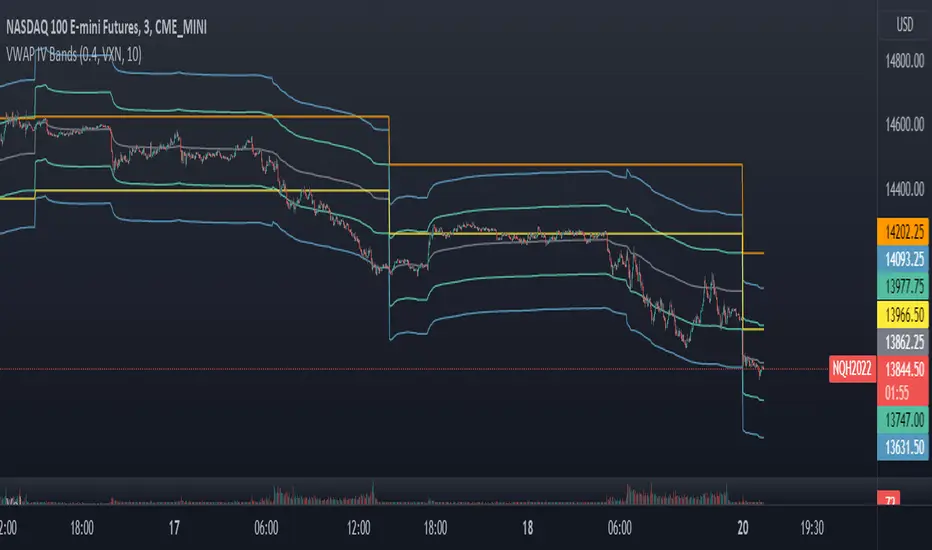
VWAP Implied Volatility BandsThis script takes the built in VWAP function and creates bands using various Volatility Indexes from the CBOE. The script plots the bands at desired multiples, as well as the closing value of the prior day's first set of bands. Users can choose from the following:
VIX(ES), VXN(NQ), RVX(RTY), OVX(CL), GVX(GC), SIV(ZS), CIV(ZC), TYVIX(ZN), EUVIX(EURUSD), BPVIX(GBPUSD)
Upon selecting the desired volatility index, users must change the multiplier to fit the underlying product since the indexes are all calculated differently.
The goal with this script was to use market generated information (IV) to highlight potential trade locations.
Vwap SalvatierraVwap Salvatierra. an indicator that must be accompanied by other volume indicators.
Benefits:
- Long term Vwap.
- Middle Std. deviations, Calculated automatically.
- Previous zones available.
How to use:
when the price is >= stdev+3, look for shorts till came back to vwap
whe the price is <= stdev-3, look for longs till came back to vwap
if the vwap cannot be broken, as resistance, after several attempts, then sell
if the vwap can't be broken, like support, after several tries, then buy.

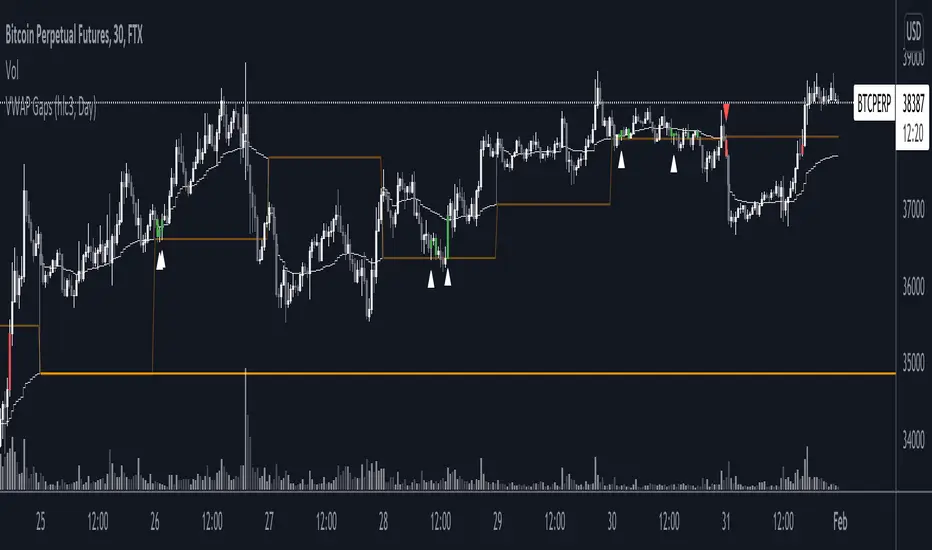
VWAP GapsTheory of untested previous VWAPs acting in similar way to nPOC, where agreed previous 'value' based on volume acts as a liquidity area to be retested.
Indicator shows
- User selected VWAP
- Untested previous VWAPs. The line will disappear once price crosses it's value
- Sweeps of previous VWAPs. Show by both bar colours and plotted arrows under different conditions.
Sweep Filters
1. Bull or Bear Bar (required for an arrow plot)
2. Sweep Conditions i.e. open below line, high above line, and close below line
3. If current VWAP is below/above the previous VWAP value.
WAP Maverick - (Dual EMA Smoothed VWAP) - [mutantdog]Short Version:
This here is my take on the popular VWAP indicator with several novel features including:
Dual EMA smoothing.
Arithmetic and Harmonic Mean plots.
Custom Anchor feat. Intraday Session Sizes.
2 Pairs of Bands.
Side Input for Connection to other Indicator.
This can be used 'out of the box' as a replacement VWAP, benefitting from smoother transitions and easy-to-use custom alerts.
By design however, this is intended to be a highly customisable alternative with many adjustable parameters and a pseudo-modular input system to connect with another indicator. Well suited for the tweakers around here and those who like to get a little more creative.
I made this primarily for crypto although it should work for other markets. Default settings are best suited to 15m timeframe - the anchor of 1 week is ideal for crypto which often follows a cyclical nature from Monday through Sunday. In 15m, the default ema length of 21 means that the wap comes to match a standard vwap towards the end of Monday. If using higher chart timeframes, i recommend decreasing the ema length to closely match this principle (suggested: for 1h chart, try length = 8; for 4h chart, length = 2 or 3 should suffice).
Note: the use of harmonic mean calculations will cause problems on any data source incorporating both positive and negative values, it may also return unusable results on extremely low-value charts (eg: low-sat coins in /btc pairs).
Long version:
The development of this project was one driven more by experimentation than a specific end-goal, however i have tried to fine-tune everything into a coherent usable end-product. With that in mind then, this walkthrough will follow something of a development chronology as i dissect the various functions.
DUAL-EMA SMOOTHING
At its core this is based upon / adapted from the standard vwap indicator provided by TradingView although I have modified and changed most of it. The first mod is the dual ema smoothing. Rather than simply applying an ema to the output of the standard vwap function, instead i have incorporated the ema in a manner analogous to the way smas are used within a standard vwma. Sticking for now with the arithmetic mean, the basic vwap calculation is simply sum(source * volume) / sum(volume) across the anchored period. In this case i have simply applied an ema to each of the numerator and denominator values resulting in ema(sum(source * volume)) / ema(sum(volume)) with the ema length independent of the anchor. This results in smoother (albeit slower) transitions than the aforementioned post-vwap method. Furthermore in the case when anchor period is equal to current timeframe, the result is a basic volume-weighted ema.
The example below shows a standard vwap (1week anchor) in blue, a 21-ema applied to the vwap in purple and a dual-21-ema smoothed wap in gold. Notably both ema types come to effectively resemble the standard vwap after around 24 hours into the new anchor session but how they behave in the meantime is very different. The dual-ema transitions quite gradually while the post-vwap ema immediately sets about trying to catch up. Incidentally. a similar and slower variation of the dual-ema can be achieved with dual-rma although i have not included it in this indicator, attempted analogues using sma or wma were far less useful however.
STANDARD DEVIATION AND BANDS
With this updated calculation, a corresponding update to the standard deviation is also required. The vwap has its own anchored volume-weighted st.dev but this cannot be used in combination with the ema smoothing so instead it has been recalculated appropriately. There are two pairs of bands with separate multipliers (stepped to 0.1x) and in both cases high and low bands can be activated or deactivated individually. An example usage for this would be to create different upper and lower bands for profit and stoploss targets. Alerts can be set easily for different crossing conditions, more on this later.
Alongside the bands, i have also added the option to shift ('Deviate') the entire indicator up or down according to a multiple of the corrected st.dev value. This has many potential uses, for example if we want to bias our analysis in one direction it may be useful to move the wap in the opposite. Or if the asset is trading within a narrow range and we are waiting on a breakout, we could shift to the desired level and set alerts accordingly. The 'Deviate' parameter applies to the entire indicator including the bands which will remain centred on the main WAP.
CUSTOM (W)ANCHOR
Ever thought about using a vwap with anchor periods smaller than a day? Here you can do just that. I've removed the Earnings/Dividends/Splits options from the basic vwap and added an 'Intraday' option instead. When selected, a custom anchor length can be created as a multiple of minutes (default steps of 60 mins but can input any value from 0 - 1440). While this may not seem at first like a useful feature for anyone except hi-speed scalpers, this actually offers more interesting potential than it appears.
When set to 0 minutes the current timeframe is always used, turning this into the basic volume-weighted ema mentioned earlier. When using other low time frames the anchor can act as a pre-ema filter creating a stepped effect akin to an adaptive MA. Used in combination with the bands, the result is a kind of volume-weighted adaptive exponential bollinger band; if such a thing does not already exist then this is where you create it. Alternatively, by combining two instances you may find potential interesting crosses between an intraday wap and a standard timeframe wap. Below is an example set to intraday with 480 mins, 2x st.dev bands and ema length 21. Included for comparison in purple is a standard 21 ema.
I'm sure there are many potential uses to be found here, so be creative and please share anything you come up with in the comments.
ARITHMETIC AND HARMONIC MEAN CALCULATIONS
The standard vwap uses the arithmetic mean in its calculation. Indeed, most mean calculations tend to be arithmetic: sma being the most widely used example. When volume weighting is involved though this can lead to a slight bias in favour of upward moves over downward. While the effect of this is minor, over longer anchor periods it can become increasingly significant. The harmonic mean, on the other hand, has the opposite effect which results in a value that is always lower than the arithmetic mean. By viewing both arithmetic and harmonic waps together, the extent to which they diverge from each other can be used as a visual reference of how much price has changed during the anchored period.
Furthermore, the harmonic mean may actually be the more appropriate one to use during downtrends or bearish periods, in principle at least. Consider that a short trade is functionally the same as a long trade on the inverse of the pair (eg: selling BTC/USD is the same as buying USD/BTC). With the harmonic mean being an inverse of the arithmetic then, it makes sense to use it instead. To illustrate this below is a snapshot of LUNA/USDT on the left with its inverse 1/(LUNA/USDT) = USDT/LUNA on the right. On both charts is a wap with identical settings, note the resistance on the left and its corresponding support on the right. It should be easy from this to see that the lower harmonic wap on the left corresponds to the upper arithmetic wap on the right. Thus, it would appear that the harmonic mean should be used in a downtrend. In principle, at least...
In reality though, it is not quite so black and white. Rarely are these values exact in their predictions and the sort of range one should allow for inaccuracies will likely be greater than the difference between these two means. Furthermore, the ema smoothing has already introduced some lag and thus additional inaccuracies. Nevertheless, the symmetry warrants its inclusion.
SIDE INPUT & ALERTS
Finally we move on to the pseudo-modular component here. While TradingView allows some interoperability between indicators, it is limited to just one connection. Any attempt to use multiple source inputs will remove this functionality completely. The workaround here is to instead use custom 'string' input menus for additional sources, preserving this function in the sole 'source' input. In this case, since the wap itself is dependant only price and volume, i have repurposed the full 'source' into the second 'side' input. This allows for a separate indicator to interact with this one that can be used for triggering alerts. You could even use another instance of this one (there is a hidden wap:mid plot intended for this use which is the midpoint between both means). Note that deleting a connected indicator may result in the deletion of those connected to it.
Preset alertconditions are available for crossings of the side input above and below the main wap, alongside several customisable alerts with corresponding visual markers based upon selectable conditions. Alerts for band crossings apply only to those that are active and only crossings of the type specified within the 'crosses' subsection of the indicator settings. The included options make it easy to create buy alerts specific to certain bands with sell alerts specific to other bands. The chart below shows two instances with differing anchor periods, both are connected with buy and sell alerts enabled for visible bands.
Okay... So that just about covers it here, i think. As mentioned earlier this is the product of various experiments while i have been learning my way around PineScript. Some of those experiments have been branched off from this in order to not over-clutter it with functions. The pseudo-modular design and the 'side' input are the result of an attempt to create a connective framework across various projects. Even on its own though, this should offer plenty of tweaking potential for anyone who likes to venture away from the usual standards, all the while still retaining its core purpose as a traders tool.
Thanks for checking this out. I look forward to any feedback below.
Auto Anchored VWAP - Pivot BasedSo I loved the concept of anchored VWAP so just thought of making a script that anchors the VWAP when a new pivot is formed based on pivot length. Green is the pivot high anchor and Red is the pivot low anchor. I hope this is useful.

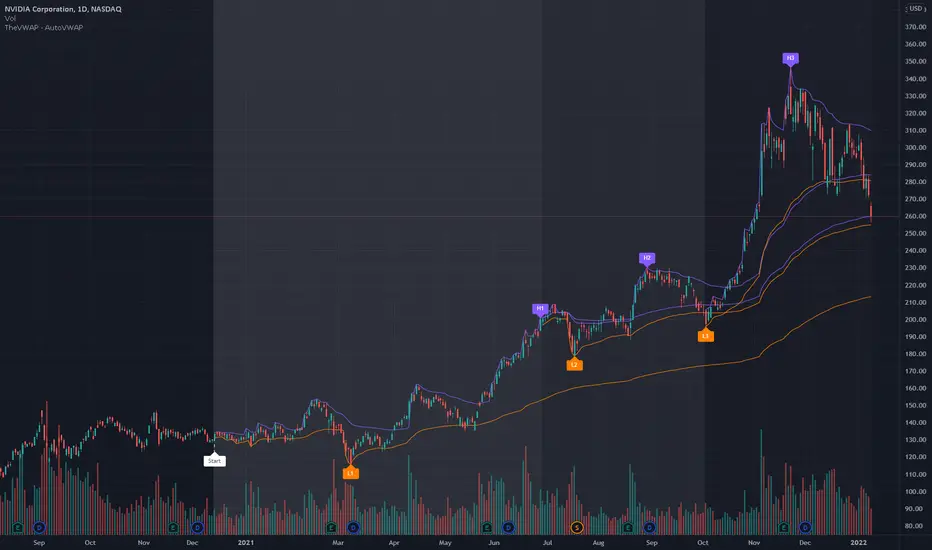
TheVWAP - AutoVWAPAutoVWAP 'slices' the chart into three search zones, from within which it IDs the High and Low of each period. Custom VWAPs are then auto-anchored to each High and Low, sparing the user significant time vs. constructing anchored VWAPs manually.
Designed to be utilized as a starting point for chart evaluation and time-saver rather than a perfectly tailored, unique series of custom VWAPs.
Start date and custom colorization is user-defined.
Use the link below to obtain access to this indicator and to learn more.
Vwap based Supply and Demand Heatmap_V1This is a Multi-time frame "Thermographic Vwap based heatmap" showing Highest volume Vwap supply and demand zones.
User has 3 inputs for time frames to choose from or layer. It comes preset with "Short" and "Mid" time frame enabled and user can choose to add an additional layer if they would like for longer time frame analysis. If ALL time frames are enabled, fewer levels will show overall due to the 500 map limit, But zones will become brighter, larger, and more "precise" as they overlap and seek out the highest volume concentration amongst all levels.
What is the map showing you?
The heat map goes through each user selected time frame and searches for the highest volume candle and plots a zone based of that candles Vwap and high. These zones act as dynamic support and resistance. Each zone will "Degrade" and disappear over time and show positive when price has broken, cleared and held above it. The shift in color however is not immediate in change, rather transitional, so as not to "Repaint" causing false sense of clearing a zone. All negative zones (Price below) are colored red. User can choose to change any of the maps color's if they would like.
Time frame MUST be larger than your current charts resolution.-
Example- If on a 3min chart, user would choose any time frame LARGER than 3 min to display a map from.
Time frames the zones work best on are 1,3,5,15 min, paired with maps such as "Daily, Weekly, 240min(4hr), 60min" etc for intraday scalping or trend style trading. If on a larger time frame, 60mi, 4hr, Daily, user would choose larger maps like Daily, Weekly, monthly only. User can choose to display all, or just one time frame's zone at a time if they would like. If on a smaller intraday chart, You can start with "Daily" map first, increase opacity if the map is to dark. Then add additional time frames up or down in time if you'd like so long as maps time frame is larger than the charts.
If on a 1, 3, or 5min chart, you can also try the 30,60, or 240min maps for finer granularity and "Scalping" support and resistance.
If you choose a set of time frames, and do not see maps interacting with current price, then cycle out to a higher chart time frame and maps that are one or two time frames higher than current chart resolution.
These maps are showing you where supply and demand are situated since they are looking for the "Highest Volume" candles in each time frame you choose-
The range cast from the highest volume launch candle have proven to be strong support or resistance. Think of "Trapped trader's" if viewing over head supply level's, these traders will sell into a push higher until cleared. Vice versa, if viewing a demand level below, think of a "Base", especially on higher time frames. An area of high volume participation, where buyer's have shown support, and launched a run from. When price cycles back to these zone's, one would expect support from them.
Each zone has a high or low, you will often see price discovery "Test" the high and low of each zone. Probing as they say in Auction market theory to see if there are still buyers, or seller's present. I will often wait for the probe of the high or low of a zone, then look to participate once they have wicked the area and cleared the inventory there and start to move to the opposing side of the zone I am looking to participate in. Think of "Value low, and Value high" in market or volume profile. Market maker's aim to test the participants "Max pain", and absorb stops in each direction. With that said the maps are not meant to be "Lines in the sand" or concrete level's, they are simply hot or cold zones where you could expect participation to happen, the "Hotter" or "Brighter" a zone is the higher the volume concentration is there at that price area. So act accordingly and use this as an addition to your analysis, not the ONLY thing you take into consideration.
With that said, Trading is RISKY, The creator of this code is NOT a licensed professional, and this tool, nor description is meant to be trading or financial advice! The user whom downloads this tool assumes ALL responsibility and liability associated with the financial risk that comes with the use of this analysis tool and trading in general. The creator of the code advises all users to do their due diligence and contact a licensed broker dealer before making ANY financial decision's based off of analysis done with this tool.
Any question's, Comments or concerns feel free to message via Tradingview platform.
Enjoy-
JMF

6X Bollinger Bands + MA + VWAP Dingue V56X Bollinger Bands Dingue V5 - This is the updated version for Pine Script 5
This indicator lets you quickly see all the intricacies of the Bollinger Bands; it simplifies its usage and maximizes the results.
Color-coded if the price is above or under the middle and based on direction.
Color-coded for expansion and contraction of the bands.
Option to plot ‘Squeezed bands’. It will show above the bands when they become smaller than the setting chosen. This helps identify build-up that might explode one way or another.
- 6x independent Bands can be adjusted as you want. It gives you possibilities in how you see variance, trends, support and resistance.
You can also select the MA type: SMA EMA WMA VWAM FRAMA … to explore new ways to see the Bollinger bands.
New in this version, you can now add a separate ‘Long MA’ that you can select independently from the Bands. Ex. Plot 200 SMA This helps in building a strategy with the trend and the bands.
Like the MA above, you can also plot 2 different VWAP independently from the Bands. This also helps knowing where the price stands compared to the bigger time frame VWAP’s price.
'Tool tips' explain other settings, if you have any questions, feel free to ask in the comments below.
Thank you for the feedback and check all my ‘Dingue’ indicators.
VWAP Bands - Event Based [LuxAlgo]This indicator returns VWAP bands with a degree of smoothness resetting based on various user-selected events. The bands are constructed using a VWAP based naive standard deviation.
The indicator can be anchored or start from the first bar and can be used as trailing support/resistance, in a moving average crossover system, or as source for external indicators.
Settings
Start: VWAP anchor point
Start At First Bar: Display the VWAP from the first bar instead of a specified anchor point
VWAP
Length: Controls certain characteristics of the user-selected event
Mult: Multiplicative factor for the VWAP standard deviation
Source: Price source of the indicator
Event
Event: Determines the event resetting the degree of smoothness of the VWAP
External Cross/Event: Input source used for external crosses/events
Further details about the available events are given below.
Details
Various event conditions are available to the users. When the selected event occurs, the VWAP equals the current closing price.
By default, the event is periodic, that is the VWAP resets periodically, with a period determined by the Length setting.
The Higher High event resets the VWAP when a new higher high occurs.
The Lower Low event resets the VWAP when a new lower low occurs.
The Trend Change event is similar however resets the VWAP only once a higher high or lower low occurs. Higher highs and lower lows are given by Donchian channels with a period determined by the Length setting.
The Start event reset the VWAP at the selected anchor point (or first bar if the "Start At First Bar" setting is selected). This can be useful if one only needs a regular anchored VWAP band indicator.
The External Cross event resets the VWAP when the Source price crosses the series selected in the External Cross/Event setting. In the image above the VWAP resets when the price crosses the volatility stop indicator.
The External Event resets the indicator when a series selected in the External Cross/Event setting is not equal to 0. This allows using a custom event in order to reset the VWAP. In the above example the VWAP is reset during a new session due to the External Session indicator.
VWAP Multiple [Huntersull]This is a VWAP/Price multiple analysis, in the same vein as something like the Mayer multiple.
It finds the VWAP of price and volume starting at the bar you choose when initiating the script (You can also drag the starting point line on the chart to change it later), and calculates the running VWAP total for every following bar until the current bar.
It then takes the hlc3 of price for each bar and divides it by the VWAP value of that bar, giving a multiple over VWAP price.
This is then charted with your choice of an SMA, EMA, or WMA using VWAP as the source, and a default length of 200, which is also modifiable.
When VWAP is over the moving average, it is filled green. When VWAP is below the moving average, it is filled red.
--------------------------------------------
This is not meant to be a trading indicator, but a tool for general bull/bear market and trend analysis. Use at your own risk.

NEXT VWAP SlopeOverview:
This customizable oscillator tracks slope of the Volume-Weighted Average Price ( VWAP ) line, positive and negative, over a user-specified run (bar distance). It is highly responsive, far more so than VWAP alone, making it suitable for issuing long and short signals (especially around 0 crossovers) as well as exit signals at positive and negative extremes (corresponding to price-volume momentum exhaustion).
NASDAQ 100 Futures ( CME_MINI:NQ1! ) 1-minute trend following
The example below shows a NEXT VWAP Slope 0-crossover strategy, issuing long signals when the VWAP Slope line crosses over 0 and short when it crosses under it. You will need the NEXT Strategy Visualizer (free) to plot NEXT VWAP Slope's signals.
NEXT VWAP Slope is highly customizable, allowing you to change the length of the run (for smoother slopes), as well as the midline level - in the above example it is 0. The latter is useful if you want to introduce a bias into your strategies: long, if negative, short, if positive.
Input Parameters:
There are 2 groups of input.
Slope Settings
Slope Run - controls the length of time (in bars) for slope calculation with higher values yielding a smoother, more filtered, but less responsive curve
Midline - the NEXT VWAP Slope level above which market is considered long, below short; default is 0
Upper Limit - the NEXT VWAP Slope level above which market is considered overbought; default is 0 (off)
Lower Limit - the NEXT VWAP Slope level under which market is considered oversold; default is 0 (off)
VWAP Settings
Anchor Period - controls the origin of VWAP calculations, start of session being the default.
Source - data used for calculating the VWAP, typically HLC /3, but can be used with other price formats and data sources as well.
Offset - shifting of the VWAP line forward (+) or backward (-).
Here is how to set NEXT VWAP Slope crossing 0 alerts: open a chart, attach NEXT VWAP Slope, and right-click on chart -> Add Alert. Condition: NEXT VWAP Slope >> VWAP >> Crossing >> Value >> 0 >> Once Per Bar Close.

+ Time Weighted Average PriceThis is basically NeoButane's script (which should be more popular than it is) with a few additions, those being primarily plotted lines of the closing price of the previous TWAP, however I've also added the optionality of plotting a second TWAP of say, maybe a different resolution if you are so inclined. Also, you may plot shapes across the top or bottom of your chart color based on if current price is above or below the previous closing price of the TWAP, in case you might want to clean the chart up a bit and not plot the actual closing price lines.
But what is TWAP, exactly, you might be saying to yourself. If you're familiar with VWAP then you've probably a pretty good idea of what this is and how it works. TWAP is a calculation that defines the weighted average price over a specific time period. Traders use TWAP as a trading strategy, or more specifically, an execution strategy, to place large orders without excessively impacting the market price. They break down the large orders into several sets of small orders priced near TWAP. Basically it's VWAP but without the volume element, and most traders will likely use it in a similar fashion as they might use VWAP, and that is like a moving average--dynamic support and resistance.
I like to think of it as displaying a price range over a specified time period (such as a month or a week). This is why I think the closes of the previous period or two are so important. Losing the previous closing price or regaining it can often give you an inclination as to whether at least some of the next period (the one you're currently in) may be bearish or bullish.
Above is a more zoomed out view of ADA/USD
And here's the same image with just the closing price for the time period plotted.
Enjoy!
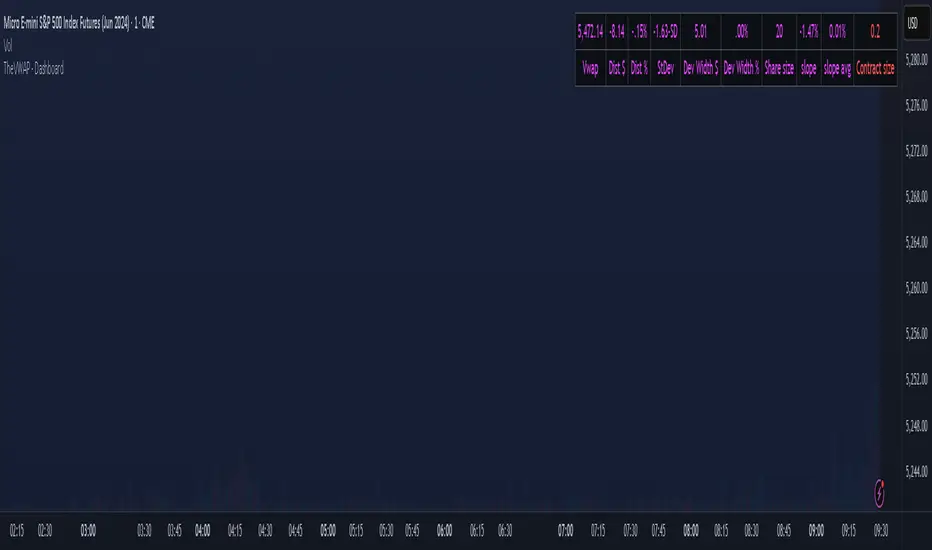
TheVWAP - DashboardJust as the name implies, Dashboard contains several useful VWAP metrics like price in relation to VWAP (dollars, percent, and StDev) as well as automatic viable position sizing estimation. Each metric can be separately hidden according to preference and the position size calculator is customizable to fit your particular parameters of risk and reward.
Appearing in the upper right corner of the chart by default, Dashboard allows traders to quickly assess a chart’s specific volatility in the context of — and its position relative to — the day's volume-weighted average price.
Use the link below to obtain access to this indicator and to learn more.
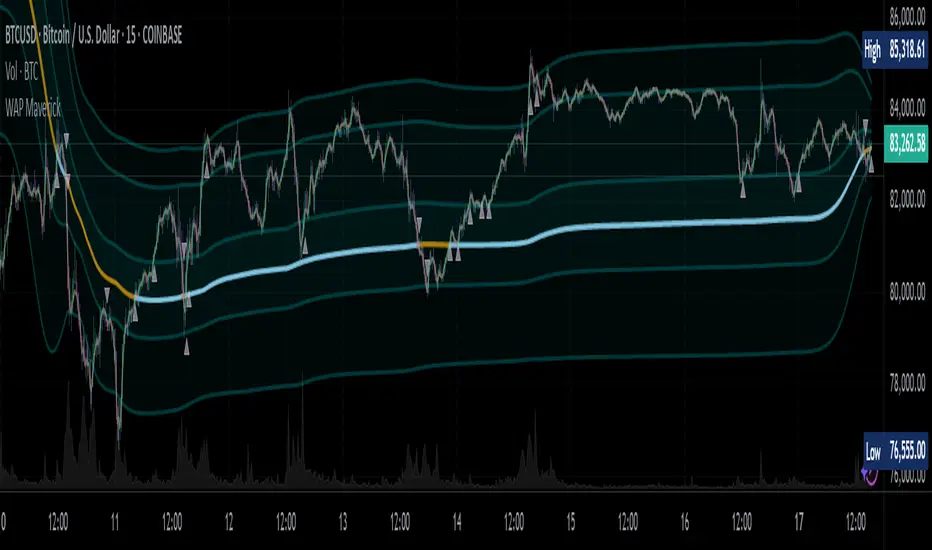
Koalafied VWAP D/W/M/Q/Y Volume Weighted Average Price (VWAP) for multiple periods with Standard Deviation band selection - Daily, Weekly, Monthly, Quarterly, Yearly

Central Pivot Ranges (CPR) & 3 x VWAP & BarcolorsThis Script Combines daily, weekly and monthly VWAP (Volume Weighted Average Price) with a intraday, daily, weekly and monthly CPR (Central Pivot Range) - which is considered by some traders as the bread and butter of the market for a reason. A combination of Multiple CPRs and VWAPs from different timeframes can provide you with interesting confluences that can give you more confidence in performing your trades.
CPR Features:
- The option to look at current or developing CPRs.
- A resolution selector for all 4 CPRs
- Options to hide and show Tops, Bottoms and Pivots separately
- Various Styling options
- Alerts
VWAP Features:
- 3 x preset VWAPs set to daily, weekly and monthly
- VWAP Lines from the daily O&C or H&L
- Previous VWAP for S/R
- Line Styling options
General Features:
- Barcolors by pivots crossed or daily, weekly and monthly VWAP.
- Barcolors by daily VWAP additionally contain an O and C check instead of just taking the price above or below the VWAP into consideration.

IDEAL BB with MA (With Alerts)It gives well combination of Moving average and Bollinger bands with signals

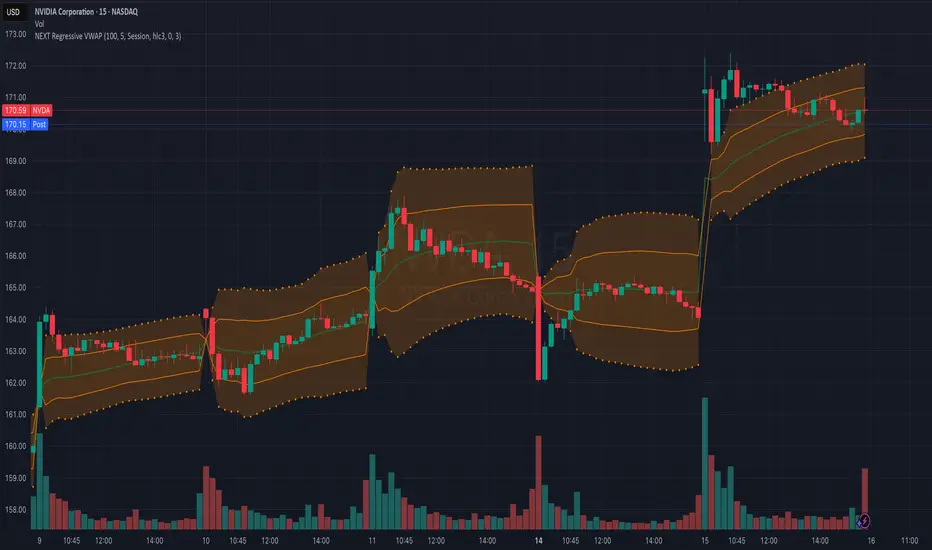
NEXT Regressive VWAPOverview:
This version of the Volume-Weighted Average Price (VWAP) indicator features an extended algorithm, which, in addition to volume and price, also incorporates regression analysis. The result is a more responsive, often leading VWAP slope with a degree of statistical predictability built in. Just like with the original VWAP, NEXT Regressive VWAP offers two optional Standard Deviation bands that parallel it. These can be set to any deviation level, with the default being 1 and -1, indicating one standard deviation above and one below Regressive VWAP, respectively.
Below is a screenshot comparing NEXT Regressive VWAP (green) to the original VWAP (blue) on CME_MINI:ES1! M3 chart.
Application and Strategy Ideas:
Price above NEXT Regressive VWAP is interpreted to have a bullish bias, and below, bearish. You can use TradingView's native Set Alert functionality to be notified, in real-time, when price crosses Regressive VWAP, and/or any of its standard deviation bands. Another popular "probability play" strategy is to scalp price when it crosses under the upper band (short) and crosses over the lower band (long). The screenshot below visualizes such a strategy on NASDAQ:QQQ M1 chart:
Input Parameters:
There are 3 groups of input.
Regression Settings
Length - controls the length of time (in bars) for regression analysis with higher values yielding smoother, more responsive values.
Regression Weighting - controls the degree of regression analysis incorporated into VWAP, with 5 being average, 0-4 less, 6-10 more. The higher the value, the more responsive the Regressive VWAP curve.
VWAP Settings
Anchor Period - controls the origin of VWAP calculations, start of session being the default.
Source - data used for calculating the VWAP, typically HLC/3, but can be used with other price formats and data sources as well.
Offset - shifting of the VWAP line forward (+) or backward (-).
Standard Deviation Bands Settings
Calculate Bands - checking this will add 2 bands, each equidistant (by the amount of Multiplier) from the NEXT Regressive VWAP line.
Bands Multiplier - standard deviation multiplier, with 1 being the default
Signals and Alerts:
Here is how to set price (close) crossing NEXT Regressive VWAP alerts: open a chart, attach NEXT Regressive VWAP, and right-click on chart -> Add Alert. Condition: Symbol e.g. ES (close) >> Crossing >> Regressive VWAP >> VWAP >> Once Per Bar Close.
Anchored VWAP ClickIt calculates AVWAP set from a mouse click on a chart instead of having to edit a popup box, manually transferring date and time from the chart.
It's the Oct 2021 sample script from Tradingview to demonstrate their new chart interactive capabilities of Pine script.
www.tradingview.com
I take no credit for this, just noticed it wasn't in the Public Library.
This ability to accept OnMouse positional data from the chart, into an indicator has been needed in TV for a long time.
Glad to see they continue to grow the capabilities.

Anchored VWAP Hand-OffBrian Shannon's "VWAP hand off" strategy, Has been my "go to" for some time now. Version 5 makes this much easier, with drag and drop placement.
When price taps the base anchored VWAP, a second VWAP is plotted at that point. When price taps the second, a third is plotted, and so on.
Each consecutive VWAP can be used to identify trend and future pivot points as trend continues.
IF the VWAPS look messy, price action is choppy and a trend hasnt yet started.