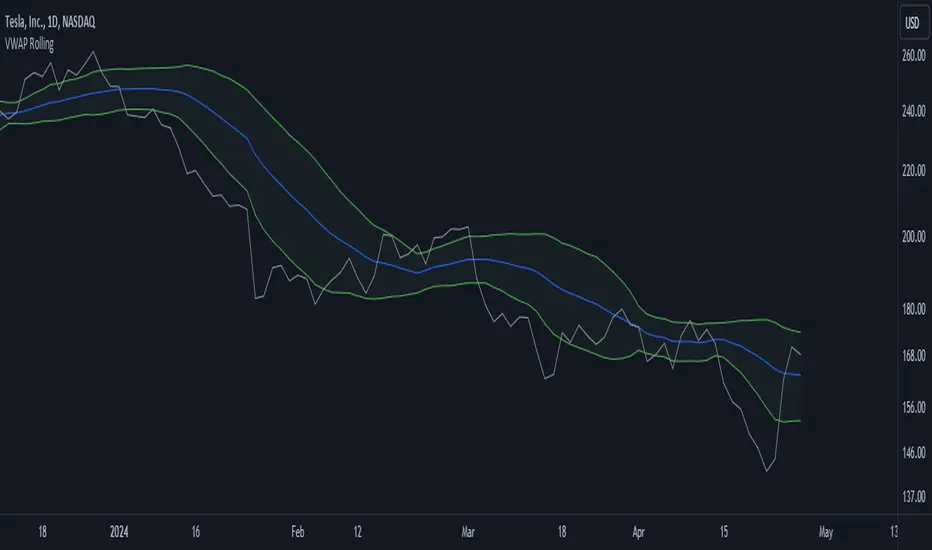
VWAP RollingThis indicator, referred to here as "VWAP Rolling," is a technical tool designed to provide insight into the average price at which an asset has traded over a specified rolling period, along with bands that can indicate potential overbought or oversold conditions based on standard deviations from this rolling VWAP.
Purpose and Utility:
The indicator's primary purpose is to track the volume-weighted average price (VWAP) over a specified period, typically 20 bars in this script. The VWAP Rolling is particularly useful in assessing the average price level at which a security has been traded over the recent history, incorporating both price and volume data. This can help traders understand the prevailing market price in relation to trading volume.
Advantages:
1. Dynamic Average: Unlike fixed VWAP indicators that calculate over a specific session, the rolling VWAP adapts to recent price and volume changes, offering a more responsive and dynamic average.
2. Volume Sensitivity: By weighting prices by volume, the rolling VWAP gives more importance to periods with higher trading activity, providing a clearer picture of where significant trading has occurred.
3. Standard Deviation Bands: The inclusion of standard deviation bands (configurable as 1x and 2x deviations in this script) around the rolling VWAP adds a layer of analytical depth. These bands can serve as potential areas of support and resistance, highlighting deviations from the mean price.
Singularization and Interpretation:
The VWAP Rolling indicator is singularized by its ability to adapt to changing market conditions, offering a dynamic representation of the average price level influenced by volume. To use and interpret this indicator effectively:
• Rolling VWAP Line: The main line represents the rolling VWAP. When this line trends upwards, it suggests that recent trading has been occurring at higher prices weighted by volume, indicating potential bullish sentiment. Conversely, a downtrend in the rolling VWAP may indicate bearish sentiment.
• Standard Deviation Bands: The upper and lower bands (configurable as 1x and 2x standard deviations from the rolling VWAP) are used to identify potential overbought or oversold conditions. A price crossing above the upper band may indicate overbought conditions, signaling a potential reversal or correction downwards. Conversely, a price crossing below the lower band may suggest oversold conditions, potentially signaling a bounce or reversal upwards.
• Band Interaction: Watch for interactions between price and these bands. Repeated touches or breaches of the bands can provide clues about the strength of the prevailing trend or potential reversals.
Interpretative Insights:
• Trend Confirmation: The direction of the rolling VWAP can confirm or contradict the prevailing price trend. If the price is above the rolling VWAP and the VWAP is rising, it suggests a strong bullish sentiment. Conversely, a falling rolling VWAP with prices below might indicate a bearish trend.
• ean Reversion Signals: Extreme moves beyond the standard deviation bands may signal potential mean reversion. Traders can look for price to revert back towards the rolling VWAP after such deviations.
In summary, the VWAP Rolling indicator offers traders a flexible tool to gauge average price levels and potential deviations, incorporating both price and volume dynamics. Its adaptability and standard deviation bands provide valuable insights into market sentiment and potential trading opportunities.
Volume Weighted Average Price (VWAP)
RN3 Ichimoku PVSRA Scalper IndicatorThis indicator will place long (buy) and short (sell) orders using the Ichimoku Tenkan Kijun Cross strategy. When in a trade position, it will create take profit levels using Fibonacci against the highest high or lowest low of the past 2 days. You can define your own level and set your own stop loss just in case.
Senkou Span will act as your main bias.
if the price under the cloud so the bias will be bearish. You may want to focus on selling(short) on this direction.
if the price above the cloud so bias will be bullish, You may want to focus on buying(long) on this direction.
This is for scalping, but it possible to do swing.
Suggested Symbols : Forex / Crypto / Commodities
Timeframe for Entry : Less than 1D TF
Additional controls include:
PVSRA Candle
M Pivot
VWAP
B1: Yesterday High B2: Yesterday Low
C1: Today High C2: Today Low.
Here's the way you can utilize the script.
First look at the Yesterday high, and Yesteday Low.
You need to consider that would be the symbols can travel into.
If today high has broke yesteray high, there's possibly the price will can keep higher and will create new high. Likewise if today lowest broke yesterday low, there's possibly the price can keep dropping and create new low.
VWAP : You can use this to determine if the price is fair or not, the more it's trading away away the vwap this will determine if it's overbought, or oversold.
PVSRA :
using 10 Periods, it's determine the volume.
Blue(Bullish) and Pink(Bearish) the 150% more Volume from previous bar.
Green(Bullish) and Red(Bearish) the 200% more Volume from previous bar.

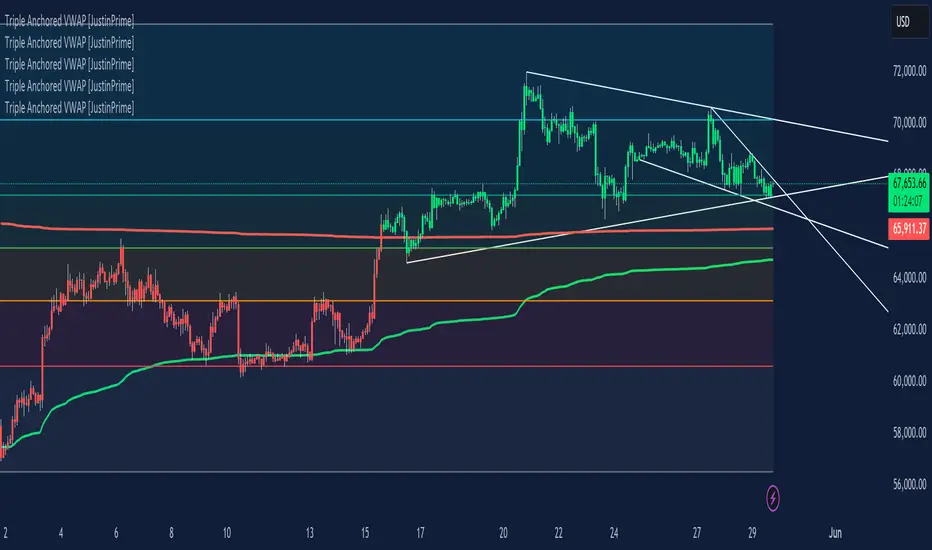
Triple Anchored Volume Weighted Average Price [JustinPrime]This indicator provides three separate Volume Weighted Average Price (VWAP) calculations, each anchored from different key points on the chart:
High Anchored VWAP: Resets from the highest price reached since the start date.
Low Anchored VWAP: Resets from the lowest price since the start date.
Start Date VWAP: Calculated from the trading data beginning at the user-defined start date.
Features:
Selectable Timeframe: Choose from timeframes like 1 minute, 5 minutes, 15 minutes, 1 hour, daily, and weekly.
Custom Start Date: Set a specific start date for the VWAP calculations.
Source Data: Uses high, low, and close prices (HLC3) for calculations.
How to Use:
Adjust the start date to focus on significant market periods or events.
Differentiate each VWAP with unique colors for clarity.
Relative Average Extrapolation [ChartPrime]Relative Average Extrapolation (ChartPrime) is a new take on session averages, like the famous vwap . This indicator leverages patterns in the market by leveraging average-at-time to get a footprint of the average market conditions for the current time. This allows for a great estimate of market conditions throughout the day allowing for predictive forecasting. If we know what the market conditions are at a given time of day we can use this information to make assumptions about future market conditions. This is what allows us to estimate an entire session with fair accuracy. This indicator works on any intra-day time frame and will not work on time frames less than a minute, or time frames that are a day or greater in length. A unique aspect of this indicator is that it allows for analysis of pre and post market sessions independently from regular hours. This results in a cleaner and more usable vwap for each individual session. One drawback of this is that the indicator utilizes an average for the length of a session. Because of this, some after hour sessions will only have a partial estimation. The average and deviation bands will work past the point where it has been extrapolated to in this instance however. On low time frames due to the limited number of data points, the indicator can appear noisy.
Generally crypto doesn't have a consistent footprint making this indicator less suitable in crypto markets. Because of this we have implemented other weighting schemes to allow for more flexibility in the number of use cases for this indicator. Besides volume weighting we have also included time, volatility, and linear (none) weighting. Using any one of these weighting schemes will transform the vwap into a wma, volatility adjusted ma, or a simple moving average. All of the style are still session period and will become longer as the session progresses.
Relative Average Extrapolation (ChartPrime) works by storing data for each time step throughout the day by utilizing a custom indexing system. It takes the a key , ie hour/minute, and transforms it into an array index to stor the current data point in its unique array. From there we can take the current time of day and advance it by one step to retrieve the data point for the next bar index. This allows us to utilize the footprint the extrapolate into the future. We use the relative rate of change for the average, the relative deviation, and relative price position to extrapolate from the current point to the end of the session. This process is fast and effective and possibly easier to use than the built in map feature.
If you have used vwap before you should be familiar with the general settings for this indicator. We have made a point to make it as intuitive for anyone who is already used to using the standard vwap. You can pick the source for the average and adjust/enable the deviation bands multipliers in the settings group. The average period is what determines the number of days to use for the average-at-time. When it is set to 0 it will use all available data. Under "Extrapolation" you will find the settings for the estimation. "Direction Sensitivity" adjusts how sensitive the indicator is to the direction of the vwap. A higher number will allow it to change directions faster, where a lower number will make it more stable throughout the session. Under the "Style" section you will find all of the color and style adjustments to customize the appearance of this indicator.
Relative Average Extrapolation (ChartPrime) is an advanced and customizable session average indicator with the ability to estimate the direction and volatility of intra-day sessions. We hope you will find this script fascinating and useful in your trading and decision making. With its unique take on session weighting and forecasting, we believe it will be a secret weapon for traders for years to come.
Enjoy

VCBBDOVWAPSMA By Anil ChawraHow Users Can Make Profit Using This Script:
1. Volume Representation : Each candle on the chart represents a specific time period (e.g., 1 minute, 1 hour, 1 day) and includes information about both price movement and trading volume during that period.
2. Candlestick Anatomy : A volume candle has the same components as a regular candlestick: the body (which represents the opening and closing prices) and the wicks or shadows (which indicate the highest and lowest prices reached during the period).
3. Volume Bars : Instead of just the candlestick itself, volume candles also include a bar or histogram representing the trading volume during that period. The height or length of the volume bar indicates the amount of trading activity.
4. Interpreting Volume : High volume candles typically indicate increased market interest or activity during that period. This could be due to significant buying or selling pressure.
5. Confirmation : Traders often look for confirmation from other technical indicators or price action to validate the significance of a high volume candle. For example, a high volume candle breaking through a key support or resistance level may signal a strong market move.
6. Trend Strength : Volume candles can provide insights into the strength of a trend. A series of high volume candles in the direction of the trend suggests strong momentum, while decreasing volume may indicate weakening momentum or a potential reversal.
7. Volume Patterns : Traders also analyze volume patterns, such as volume spikes or divergences, to identify potential trading opportunities or reversals.
8. Combination with Price Action: Volume analysis is often used in conjunction with price action analysis and other technical indicators to make more informed trading decisions.
9. Confirmation and Validation: It's important to confirm the significance of volume candles with other indicators or price action signals to avoid false signals.
10. Risk Management : As with any trading strategy, proper risk management is crucial when using volume candles to make trading decisions. Set stop-loss orders and adhere to risk management principles to protect your capital.
How to script works :
1.Identify High Volume Candles: Look for candles with significantly higher volume compared to the surrounding candles. These can indicate increased market interest or activity.
2.Wait for Confirmation: Once you identify a high volume candle, wait for confirmation from subsequent candles to ensure the momentum is sustained.
3.Enter the Trade: After confirmation, consider entering a trade in the direction indicated by the high volume candle. For example, if it's a bullish candle, consider buying.
4.Set Stop Loss: Always set a stop loss to limit potential losses in case the trade goes against you.
5.Take Profit: Set a target for taking profits. This could be based on technical analysis, such as a resistance level or a certain percentage gain.
6.Monitor Volume: Continuously monitor volume to gauge the strength of the trend. Decreasing volume may signal weakening momentum and could be a sign to exit the trade.
7.Risk Management: Manage risk carefully by adjusting position sizes according to your risk tolerance and the size of your trading account.
8.Review and Adapt: Regularly review your trades and adapt your strategy based on what's working and what's not.
Remember, no trading strategy guarantees profits, and it's essential to practice proper risk management and have realistic expectations. Additionally, consider combining volume analysis with other technical indicators for a more comprehensive approach to trading.
**How Users Can Make Profit Using This Script:
**
DAYS OPEN LINE:
1.Purpose: Publishing a "Days Open Line" indicator serves to inform customers about the operational schedule of a business or service.
2.Visibility: It ensures that the information regarding the days of operation is easily accessible to current and potential customers.
3.Transparency: By making the operational schedule public, businesses demonstrate transparency and reliability to their customers.
4.Accessibility: The indicator should be published on various platforms such as the business website, social media channels, and physical locations to ensure accessibility to a wide audience.
5.Clarity: The information should be presented in a clear and concise manner, specifying the days of the week the business is open and the corresponding operating hours.
6.Updates: It's important to regularly update the "Days Open Line" indicator to reflect any changes in the operational schedule, such as holidays or special events.
7.Customer Convenience: Providing this information helps customers plan their visits accordingly, reducing inconvenience and frustration due to unexpected closures.
8.Expectation Management: Setting clear expectations regarding the business hours helps manage customer expectations and reduces the likelihood of disappointment or complaints.
9.Customer Service: Publishing the "Days Open Line" indicator demonstrates a commitment to customer service by ensuring that customers have the information they need to engage with the business.
10.Brand Image: Consistently .maintaining and updating the indicator contributes to a positive brand image, as it reflects professionalism, reliability, and a customer-centric approach.
SMA CROSS:
1.This indicator generates buy and sell signals based on the crossover of two Simple Moving Averages (SMA): a shorter 3-day SMA and a longer 8-day SMA.
When the 3-day SMA crosses above the 8-day SMA, it generates a buy signal indicating a potential upward trend.
Conversely, when the 3-day SMA crosses below the 8-day SMA, it generates a sell signal indicating a potential downward trend.
Signal Interpretation:
2.Buy Signal: Generated when the 3-day SMA crosses above the 8-day SMA.
Sell Signal: Generated when the 3-day SMA crosses below the 8-day SMA.
Usage:
3.Traders can use this indicator to identify potential entry and exit points in the market.
Buy signals suggest a bullish trend, indicating a favorable time to enter or hold a long position.
4.Sell signals suggest a bearish trend, indicating a potential opportunity to exit or take a short position.
Parameters:
5.Periods: 3-day SMA and 8-day SMA.
Price: Closing price is commonly used, but users can choose other price types (open, high, low) for calculation.
Confirmation:
6.It's recommended to use additional technical analysis tools or confirmatory indicators to validate signals and minimize false signals.
Risk Management:
7.Implement proper risk management strategies, such as setting stop-loss orders, to mitigate losses in case of adverse price movements.
Backtesting:
8.Before using the indicator in live trading, conduct thorough backtesting to evaluate its effectiveness under various market conditions.
Considerations:
9.While SMA crossovers can provide valuable insights, they may generate false signals during ranging or choppy markets.
Combine this indicator with other technical analysis techniques for comprehensive market analysis.
Continuous Optimization:
10.Monitor the performance of the indicator and adjust parameters or incorporate additional filters as needed to enhance accuracy over time.
BOLLINGER BAND:
1.Definition: A Bollinger Band indicator is a technical analysis tool that consists of a centerline (typically a moving average) and two bands plotted above and below it. These bands represent volatility around the moving average.
2.Purpose: Publishing a Bollinger Band indicator serves to provide traders and investors with insights into the volatility and potential price movements of a financial instrument.
3.Visualization: The indicator is typically displayed on price charts, allowing users to visualize the relationship between price movements and volatility levels.
4.Interpretation: Traders use Bollinger Bands to identify overbought and oversold conditions, potential trend reversals, and volatility breakouts.
5.Components: The indicator consists of three main components: the upper band, lower band, and centerline (usually a simple moving average). These components are calculated based on standard deviations from the moving average.
6.Parameters: Traders can adjust the parameters of the Bollinger Bands, such as the period length and standard deviation multiplier, to customize the indicator based on their trading strategy and preferences.
7.Signals: Bollinger Bands generate signals when prices move outside the bands, indicating potential trading opportunities. For example, a price breakout above the upper band may signal a bullish trend continuation, while a breakout below the lower band may indicate a bearish trend continuation.
8.Confirmation: Traders often use other technical indicators or price action analysis to confirm signals generated by Bollinger Bands, enhancing the reliability of their trading decisions.
9.Education: Publishing Bollinger Band indicators can serve an educational purpose, helping traders learn about technical analysis concepts and how to apply them in real-world trading scenarios.
10.Risk Management: Traders should exercise proper risk management when using Bollinger Bands, as false signals and market volatility can lead to losses. Publishing educational content alongside the indicator can help users understand the importance of risk management in trading.
VWAP:
1.Calculation: VWAP is calculated by dividing the cumulative sum of price times volume traded for every transaction (price * volume) by the total volume traded.
2.Time Frame: VWAP is typically calculated for a specific time frame, such as a trading day or a session.
3.Intraday Trading: It's commonly used by intraday traders to assess the fair value of a security and to determine if the current price is above or below the average price traded during the day.
4.Execution: Institutional traders often use VWAP as a benchmark for executing large orders, aiming to buy at prices below VWAP and sell at prices above VWAP.
5.Benchmark: It serves as a benchmark for traders to evaluate their trading performance. Trades executed below VWAP are considered good buys, while those above are considered less favorable.
6.Sensitivity: VWAP is more sensitive to price and volume changes during periods of high trading activity and less sensitive during periods of low trading activity.
7.Day's End: VWAP resets at the end of each trading day, providing a new reference point for the following trading session.
8.Volume Weighting: The weighting by volume means that prices with higher trading volumes have a greater impact on VWAP than those with lower volumes.
9.Popular with Algorithmic Traders: Algorithmic trading systems often incorporate VWAP strategies to execute trades efficiently and minimize market impact.
10.Limitations: While VWAP is a useful indicator, it's not foolproof. It may lag behind rapidly changing market conditions and may not be suitable for all trading strategies or market conditions. Additionally, it's more effective in liquid markets where there is significant trading volume.

Day Open Line + SMA 8/3 Crossover + BollingerHow Users Can Make Profit Using This Script:
DAYS OPEN LINE:
1.Purpose: Publishing a "Days Open Line" indicator serves to inform customers about the operational schedule of a business or service.
2.Visibility: It ensures that the information regarding the days of operation is easily accessible to current and potential customers.
3.Transparency: By making the operational schedule public, businesses demonstrate transparency and reliability to their customers.
4.Accessibility: The indicator should be published on various platforms such as the business website, social media channels, and physical locations to ensure accessibility to a wide audience.
5.Clarity: The information should be presented in a clear and concise manner, specifying the days of the week the business is open and the corresponding operating hours.
6.Updates: It's important to regularly update the "Days Open Line" indicator to reflect any changes in the operational schedule, such as holidays or special events.
7.Customer Convenience: Providing this information helps customers plan their visits accordingly, reducing inconvenience and frustration due to unexpected closures.
8.Expectation Management: Setting clear expectations regarding the business hours helps manage customer expectations and reduces the likelihood of disappointment or complaints.
9.Customer Service: Publishing the "Days Open Line" indicator demonstrates a commitment to customer service by ensuring that customers have the information they need to engage with the business.
10.Brand Image: Consistently .maintaining and updating the indicator contributes to a positive brand image, as it reflects professionalism, reliability, and a customer-centric approach.
SMA CROSS:
1.This indicator generates buy and sell signals based on the crossover of two Simple Moving Averages (SMA): a shorter 3-day SMA and a longer 8-day SMA.
When the 3-day SMA crosses above the 8-day SMA, it generates a buy signal indicating a potential upward trend.
Conversely, when the 3-day SMA crosses below the 8-day SMA, it generates a sell signal indicating a potential downward trend.
Signal Interpretation:
2.Buy Signal: Generated when the 3-day SMA crosses above the 8-day SMA.
Sell Signal: Generated when the 3-day SMA crosses below the 8-day SMA.
Usage:
3.Traders can use this indicator to identify potential entry and exit points in the market.
Buy signals suggest a bullish trend, indicating a favorable time to enter or hold a long position.
4.Sell signals suggest a bearish trend, indicating a potential opportunity to exit or take a short position.
Parameters:
5.Periods: 3-day SMA and 8-day SMA.
Price: Closing price is commonly used, but users can choose other price types (open, high, low) for calculation.
Confirmation:
6.It's recommended to use additional technical analysis tools or confirmatory indicators to validate signals and minimize false signals.
Risk Management:
7.Implement proper risk management strategies, such as setting stop-loss orders, to mitigate losses in case of adverse price movements.
Backtesting:
8.Before using the indicator in live trading, conduct thorough backtesting to evaluate its effectiveness under various market conditions.
Considerations:
9.While SMA crossovers can provide valuable insights, they may generate false signals during ranging or choppy markets.
Combine this indicator with other technical analysis techniques for comprehensive market analysis.
Continuous Optimization:
10.Monitor the performance of the indicator and adjust parameters or incorporate additional filters as needed to enhance accuracy over time.
BOLLINGER BAND:
1.Definition: A Bollinger Band indicator is a technical analysis tool that consists of a centerline (typically a moving average) and two bands plotted above and below it. These bands represent volatility around the moving average.
2.Purpose: Publishing a Bollinger Band indicator serves to provide traders and investors with insights into the volatility and potential price movements of a financial instrument.
3.Visualization: The indicator is typically displayed on price charts, allowing users to visualize the relationship between price movements and volatility levels.
4.Interpretation: Traders use Bollinger Bands to identify overbought and oversold conditions, potential trend reversals, and volatility breakouts.
5.Components: The indicator consists of three main components: the upper band, lower band, and centerline (usually a simple moving average). These components are calculated based on standard deviations from the moving average.
6.Parameters: Traders can adjust the parameters of the Bollinger Bands, such as the period length and standard deviation multiplier, to customize the indicator based on their trading strategy and preferences.
7.Signals: Bollinger Bands generate signals when prices move outside the bands, indicating potential trading opportunities. For example, a price breakout above the upper band may signal a bullish trend continuation, while a breakout below the lower band may indicate a bearish trend continuation.
8.Confirmation: Traders often use other technical indicators or price action analysis to confirm signals generated by Bollinger Bands, enhancing the reliability of their trading decisions.
9.Education: Publishing Bollinger Band indicators can serve an educational purpose, helping traders learn about technical analysis concepts and how to apply them in real-world trading scenarios.
10.Risk Management: Traders should exercise proper risk management when using Bollinger Bands, as false signals and market volatility can lead to losses. Publishing educational content alongside the indicator can help users understand the importance of risk management in trading.
VWAP:
1.Calculation: VWAP is calculated by dividing the cumulative sum of price times volume traded for every transaction (price * volume) by the total volume traded.
2.Time Frame: VWAP is typically calculated for a specific time frame, such as a trading day or a session.
3.Intraday Trading: It's commonly used by intraday traders to assess the fair value of a security and to determine if the current price is above or below the average price traded during the day.
4.Execution: Institutional traders often use VWAP as a benchmark for executing large orders, aiming to buy at prices below VWAP and sell at prices above VWAP.
5.Benchmark: It serves as a benchmark for traders to evaluate their trading performance. Trades executed below VWAP are considered good buys, while those above are considered less favorable.
6.Sensitivity: VWAP is more sensitive to price and volume changes during periods of high trading activity and less sensitive during periods of low trading activity.
7.Day's End: VWAP resets at the end of each trading day, providing a new reference point for the following trading session.
8.Volume Weighting: The weighting by volume means that prices with higher trading volumes have a greater impact on VWAP than those with lower volumes.
9.Popular with Algorithmic Traders: Algorithmic trading systems often incorporate VWAP strategies to execute trades efficiently and minimize market impact.
10.Limitations: While VWAP is a useful indicator, it's not foolproof. It may lag behind rapidly changing market conditions and may not be suitable for all trading strategies or market conditions. Additionally, it's more effective in liquid markets where there is significant trading volume.
How the Script Works:
1.Utilizes Day Open Line for accurate market entry points.
2.Identifies bullish trends with SMA 3 crossover SMA 8.
3.Signals potential sell opportunities with SMA 8 crossunder SMA 3.
4.Bollinger Bands indicate overbought and oversold conditions.
5.VWAP offers insights into average price levels weighted by volume.
6.Combination of indicators enhances trade confirmation.
7.Facilitates precise timing for buy and sell decisions.
8.Enables traders to capitalize on market volatility.
9.Empowers users to navigate dynamic market conditions.
10.Supports profitable trading strategies with comprehensive analysis.
11.It is known when the market is sideways.

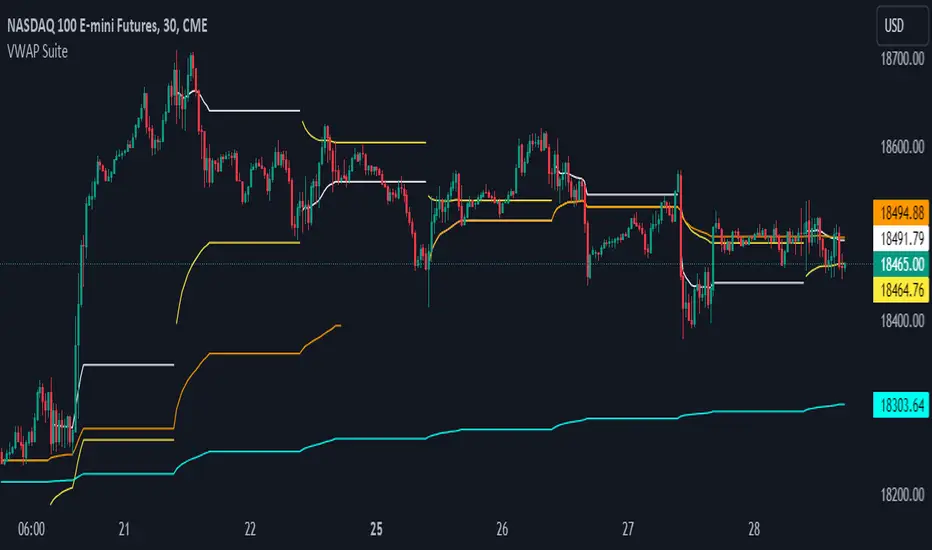
VWAP SuiteThis indicator automates the plotting of various timeframe based VWAP Values. This utilizes a different calculation method for the standard deviations bands compared to the native Tradingview AVWAP. While the Tradingview AVWAP indicator calculates the standard devation based on the VWAP variance, this indicator calculates the std dev based on the price sum variance (i.e. the variance of the hlc3, ohlc4, etc. values).
Current timeframes include:
- Daily VWAP with three user configurable standard deviation bands
- Multi-Day VWAP that allows you to plot 2-day to 5-day VWAP
- Weekly VWAP with three user configurable standard deviation bands
- Monthly VWAP with three user configurable standard deviation bands
Some unique aspects of this indicator is that it allows the user to calculate VWAP for only a specific session range if you are only interested in the VWAP when specific participants are active in the market. For example, the default session range only calculates VWAP for the New York RTH session (0930-1600).
If the user wants to compare how the session range chosen varies from the VWAP calculation with ETH you can select the 'Include Extended Trading Hours' check box which will ignore the session range input variable and simply calculate what is exactly on the chart without filtering.
You can also toggle whether the VWAP values show up in the price scale, status line, or both which can limit the amount of clutter that shows up on the chart based upon the user's preferences.
VWAP SpiderThe VWAP Spider indicator enhances the conventional Volume Weighted Average Price (VWAP) analysis by anchoring it to the first candle and incorporating an extensive series of standard deviation (SD) lines, extending up to +8 SDs with additional half-step increments. This configuration provides a more suitable set of lines for identifying support and resistance, distinguishing it from existing VWAP and SD indicators. Its design, featuring color gradients for fills and distinct labels for each line, aims to improve the utility and user experience.
Optimal Timeframes:
It is recommended for use on weekly or monthly resolutions to ensure all price and volume history is included.
Distinctive Features:
The indicator includes a more extensive array of SD lines than typically found in VWAP indicators, enhancing the depth of market analysis.
The visual presentation is optimized with color gradients and clear labeling, facilitating ease of use and integration into trading strategies.
Practical Use of the VWAP Spider:
SD Lines as Support and Resistance : Observe the interactions between the price and the SD lines closely. These can serve as dynamic support and resistance indicators, influencing trading decisions.
Analyzing Historical Price Action : Investigate how the price has historically interacted with the SD lines. Identify which lines have frequently acted as support and resistance in the past, as they will often continue to be revisited.
Strategic Application : Leverage insights from the interactions between price and SD lines to fine-tune entry and exit points. For example, a rebound from an SD line may suggest a strong entry point, while breaching an SD line could indicate a potential exit.
This indicator is freely available and open-source on TradingView for all. It is designed to help traders enhance their market analysis and strategic decision-making.

MultiWAPThe VWAP tracks the average price, giving weight to each candle based upon its' relative volume.
In other words, high-volume candles move the VWAP faster than low-volume candles.
On a good day, market maker:
-Buys the dip
-Pumps past resistance, causing bullish FOMO
-Sells into the bullish FOMO, causing bearish FOMO
-Buys the dip (rinse and repeat)
By default, MultiWAP begins at the first visible bar.
Range low/high - tracks the most recent high/low
Upper VWAP - tracks retail's average buy price (MM is selling)
Lower VWAP - tracks MM's average buy price (MM is buying)
If price closes below the lower VWAP or the range low, the lower VWAP and range low are reset.
If price closes above the upper VWAP or the range high, the upper VWAP and range high are reset.
Resets are indicated by the dots. Resetting either VWAP moves it close to last price, making it easy to breach again.
A down-trend that lasts many bars will produce a string of green dots. When the accumulation phase ends, price pulls away from the lower VWAP, so it stops resetting. The ABSENCE of green dots tells you that we're in the markup phase/up-trend.
An up-trend that lasts many bars will produce a string of red dots. When the distribution phase ends, price pulls away from the upper VWAP, so it stops resetting. The ABSENCE of red dots tells you that we're in the markdown phase/down-trend.
By default, the net result is two VWAP's that automatically anchor themselves to the most recent, significant, and visible, high and low.
Usage:
For any timeframe, I recommend starting zoomed way out. Find the last green dot and drop an "Anchored VWAP" there. Now, zoom in until that candle is no longer visible. Find the last green dot and drop an anchored VWAP there. Continue doing so until you notice the lower VWAP getting reset to basically the same place.
This works the same, in reverse, during down-trends.

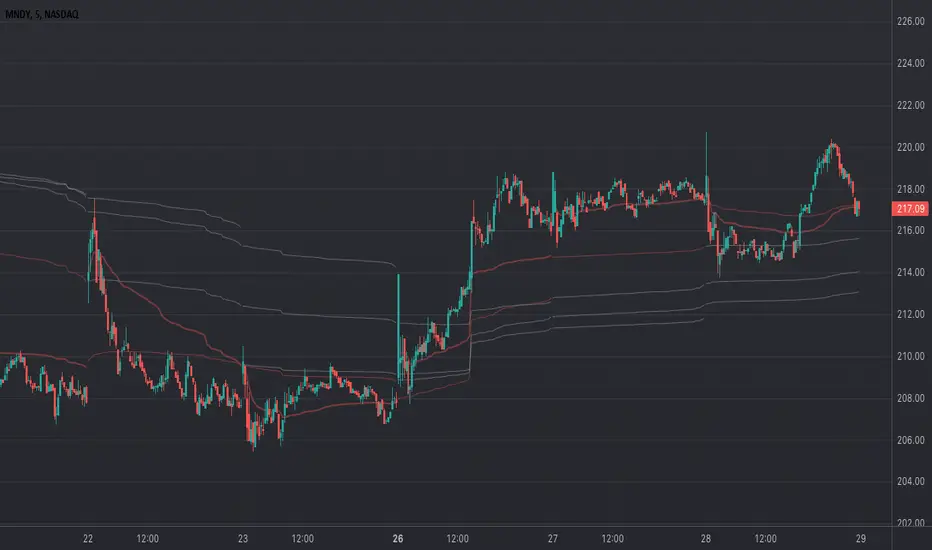
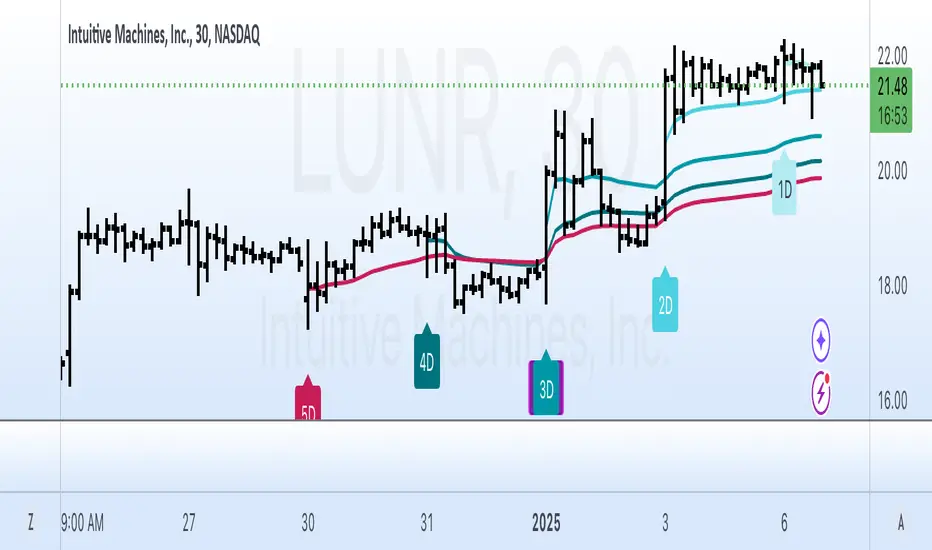
Multi-Day Rolling VWAP [Intraday]Ideas from Brian Shannon's book "Anchored VWAP"
The Multi-Day Rolling VWAP indicator for intraday timeframes allows you to track the Volume Weighted Average Price (VWAP) over multiple days, specifically for 1-day, 2-day, 3-day, 4-day, and 5-day periods. This indicator beyond the standard daily VWAP provides a broader perspective on price trends and market sentiment.
Features:
- Multi-day VWAPs: Analyze VWAP over several days to observe longer-term price movements.
- Customizable display: Choose which VWAP periods to display on the chart
- Colorize: Choose different colors for each VWAP to easily distinguish between periods.
- Adjustable settings: Change the line thickness and select the price source for VWAP calculations.
- Works with Replay Mode
- Works in any intraday timeframe on any asset with volume and price
Benefits:
- Trend identification: Compare current prices with multi-day rolling VWAPs to spot trends.
- Spot reversals: Look for potential price reversals or support when prices cross VWAP lines.
Weighted Average Volume Depth [QuantraSystems]Weighted Average Volume Depth
Introduction
The Weighted Average Volume Depth (𝓦𝓐𝓥𝓓) indicator is calibrated to provide extensive insights, calculated using volumetric price action and volume depth, and provides dynamic adjustments based upon historical volatility.
This indicator is a valuable asset for traders and investors, aiming to capture trends, measure dynamic volatility, and provide market reversion analysis in a systematic way.
Legend
Volumetric Top Cap: Plotted at y = 0, this line represents the probabilistic maximum value, or ‘cap’ for the signal line. It is colored using a binary color scheme, and indicates the dominant trend direction - green for an uptrend and purple for a downtrend.
Base Line: Calculated using a volume-weighted volatility measurement, this line is used as the benchmark to calculate momentum in the 𝓦𝓐𝓥𝓓 indicator.
Signal Line: The signal line represents the volume and volatility weighted measurements, and oscillates between the Base Line and Top Cap. Its position between these levels provides the depth of insights available in this script.
When the signal line is remaining in close proximity to the base line, this is indicative of a low volatility market environment. These periods are also reflected as muted bar coloring when the ‘Trend Intensity’ setting is enabled.
Conversely, when the signal line approaches, or even breaks above the Top Cap, this is characteristic of an unsustainable trending action - and probabilistically speaking, a reversion or consolation is likely to occur at these levels.
Highlighting: When this setting is enabled, background coloring is applied when the Signal Line breaks above the Top Cap. This highlights green as an oversold zone, and purple as an overbought zone.
Reversal Signals: When price begins to reverse from a zone of overextension, a signal is plotted when this reversion occurs from a high probability zone.
Circle - Shows a possible bullish reversal.
Cross - Shows a possible bearish reversal.
Case Study
In the above image, we showcase three distinct trades in short succession, showcasing the 𝓦𝓐𝓥𝓓’s speed and accuracy under the right conditions.
The first long trade was initiated upon receiving a bullish reversal signal. The trade was then closed after the price experienced a sharp upwards movement - and an overbought signal was indicated by the purple shading.
The second, short trade was entered on the next bar, after a bearish reversal signal was printed by the indicator (a white cross). Similarly, this trade was closed upon the oversold signal.
Once again, a reversal signal was indicated by the 𝓦𝓐𝓥𝓓 indicator. This time a bullish signal (a white circle), and hence a long position was opened. However, this trade was held until a negative trend confirmation (signaled by the Top Cap’s shift in color). This makes apparent the indicator’s flexible nature, and showcases the multiple signaling types available for traders to use.
Recommended Settings
The optimal settings for the 𝓦𝓐𝓥𝓓 indicator will vary upon the chosen asset’s average level volatility, as well as the timeframe it is applied to.
Due to increased volatility levels on lower timeframes, it is recommended to increase the 'Top Cap Multiplier' to take into account the increased frequency of false signals found in these trading environments. The same can be said when used on highly volatile assets - a trader will likely benefit from using a higher 'Top Cap Multiplier.'
On more price-stable assets, as well as any asset on higher timeframes, there is merit to tightening the length of the 'Top Cap Multiplier,' due to the slower nature of price action.
Methodology
The 𝓦𝓐𝓥𝓓 starts with calculating the volume weighted average price and the volume weighted variance - which is the expectation of the squared deviation of a variable from its mean, giving insights into the distribution of trading volume.
Using the volume weighted variance, a standard deviation value is calculated based on user input. This value acts as the ‘Volumetric Top Cap’ - seen in the 𝓦𝓐𝓥𝓓 indicator window as the zero line.
The signal line is calculated as the difference between the current price and the theoretical upper or lower VWAP deviation bands. This line acts as the trigger for identifying prevailing trends and high probability reversal points.
The base line serves as a reference point for historical momentum. It is calculated using an exponential moving average of the lowest signal line values over a defined lookback period. This baseline helps in assessing whether the current momentum is high or low relative to historical norms.
Notes
Bar coloring can be turned off - especially useful when stacking multiple indicators as recommended, or set to 'Trend Intensity,' or 'Binary Trend' (which reflects the top cap coloring).
It is always recommended to never rely on a single indicator - and instead build and test multiple strategies utilizing more than one indicator as confirmation.

Rolling Strategic AVWAPThe Rolling Strategic AVWAP gives you the ability to have the standard AVWAP indicators applied across all charts in all timeframes. There is no manual intervention necessary to keep all the standard VWAPs up to date. This indicator is written so that all weekends and trading holidays are taken into account so you never have any gaps or days where the indicator isn't working.
Standard rolling AVWAP indicators:
Daily
2-day
3-day
Week-to-Date
Month-to-Date
Year-to-Date
Additionally I have supplied several custom labeled AVWAP indicators that the user can adjust the date themselves
Custom Fixed AVWAP indicators:
Prior Week-to-Date
Prior Month-to-Date
Prior Year-to-Date
Fed rate decision
Inflation report
GDP report
Jobs report
3 more labeled Custom1-3
These custom locations will allow the user to anchor the VWAP to meaningful dates and times in the market. Often there are large moves due to global macro events that can give the trader an edge by referencing the VWAP to the date and time.
Labels and Display
There are options to turn on and off any of the AVWAPs, as well as turning on and off the display labels below the candles.
VWAP 8EMA Crossover Scalping IndicatorWhy?
Everybody, especially in Indian context, from 9:15 AM to 3:30 PM, wants to trade in BankNifty.
And even 15m is Too Big timeframe for The Great Indian Options buyers. Everyone knows how potentially BankNifty (& FinNifty on Tuesday and Sensex on Friday) can show dance within 15m.
So there always been an overarching longing among traders to have something in shorter timeframes. And this 5m timeframe, looks like a universally (sic) accepted Standard Timeframe for Indian Options traders.
So here is this.
What?
The time we are publishing this public indicator Indian market (Nifty) is in ATH at ~22200.
In any such super trending market it's always good to wait for a dip and then in suitable time, enter the trade in the direction of the larger trend. The reversal trading systems, in such a situation, proves to be ineffective.
Of course there are time when market is sideways and keeps on oscillating between +/2 standard deviation of the 20 SMA. In such a situation the reversal play works perfectly. But not so in such a trending market.
So the question comes up - after a dip what's the right point to enter.
Hence comes the importance of such a crossover based trading system.
In this indicator, it's a well-known technique (nothing originally from ours, it's taken from social media, exact one we forgot) to find out the 8EMA and VWAP crossover.
So we learned from social media, practice in our daily trading a bit, actuate it and now publishing it.
A few salient points
It does not make sense to jump into the trade just on the crossover (or crossunder).
So we added some more sugar to it, e.g. we check the color the candle. Also the next candle if crosses and closes above (or below) the breakout candle's high/low.
The polarity (color) of both the alert (breakout/breakdown) and confirmation candle to be same (green for crossover, red from crossunder).
Of course, it does provider BUY and SELL alerts separately.
These all we have found out doing backtesting and forward testing with 1/2 lots and saw this sort of approaches works.
Hence all of these are added to this script.
Nomenclature
Here green line is the 8EMA and the red line is the VWAP.
Also there is a black dotted line. That's 50 EMA. It's to show you the trend.
The recent trade is shown in the top right of the chart as green (for buy) or red (for sell) with SL and 1:1 target.
How to trade using this system?
This is roughly we have found the best possible use of this indicator.
Lets explain with a bullish BUY positive crossover (means 8EMA is crossing over the daily VWAP)
Keep timeframe as 5m
Check the direction/slope of the black dotted line (50 EMA). If it's upwards, only take bullish positions.
Open the chart which has the VWAP. (e.g. FinNifty spot or MidcapNifty spot does not have vwap). So in those cases Future is the way to go.
Wait for a breakout crossover and let the indicator gives a green, triangular UP arrow.
Draw a horizontal line to the close of that candle for next few (say 6 candles i.e. 30m) candles.
Wait for the price first to retest the 8EMA or even better the VWAP (or near to the 8EMA, VWAP)
Let the price moves and closes above the horizontal line drawn in the 4th step.
Take a bullish trade, keeping VWAP as the SL and 1:1 as the target.
Additionally, Options buyer can consult ADX also to see if the ADX is more than 25 and moving up for the bullish trade. (This has to be added seperately in the chart, it's not a part of the indicator).
Mention
The concept we have taken from some social media. Forget exactly where we heard this first time. We just coded it with some additional steps.
Statutory Disclaimer
There is no silver bullet / holy grail in trading. Nothing works 100% time. One has to be careful about the loss (s)he can bear in case of the trade goes against.
We, as the author of this script, is not responsible for any trading or position decision one is taken based on the outcome of this.
It is our sole discretion to change, add, delete the portion or withdraw the whole script without any prior notice or intimation.
In Indian Context: We are not SEBI registered.

MTF VWAPThis indicator is an enhanced version of the traditional VWAP, providing traders with multiple timeframe views, automatic session anchoring, and customization options for optimized technical analysis.
Key Features:
1. Multiple Timeframes, One View : Visualize Daily, Weekly, Monthly, and Yearly VWAP calculations simultaneously on a single chart.
2. Automatic Anchoring : The indicator intelligently auto-anchors each VWAP calculation to the start of its respective session. This ensures accurate readings and streamlines your analysis by eliminating the need for manual adjustments.
3. Customizability : Tailor the appearance of the indicator with fully customizable colors and the ability to select your preferred price source (e.g., high, low, close, hlc3, hlcc4, or a custom one).

VWAP Bands @shrilssVWAP Bands Integrates VWAP with standard deviation bands to provide traders with insights into potential support and resistance levels based on volume dynamics. VWAP is a key metric used by institutional traders to gauge the average price a security has traded at throughout the trading day, taking into account both price and volume.
This script calculates the VWAP for each trading session and overlays it on the price chart as a solid line. Additionally, it plots multiple standard deviation bands around the VWAP to indicate potential areas of price extension or contraction. These bands are derived from multiplying the standard deviation of price by predetermined factors, offering traders a visual representation of potential price ranges.
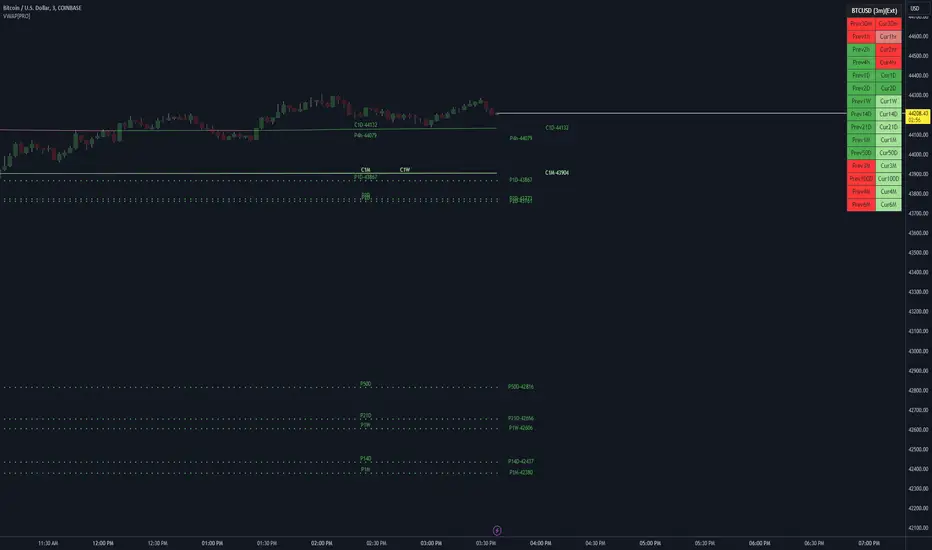
VWAP_CURRENT_YESTERDAY
The "VWAP CURRENT YESTERDAY" is a Pine Script designed for TradingView that automatically calculates and plots the Volume Weighted Average Price (VWAP) for the current day, the previous day.
Dynamic VWAP Calculation:
Automatically generates VWAPs for 1 day and 2 day.
User-Friendly Customization:
Through input options, users can easily toggle the visibility of each VWAP line, adjust colors, and set line thicknesses to their preference.
Configuration Options
1. VWAP Source:
Choose the price source for VWAP calculation. Default is the typical price (`hlc3` - the average of high, low, and close).
2. VWAP Lines:
Toggle the display for Today's VWAP, Yesterday's VWAP, and the VWAP from 2 days ago.
Customize colors and thickness for each VWAP line for clear visual distinction.
3. VWAP Labels:
Configure label sizes and positions to ensure that VWAP values are easily identifiable on the chart.
How It Works:
- The script calculates the sum of price multiplied by volume (`vwapsum`) and the sum of volumes (`volumesum`) for the specified periods.
- It utilizes an impulse function to reset calculations at the start of each new session or custom date, ensuring accurate and relevant VWAP values .
- Final VWAP values are plotted as lines on the chart, with optional labels for current and 2-day VWAPs for quick reference.
Customization Guide:
- To activate or deactivate specific VWAP lines, navigate to the 'VWAP Lines' section in the script's settings and toggle the respective options.
- Adjust the color and thickness of each VWAP line under the same section to match your charting preferences.
- Label settings, including size and offset, can be customized in the 'VWAP Labels' section, allowing for personalized label positioning and readability.

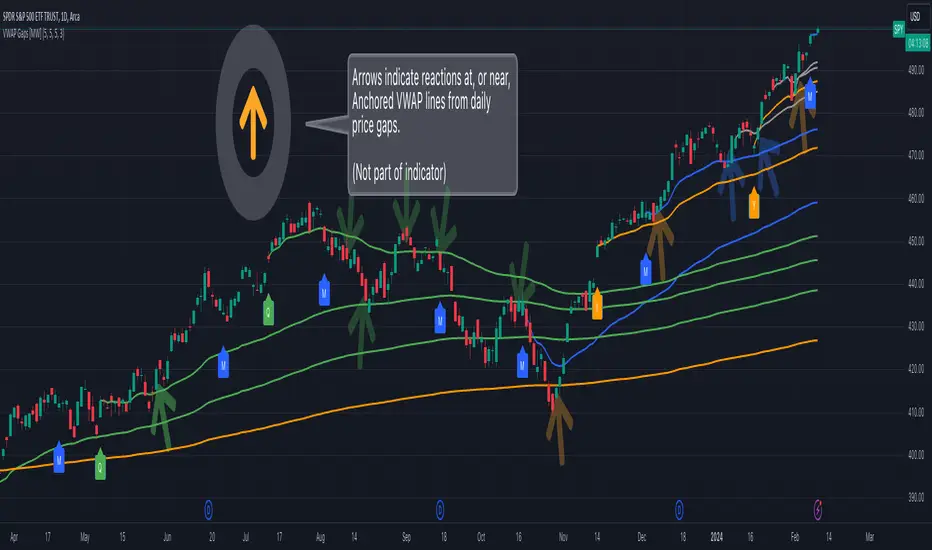
Multi VWAP from Gaps [MW]Multi VWAP from Gaps
Introduction
The Multi VWAP from Gaps tool extends the concept of using the Anchored Volume Weighted Average Price, popularized by its founder, Brian Shannon, founder of AlphaTrends. It creates automatic AVWAPS for anchor points originating at the biggest gaps of the week, month, quarter and year. Currently, most standard VWAP tools allow users to place custom anchored VWAPs, but the routine of doing this for every equity being watched can become cumbersome. This tool makes that process multi-times easier. Considering that large gaps can represent a shift in market structure, this tool provides unique and immediate insight into how past daily price gaps can and have affected price action.
Settings
LABEL SETTINGS
Show Biggest Gap of Week | Month | Quarter : Toggle labels that identify the location of the biggest gaps for the selected time period.
Show Big Labels : Toggle labels from showing the date and gap size to just showing a single letter (W/M/Q/Y) designating the time period that the gap is from.
Hide All Labels : Turn labels off and on.
MAX VWAP LINES
Max Weekly | Monthly | Quarterly | Yearly Lines : How many VWAP lines, starting from today, should be shown for the specified time period. Max: 5
SHOW VWAP LINES
Show Weekly | Monthly | Quarterly | Yearly Lines : This feature allows you to remove lines for the specified time period.
Calculations
This indicator does not provide buy or sell signals. It is simply the VWAP calculated starting from an “anchor point”, or start time. It is calculated by the summation of Price x Volume / Volume for the period starting at the anchor point.
How to Interpret
According to Brian Shannon, VWAP is an objective measure of what the average trader has paid for a particular equity over a given period, and is the value that large institutional investors frequently use as a trade signal. Therefore, by definition, when the price is above an AVWAP, buyers are in control for that period of time. Likewise, if the price is below the AVWAP, sellers are in control for that period of time.
VWAPs that coincide with important events, such as FOMC meetings, CPI reports, earnings reports, have added significance. In many cases, these events can cause gaps to happen in day-to-day price movement, and can affect market structure going forward.
Practically speaking, price action can tend to change direction when a significant VWAP is hit, voiding buy and sell signals. Like moving averages, this indicator can show, in real-time, how a buy or sell signal should be interpreted. A significant AVWAP line is a point of interest, and can serve as strong support or resistance, because large institutions may be using those values for entries or exits. For a great analysis of how to use AVWAP, visit the AlphaTrends channel on Youtube here or you can buy Brian Shannon’s “Anchored VWAP” book on Amazon.
Other Usage Notes and Limitations
It's important for traders to be aware of the limitations of any indicator and to use them as part of a broader, well-rounded trading strategy that includes risk management, fundamental analysis, and other tools that can help with reducing false signals, determining trend direction, and providing additional confirmation for a trade decision. Diversifying strategies and not relying solely on one type of indicator or analysis can help mitigate some of these risks.
Additionally, in order to build the VWAP calculations, past data is needed that may not be available on shorter timeframes. The workaround is that for some longer-term VWAP lines on shorter timeframes, you may see less than the total of lines that you selected in settings. This is particularly the case with quarterly VWAP lines on the 5 minute timeframe for some equities.
Acknowledgements
This script uses the MarketHolidays library by @Protervus. Also, for debugging, the JavaScript-style Debug Console by @algotraderdev was invaluable. Special thanks to @antsmuzic for helping review and debug the script. And, of course, without Brian Shannon's books, videos, and interviews, this indicator would would not have happened.
Multi-Time AVWAP_BEARConcept
Collaboration Highlight:
This was a collaboration with @Chart_School and @KioseffTrading Thank you to both, along with Ricardo Santos for his awesome library we used.
Overview
See how you view different time frame charts with one indicator and little to no adjustment.
Innovation:
The concept of using Anchored VWAP (AVWAP) with time events is a powerful technique in trading and technical analysis. Anchored VWAP differs from the traditional Volume Weighted Average Price (VWAP) by allowing traders to select a specific starting point or "anchor," from which the VWAP calculation begins. This approach is particularly useful for assessing price movements in relation to significant market events or specific periods of interest.
Utility and Flexibility:
Explaining the flexibility in turning on and off different time slices without much adjustment showcases a user-friendly design.
Key Uses and Benefits
Comparative Performance:
Anchoring the VWAP at the start of different time frames (e.g., weekly, monthly, quarterly) enables traders to compare the current price performance against previous periods. This comparison can highlight trends or shifts in trading momentum relative to past activity.
Support and Resistance Levels:
AVWAP lines can act as dynamic support and resistance levels. When anchored to significant time events, these levels gain additional relevance as they reflect the market's valuation of an asset since a notable point in time. Traders often watch for price interactions with these levels to make informed trading decisions.
Risk Management:
Anchored VWAP can serve as a benchmark for setting stop-loss orders or profit targets. By considering the price's relation to the AVWAP of a specific period or after a key event, traders can define exit points that are aligned with market-generated information.
Trend Confirmation: The direction and stability of the price relative to an anchored VWAP can indicate the strength of a trend. If the price consistently remains above an AVWAP anchored at a bullish event (or below for a bearish event), it may confirm the trend's continuation.
Further Reading
Educational Resource:
Becuase we are using Volume with a relation to price AVWAP is very powerful to show data that cannot be eye balled on its own. Brian Shannon's book "Maximum Trading Gains With Anchored VWAP - The Perfect Combination of Price, Time & Volume", is an excellent guide to best practices on how to use AVWAP to your advatage while trading. His book goes into depth about the best way to use this indicator to its fullest potencial.
Tips for Using This Indicator
Weekly / Monthly / Quarterly Settings:
All the settings for the lower timeframe charts are similar. Here is an example of seeing a Weekly AVWAP for 6 weeks, showing:
1. The start of the 6-week AVWAP is using a High Low Close source for the first candle of the 6 weeks.
2. The lines are colored "Red" for the AVWAPs.
3. The line thickness is "1".
Yearly Settings
Simlair to the other settings with the Yearly we give you a couple more options along with 3 years to toggle on and off. The idea was to allow the user to see which AVWAP most effected by price and quickly toggle them on and off to unclutter their chart.
Watch for how and if the labels over lap and choose the one you feel is most in play. In Shannon's Book he talks about "Hand off's" and "Pinches". These concepts are easy to spot with being able to see all the Major Time Events, then simply toggle off the one you dont need.
A great benefit to how we coded this script you can buzz through a watch list without having to re-adjust the Anchor points. This will save you time if following a basket of symbols and show coorlations in the overall market.
Secret Feature
When looking at these becuase the user doesn't need to hand plot the anchor points and we are fouced on major time slices, I encourge you to use the Trading View "Bar Replay" Feature. You think that you are missing a high or low AVWAP but what is happening is the indicator is re-plotting a level that is super hard to see, then you will see the hand-offs like Shannon discusses in his book. This blew me away while we were discussing it post development.
Conclusion
There are so many uses of how to use VWAP and therories on its best practice. We are only using "TIME EVENTS". For more ways to use AVWAP, I would encourge you to also handplot them with Trading View's new "Anchored VWAP", as seen in the standard toolbar.
Using your ideas along with this indicator i think its a powerful combination.
Also Check Out: allanster's - Anchored VWAP Pinch & Handoff, Intervals, and Signals
He has a great AVWAP script that incorporates many AVWAP ideas.

VWAP LEVELS [PRO]32 VWAP levels with labels and a table to help you identify quickly where current price is in relation to your favorite VWAP pivot levels. To help reduce cognitive load, 4 colors are used to show you where price is in relation to a VWAP level as well as the strength of that respective level. Ultimately, VWAP can be an invaluable source of support and resistance; in other words you'll often see price bounce off of a level (whether price is increasing or decreasing) once or multiple times and that could be an indication of a price's direction. Another way that you could utilize this indicator is to use it in confluence with other popular signals, such as an EMA crossover. Many traders will wait till a bar's close on the 5m or 10m time frame above a VWAP level (developing 1D VWAP would be a popular choice) before making a decision on a potential trade especially if price is rising above the 1D VWAP *and* there's been a recent 100 EMA cross UP of the 200 EMA. These are 2 bullish signals that you could look for before possibly entering in to a trade.
I've made this indicator extremely customizable:
⚡Each VWAP level has 2 labels: 1 "at level" and 1 "at right", each label and price can be disabled
⚡Each VWAP label has its own input for label padding. The "at right" label padding input allows you to zoom in and out of a chart without the labels moving along their respective axis. However, the "at level" label padding input doesn't work the same way once you move the label out of the "0" input. The label will move slightly when you zoom in and out
⚡Both "current" and "previous" VWAP levels have their own plot style that can be changed from circles, crosses and lines
⚡Significant figures input allows you to round a price up or down
⚡A price line that allows you to identify where price is in relation to a VWAP level
⚡A table that's color coded the same way as the labels. The labels and table cells change to 1 of 4 colors when "OC Check Mode" is enabled. This theory examines if the VWAP from the Open is above or below the VWAP from Close and if price is above or below normal VWAP (HLC3). This way we have 4 states:
Red = Strong Downtrend
Light Red = Weak Downtrend
Light = Weak Uptrend
Green = Strong Uptrend
Something to keep in mind: At the start of a new year, week or month, some levels will converge and they'll eventually diverge slowly or quickly depending on the level and/or time frame. You could add a few labels "at level" to show which levels are converging at the time. Since we're at the beginning of a new year, you'll see current month, 2 month, 3 month etc converge in to one level.
🙏Thanks to (c)MartinWeb for the inspiration behind this indicator.
🙏Thanks to (c)SimpleCryptoLife for the libraries and code to help create the labels.
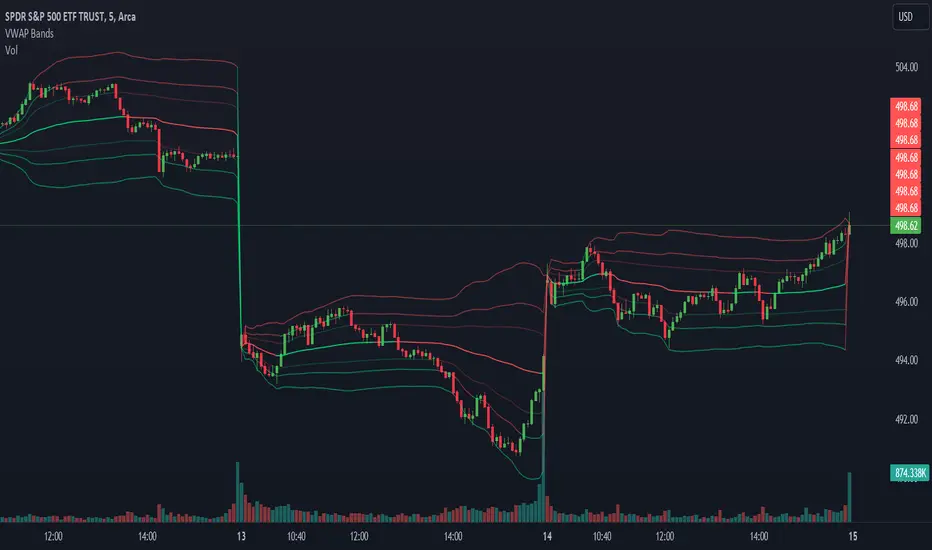
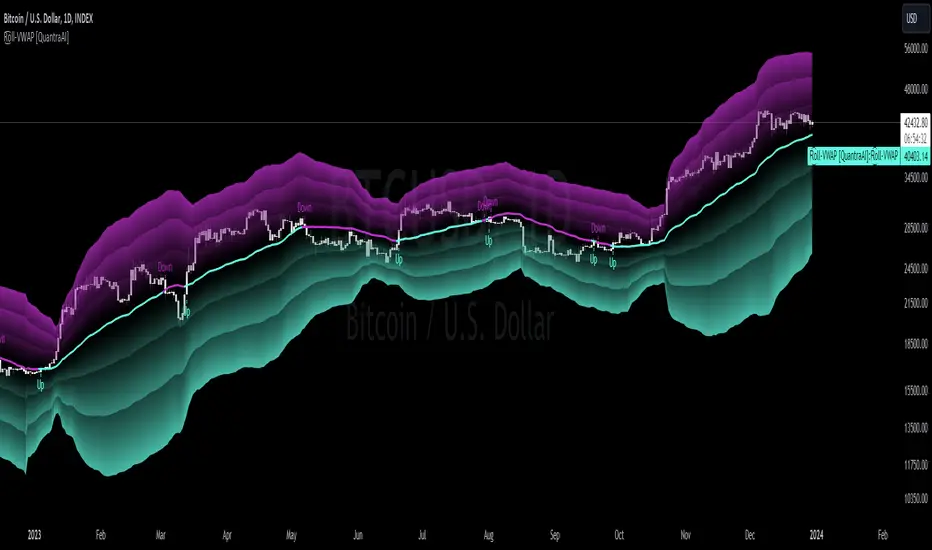
Rolling VWAP [QuantraSystems]Rolling VWAP
Introduction
The Rolling VWAP (R͜͡oll-VWAP) indicator modernizes the traditional VWAP by recalculating continuously on a rolling window, making it adept at pinpointing market trends and breakout points.
Its dual functionality includes both the dynamic rolling VWAP and a customizable anchored VWAP, enhanced by color-coded visual cues, thereby offering traders valuable flexibility and insight for their market analysis.
Legend
In the Image you can see the BTCUSD 1D Chart with the R͜͡oll-VWAP overlay.
You can see the individually activatable Standard Deviation (SD) Bands and the main VWAP Line.
It also features a Trend Signal which is deactivated by default and can be enabled if required.
Furthermore you can find the coloring of the VWAP line to represent the Trend.
In this case the trend itself is defined as:
Close being greater than the VWAP line -> Uptrend
Close below the VWAP line -> Downtrend
Notes
The R͜͡oll-VWAP can be used in a variety of ways.
Volatility adjusted expected range
This aims to identify in which range the asset is likely to move - according to the historical values the SD Bands are calculated and thus their according probabilities displayed.
Trend analysis
Trending above or below the VWAP shows up or down trends accordingly.
S/R Levels
Based on the probability distribution the 2. SD often works as a Resistance level and either mid line or 1. SD lines can act as S/R levels
Unsustainable levels
Based on the probability distributions a SD level of beyond 2.5, especially 3 and higher is hit very seldom and highly unsustainable.
This can either mean a mean reversion state or a momentum slowdown is necessary to get back to a sustainable level.
Please note that we always advise to find more confluence by additional indicators.
Traders are encouraged to test and determine the most suitable settings for their specific trading strategies and timeframes.
Methodology
The R͜͡oll-VWAP is based on the inbuilt TV VWAP.
It expands upon the limitations of having an anchored timeframe and thus a limited data set that is being reset constantly.
Instead we have integrated a rolling nature that continuously calculates the VWAP over a customizable lookback.
To also keep the base utility it is possible to use the anchored timeframes as well.
Furthermore the visualization has been improved and we added the coloring of the main VWAP line according to the Trend as stated above.
The applicable Trend signals are also part of that.
The parameter settings and also the visualizations allow for ample customizations by the trader.
For questions or recommendations, please feel free to seek contact in the comments.
VWAP RangeThe VWAP Range indicator is a highly versatile and innovative tool designed with trading signals for trading the supply and demand within consolidation ranges.
What's a VWAP?
A VWAP (Volume Weighted Average Price) represents an equilibrium point in the market, balancing supply and demand over a specified period. Unlike simple moving averages, VWAP gives more weight to periods with higher volume. This is crucial because large volumes indicate significant trading activity, often by institutional traders, whose actions can reflect deeper market insights or create substantial market movements. The VWAP is also often used as a benchmark to evaluate the efficiency of executed trades. If a trader buys below the VWAP and sells above it, they are generally considered to have transacted favourably.
This is how it works:
Multiple VWAP Anchors:
This indicator uses multiple VWAPs anchored to different optional time periods, such as Daily, Weekly, Monthly, as well as to the highest high a lowest low within those periods. This multiplicity allows for a comprehensive view of the market’s average price based on volume and price, tailored to different trading styles and strategies.
Dynamic and Fixed Periods:
Traders can choose between using dynamic ranges, which reset at the start of each selected period, and specifying a date and time for a particular fixed range to trade. This flexibility is crucial for analyzing price movements within specific ranges or market phases.
Fixed ranges allow VWAPs to be calculated and anchored to a significant market event, the beginning of a consolidation phase or after a major news announcement.
Signal Generation:
The indicator generates buy and sell signals based on the relationship of the price to the VWAPs. It also allows for setting a maximum number of signals in one direction to avoid overtrading or pyramiding. Be sure to wait for the candle close before trading on the signals.
Average Buy/Sell Signal Lines:
Lines can be plotted to display the average buy and sell signal prices. The difference between the lines shows the average profit per trade when trading on the signals in that range. It's a good way to see how profitable a range is on average without backtesting the signals. The lines will also often turn into support and resistance areas, similar to value areas in a volume profile.
Customizable Settings:
Traders have control over various settings, such as the VWAP calculation method and bar color. There are also tooltips for every function.
Hidden Feature:
There's a subtle feature in this indicator: if you have 'Indicator values' turned on in TradingView, you'll see a Sell/Buy Ratio displayed only in the status line. This ratio indicates whether there are more sell signals than buy signals in a range, regardless of the Max Signals setting. A red value above 1 suggests that the market is trending upward, indicating you might want to hold your long positions a bit longer. Conversely, a green value below 1 implies a downward trend.

ASFX SignalsDescription:
The ASFX Signals Indicator, created by OmegaTools, is an open-source Pine Script™ code designed to provide traders with valuable signals for potential entry and exit points in the market. This script incorporates a combination of Exponential Moving Average (EMA) signals and Volume Weighted Average Price (VWAP) confluence, enhancing the precision of trading decisions.
Key Features:
Threshold Configuration: Users can customize the threshold parameter (thres) to fine-tune signal sensitivity, adapting the indicator to different market conditions.
EMA Length Customization: The script allows traders to adjust the length of the Exponential Moving Average (EMA) with the "EMA Length" input, providing flexibility in capturing various trends.
Show/Hide Options: Users have the flexibility to choose whether to display the EMA line, VWAP confluence, and VWAP upper and lower bands, tailoring the visual representation based on individual preferences.
VWAP Confluence: The indicator integrates VWAP confluence, offering additional confirmation for trading signals. Traders can choose the VWAP resolution and set the deviation parameter for enhanced accuracy.
Signal Filtering: The script intelligently filters signals based on the percentage of the candle that crosses the EMA. Long signals are filtered out if the closing price is above the VWAP or the specified threshold, and short signals are filtered out if the closing price is below the VWAP or the threshold.
Visual Signals: The indicator provides clear visual signals for long and short entries, making it easy for traders to identify potential opportunities. The signals are accompanied by arrows and labels for quick interpretation.
How to Use:
Adjust the threshold, EMA length, and VWAP parameters based on your trading preferences.
Choose whether to display the EMA line, VWAP confluence, and upper/lower bands.
Interpret long and short signals for potential entry and exit points, considering the percentage of the candle that crosses the EMA.
Consider additional confirmation provided by VWAP confluence.
Concepts and Methodology:
The ASFX Signals Indicator combines EMA signals and VWAP confluence to generate actionable trading signals. The script intelligently considers the percentage of the candle that crosses the EMA, providing a nuanced approach to signal confirmation. The EMA offers trend insights, while VWAP confluence enhances signal reliability.

Zigzag Tails [Trendoscope®] 🎲 Introducing Zigzag Tails Indicator by Trendoscope.
The Zigzag Tails Indicator, a groundbreaking tool from Trendoscope, redefines technical analysis by seamlessly integrating anchored VWAPs (Volume Weighted Average Prices) and Average Price calculations with Zigzag pivot points. This advanced indicator recalculates Average Price or VWAP from one Zigzag pivot to the next, offering unparalleled insights into market movements.
🎯 Innovative Design
Each Zigzag pivot can feature up to three distinct tails, corresponding to the high, low, and close prices of each candle. Users have the flexibility to select between Average Price and VWAP for display on their charts. By default, the indicator plots all three tails, but individual tail visibility is customizable via the settings panel.
Average Price Mode: When selected, tails depict the average price across a specified number of bars.
VWAP Mode: In this mode, tails represent the VWAP, calculated for a given price over a set number of bars.
🎯 Dynamic Dotted Tail
The Zigzag Tails Indicator features dotted tails that extend from the last Zigzag pivot to the current bar. These dotted tails dynamically adapt to market changes and are subject to repainting with the emergence of new Zigzag pivots.
When repainting is enabled, the dotted tails originate from the last unconfirmed Zigzag pivot, extending to the current bar. This setting offers a more immediate, albeit tentative, visual representation of market trends.
With repainting disabled, the dotted tails will be anchored from the last confirmed Zigzag pivot to the current bar, providing a more stable but slightly delayed market analysis.
Irrespective of the repaint option, the dotted dynamic tails is always expected to repaint.
🎯 Practical Applications
The Zigzag Tails Indicator provides more accurate support and resistance levels than traditional VWAP, rolling VWAP, or moving averages. Its precision makes it an invaluable tool for identifying trends, as well as potential trend continuations or reversals.
🛠 Indicator Settings
Zigzag Configuration:
Zigzag Length determines the loopback length for the foundational Zigzag calculation.
Number of Bars represent the calculation distance. This limitation is added to avoid runtime errors on lower timeframes. The calculations run through lots of loops. Hence, if it is run across too many bars, we may get timeout issues.
Repaint: Activating this will also display the last, unconfirmed Zigzag pivot. Since the last pivot is inherently tentative, it may repaint with the arrival of new bars. A pivot is confirmed only when a subsequent unconfirmed pivot emerges on the chart.
Tail Configuration
Tail Type: Choose between average and VWAP for the tail calculation. The average option plots a simple average, while the VWAP option calculates an anchored VWAP from pivot to pivot.
Display Options: Tailored display options for High, Low, Close prices, with customizable colors for each tail type.
Inspired by the ideas of @KioseffTrading's implementation of Zigzag Anchored VWAP
