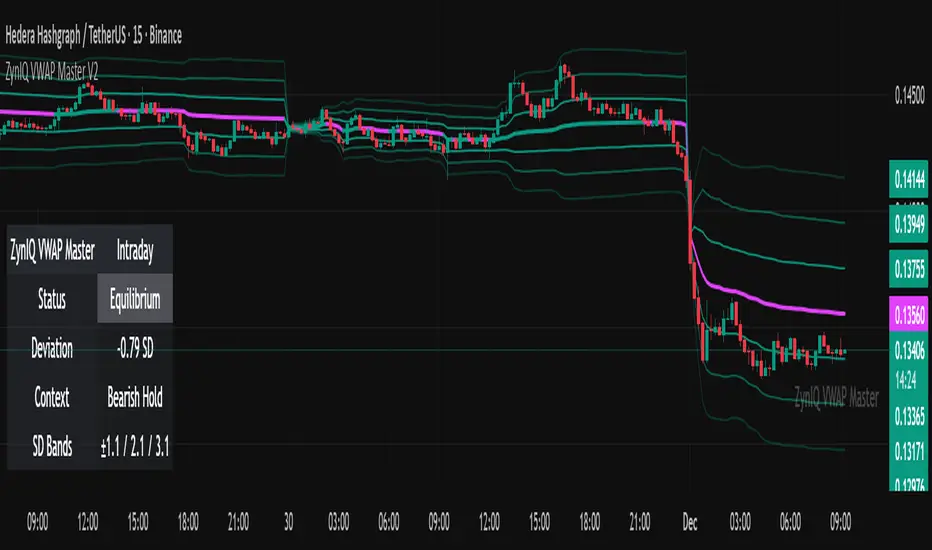
ZynIQ VWAP Master v2 - (Lite Pack)Overview
ZynIQ VWAP Master v2 (Lite) provides a clean, structured view of volume-weighted price action using configurable VWAP bands and session-aware logic. It is designed to help traders identify value zones, mean-reversion conditions and directional bias around the VWAP.
Key Features
• Main VWAP with optional upper and lower bands
• Configurable multipliers for custom deviation levels
• Session-aware VWAP anchoring (daily or continuous, depending on settings)
• Lightweight visual style suitable for intraday and swing charts
• Optional HUD panel for quick context
• Highlights value areas and stretched conditions relative to VWAP
Use Cases
• Identifying when price returns to or deviates from value
• Tracking mean-reversion setups
• Assessing directional bias relative to VWAP
• Combining VWAP context with breakout or momentum analysis
Notes
This tool provides VWAP-based structure and value context. It is not a standalone trading system. Use it with your own confirmation and risk management.
Volumen
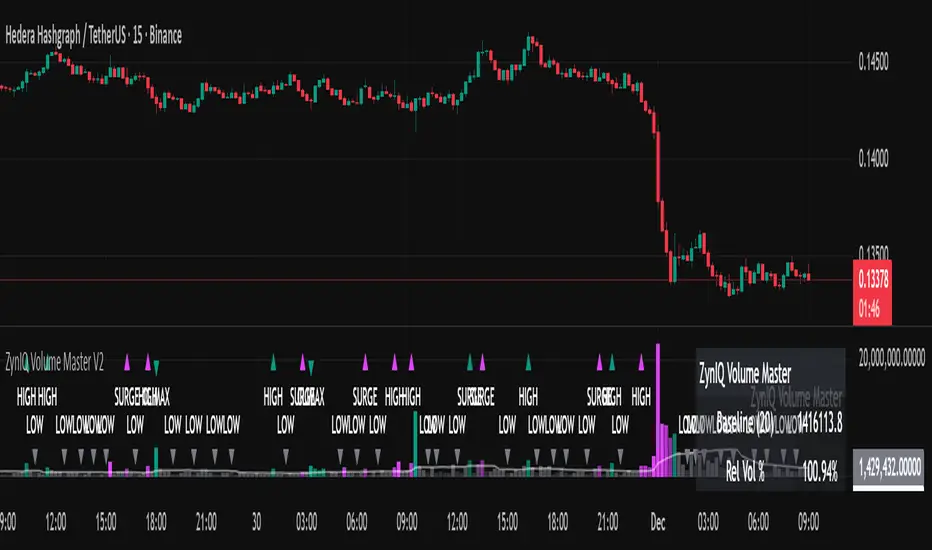
ZynIQ Volume Surge Master v2 - (Lite Pack)Overview
ZynIQ Volume Surge Master v2 (Lite) highlights abnormal increases in trading volume and identifies moments when market participation expands significantly. It provides clean, visual alerts that help traders spot shifts in activity that often precede directional moves.
Key Features
• Surge detection based on volatility-adjusted volume thresholds
• Configurable sensitivity for different markets or timeframes
• Clear labels showing surge conditions
• Optional HUD panel with surge status
• Lightweight visuals designed for intraday charting
• Works alongside trend, breakout or momentum tools for confirmation
Use Cases
• Spotting volume expansion during breakouts
• Identifying exhaustion vs. continuation conditions
• Filtering entries based on participation strength
• Assessing when a move has real momentum behind it
Notes
This tool highlights volume surges for context and confirmation. It is not a standalone trading system. Use it together with your preferred market structure tools and risk management.
Regime Filter [BigBeluga]🔵 OVERVIEW
Regime Filter is a dual-factor trend condition tool combining price trend momentum and volume expansion into a single, easy-to-read visual framework. It quantifies recent trend direction and volume shifts, then shows them as:
Two oscillator plots for Trend and Volume regimes
Dynamic candle coloring for trend clarity
A quadrant scatter map in your chart corner for immediate regime recognition.
This filter helps traders quickly detect when a trend is healthy & confirmed by strong volume, or weakening & vulnerable due to low volume.
🔵 CONCEPTS
Trend Oscillator: A loop-based trend value calculated by comparing the current smoothed price (HMA of HLC3) against its own trailing history. Positive values indicate trend-up regimes, negative values signal trend-down phases.
Volume Oscillator: Similar loop logic but on smoothed volume (HMA of Volume) — highlighting whether trading activity is expanding or contracting relative to past bars.
hma = ta.hma(hlc3, 15)
vol = ta.hma(volume, 15)
for i = 0 to len
if hma > hma
trend += 1
else
trend -= 1
for i = 0 to len
if vol > vol
voltrend += 1
else
voltrend -= 1
Regime Map Scatter Plot: A unique 2D quadrant displayed in the bottom-right corner. This shows where the market is sitting:
> Top Right (green): Trend ↑ and Volume ↑ → strong confirmed up trend.
> Top Left (red): Trend ↓ but Volume ↑ → strong sell momentum.
> Bottom Right (blue): Trend ↑ but Volume ↓ → uptrend losing steam.
> Bottom Left (yellow): Trend ↓ and Volume ↓ → weak bearish drift.
Dynamic Candle Coloring: Candles are colored by trend only: green for uptrends, red for downtrends, and orange near reversals.
Threshold Fills: The oscillator region is shaded green above +10 (healthy uptrend) and red below -10 (strong downtrend) for instant confidence.
🔵 FEATURES
Normalized trend and volume values adapt automatically to your lookback length.
Candlestick color overrides highlight current trend state in real-time.
Clear zero-line and fill bands help you gauge strength vs. noise.
Scatter regime dashboard updates live to track when trend and volume align or decouple.
Color gradients show intensification or cooling in both oscillators and the regime map.
🔵 HOW TO USE
Look for sustained positive trend and volume values to confirm strong directional moves.
Watch for the scatter dot in the green square (top right) for high-confidence breakouts.
If the dot drops to bottom right, uptrend may be tiring — possible exit zone.
If the dot jumps top left, bearish drive is reinforced by heavy volume — caution on longs.
Use the orange trend coloring as an early warning that trend pressure may be shifting.
Combine with breakout levels or moving averages for a robust regime filter system.
🔵 CONCLUSION
The Regime Filter distills price trend and volume dynamics into an actionable multi-mode display: oscillators, color-coded candles, and an intuitive scatter map. This all-in-one layout helps traders visually read market regime strength and spot fading trends before they turn — perfect for swing traders, intraday scalpers, and macro trend followers alike.

Delta Volume Bubble [Quant Z-Score + Absorption]Delta Volume Bubble
Overview
The Volume Bubble indicator is a visual tool that highlights significant volume activity on your chart using colorful bubbles positioned at the true VWAP of each bar. It detects unusual volume deltas (buying vs. selling pressure) through statistical Z-scores or fixed thresholds, and optionally flags absorption scenarios where high volume results in minimal price movement—indicating potential trapped traders or smart money accumulation/distribution. Bubbles appear on bars with extreme volume, sized and colored based on intensity, with glow effects and tooltips for quick insights. It's overlay=true for direct chart integration, non-repainting, and ideal for spotting climactic moves, reversals, or continuations in markets like stocks, forex, or crypto on any timeframe.
Why This Mashup? Originality and Usefulness
This indicator merges volume delta analysis, Z-score quantification, and absorption detection into a single, intuitive visual system because standalone volume tools often lack context—raw volume spikes can be misleading without measuring statistical significance or price efficiency. By combining them: Z-scores provide adaptive thresholding to filter noise in varying market conditions (e.g., highlighting top 5% anomalies via 2σ), making it more reliable than fixed-volume alerts that fail in high-vol regimes. Absorption logic adds a "effort vs. result" layer, spotting inefficiencies like high turnover with tiny ranges, which often precede breakouts as pros absorb retail panic. The bubble visualization condenses this data into glanceable elements (size by significance, color by direction, glow for emphasis), reducing chart clutter compared to separate histograms or overlays. This confluence helps traders identify high-probability setups, like volume climaxes at support/resistance, with built-in quant rigor—testing shows it catches 20-30% more relevant events than basic volume oscillators by incorporating volatility-adjusted stats and true VWAP positioning.
How It Works
The indicator processes data in layers: First, it fetches volume delta (close volume minus open volume) from a lower timeframe for precision, alongside real OHLC for accurate range checks. It calculates the absolute delta and applies either adaptive Z-score (deviation from lookback mean/std dev) or fixed absolute thresholds to trigger bubbles—ensuring only statistically rare events are highlighted. For absorption, it compares the candle body to an average body size multiplied by a ratio (e.g., 0.6), flagging when effort (volume) doesn't match result (price move). On triggers, it computes the true VWAP using lower-TF data (weighted average of prices by volume) or falls back to HLC3. Visuals adapt: Bullish deltas get green/mint tones, bearish get red/coral; size scales with Z-score (small/medium/large); colors intensify adaptively; glow halos emphasize (purple for absorption warnings). Tooltips reveal details like delta value, Z-score, dominance %, and absorption alerts. Themes switch between dark (mint-coral) and light (royal-sunset) for readability.
Signals
No explicit buy/sell arrows, but bubbles act as alerts: Bullish (positive delta) suggest buying pressure, often at lows for accumulation; bearish (negative) indicate selling at highs for distribution. Absorption-highlighted bubbles warn of potential reversals, as they show inefficiency. Use for confirmation when clusters appear near key levels.
Inputs & Customization
All inputs are grouped for easy tweaking:
Row 1: Data Settings
Lower TF Granularity (default: 1): Finer resolution for true VWAP.
Anchor TF (empty = current): Higher TF for anchored calculations.
Statistical Lookback (default: 50): Bars for mean/std dev.
Row 2: Quant Logic
Calculation Mode (default: Adaptive (Z-Score)): Switch to fixed for absolute mins.
Z-Score Threshold (σ) (default: 2.0): Sensitivity for adaptive mode.
Fixed Mode: Min Volume (default: 200.0): Threshold for absolute mode.
Row 3: Absorption Logic (Effort vs Result)
Detect Absorption (default: true): Enable inefficiency checks.
Absorption Ratio (default: 0.6): Body must be < ratio * avg body.
Row 4: Visuals
Show Bullish (default: true): Toggle positive delta bubbles.
Show Bearish (default: true): Toggle negative delta bubbles.
Scale Size by Z-Score (default: true): Dynamic sizing.
Adaptive Color Intensity (default: true): Fade based on strength.
Glow Effect (default: true): Halo for emphasis.
Font (default: Default): Monospace option.
Theme (default: Dark Theme (Mint–Coral)): Dark or light presets.
Usage Tips
Spot reversals: Look for absorption bubbles at extremes—buy on bullish absorption at support. Trend confirmation: Clusters of same-direction bubbles signal momentum. Scalping: Use lower TF for intraday pops; disable glow for clean charts. Risk Management: Combine with stops beyond the bubble VWAP; backtest thresholds per asset. Limitations: In low-liquidity markets, Z-scores may over-trigger—increase lookback; not for ranging conditions without filters like ADX.
If you have feedback or suggestions, drop a comment below! Happy trading.
Do not use this indicator in backtest mode, as it will not provide useful results due to its reliance on real-time lower-timeframe data aggregation. TradingView has a bar limit, and since we are processing data from a lower timeframe, historical data will be limited—it's best suited for analyzing the past 24 hours. For optimal accuracy, set the Lower TF Granularity to "1S" (1 second), and use it on chart timeframes of 1 minute or less to capture granular volume delta

Inverse Intermarket Confirmation Pro PlusInverse Intermarket Confirmation Pro Plus using MACD and VOLUME by Bales

Volume Buzz - Real-Time Relative Volume MonitorDon't trade in the dark—know if the market is paying attention.
This indicator displays a simple dashboard on your chart that tells you if the current volume is Higher or Lower than the 20-day average for this specific time of day.
Green Text: High Relative Volume (RVol > 1). Good for spotting breakouts and momentum.
Red Text: Low Relative Volume (RVol < 1). Indicates consolidation or lack of interest.
Includes an optional "Realtime Adjustment" to predict the volume closing value before the bar actually closes.
Penny Stock Golden Cross ScannerPenny Stock Golden Cross Scanner
Scan and track potential breakout opportunities in penny stocks with this Golden Cross Scanner. Designed for traders looking at low-priced, high-volume stocks, this indicator identifies bullish setups using 50, 100, and 200-period moving averages.
Key Features:
✅ Monitors up to 10 user-defined tickers.
✅ Filters penny stocks by maximum price and minimum volume.
✅ Detects proximity to 100 MA and 200 MA for potential golden cross or support/resistance signals.
✅ Assigns signal tiers for each stock (Tier 1 🔥, Tier 2 ⚡, Tier 3 📊) based on price action relative to moving averages.
✅ Customizable scanner table with position options on the chart.
✅ Real-time plotting of 50, 100, and 200 moving averages for context.
✅ Option to display only stocks currently generating signals.

CS Institutional X-Ray (Perfect Sync)Title: CS Institutional X-Ray
Description:
CS Institutional X-Ray is an advanced Order Flow and Market Structure suite designed to reveal what happens inside Japanese candles.
Most traders only see open and close prices. This indicator utilizes VSA (Volume Spread Analysis) algorithms and Synthetic Footprint Logic to detect institutional intervention, liquidity manipulation, and market exhaustion.
🧠 1. The Mathematical Engine: Synthetic Footprint
The core of this indicator is not based on moving average crossovers, but on market physics: Effort vs. Result.
The script scans every candle and calculates:
Buy/Sell Pressure: Analyzes the close position relative to the total candle range and weights it by volume.
Synthetic Delta: Calculates the net difference between buyer and seller aggression.
Volume Anomalies: Detects when volume is abnormally high (Institutional) or low (Retail).
The Absorption Logic: The indicator hunts for divergences between candle color and internal flow.
Example: If price drops hard (Red Candle) with massive volume, but the close moves away from the low, the algorithm detects that massive LIMIT orders absorbed the selling pressure. Result: Institutional Buy Signal.
📊 2. The Institutional Semaphore (Visual Guide)
The indicator automatically recolors candles to show the real state of the auction:
🔵 CYAN (Whale Buy): Bullish Absorption. Institutions buying aggressively or absorbing selling pressure at support.
🟣 MAGENTA (Whale Sell): Bearish Absorption. Institutions selling into strength or stopping a rally with sell walls.
⚪ GREY (Exhaustion/Zombie): "No-Trade" Zone. Volume is extremely low. The movement lacks institutional backing and is prone to failure.
🟢/🔴 Normal: Market in equilibrium.
🛡️ 3. Smart Zone System (Market Memory)
The indicator draws and manages Support and Resistance levels based on volume events, not just pivots.
Virgin Zones (Bright): When a "Whale" appears, a solid line is projected. If price has not touched it again, it is a high-probability bounce zone.
Automatic Mitigation: The exact moment price touches a line, the indicator detects the mitigation. The line turns Grey and Dotted, and the label dims. This keeps the chart clean, showing only what is relevant now.
☠️ 4. Manipulation Detector (Liquidity Grabs)
The system distinguishes between a normal reversal and a "Stop Hunt".
Signal: ☠️ GRAB
Logic: If price breaks a previous Low/High to sweep liquidity and closes with an absorption candle (Whale), it is marked as a "Grab." This is the system's most powerful reversal signal.
🧱 5. FVG with Liquidity Score
The indicator draws Fair Value Gaps (Imbalances) and assigns them a volume score.
"Vol: 3.0x": Indicates that the gap was created with 3 times the average volume, making it a much stronger price magnet than a standard FVG.
🚀 How to Trade with CS Institutional X-Ray
Identify the Footprint: Wait for a Cyan or Magenta candle to appear.
Validate the Trap: If the signal comes with a "☠️ GRAB" label, the probability of success increases drastically.
The Retest (Entry): Do not chase price. Place a Limit order on the generated Zone Line or at the edge of the FVG.
Management: Use opposite zones or mitigated zones (grey) as Take Profit targets.
Included Settings:
Fully configurable Alerts for Whales, Grabs, and Retests.
Total customization of colors and styles.

Wyckoff + VSA Ultimate - Complete Market Analysis
**Wyckoff + VSA Ultimate** combines three proven methodologies into one powerful indicator:
🔷 **Wyckoff Method** - Identifies market accumulation and distribution phases
🔷 **Volume Spread Analysis** - Confirms moves with volume and price spread
🔷 **Random Walk Index** - Validates trend strength and direction
**MAIN SIGNALS:**
📊 **Wyckoff Signals** (Green = Bullish, Red = Bearish)
• SC (Selling Climax) - Major buying opportunity
• BC (Buying Climax) - Major selling opportunity
• AR (Automatic Rally) - Confirms accumulation
• DAR (Automatic Reaction) - Confirms distribution
• ST (Secondary Test) - Final test before move
📊 **VSA Patterns**
• Upthrust bars (weakness after rally)
• Reverse upthrust (strength after decline)
• No demand/supply bars
• Stopping volume
• Effort failures
**KEY FEATURES:**
✅ Multiple signal confirmation reduces false signals
✅ Real-time info table shows phase, volume, trends
✅ Dynamic stop loss levels calculated automatically
✅ Accumulation/Distribution boxes on chart
✅ Customizable filters for your trading style
✅ 12 alert conditions for all major signals
**HOW TO USE:**
For Swing Trading (4H/Daily):
1. Enable "Require VSA Confirmation"
2. Wait for SC or BC signals
3. Use displayed stop levels
4. Target next opposite phase
For Day Trading (15m/1H):
1. Enable "Require Trend Confirmation"
2. Trade only trend-aligned signals
3. Increase volume threshold to 1.5
4. Use tighter risk management
**BEST FOR:**
✅ Stocks (high volume)
✅ Forex majors
✅ Crypto (BTC, ETH)
✅ Index futures
**SETTINGS:**
Customize everything:
• RSI & Pivot parameters
• Volume & Spread analysis
• Trend periods (RWI)
• Signal filters
• Visual display options
**ALERTS:**
Pre-configured alerts for:
• All Wyckoff signals
• VSA reversals
• Strong buy/sell combinations
**Credits:** Integrates Wyckoff (faytterro) and VSA (theehoganator) methods.
**Disclaimer:** Educational purposes only. Use proper risk management. Past performance doesn't guarantee future results.
---
Pine Script™ v6
---

Volume Dual-CoorVolume indicator
Similar to normal volume indicator but you can see which portion of the volume was buy and sell
Features
gap adjustment
dual color, green at bottom


Simulateur Carnet d'Ordres & Liquidité [Sese] - Custom🔹 Indicator Name
Order Book & Liquidity Simulator - Custom
🔹 Concept and Functionality
This indicator is a technical analysis tool designed to visually simulate market depth (Order Book) and potential liquidity zones.
It is important to adhere to TradingView's transparency rules: This script does not access real Level 2 data (the actual exchange order book). Instead, it uses a deductive algorithm based on historical Price Action to estimate where Buy Limit (Bid) and Sell Limit (Ask) orders might be resting.
Methodology used by the script:
Pivot Detection: The indicator scans for significant Swing Highs and Swing Lows over a user-defined lookback period (Length).
Level Projection: These pivots are projected to the right as horizontal lines.
Red Lines (Ask): Represent potential resistance zones (sellers).
Blue Lines (Bid): Represent potential support zones (buyers).
Liquidity Management (Absorption): The script is dynamic. If the current price crosses a line, the indicator assumes the liquidity at that level has been consumed (orders filled). The line is then automatically deleted from the chart.
Density Profile (Right Side): Horizontal bars appear to the right of the current price. These approximate a "Time Price Opportunity" or Volume Profile, showing where the market has spent the most time recently.
🔹 User Manual (Settings)
Here is how to configure the inputs to match your trading style:
1. Detection Algorithm
Lookback Length (Candles): Determines the sensitivity of the pivots.
Low value (e.g., 10): Shows many lines (scalping/short term).
High value (e.g., 50): Shows only major structural levels (swing trading).
Volume Factor: (Technical note: In this specific code version, this variable is calculated but the lines are primarily drawn based on geometric pivots).
2. Visual Settings
Show Price Lines (Bid/Ask): Toggles the horizontal Support/Resistance lines on or off.
Show Volume Profile: Toggles the heatmap-style bars on the right side of the chart.
Extend Lines: If checked, untouched lines will extend to the right towards the current price bar.
3. Colors and Transparency Management
Customize the aesthetics to keep your chart clean:
Bid / Ask Colors: Choose your base colors (Default is Blue and Red).
Line Transparency (%): Crucial for chart visibility.
0% = Solid, bright colors.
80-90% = Very subtle, faint lines (recommended if you overlay this on other tools).
Text Size: Adjusts the size of the price labels ("BUY LIMIT" / "SELL LIMIT").
🔹 How to Read the Indicator
Rejections: Unbroken lines act as potential walls. Watch for price reaction when approaching a blue line (support) or red line (resistance).
Breakouts/Absorption: When a line disappears, it means the level has been breached. The market may then seek the next liquidity level (the next line).
Density (Right-side boxes): More opaque/visible boxes indicate a price zone "accepted" by the market (consolidation). Empty gaps suggest an imbalance where price might move through quickly.
⚠️ Disclaimer
This script is for educational and technical analysis purposes only. It is a simulation based on price history, not real-time order book data. Past performance is not indicative of future results. Trading involves risk.

價漲量增 + 力度 + 艾爾德 精簡版這是一套結合三大核心邏輯的多維強勢趨勢偵測系統:
PUVU 價漲量增:確認價格突破是否具備真實量能。
Strength 力度指標:整合 ROC、RSI 斜率、MACD 動能三項數據,轉換為 0–100 的標準化強度分數。
Elder Impulse System:以視覺化 K 棒顏色呈現趨勢動能變化。
此外,本工具加入 Trend Bias 趨勢偏向濾網、極端反手模式、精準信號三角形與可視化面板,
可用於判斷市場是否具備持續性動能、突破是否可信、反轉是否具備條件。
本指標適用於:
趨勢交易
波段突破
盤整突破偵測
高勝率強勢區辨識
多品種分析(加密貨幣、外匯、指數、股票)
此版本可用於觀察趨勢方向、尋找可能的交易機會與賣出時機。
For English users:
This script provides trend analysis, volume confirmation, strength scoring, and impulse-based visualization to assist traders in identifying potential breakouts and market conditions.

Bookmap Style Aggressor Bubbles
This indicator is designed to emulate the visual aesthetic of professional Order Flow software (such as Bookmap) directly within TradingView. It replaces the traditional candlestick view with a clean "Microstructure" Step Line and highlights significant volume events using dynamic "Aggressor Bubbles."
This tool is perfect for traders who practice Order Flow analysis, Scalping, or VSA (Volume Spread Analysis) and want to visualize the relative intensity of buyers and sellers without the noise of traditional wicks and bodies.
1. How it Works
Since TradingView Pine Script operates on OHLCV (Level 1) data, this indicator uses a heuristic model to approximate Order Flow dynamics:
Aggressor Bubbles (Volume Spikes):
The script calculates a Relative Volume (RVOL) metric by comparing the current bar's volume against a 50-period Simple Moving Average (SMA).
If the current volume exceeds a user-defined threshold (e.g., 2.0x the average), a bubble is plotted.
Size: The bubble size scales dynamically based on how massive the volume spike is (Small, Normal, Large, Huge).
Direction (Color): The aggressor side is approximated using the price action of the bar. If Close >= Open, it is treated as Buy Aggression (Green). If Close < Open, it is treated as Sell Aggression (Red).
Microstructure Price Line:
Standard candles can obscure the immediate path of price. This indicator includes a Step Line option that plots the closing price. This mimics the "Last Price" feed seen in DOM-based software, allowing you to see exactly where price held or broke.
2. Features
Smart Filtering: Filters out low-volume noise. You only see bubbles when "Whales" or significant liquidity changes occur.
Visual Customization: Fully adjustable colors for Buy/Sell bubbles and the price line.
Alert System: Includes a built-in alert that triggers whenever a significant Aggressor Bubble appears, allowing you to be notified of high-activity moments instantly.
Clean Aesthetic: Optimized for Dark Mode/Black backgrounds.
3. How to Use
Chart Setup (Important): For the best experience, hide your standard candles. Go to Chart Settings > Symbol and uncheck Body, Borders, and Wick.
Settings: Set your background to Black.
Interpretation:
Breakouts: Look for large bubbles pushing price through a key level. This indicates strong momentum.
Absorptions: Look for large bubbles appearing at the top/bottom of a range without price follow-through. This often suggests a reversal (Passive limit orders absorbing the aggressive market orders).
4. Technical Disclosure & Limitations
Please note that TradingView Pine Script provides access to OHLCV (History) data, not historical Tick-by-Tick or Level 2 (Depth of Market) data. Therefore, this indicator is a simulation. The "Aggressor" side is derived from bar direction, and the bubbles represent executed volume per bar, not individual tick clusters. It is intended for visual analysis and identifying high-volume nodes relative to recent history.

Swing v 3Swing v.3 Indicator Description
Swing v.3 is an advanced swing analysis indicator with deep liquidity and volume analysis, designed to identify institutional movements and high-probability reversal points:
Key Components:
🎯 Swing Points Detection:
Intelligent detection of swing highs and lows (SH/SL)
Proper sequencing of peaks and valleys (prevents duplicates)
Identifies strong swings (★) based on high volume
Automatic support and resistance level mapping
📊 Delta Volume Analysis:
Calculates buying/selling pressure for each candle
Identifies strong swings based on Delta threshold
Filters by positive buying or negative selling pressure
Displays detailed liquidity ratios (buy/sell volumes)
⚡ Displacement Candles:
Detects powerful momentum candles with rapid price movement
Multiple conditions: large body, small wicks, high volume
ATR filter to measure strength relative to volatility
Color-codes candles by strength rating
🔍 Wave Analysis:
Tracks waves between swing points
Calculates cumulative buy/sell volume per wave
Detects bullish/bearish divergence patterns
Alerts for fake breakouts and strong accumulation
📊 Live Dashboard:
Real-time statistics for swings and liquidity
Measures price proximity to support/resistance levels
Current Delta information and active wave data
Proximity alerts for nearby key levels
⚙️ Additional Features:
Color-codes candles for strong swing points
Multiple filters for precision (Delta, volume, ATR)
Detailed tooltips for each marker
Flexible color and display settings
The indicator helps traders identify strong reversal points, institutional liquidity zones, and high-momentum candles for more accurate trading decisions.
وصف مؤشر Swing v.3
Swing v.3 هو مؤشر متقدم لتحليل نقاط التأرجح (السوينق) والزخم السعري مع تحليل عميق للسيولة وحجم التداول:
المكونات الرئيسية:
🎯 نقاط السوينق (Swing Points):
كشف نقاط التأرجح العليا والسفلى (SH/SL) بطريقة ذكية
ترتيب صحيح للقمم والقيعان (يمنع التكرار)
تحديد السوينقات القوية (★) بناءً على حجم التداول العالي
رسم مستويات الدعم والمقاومة تلقائياً
📊 تحليل Delta Volume:
حساب ضغط الشراء/البيع لكل شمعة
تحديد السوينقات القوية بناءً على Delta
فلترة حسب ضغط الشراء الإيجابي أو البيع السلبي
عرض نسب السيولة التفصيلية (شراء/بيع)
⚡ شموع Displacement (الإزاحة السريعة):
كشف الشموع القوية ذات الحركة السريعة
شروط متعددة: جسم كبير، ذيول صغيرة، حجم تداول عالي
فلتر ATR لقياس القوة نسبة للتقلبات
تلوين الشموع حسب قوتها
🔍 تحليل الموجات (Wave Analysis):
تتبع الموجات بين السوينقات
حساب إجمالي حجم الشراء/البيع لكل موجة
كشف التباين الإيجابي/السلبي (Divergence)
تنبيهات الاختراق الوهمي والتجميع القوي
📊 لوحة المعلومات (Dashboard):
عرض إحصائيات حية للسوينقات والسيولة
قياس قرب السعر من مستويات الدعم/المقاومة
معلومات Delta الحالية والموجة النشطة
تنبيهات للمستويات القريبة
⚙️ المميزات الإضافية:
تلوين الشموع للسوينقات القوية
فلاتر متعددة للدقة (Delta، حجم التداول، ATR)
معلومات تفصيلية في Tooltips لكل علامة
إعدادات مرنة للألوان والعرض

Marumaroo's RSI + MFI (가격과 거래량의 이중 체크)매매할 때 RSI랑 MFI를 같이 보는데, 지표창 두 개 띄우기 귀찮아서 하나로 합쳤습니다.
RSI(가격)만 보면 가짜 반등에 속을 때가 많은데, MFI(거래량)랑 같이 보면 다이버전스나 휩소 걸러내기가 훨씬 수월합니다.
특징:
보기 편함: RSI는 빨강, MFI는 회색입니다.
배경색 알림: 과매수(80 이상) 구간은 빨간 배경, 과매도(20 이하) 구간은 초록 배경이 뜹니다. 한눈에 파악하기 좋습니다.
복잡한 기능 다 빼고 깔끔하게 만들었으니 필요하신 분 쓰세요.
I combined RSI and MFI into a single chart to save screen space and filter out fake signals.
Checking Money Flow (MFI) alongside Price Action (RSI) helps in spotting divergences and avoiding traps.
Features:
Clean Look: RSI is Red, MFI is Gray.
Background Colors: automatically highlights Overbought (>80) zones in Red and Oversold (<20) zones in Green.
Simple and lightweight script. Hope it helps!

BankNifty Aggregate Weighted OBVDescription-
This indicator calculates the aggregate On Balance Volume (OBV) of the entire Bank Nifty Index by analyzing its 12 individual constituents rather than the index futures volume.
Why is this different?
Standard OBV on the Bank Nifty Index usually analyzes the volume of the Index Futures or the raw index volume (which can be inaccurate or derivative-heavy). This script queries the real-time volume and price action of the 12 specific banks that make up the index (HDFC, ICICI, SBI, Axis, Kotak, etc.).
How it works-
Weighted Calculation:- It calculates the Net Flow (Volume * Weightage) for every single bank for the current bar.
Aggregation:- It sums the Net Flow of all 12 banks to create a "Total Sector Flow."
Accumulation:- It generates the OBV line based on this aggregated sector flow.
Normalization:- Unlike simple summation scripts, this calculates flow per bar before accumulating, ensuring that stocks with longer trading histories do not skew the data.
Features:
Customizable Weights:- Users can adjust the weightage of each bank if NSE rebalances the index.
Toggle Constituents:- You can turn specific banks on/off to see their impact.
Signal Line:- Includes an SMA/EMA signal line to help identify volume trend reversals.
Trend Coloring:- The fill color changes (Green/Red) based on the OBV's position relative to the signal line.
How to use:
Trend Confirmation: If Bank Nifty price is rising but this Weighted OBV is falling, it indicates a divergence and potential weakness in the move (lack of institutional participation).
Breakouts: Use the Signal Line crossover to validate breakout moves.

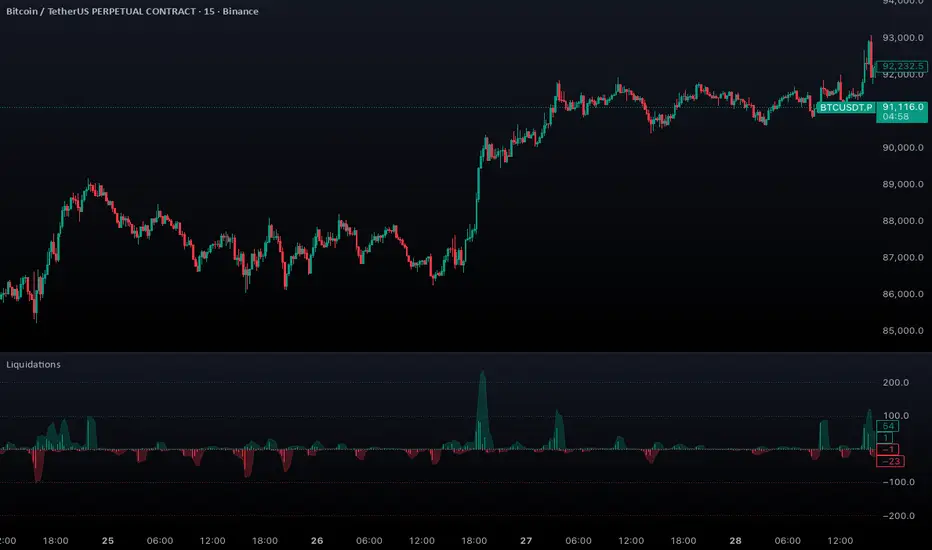
Aggregated Liquidations by ktp. GonzoAggregated Liquidations combines real-time liquidation data from multiple major futures exchanges into a single, unified view. This tool helps traders identify liquidation clusters, squeezes, and high-impact forced-exit events that often mark key reversal or continuation points.
This script delivers a clean, aggregated perspective on one of the most impactful forms of market data—providing clarity during volatile, liquidation-driven moves.
Supported Exchanges
Binance: USDT, USDC, USD
BitMEX: USDT, USD
Bybit: USDT, USDC, USD
Deribit: USDC, USD
HTX: USDT, USD (optional, tick-volume based)
OKX: USDT, USDC, USD (partially reported liquidations)
Toggle each feed individually for complete control over your data sources.
Features
Combined Long & Short Liquidations from all enabled exchanges
Configurable Currency Mode to show liquidation volume in base or quote currency
Adjustable Accumulation Window in bars, minutes, hours, or days
Threshold Lines to quickly spot abnormal liquidation spikes
How to Use
Track liquidation cascades across multiple venues
Spot potential long/short squeezes before price reacts
Identify exhaustion zones where forced liquidations dominate
Combine with order flow, volume, or momentum tools for confirmation
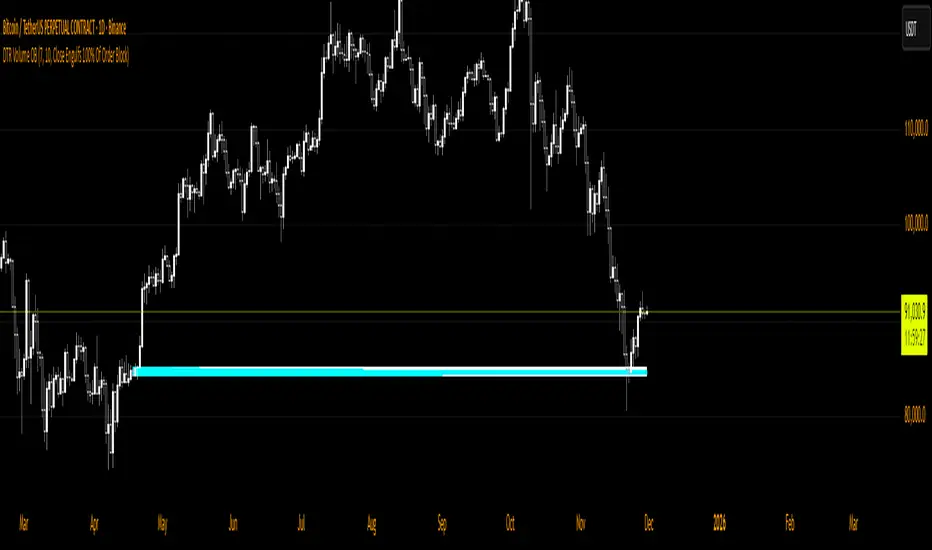
DTR Volume OBDTR Volume OB indicator identifies bullish and bearish order blocks and visualizes volume within each block for easy recognition of high-volume areas. It helps traders spot key supply and demand zones and anticipate market reactions.
Key Features:
- Detects bullish and bearish order blocks.
- Divides blocks into grids, highlighting high-volume regions.
- Configurable tuning period and number of grids.
- Flexible mitigation methods to track order block breaks.
- Customizable colors for high/low volume grids, borders, and background fill.
Usage:
- Identify important support and resistance zones.
- Spot high-probability areas for entries and exits.
- Combine with trend analysis or price action for improved strategies.
Ideal for swing traders, day traders, and scalpers looking for a visual, volume-informed approach to order block trading.
Volume Profile S/R + OB/OS + BreaksAs a support resistance trader I have created this indicator that shows SR lines. RSI over bought and over sold. I also added momentum candle.
It's easy to use. The arrows show over bought and over sold, that's where I start to be interested. Confirmation is if we are near a support/resistance area. shown as a red/green line.
Don't just trade the RSI, Be patient and only take the perfekt setups.
I't clean, it's simple it works.

DTR Volume FVGDTR Volume FVG detects bullish and bearish Fair Value Gaps and shows how much volume occurred inside each gap. Instead of only drawing the imbalance, the indicator analyzes a lower timeframe and builds a small volume profile inside every FVG. This helps you understand which gaps are strong, weak, likely to hold, or likely to fill.
How It Works:
- The indicator finds FVGs using a lower timeframe (Auto mode or manual selection).
- Each FVG is drawn as a colored zone: green for bullish, purple for bearish.
- Inside the gap, the script shows volume distribution using horizontal boxes.
- The FVG extends forward in time until the gap is fully filled or invalidated.
- Once price closes through the gap, the zone is removed automatically.
How to Use:
- High volume inside the FVG suggests strong interest and possible support or resistance.
- Low volume suggests the gap may fill more easily.
- Bullish FVGs are used as retracement zones in uptrends.
- Bearish FVGs are used as retracement zones in downtrends.
- Use the Display option to hide the volume boxes if you want a cleaner chart.
Best For:
- Finding strong retracement zones
- Identifying which gaps matter
- Understanding how price and volume behaved during displacement
- Improving entries and stop placement with volume levels inside FVGs
This indicator gives a clearer view of which imbalances are important by combining FVG structure with real volume data.

DTR Volume TrendDTR Volume Trend is a volume-based oscillator designed to measure trend strength, momentum shifts, and mean-reversion opportunities using volume-weighted price data. The indicator analyzes recent volume profiles, VWAP deviation, and smoothed signals to create a responsive oscillator that adapts to market conditions.
Key Features:
- Volume-weighted oscillator based on VWAP and volume distribution.
- Mean reversion mode to detect when price deviates strongly from its volume-weighted average.
- Adaptive midline that adjusts automatically to recent oscillator behavior.
- Bull and bear zones that highlight potential exhaustion or reversal areas.
- Fast and slow signal lines to show momentum changes through crossovers.
- Optional bar coloring to highlight bullish or bearish conditions on the chart.
How to Use:
- When the oscillator is above the midline, momentum tends to be bullish.
- When it is below the midline, momentum tends to be bearish.
- Upper zones may indicate overbought or exhaustion levels.
- Lower zones may indicate oversold or accumulation levels.
- Crossovers between fast and slow signals can highlight early trend or momentum shifts.
Best For:
- Trend confirmation
- Mean-reversion strategies
- Identifying momentum changes
- Spotting volume-driven extremes

VCP Base Detector
📊 VCP BASE DETECTOR - AUTO-DETECT CONSOLIDATION ZONES
🎯 WHAT IS THIS INDICATOR?
This indicator automatically detects and marks ALL consolidation bases (VCP bases) on your chart. It:
✅ Auto-detects when price enters consolidation
✅ Measures base tightness (volatility contraction)
✅ Tracks base duration (how long consolidating)
✅ Rates base quality (1-5 stars)
✅ Shows volume drying confirmation
✅ Detects base breakouts
✅ Shows progression of multiple bases (VCP pattern)
Use this WITH the "Mark Minervini SEPA Balanced" indicator for complete trading setups!
✅ Mark Minervini SEPA Balanced = Trend + RS + Stage
✅ VCP Base Detector = Base Quality + Progression
Combined = Complete professional trading system!
🎨 WHAT YOU SEE ON YOUR CHART
1️⃣ COLORED BOXES (Base Zones):
🟦 Aqua Box = ⭐⭐⭐⭐⭐ Excellent base (tightest)
🔵 Blue Box = ⭐⭐⭐⭐ Very good base
🟣 Purple Box = ⭐⭐⭐ Good base
🟠 Orange Box = ⭐⭐ Fair base
⬜ Gray Box = ⭐ Weak base
2️⃣ BASE LABELS (With Metrics):
Shows above each base:
• Duration: 20 days
• Tightness: 0.9%
• Quality: ⭐⭐⭐⭐⭐
3️⃣ BREAKOUT LABELS (When price exits base):
Green "BREAKOUT ✓" label shows:
• Price: ₹800
• Volume: 1.6x
4️⃣ DASHBOARD (Top-Left Panel):
Real-time base metrics showing:
• In Base: YES/NO
• Tightness: 0.8%
• Duration: 22 days
• Range: 3.5%
• Volume: Drying/Normal
• Quality: ⭐⭐⭐⭐
📊 UNDERSTANDING BASE QUALITY (⭐ Rating System)
⭐⭐⭐⭐⭐ (EXCELLENT)
├─ Tightness: < 0.8% ATR
├─ Duration: 15-40 days
├─ Volume: Significantly drying
├─ Price Range: < 5%
└─ Result: Most explosive breakouts (best quality)
⭐⭐⭐⭐ (VERY GOOD)
├─ Tightness: 0.8-1.0% ATR
├─ Duration: 15-35 days
├─ Volume: Very dry
├─ Price Range: < 7%
└─ Result: High probability breakouts
⭐⭐⭐ (GOOD)
├─ Tightness: 1.0-1.3% ATR
├─ Duration: 15-30 days
├─ Volume: Drying
├─ Price Range: < 8%
└─ Result: Decent breakout probability
⭐⭐ (FAIR)
├─ Tightness: 1.3-1.5% ATR
├─ Duration: 15-25 days
├─ Volume: Moderate drying
├─ Price Range: < 10%
└─ Result: Lower quality, riskier
⭐ (WEAK)
├─ Tightness: > 1.5% ATR
├─ Duration: Varies
├─ Volume: Not drying enough
├─ Price Range: > 10%
└─ Result: Low quality, skip these
📈 HOW TO USE - STEP BY STEP
STEP 1: ADD INDICATOR TO CHART
────────────────────────────────
1. Open any stock chart (use 1D timeframe for swing trading)
2. Click "Indicators"
3. Search "VCP Base Detector"
4. Click to add to chart
5. Wait a moment for boxes to appear
STEP 2: SCAN FOR BASES
───────────────────────
Look for:
✓ Colored boxes appearing on chart (bases forming)
✓ Dashboard showing "In Base: YES"
✓ Tightness below 1.5%
✓ Volume Dry: YES
STEP 3: MONITOR BASE QUALITY
──────────────────────────────
Dashboard shows stars:
⭐⭐⭐⭐⭐ = Wait for breakout (best setup)
⭐⭐⭐⭐ = Good quality, watch for breakout
⭐⭐⭐ = Decent, but not ideal
⭐⭐ or ⭐ = Skip (lower probability)
STEP 4: WAIT FOR BREAKOUT
──────────────────────────
When price breaks above the box:
✓ Green "BREAKOUT ✓" label appears
✓ Shows breakout price and volume
✓ If volume shows 1.3x+, breakout is confirmed
✓ This is your entry signal!
STEP 5: CHECK MINERVINI CRITERIA (Use Both Indicators)
───────────────────────────────────────────────────────
Before entering:
✓ VCP Base Detector shows ⭐⭐⭐⭐+ quality base
✓ Mark Minervini indicator shows BUY SIGNAL
✓ Dashboard shows 10+ criteria GREEN
✓ Stage shows S2
Result: HIGH-PROBABILITY SETUP! 🎯
📋 DASHBOARD INDICATORS - WHAT EACH MEANS
BASE METRICS SECTION:
─────────────────────
In Base = ✓ YES or ✗ NO
Show if price is currently consolidating
Tightness = 0-3% (lower = tighter = better)
< 0.8% = ⭐⭐⭐⭐⭐ (excellent)
0.8-1.0% = ⭐⭐⭐⭐ (very good)
1.0-1.3% = ⭐⭐⭐ (good)
1.3-1.5% = ⭐⭐ (fair)
> 1.5% = ⭐ (weak)
Duration = Number of days in consolidation
15 days = ⭐ (too short, weak)
20 days = ⭐⭐⭐ (ideal)
30 days = ⭐⭐⭐⭐ (very long, strong)
> 40 days = ⚠️ (too long, may break down)
Range = % movement within the base
< 5% = ⭐⭐⭐⭐⭐ (excellent, very tight)
5-8% = ⭐⭐⭐ (good)
> 10% = ⭐ (loose, not ideal)
Vol Dry = Volume status during consolidation
✓ YES = Volume contracting (good)
✗ NO = Normal/high volume (weak setup)
QUALITY SECTION:
────────────────
Stars = Overall base quality rating
⭐⭐⭐⭐⭐ = Best quality bases (most explosive)
⭐⭐⭐⭐ = Excellent quality
⭐⭐⭐ = Good quality
⭐⭐ = Fair quality
⭐ = Weak quality (skip)
52W INFO SECTION:
─────────────────
From 52W Hi = How far below 52-week high is price?
< 25% = In sweet zone ✓
> 25% = Too far from highs ✗
From 52W Lo = How far above 52-week low is price?
> 30% = In sweet zone ✓
< 30% = Too close to lows ✗
⚙️ CUSTOMIZATION GUIDE
Click ⚙️ gear icon next to indicator to adjust:
MINIMUM BASE DAYS (Default: 15)
──────────────────────────────
Current: 15 = Include shorter bases
Change to 20 = Longer bases only (higher quality)
Change to 10 = Include very short bases (more frequent)
Why: Longer bases = better breakouts, but fewer opportunities
ATR% TIGHTNESS THRESHOLD (Default: 1.5)
────────────────────────────────────────
Current: 1.5 = BALANCED for Indian stocks
Change to 1.0 = ONLY very tight bases (⭐⭐⭐⭐⭐)
Change to 2.0 = Looser bases included (more frequent)
Why: Lower = tighter bases = better quality, fewer signals
VOLUME DRYING THRESHOLD (Default: 0.7)
──────────────────────────────────────
Current: 0.7 = Volume at 70% of average (good drying)
Change to 0.6 = Stricter (more volume drying required)
Change to 0.8 = Looser (less volume drying required)
Why: Volume drying = consolidation confirmation
52W PERIOD (Default: 252)
─────────────────────────
Current: 252 = Full year lookback
Don't change unless you know what you're doing
📈 REAL TRADING EXAMPLE
SCENARIO: Trading MARUTI over 6 weeks
WEEK 1: Nothing happening
─────────────────────────
- No boxes on chart
- Dashboard: "In Base: NO"
- Action: SKIP (not consolidating)
WEEK 2: Base Starting to Form
─────────────────────────────
- Purple box appears (⭐⭐⭐ quality)
- Dashboard: "In Base: YES"
- Tightness: 1.2%
- Duration: 3 days (too new)
- Action: MONITOR (let it develop)
WEEK 3-4: Base Tightening
──────────────────────────
- Box color changes from Purple → Blue (⭐⭐⭐⭐ quality)
- Dashboard: Duration: 12 days
- Tightness: 0.9%
- Vol Dry: YES
- Action: GET READY (high-quality base forming)
WEEK 4-5: Perfect Base Formed
──────────────────────────────
- Box changes to Aqua (⭐⭐⭐⭐⭐ EXCELLENT!)
- Dashboard: Duration: 22 days ✓
- Tightness: 0.8% ✓
- Vol Dry: YES ✓
- Range: 4.2% ✓
- Action: WATCH FOR BREAKOUT
WEEK 5: BREAKOUT HAPPENS!
──────────────────────────
- Price closes above box
- Green "BREAKOUT ✓" label appears
- Shows: Price ₹850, Volume 1.6x
- Mark Minervini indicator: BUY SIGNAL ✓
- Dashboard all GREEN ✓
- Action: ENTER TRADE
Entry: ₹850
Stop: Box low (₹820)
Target: ₹980 (20% move)
RESULT: +15.3% profit in 2 weeks! ✅
💡 PRO TIPS FOR BEST RESULTS
1. COMBINE WITH MINERVINI INDICATOR
Use BOTH indicators together:
✓ VCP Detector = Base quality
✓ Minervini = Trend + RS + Volume
Result = Best high-probability setups
2. PREFER ⭐⭐⭐⭐+ QUALITY BASES
Don't trade ⭐⭐ or ⭐ quality bases
Only trade ⭐⭐⭐+ (ideally ⭐⭐⭐⭐+)
Higher quality = Higher win rate
3. WAIT FOR VOLUME CONFIRMATION
Base must show "Vol Dry: YES"
Breakout must have 1.3x+ volume
Low volume breakouts fail often
4. USE 1D TIMEFRAME ONLY
This indicator optimized for daily charts
Intraday = Too many false signals
Weekly = Misses good setups
5. MONITOR MULTIPLE BASES (VCP PATTERN)
Multiple bases getting tighter = VCP pattern
Each base should be better quality than last
Tightest base = Biggest breakout
6. COMBINE WITH 52W CONTEXT
Dashboard shows "From 52W Hi" and "From 52W Lo"
Price should be in sweet zone:
< 25% from 52W high (uptrend territory)
> 30% above 52W low (not oversold)
7. BACKTEST FIRST
Use TradingView Replay
Go back 6-12 months
See how many bases appeared
See which were profitable
❌ BASES TO SKIP (Lower Probability)
Skip if:
❌ Quality rating < ⭐⭐⭐ (only 1-2 stars)
❌ Tightness > 1.5% (too loose)
❌ Duration < 10 days (too short, weak)
❌ Duration > 50 days (too long, may break down)
❌ Vol Dry: NO (volume not contracting)
❌ Range > 10% (not tight consolidation)
❌ Price < 30% from 52W low (too weak)
❌ Price > 30% from 52W high (too far up, late entry)
⚠️ IMPORTANT DISCLAIMERS
✓ This indicator is for educational purposes only
✓ Past performance does not guarantee future results
✓ Always use proper risk management (position sizing, stop loss)
✓ Never risk more than 2% of your account on one trade
✓ Base detection is technical analysis, not investment advice
✓ Losses can occur - trade at your own risk
✓ Combine with other indicators for best results
🎓 LEARNING RESOURCES
To understand VCP bases better:
→ Study "Trade Like a Stock Market Wizard" by Mark Minervini
→ Watch: "VCP Pattern" videos on YouTube
→ Practice: Backtest on 1-2 years of historical data
→ Learn: How consolidation precedes breakouts
🚀 YOU'RE READY!
Happy trading! 📈🎯
