Wave Surge [UAlgo]The "Wave Surge " is a comprehensive indicator designed to provide advanced wave pattern analysis for market trends and price movements. Built with customizable parameters, it caters to both beginner and advanced traders looking to improve their decision-making process.
This indicator utilizes wave-based calculations, adaptive thresholds, and volume analysis to detect and visualize key market signals. By integrating multiple analysis techniques.
It calculates waves for high, low, and close prices using a configurable moving average (EMA) technique and pairs it with volume and baseline analysis to confirm patterns. The result is a robust framework for identifying potential entry and exit points in the market.
🔶 Key Features
Wave-Based Analysis: This indicator computes waves using exponential moving averages (EMA) of high, low, and close prices, with an adjustable wave period to suit different market conditions.
Customizable Baseline: Traders can select from multiple baseline types, including VWMA (Volume-Weighted Moving Average), EMA, SMA (Simple Moving Average), and HMA (Hull Moving Average), for trend confirmation.
Adaptive Thresholds: The adaptive threshold feature dynamically adjusts sensitivity based on a chosen period, ensuring the indicator remains responsive to varying market volatility.
Volume Analysis: The integrated volume analysis calculates volume ratios and allows traders to enable or disable this feature to refine signal accuracy.
Pattern Recognition: The indicator identifies specific wave patterns (Wave 1, Wave 3, Wave 4, Wave 5, Wave 6) and visually plots them on the chart for easy interpretation.
Visual and Color-Coded Signals: Clear visual signals (upward and downward arrows) are plotted on the chart to highlight potential bullish or bearish patterns. The baseline is color-coded for an intuitive understanding of market trends.
Configuration: Parameters for wave period, baseline length, volume factors, and sensitivity can be tailored to align with the trader’s strategy and market environment.
🔶 Interpreting the Indicator
Wave Patterns
The indicator detects and plots six unique wave patterns based on price changes that exceed an adaptive threshold. These patterns are validated by the direction of the baseline:
Wave 1 (Bullish): Triggered when the price increases above the threshold while the baseline is falling.
Wave 3, 4, and 6 (Bearish): Indicate potential downtrends validated by a rising baseline.
Wave 5 (Bullish): Suggests upward momentum when prices exceed the threshold with a falling baseline.
Baseline Trend
The baseline serves as a trend confirmation tool, dynamically changing color to reflect market direction:
Aqua (Rising): Indicates an upward trend.
Red (Falling): Indicates a downward trend.
Volume Confirmation
When enabled, the volume analysis feature ensures that signals are supported by significant volume movements. Patterns with high volume are considered more reliable.
Signal Visualization
Upward Arrows (🡹): Highlight potential bullish opportunities.
Downward Arrows (🡻): Highlight potential bearish opportunities.
Alerts
Alerts are triggered when key wave patterns are identified, providing traders with timely notifications to take action without being tied to the screen.
🔶 Disclaimer
Use with Caution: This indicator is provided for educational and informational purposes only and should not be considered as financial advice. Users should exercise caution and perform their own analysis before making trading decisions based on the indicator's signals.
Not Financial Advice: The information provided by this indicator does not constitute financial advice, and the creator (UAlgo) shall not be held responsible for any trading losses incurred as a result of using this indicator.
Backtesting Recommended: Traders are encouraged to backtest the indicator thoroughly on historical data before using it in live trading to assess its performance and suitability for their trading strategies.
Risk Management: Trading involves inherent risks, and users should implement proper risk management strategies, including but not limited to stop-loss orders and position sizing, to mitigate potential losses.
No Guarantees: The accuracy and reliability of the indicator's signals cannot be guaranteed, as they are based on historical price data and past performance may not be indicative of future results.
Volumeanalysis

5x Volume indicator - Day Trading5x Volume Screener - Day Trading
Version: 6.0
Description:
This indicator is designed to identify significant volume spikes in crypto and stock markets,
specifically targeting instances where volume exceeds 5x the average of a 10-period Simple Moving Average (SMA) as the baseline.
Perfect for day traders and momentum traders looking for high-volume breakout opportunities.
Key Features:
Tracks real-time volume compared to 5-period moving average
Visual alerts through green histogram bars for 5x volume spikes
Dynamic volume ratio display showing exact multiple of average volume
Clear threshold line for quick reference
Optional labels showing precise volume ratios
Benefits:
Instantly spot unusual volume activity
Identify potential breakout opportunities
Validate price movements with volume confirmation
Perfect for day trading and scalping
Works across multiple timeframes
Best Used For:
Day trading setups
Breakout trading
Volume confirmation
Momentum trading
Market reversal identification
Created by: CigarSavant
Last Updated: December 2024

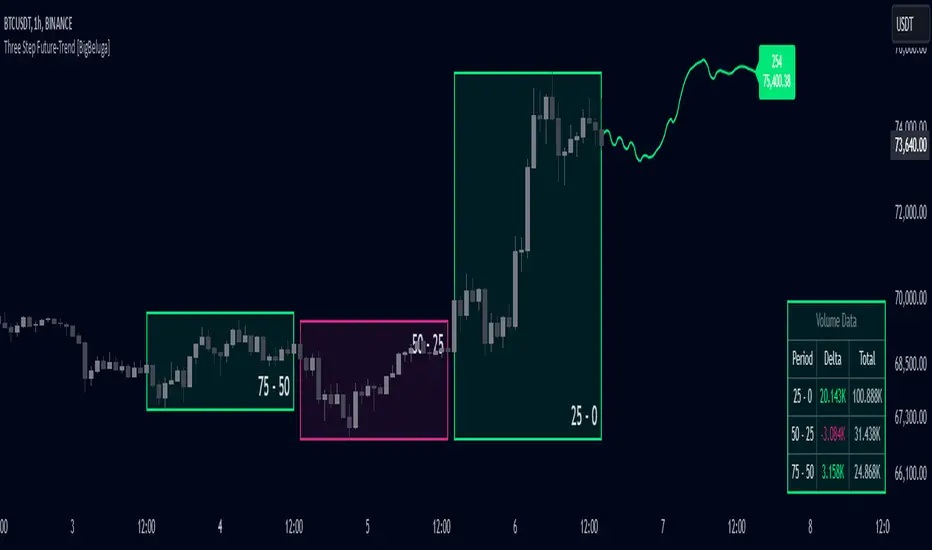
Three Step Future-Trend [BigBeluga]Three Step Future-Trend by BigBeluga is a forward-looking trend analysis tool designed to project potential future price direction based on historical periods. This indicator aggregates data from three consecutive periods, using price averages and delta volume analysis to forecast trend movement and visualize it on the chart with a projected trend line and volume metrics.
🔵 Key Features:
Three Period Analysis: Calculates price averages and delta volumes from three specified periods, creating a consolidated view of historical price movement.
Future Trend Line Projection: Plots a forward trend line based on the calculated averag of three periods, helping traders visualize potential future price movement.
Avg Delta Volume and Future Price Label: Shows a delta average Volume a long with a Future Price label at the end of the projected trend line, indicating the possible future delta volume and future Price.
Volume Data Table: Displays a detailed table showing delta and total volume for each of the three periods, allowing quick volume comparison to support the projected trend.
This indicator provides a dynamic way to anticipate market direction by blending price and volume data, giving traders insights into both volume and trend strength in upcoming periods.
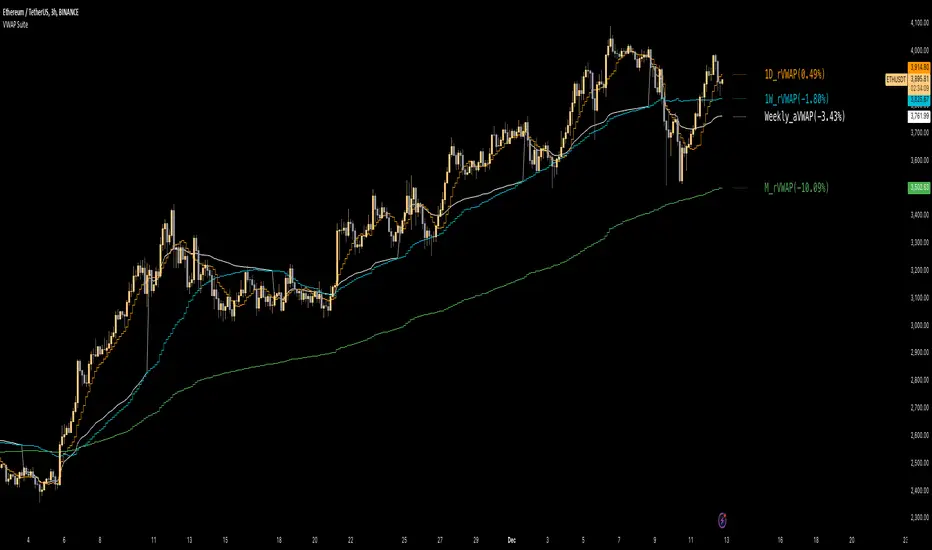
Multiple VWAP SuiteThe VWAP Suite is a tool I created to streamline VWAP analysis for traders. By integrating Anchored and Rolling VWAPs into a single indicator, it eliminates the need for multiple separate tools, keeping charts clean and organized without sacrificing flexibility or functionality. The goal was to simplify VWAP management by combining six different configurations into one intuitive and highly customizable indicator. It’s designed for traders who utilize VWAP-based strategies for trend analysis, support/resistance identification, or mean-reversion setups.
Features:
1. Integrated Anchored VWAPs:
Includes three customizable Anchored VWAPs, each tied to a specific timeframe such as Session, Weekly, Monthly, or even Decade.
Standard deviation bands can provide visual cues for dynamic support/resistance or volatility ranges.
Each VWAP can be toggled on/off and customized for color and band appearance.
2. Rolling VWAPs:
Includes three independently configurable Rolling VWAPs for dynamic timeframe analysis (Daily, Weekly, Monthly).
Rolling VWAPs feature optional deviation bands to gauge price action within a defined volatility range.
Smooth visualization using stepline plots for better trend identification.
3. Labeling System:
Labels show the VWAP levels and percentage deviations from the current price for easy reference.
Adjustable text size for improved chart readability.
4. Customizability:
Fully adjustable input sources for both Anchored and Rolling VWAPs, allowing you to tailor the indicator to your strategy.
Ability to enable or disable specific VWAPs, deviation bands, or labels depending on your focus.
Why Did I Make This?
Managing multiple VWAP indicators often leads to cluttered charts and inefficient workflows. I created the VWAP Suite to address this issue, combining Anchored and Rolling VWAPs into a single, powerful tool. Whether you’re a scalper, swing trader, or long-term trend follower, this script keeps everything you need in one place, simplifying your workflow and enhancing your ability to make informed trading decisions.
Feel free to comment any suggestions or questions! Enjoy!
Holding VolumeThe Holding Volume indicator calculates and visualizes the volume that corresponds specifically to the body of each candle, excluding the wicks (the upper and lower shadows of the candle).
This indicator can help traders better understand the strength of price movement during the trading session, as it isolates the volume that occurs when the price is moving within the body of the candle (between the open and close prices).
Key Features:
Volume Calculation: The indicator calculates the holding volume by taking the ratio of the candle's body range to its total range (including the wicks), and then multiplies that by the total volume of the candle.
Main Chart Display: The indicator is designed to be overlaid on the main chart, displaying the holding volume in a style similar to the default volume indicator.
Customizable Label Color: Customize the text color of the volume labels displayed on each candle.
Volume as Columns: The holding volume is shown as columns at the bottom of the chart, similar to the default volume display, for easy comparison and analysis.
How It Helps:
By focusing on the volume within the candle body, this indicator helps you see where the actual price movement and market participation occurred.
It can be useful for identifying candles with strong momentum or distinguishing between significant price movements and those driven by minor fluctuations or wicks.
Ideal Use Case:
Day traders, swing traders, and volume-focused traders can use this indicator to identify trends and analyze the strength of price moves.
This indicator is particularly useful when combined with other technical analysis tools to validate breakouts or reversals, based on the volume within the body of the candles.
Instructions:
No additional setup required: Simply add the indicator to your chart, and it will automatically display the holding volume on the main chart.
Adjust the label text color via the settings to match your chart's theme.

[AlbaTherium] Volume Venturius Premium Volume Venturius Premium
Introduction
The Volume Venturius Premium is an advanced market analysis tool designed to deeply investigate the behavior of active market participants. By focusing exclusively on executed market orders, Volume Venturius offers traders a unique perspective on buy and sell volumes. Unlike traditional order books that track passive orders, this indicator isolates active orders, shedding light on real market dynamics.
Chapter 1: Understanding Market Participants
1.1 Categories of Market Participants
Market participants can be classified into several categories based on their:
Size : The volume of trades executed.
Influence : Their ability to initiate bull or bear campaigns.
Strategy : The trading methods employed, such as scalping, swing trading, or high-frequency trading.
Objectives : Whether their focus is on speculation, hedging, or arbitrage.
Time Horizon : Short-term versus long-term goals.
Behavioral Patterns : Their reaction to liquidity levels or price movements.
1.2 Objectives of Market Participants
Each category pursues specific objectives, such as profit-making or risk management. Regulatory reports like the Commitment of Traders (COT) provide weekly insights into the positions and intentions of major players.
Chapter 2: The Philosophy of Volume Analysis
2.1 Active Orders vs. Passive Orders
Unlike passive orders waiting to be filled at specific prices, active orders directly impact market prices. By focusing on these executed orders, Volume Venturius Premium provides traders with actionable insights into market trends and momentum.
2.2 Wyckoff’s Market Dynamics
According to Wyckoff, markets operate in two primary phases:
Manipulation: Where large participants accumulate or distribute positions to prepare for a move.
Expansion: The phase where price trends begin to unfold, either in a bullish or bearish direction.
Wyckoff’s theory emphasizes understanding how major players manipulate the market to identify accumulation or distribution zones. Volume Venturius Premium aids in pinpointing these manipulative actions by analyzing volume and order flow data.
Chapter 3: The Secrets of Order Flow and Volume
3.1 Unveiling Market Control
By studying the positioning and execution volumes of large players, traders can discern who holds control in the market. Volume Venturius Premium identifies the balance of power and tracks shifts that signal potential trend reversals.
3.2 Behavioral Patterns in Volume
Key metrics tracked by Volume Venturius Premium include:
Volume Clusters : Areas of concentrated buying or selling activity.
Directional Bias : Whether market participants are net buyers or sellers.
Momentum Shifts : Changes in execution speed and volume that may precede major moves.
3.2.1 Volume Clusters, Directional Bias and Directional Bias: Areas of Concentrated Buying or Selling Activity
Volume clusters play a crucial role in understanding market dynamics by highlighting areas where aggressive buying or selling activity is most concentrated. These clusters often serve as key decision zones, providing insights into potential reversals, breakouts, or continuations. To better visualize and interpret these zones, a distinct color-coding system has been implemented. Each color represents a specific market condition or level of activity, allowing for a more intuitive analysis of volume behavior and its influence on price movement.
Below is a detailed explanation of the color logic used to represent these clusters and their significance within the trading framework.
Color Interpretation and Meaning :
Extra Extreme Zones
These zones highlight areas where clusters of aggressive buyers or sellers are most heavily concentrated. They represent critical levels for identifying potential reversals or strong continuations.
Bright Red (#ff003c) : Represents extra-extreme sell zones, where aggressive sellers dominate.
Meaning: Indicates extreme selling pressure, often signaling potential exhaustion of sellers.
Bright Blue (#001eff) : Represents extra-extreme buy zones, where aggressive buyers are most active.
Meaning: Shows extreme buying pressure, possibly marking a saturation point for buyers.
Main Zones
These zones help identify key levels based on volume activity and well-defined clusters.
Dark Red (#d60033) : Represents strong selling pressure.
Orange (#ff8000) : Indicates significant selling pressure that begins to fade.
Yellow (#ffff00) : Represents moderate selling pressure, signaling a potential slowdown.
White (#ffffff) : Marks transition zones, which are interesting entry points for potential reversals or continuations.
Transition Zones (Frontier Zones)
These zones indicate intermediate movements and potential shifts in momentum.
Transparent Black (#000000, 50) : Represents transition areas, where the market tests boundaries between buyers and sellers.
Meaning: These are critical decision points.
Neutral Zone (Sea Zone)- Trend Zones
These zones represent more balanced market activity, where neither buyers nor sellers dominate clearly.
Transparent Green (#00e040, 25) : Indicates slight bullish activity in a neutral zone.
Transparent Red (#e01a00, 25) : Indicates slight bearish activity in a neutral zone.
This color logic allows you to pinpoint areas where volume clusters show a clear dominance, exhaustion, or optimal entry opportunities.
3.3 Divergences Between Price and Volume
Divergences between price and volume are critical for identifying key shifts in market sentiment. Volume Venturius Premium distinguishes two main types of divergences: Lack of Participation and Absorption, each offering valuable signals for potential reversals or continuations.
Lack of Participation
This divergence occurs when price movements are not supported by corresponding volume dynamics, signaling a reduction in activity from significant market participants.
1. Bullish Lack of Participation:
Characteristics : Price is making lower lows, but volume is making higher lows.
This indicates waning selling pressure as prices drop.
Inference : A potential bullish reversal may occur. Traders could consider looking for opportunities to go long.
2.Bearish Lack of Participation:
Characteristics : Price is making higher highs, but volume is making lower highs. This suggests diminishing buying pressure even as prices rise.
Inference : A potential bearish reversal might follow. Traders might position to go short.
Absorption
Absorption occurs when larger market participants neutralize the pressure from smaller participants, often leading to significant market moves.
1.Bullish Absorption:
Characteristics : Price is making higher bottoms, but volume is making lower bottoms.
This reflects sellers being trapped as their selling efforts are absorbed by larger buyers.
Inference : A potential upward breakout is likely. Traders may look for opportunities to go long.
2.Bearish Absorption:
Characteristics : Price is making lower tops, but volume is making higher tops. This indicates buyers being trapped as larger sellers absorb their buying activity.
Inference : A downward breakout is probable. Traders may consider positioning to go short.
Chapter 4: Practical Application and Trading Strategies
4.1 Leveraging Active Order Insights
Learn how to use Volume Venturius Premium to detect hidden accumulation or distribution phases. Strategies include identifying spikes in active volume that signal institutional participation.
4.2 Confirming Bull and Bear Campaigns
Gain confidence in detecting the early stages of bullish or bearish campaigns by analyzing the interplay between active orders and volume flow.
Chapter 5: Real-World Examples
5.1 Analyzing Market Manipulation
See how Volume Venturius Premium can reveal manipulation tactics employed by large players to trigger liquidity events.
5.2 Spotting Trends with Active Orders
Real-life scenarios demonstrate how the tool can be used to identify and ride the market’s dominant trend.
Conclusion
The Volume Venturius Premium is an indispensable tool for traders who seek to understand the underlying mechanics of market movement. By focusing on active order flows and drawing on Wyckoff’s principles, it provides unique insights into market manipulation and expansion phases. Whether you’re an intraday trader or a long-term strategist, this tool empowers you to anticipate market shifts and trade with confidence.
Stay tuned for updates as we continue to refine Volume Venturius Premium to further enhance your trading journey.

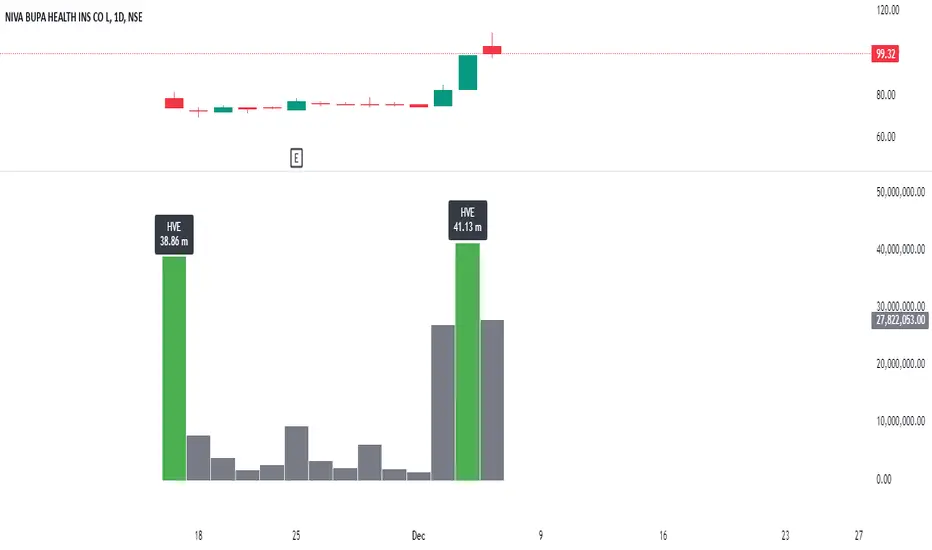
Highest Volume EverOverview:
The Highest Volume Ever (HVE) indicator highlights the highest volume bar in the visible chart history. It visually emphasizes significant volume spikes, helping traders identify key moments of market activity, such as breakout signals or accumulation phases.
Key Features:
Automatic Detection of Highest Volume:
The indicator dynamically scans the entire chart history to identify the bar with the highest trading volume, marking it with a clearly visible label.
Volume in Millions:
The label displays the highest volume in millions, providing a concise and readable format for better interpretation.
Adaptive Positioning:
The label is positioned slightly above the volume bar, ensuring it doesn't obstruct other chart elements while remaining close to the bar for easy reference.
Use Cases:
Identify Significant Market Activity: Detect periods of unusually high volume, often indicating the start of strong trends or the end of consolidations.
Confirm Breakouts: High volume often confirms the strength of breakout moves.
Spot Accumulation or Distribution: Unusually high volume can signal institutional buying or selling.
How to Use:
Add the indicator to your chart on TradingView.
The highest volume bar will be highlighted with a green bar and an "HVE" label above it.
Adjust the chart range to see how the indicator dynamically updates.
Perfect for:
Traders who rely on volume analysis to confirm price movements and detect significant market events.
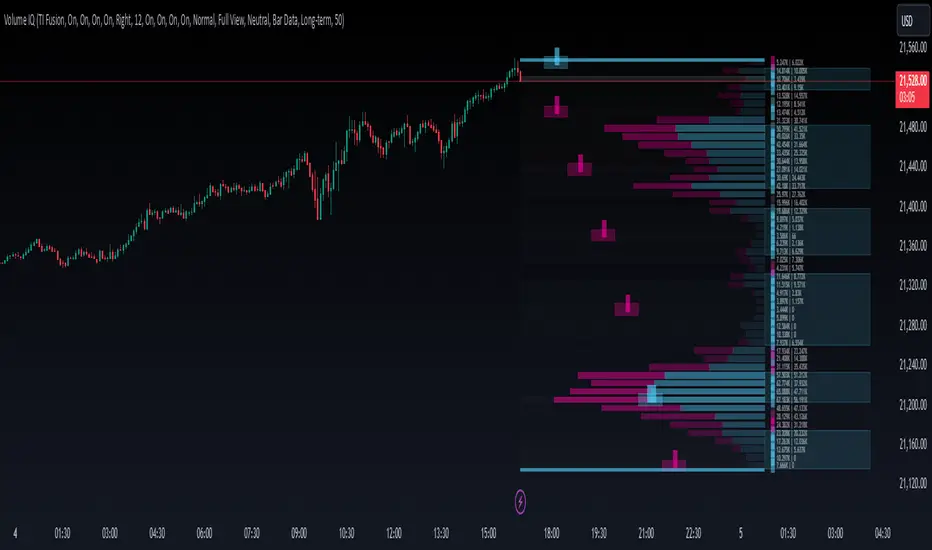
Volume IQOverview
Volume IQ is meant to be the ‘intelligent volume distribution analyzer’ that takes much of the work of interpreting volume profiles off of your shoulders. It attempts to ‘do the technical analysis’ of volume data for you, with its capstone feature being "Trading Action Zones": ranges on the chart whose placement are determined by high and low volume nodes and sentiment analysis, and their adapting range affected by current volatility. These zones are meant to offer practical levels for potential entries, exits, targets, and stops while trading. These zones are the cherry on top of other useful and original features like visuals for grouping areas of similar buy/sell bias.
Originality and Usefulness
Volume IQ stands out for its originality by offering a data-driven approach to interpreting volume profiles and presenting its analysis on the chart. Unlike traditional volume profiles, Volume IQ automates much of the volume analysis process, helping traders identify potential opportunities and key trading areas with minimal effort. Its unique "Trading Action Zones" leverage high and low volume nodes, sentiment analysis, and current volatility to highlight practical levels for entries, exits, targets, and stops. Additionally, the tool provides grouped bias visuals, gradient coloring, and flexible customization options, allowing traders to gain a clearer understanding of market sentiment and structure. By simplifying complex volume data into actionable insights, Volume IQ provides a valuable and efficient resource for charting on TradingView.
The ‘Capstone’ Feature:
Trading ‘Action Zones’: Potential areas to take trading action based on built-in interpretations of high-volume nodes, low-volume nodes, and overarching chart sentiment (whose calculation is described below), and their interplay. Categorized by tiers - with Tier 2 zones intended as potential entry areas, and Tier 1 zones for exits or adds. These zones can also present logical areas to consider targets and stops, for example placing a stop loss in a Tier 1 sell zone below price where there is a series of low-volume nodes and potentially not much support. These zones help you quickly identify potential areas on the chart to ‘take action’.
Key Features:
Level and Block Biases: By estimating buying and selling volume, as well as leveraging intrabar data, the Volume IQ profile provides detailed buy/sell sentiment at individual price levels. It then groups together consecutive price levels with the same bias into what we call ‘Block Biases’ making it easy to determine larger price areas with distinct buying or selling pressure.
Chart Sentiment Analysis: A ‘continuously optimizing algorithm’ configured to find high average runups after a sentiment switch powers what we call ‘bias guidelines’ which border the Volume IQ profile and influence the determination of Action Zones. This algorithm is based on comparing many combinations of volume-weighted trends, largely based on smoothed volume weighted moving averages, on each bar, to ensure that the approach with the highest average runup amongst the combinations is used.
Zones of Control: A gradient-coloring approach to the profile highlighst areas of influence at a glance, making it easier to focus on key price levels.
Broad Compatibility: Works across all chart timeframes and market types - so long as volume data and OHLC candle data is available.
Highly Customizable: Configure features to align with your trading preferences and workflow. Show them all, or pick and choose the ones you want.
Settings
Use a Color Theme: Toggle between our predefined color themes or customize your own.
Style: Select your preferred color theme (e.g., "TI Fusion").
Colors (When Not Using a Theme): Customize primary, secondary, and background colors for your own non-theme styling.
Gradient Coloring: Enable or disable gradient shading of the profile for visual enhancement of zones with high control and low control.
Action Zones: Turn trading action zones on or off to highlight key trading levels.
Time Staggering: Enabling this option will simply ‘stagger’ the display of action zones horizontally. Zones closer to price will be placed leftwards, and as they become more distant from price, they will be ‘staggered out’ rightwards, to give an intuitive feel for the time it may take for price to reach these zones.
Tier Labels: Enable or disable the ‘tier labels’ (1 square for Tier 1, 2 squares for Tier 2) for action zones.
Bias Blocks: Toggle the display of grouped buy/sell bias blocks.
Extend: Choose how the bias blocks are displayed: “Left” to stretch them from the end to the beginning of the histogram, “Right” to extend from the end outwards, and “Across” to extend from the beginning to outwards past the end, enveloping the bias and volume count labels.
Opacity: Adjust the transparency level of bias blocks (0–100).
Level Bias Labels: Turn on/off labels for individual price level biases.
Bias Guidelines: Enable the visual guidelines for bias levels which border the profile.
Volume Counts: Toggle volume count labels for each of the profile’s price levels.
Split Buy/Sell Volume: Enable separate display of buy and sell volume for each level (buy volume on the left, sell volume on the right).
Font Size: Adjust the font size for these labels.
Histogram Display: Choose the display option for the histogram bars of the profile themselves: "Full View" will display the profile, and “None” will hide it.
BG Shading Logic: Adjust the background shading logic for the display: “Neutral” will use the ‘Neutral Color’ from your color theme to put some emphasis around high and low volume nodes, while “None” will remove any background shading.
Detail: This option allows you to set the granularity of the volume data used: “Bar Data” will simply use the bar data from the chart timeframe, while “Intrabar Data” will attempt to use bar data from a lower timeframe. Please note that using intrabar data may not be available with your TradingView subscription on some timeframes, and also that using intrabar data may increase calculation time.
Data Request: Choose the lookback for the volume distribution: "Long-term" will look back 500 bars, and “Short-Term” will halve this.
# of Levels: Specify the number of levels/rows to display for visualizing the distribution.
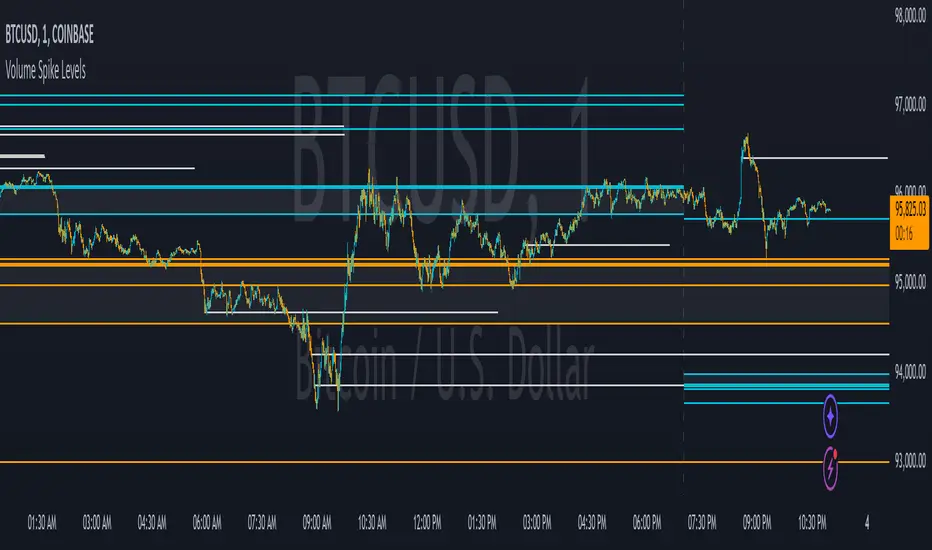
Volume Spike LevelsThis trading indicator finds specific high volume patterns that we have found to be the most likely to act as strong support and resistance levels and plots them on the chart. Using those high probability levels, the indicator will show lines in real time, as well as lines and important zones at the beginning of higher time frames to give you specific levels and areas where price is likely to react.
The most important volume zone for each time frame will have a color fill between the top and bottom lines of that high probability zone so you know to pay extra close attention to that area and look for price reactions there. If you can be patient enough to wait for price to hit these important areas and start to reverse, you will get great entries and help keep yourself from overtrading.
The levels shown can be adjusted to suit your preference, allowing you to get the right amount of levels for your trading strategy, whether that be scalping the 1 minute chart or long term investing via the daily chart.
HOW TO USE
For best results with this indicator, look for 2 types of setups. The first setup is a continuation bounce. You should be looking for these when price has broken out of its recent trading range either to the upside or the downside. When price is extending like this, look to take entries once a volume spike level shows up on the chart and price retraces back to that level. Then take your entry in the same direction as the trend. You can scalp quick wins this way, or you can wait for the next volume spike level to show up and price can’t hold that level any more, then get out. Place your stop loss just beyond the pivot that bounced off of the volume level.
The second type of setup you should look for is a reversal setup. This setup should be used when the market is ranging. Look for the top and bottom of the recent range and find the volume spike levels near the top or bottom of that range and wait for price to reach those levels. Once price hits that level and starts to show a reversal in price, take your entry. You can take quick scalps from those reversals for quick wins, or you can wait for price to reach the next major volume spike level and get out there or just before it. Place your stop loss just beyond the pivot that price made at the volume spike level where you entered your trade.
No matter which setup you are trading, it is never a bad idea to trail your stop loss as price moves towards your take profit level. Whatever volume spike timeframes you are using for your overall trend, you can use a lower time frame volume spike level to give you price points to trail your stop loss to there once price gets supportive at those levels and moves past them.
You should also pay close attention to how price reacts to the important volume zones shown. Many times, price will range inside or near these zones for a while and then form an accumulation just above or below that zone. When this happens, it is likely that price will start to move quickly in the direction that price moved away from that important zone. So when you see the price range inside of these zones and then go just beyond the zone on either side and accumulate, look to trade that breakout of the zone in the same direction that it moved away from the zone.
Note that on lower time frame charts, you will not be able to get some higher time frame levels because Tradingview limits the number of historical bars it can calculate on. So if you are on the 1-5 minute chart, you won’t be able to get yearly or quarterly levels late in the year/quarter due to the number of bars it has to calculate for those levels to populate is beyond the number of allowed bars. You can work around this by manually going to the daily chart and getting the yearly levels and drawing a horizontal line on your chart at the levels shown so that you still have those levels on your lower time frame charts. Unfortunately there is no way for us to work around this with code.
Each setting in the settings panel has a tooltip that will explain that specific setting so you understand how to use it. Just hover your mouse over the “i” icon and it will show a popup with the info. For the non-real time levels, the daily level settings will have the tooltips explaining everything and that info applies to all of the non-real time levels.
MODES
The indicator has two different modes you can use that will affect how the real time levels show up on your chart but will not affect the higher time frame levels. The default mode will give you static horizontal lines only. This means that when a high probability volume spike level comes in, a horizontal line will be drawn and will extend as long as the timeframe that the level is set to. For example a 60 minute volume spike time frame will extend the line for 60 minutes on the chart and then end. These lines will be drawn individually and will not update.
The second mode will give you variable lines and will show a color fill based on where price is in relation to all of the real time levels that are turned on. So if the price is above a level, it will color the background green and if the price is below a level, it will color the background red. This helps identify the trend of price compared to where the high probability volume spike levels came in so you can trade in the direction of the trend. With this mode, the lines for each time frame will update to the new level when a new volume spike for that time frame happens.
ALERTS
The indicator has alerts programmed for each different type of volume spike level that is available to add to your chart. So you can set an alert for when a new volume spike happens on any of the real time volume spike time frames, when price crosses the most recent real time volume spike level for each time frame, alert when any real time volume spike happens, alert when price crosses any of the higher time frame volume levels and also when price has crossed the upper or lower level of any of the important volume zones. Each alert is labeled the same as in the indicator settings so you can easily select which one you want.
For alerts to work properly, you have to have the levels turned on for whatever alerts you use. For example if you want an alert for Realtime 2 Volume Spikes, the Realtime 2 Volume Spike Levels must be turned on and shown on your chart.
Note that when using the alerts for price crossing a level, it will only alert when price crosses the most recent volume spike level. It will not alert when price crosses a previous level of the same time frame.
CUSTOMIZATION
You can customize nearly every feature of this indicator to tailor it to your specific trading style. Some of the customizable features are as follows: turn on or off labels for each time frame, turn on or off the color fills for important volume zones for each time frame, turn on or off the levels for each time frame, adjust the number of previous levels shown for each time frame, change the length of the lines for each time frame, extend the lines right for each time frame, change the color of the lines for each time frame, adjust the color fill colors for important volume zones, adjust the label colors and adjust the label offset length.
We also included some master settings to allow you to control various settings across all time frames with one click. These settings are as follows: turn on or off all labels, turn on or off all realtime levels, remove all lines except the most important volume zone on every time frame, turn on or off all color fills of important zones, adjust the background color fill of the trend coloring when set to variable lines and adjust the background color of all important zones.
There is also a feature that may need to be adjusted when you are looking at charts that do not have a lot of historical data. It will say the index is out of bounds, so look at the index number that the error shows by hovering over the red exclamation point next to the indicator name and adjust the setting labeled “Bar Index Threshold To Fix Errors” to a number that is slightly higher than the index number in the error message. This will fix the error by changing the calculations slightly to adjust for the bar indexes of that specific chart.
MARKETS IT CAN BE USED ON
This indicator can be used on any market that has volume data, including stocks, crypto, futures, forex and more.
TIME FRAMES IT CAN BE USED ON
This indicator has been programmed to work on the following time frames: 15 seconds, 30 seconds, 1 minute, 2 minute, 3 minute, 4 minute, 5 minute, 10 minute, 15 minute, 30 minute, 45 minute, 1 hour, 2 hour, 3 hour, 4 hour, 6 hour, 8 hour, 12 hour, 1 day, 2 day, 3 day, 1 week, 2 week, 1 month, 3 month and 1 year.
If you use a different time frame than shown above, you may get errors or irregular results, so please stick to the time frames that the trading indicator has been programmed to work correctly with.
Abnormal volume [VG]🪙 INTRODUCTION
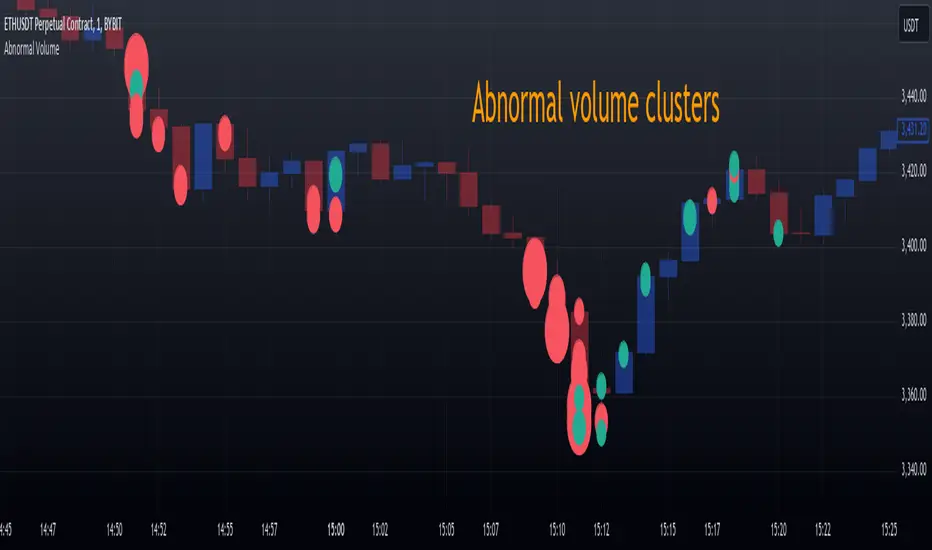
This technical indicator helps identify and highlight large volume clusters on the chart.
Abnormal volume refers to unusually large accumulations of volume over short time intervals. Such clusters appear when the amount of assets bought or sold significantly exceeds typical volumes for a specific asset over a given period. These patterns can indicate significant events or intentions of market participants.
Reasons for abnormal volume clusters:
Institutional investments :
Large investment funds and banks may buy or sell significant volumes of assets to rebalance their portfolios.
Impact of news and events :
Important news (e.g., mergers, bankruptcies, management changes) can trigger large-scale buying or selling of assets.
Market manipulation :
Big players may execute large trades to artificially create demand or supply for an asset, affecting its price in the short term.
Insider trading :
Abnormal volumes may signal that someone with insider information has started buying or selling assets in anticipation of future events that could impact the price.
What do abnormal volume clusters mean for traders?
A signal of potential price changes :
High trading volumes are often accompanied by sharp price movements. An increase in volume during price growth might indicate rising interest in the asset, while an increase during a decline could signal a sell-off.
Potential entry or exit points :
For short-term traders, abnormal trades can serve as signals to enter or exit positions. For example, a large volume growth accompanied by a breakout of a key level might be seen as a buy signal.
Caution due to potential manipulation :
Abnormal trades don’t always lead to expected outcomes. Sometimes, they are part of a price manipulation strategy, so it’s essential to consider the broader context and confirm with other signals.
🪙 USAGE
This indicator doesn’t provide trading signals, entry points, or actionable recommendations.
Instead, it simplifies tracking market dynamics and highlights unusual activity worth considering during analysis.
After adding the indicator to the chart, you only need to configure two parameters: the threshold value that determines what constitutes a significant volume cluster and the period over which volumes are aggregated for comparison against the threshold.
It’s recommended to use the shortest available period, as this helps more precisely identify the prevailing volume direction (since this depends on price changes, not trade direction).
The threshold value can be fine-tuned by switching the chart’s timeframe to match the selected period, observing of the significant volume increase on the classic volume histogram, and noting the corresponding market reactions. This allows for selecting a threshold that highlights early signs of impactful trading events on higher timeframes.
Let’s look at an example in the screenshot:
Once the parameters are set, you can also enable an alert to trigger whenever a new volume cluster appears, simplifying event tracking.
Note: in the current version of the indicator, the alert will be triggered only once per bar on the chart at the first detected cluster of abnormal volume.
🪙 IMPLEMENTATION
Technically, the script retrieves volume data from a lower timeframe and estimates whether the volume was primarily generated by buyers or sellers based on price movements.
The lower resolution timeframe is determined as follows:
if the settings base period is less than 1 minute, then the data timeframe will be equal to 1 second
if the settings base period is equals 1 minute or more, then the data timeframe will be equal to 1 minute
The algorithm checks whether the price increased or decreased at each point. If the price rose, the volume is presumed to be driven by buyers and marked as buy volume; otherwise, it’s marked as sell volume.
The total volume at each point is then checked against the user-defined threshold. If the volume exceeds the threshold, a corresponding circle is drawn on the chart, and an alert is generated if created.
The size of the visual representation is proportional to the most recent maximum volume and follows the rules below:
Percentage of max volume -> Volume cluster size
less than 25% -> Tiny
25% to 50% -> Small
50% to 75% -> Normal
75% to 100% -> Large
100% or more -> Huge
🪙 SETTINGS
The indicator is designed to be as simple and minimalist as possible, making configuration effortless. There are only two core parameters, with additional options to customize the colors of volume clusters based on their type.
Trade volume threshold
Defines the volume level above which a cluster is considered significant and displayed on the chart as a circle. The size of the circle depends on the proportion of the current volume relative to the most recent maximum over the chosen period.
Trades base period
Specifies the period for aggregating trade volumes to determine whether they qualify as abnormal. The significance level is set using the Trade volume threshold parameter.
Buy/Sell trades
Allows you to set the colors for abnormal volume circles based on the price direction during cluster formation.
🪙 CONCLUSION
Abnormal volume clusters are always a critical indicator requiring attention and analysis, but they are not a guaranteed predictor of trend changes.
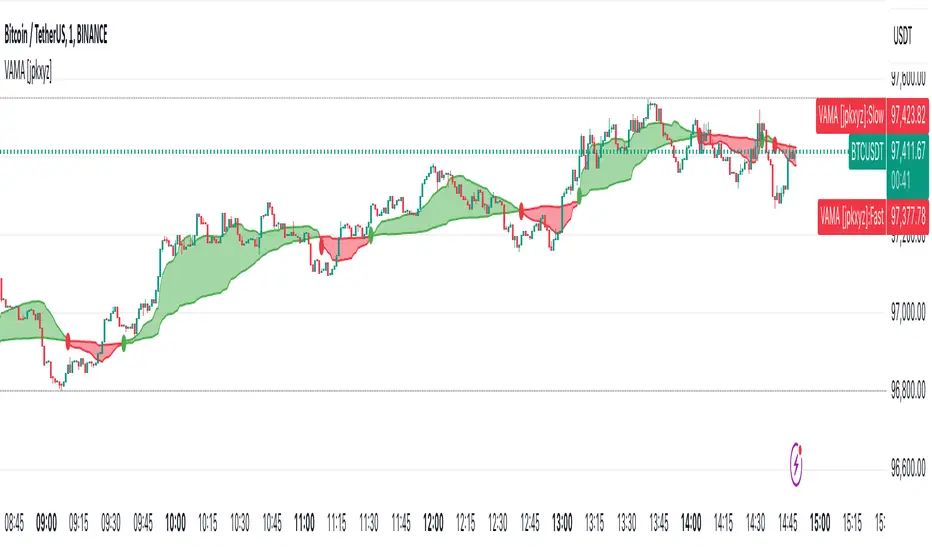
VAMA - Volume Adjusted Moving Average [jpkxyz]VAMA is a moving average that adapts to volume, giving more weight to price movements backed by higher relative volume. This VAMA (Volume Adjusted Moving Average) indicator implementation emphasizes visual clarity. It is based on the VAMA script by @allanster
Dual VAMA lines (Fast/Slow) with dynamic coloring:
Single-color scheme switches between green (bullish) and red (bearish)
Color changes on crossovers rather than relative position
Configurable line widths (set to 1 for clean appearance)
Visual enhancements:
Optional fill between VAMA lines (50% transparency)
Crossover dots can be toggled
Fills and dots match the current trend color
Customization parameters:
Independent source inputs for Fast/Slow lines
Adjustable VI Factor (volume influence)
Sample size control
Strict/non-strict calculation toggle
The code maintains efficient computation while prioritizing visual feedback for trend changes. It's designed for clear signal identification without visual clutter.
Notable style choices:
Consistent color theming throughout all visual elements
Simplified color transitions (only at crossovers)
Subtle transparency for fill areas
Minimal dot size for crossover markers
VAMA (Volume Adjusted Moving Average) Technical Analysis:
Core Calculation:
1. Volume Influence (v2i):
v2i = volume / ((total_volume/total_periods) * volume_factor)
- total_volume: Sum of volume over sample period
- total_periods: Either full history (nvb=0) or specified sample size
- volume_factor: Controls sensitivity to volume deviation
2. Price Weighting:
weighted_price = source_price * v2i
3. Accumulation Process:
- Iterates through length*10 periods
- Accumulates weighted prices and volume influence values
- Continues until volume influence sum >= specified length or strict rule triggers
4. Final VAMA Value:
vama = (weighted_sum - (volume_sum - length) * last_price) / length
Parameters:
- SampleN: Historical reference length (0=full history)
- Length: Base period for calculation
- VI Factor: Volume influence multiplier (>0.01)
- Strict: Forces exact length period completion when true
- Source: Input price data
simple swing indicator-KTRNSE:NIFTY
1. Pivot High/Low as Lines:
Purpose: Identifies local peaks (pivot highs) and troughs (pivot lows) in price and draws horizontal lines at these levels.
How it Works:
A pivot high occurs when the price is higher than the surrounding bars (based on the pivotLength parameter).
A pivot low occurs when the price is lower than the surrounding bars.
These pivots are drawn as horizontal lines at the price level of the pivot.
Visualization:
Pivot High: A red horizontal line is drawn at the price level of the pivot high.
Pivot Low: A green horizontal line is drawn at the price level of the pivot low.
Example:
Imagine the price is trending up, and at some point, it forms a peak. The script identifies this peak as a pivot high and draws a red line at the price of that peak. Similarly, if the price forms a trough, the script will draw a green line at the low point.
2. Moving Averages (20-day and 50-day):
Purpose: Plots the 20-day and 50-day simple moving averages (SMA) on the chart.
How it Works:
The 20-day SMA smooths the closing price over the last 20 days.
The 50-day SMA smooths the closing price over the last 50 days.
These lines provide an overview of short-term and long-term price trends.
Visualization:
20-day SMA: A blue line showing the 20-day moving average.
50-day SMA: An orange line showing the 50-day moving average.
Example:
When the price is above both moving averages, it indicates an uptrend. If the price crosses below these averages, it might signal a downtrend.
3. Supertrend:
Purpose: The Supertrend is an indicator based on the Average True Range (ATR) and is used to track the market trend.
How it Works:
When the market is in an uptrend, the Supertrend line will be green.
When the market is in a downtrend, the Supertrend line will be red.
Visualization:
Uptrend: The Supertrend line will be plotted in green.
Downtrend: The Supertrend line will be plotted in red.
Example:
If the price is above the Supertrend, the market is considered to be in an uptrend, and if the price is below the Supertrend, the market is in a downtrend.
4. Momentum (Rate of Change):
Purpose: Measures the rate at which the price changes over a set period, showing if the momentum is positive or negative.
How it Works:
The Rate of Change (ROC) measures how much the price has changed over a certain number of periods (e.g., 14).
Positive ROC indicates upward momentum, and negative ROC indicates downward momentum.
Visualization:
Positive ROC: A purple line is plotted above the zero line.
Negative ROC: A purple line is plotted below the zero line.
Example:
If the ROC line is above zero, it means the price is increasing, suggesting bullish momentum. If the ROC is below zero, it indicates bearish momentum.
5. Volume:
Purpose: Displays the volume of traded assets, giving insight into the strength of price movements.
How it Works:
The script will color the volume bars based on whether the price closed higher or lower than the previous bar.
Green bars indicate bullish volume (closing price higher than the previous bar), and red bars indicate bearish volume (closing price lower than the previous bar).
Visualization:
Bullish Volume: Green volume bars when the price closes higher.
Bearish Volume: Red volume bars when the price closes lower.
Example:
If you see a green volume bar, it suggests that the market is participating in an uptrend, and the price has closed higher than the previous period. Red bars indicate a downtrend or selling pressure.
6. MACD (Moving Average Convergence Divergence):
Purpose: The MACD is a trend-following momentum indicator that shows the relationship between two moving averages of the price.
How it Works:
The MACD Line is the difference between the 12-period EMA (Exponential Moving Average) and the 26-period EMA.
The Signal Line is the 9-period EMA of the MACD Line.
The MACD Histogram shows the difference between the MACD line and the Signal line.
Visualization:
MACD Line: A blue line representing the difference between the 12-period and 26-period EMAs.
Signal Line: An orange line representing the 9-period EMA of the MACD line.
MACD Histogram: A red or green histogram that shows the difference between the MACD line and the Signal line.
Example:
When the MACD line crosses above the Signal line, it’s considered a bullish signal. When the MACD line crosses below the Signal line, it’s considered a bearish signal.
Full Chart Example:
Imagine you're looking at a price chart with all the indicators:
Pivot High/Low Lines are drawn as red and green horizontal lines.
20-day and 50-day SMAs are plotted as blue and orange lines, respectively.
Supertrend shows a green or red line indicating the trend.
Momentum (ROC) is shown as a purple line oscillating around zero.
Volume bars are green or red based on whether the close is higher or lower.
MACD appears as a blue line and orange line, with a red or green histogram showing the MACD vs. Signal line difference.
How the Indicators Work Together:
Trend Confirmation: If the price is above the Supertrend line and both SMAs are trending up, it indicates a strong bullish trend.
Momentum: If the ROC is positive and the MACD line is above the Signal line, it further confirms bullish momentum.
Volume: Increasing volume, especially with green bars, suggests that the trend is being supported by active participation.
By using these combined indicators, you can get a comprehensive view of the market's trend, momentum, and potential reversal points (via pivot highs and lows).

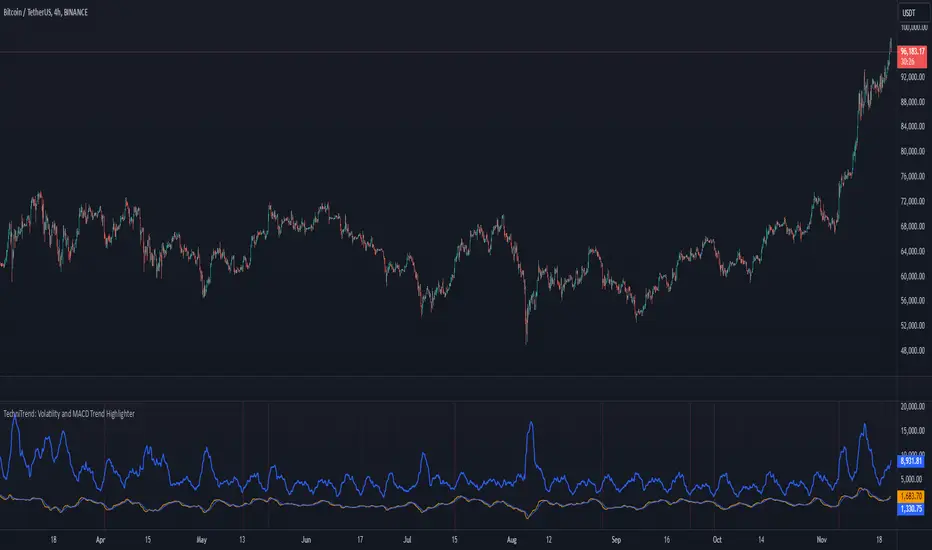
TechniTrend: Volatility and MACD Trend Highlighter🟦 Overview
The "Candle Volatility with Trend Prediction" indicator is a powerful tool designed to identify market volatility based on candle movement relative to average volume while also incorporating trend predictions using the MACD. This indicator is ideal for traders who want to detect volatile market conditions and anticipate potential price movements, leveraging both price changes and volume dynamics.
It not only highlights candles with significant price movements but also integrates a trend analysis based on the MACD (Moving Average Convergence Divergence), allowing traders to gauge whether the market momentum aligns with or diverges from the detected volatility.
🟦 Key Features
🔸Volatility Detection: Identifies candles that exceed normal price fluctuations based on average volume and recent price volatility.
🔸Trend Prediction: Uses the MACD indicator to overlay trend analysis, signaling potential market direction shifts.
🔸Volume-Based Analysis: Integrates customizable moving averages (SMA, EMA, WMA, etc.) of volume, providing a clear visualization of volume trends.
🔸Alert System: Automatically notifies traders of high-volatility situations, aiding in timely decision-making.
🔸Customizability: Includes multiple settings to tailor the indicator to different market conditions and timeframes.
🟦 How It Works
The indicator operates by evaluating the price volatility in relation to average volume and identifying when a candle's volatility surpasses a threshold defined by the user. The key calculations include:
🔸Average Volume Calculation: The user selects the type of moving average (SMA, EMA, etc.) to calculate the average volume over a set period.
🔸Volatility Measurement: The indicator measures the body change (difference between open and close) and the high-low range of each candle. It then calculates recent price volatility using a standard deviation over a user-defined length.
🔸Weighted Index: A unique index is created by dividing price change by average volume and recent volatility.
🔸Highlighting Volatility: If the weighted index exceeds a customizable threshold, the candle is highlighted, indicating potential trading opportunities.
🔸Trend Analysis with MACD: The MACD line and signal line are plotted and adjusted with a user-defined multiplier to visualize trends alongside the volatility signals.
🟦 Recommended Settings
🔸Volume MA Length: A default of 14 periods for the average volume calculation is recommended. Adjust to higher periods for long-term trends and shorter periods for quick trades.
🔸Volatility Threshold Multiplier: Set at 1.2 by default to capture moderately significant movements. Increase for fewer but stronger signals or decrease for more frequent signals.
🔸MACD Settings: Default MACD parameters (12, 26, 9) are suggested. Tweak based on your trading strategy and asset volatility.
🔸MACD Multiplier: Adjust based on how the MACD should visually compare to the average volume. A multiplier of 1 works well for most cases.
🟦 How to Use
🔸Volatile Market Detection:
Look for highlighted candles that suggest a deviation from typical price behavior. These candles often signify an entry point for short-term trades.
🔸Trend Confirmation:
Use the MACD trend analysis to verify if the highlighted volatile candles align with a bullish or bearish trend.
For example, a bullish MACD crossover combined with a highlighted candle suggests a potential uptrend, while a bearish crossover with volatility signals may indicate a downtrend.
🔸Volume-Driven Strategy:
Observe how volume changes impact candle volatility. When volume rises significantly and candles are highlighted, it can suggest strong market moves influenced by big players.
🟦 Best Use Cases
🔸Trend Reversals: Detect potential trend reversals early by spotting divergences between price and MACD within volatile conditions.
🔸Breakout Strategies: Use the indicator to confirm price breakouts with significant volume changes.
🔸Scalping or Day Trading: Customize the indicator for shorter timeframes to capture rapid market movements based on volatility spikes.
🔸Swing Trading: Combine volatility and trend insights to optimize entry and exit points over longer periods.
🟦 Customization Options
🔸Volume-Based Inputs: Choose from SMA, EMA, WMA, and more to define how average volume is calculated.
🔸Threshold Adjustments: Modify the volatility threshold multiplier to increase or decrease sensitivity based on your trading style.
🔸MACD Tuning: Adjust MACD settings and the multiplier for trend visualization tailored to different asset classes and market conditions.
🟦 Indicator Alerts
🔸High Volatility Alerts: Automatically triggered when candles exceed user-defined volatility levels.
🔸Bullish/Bearish Trend Alerts: Alerts are activated when highlighted volatile candles align with bullish or bearish MACD crossovers, making it easier to spot opportunities without constantly monitoring the chart.
🟦 Examples of Use
To better understand how this indicator works, consider the following scenarios:
🔸Example 1: In a strong uptrend, observe how volume surges and volatility highlight candles right before price consolidations, indicating optimal exit points.
🔸Example 2: During a downtrend, see how the MACD aligns with volume-driven volatility, signaling potential short-selling opportunities.
Noise Footprint ImbalanceNoise Footprint Imbalance Indicator
The Noise Footprint Imbalance Indicator highlights areas of imbalance in price action, marking potential zones of support and resistance. This indicator helps traders visualize "footprints" of imbalance on the chart, allowing for better identification of areas where price moves significantly away from equilibrium. This can help traders pinpoint potential reversal points or zones where buyers or sellers may step in.
Features
Customizable Box Count: Choose the maximum number of imbalance zones displayed on the chart, keeping your workspace clear and focused.
Imbalance Detection: Highlights both top and bottom imbalances, identifying them based on price discrepancies between open/close and high/low levels.
Dynamic Zone Boxes: Draws boxes around imbalance zones with customizable colors and transparency, providing visual clarity without overwhelming the chart.
Usage
This indicator is beneficial for traders who:
Use imbalance zones as potential areas of interest for entries or exits.
Want to combine it with other indicators or price action analysis to improve trade setups.
Customization Options
Maximum Imbalance Zones: Adjusts the maximum number of imbalance boxes shown.
Imbalance Box Color: Customize the color and transparency of the imbalance zones to suit your chart's theme.
Add this script to your chart to enhance your technical analysis and bring more structure to your trading approach with the Noise Footprint Imbalance Indicator.

TechniTrend: Advance Custom Candle Finder (CCF)🟦 Description:
The TechniTrend: Advanced Custom Candle Finder (CCF) is a versatile tool designed to help traders identify custom candlestick patterns using various configurable criteria. This indicator provides a flexible framework to filter and highlight specific candles based on volume, volatility, candle characteristics, and other important metrics. Below is a detailed explanation of each filter and its customization options:
🟦 Volume-Based Filters
🔸Volume Spike Filter:
Enable filtering based on volume spikes. Use the Volume Spike Multiplier to define what constitutes a significant increase in volume compared to the average. A spike indicates unusually high trading interest.
🔸Volume Range Filter:
Filter candles based on specific volume ranges. Set Minimum Volume and Maximum Volume thresholds to isolate candles with trading volumes within your desired boundaries.
🟦 Candle Body & Wick Filters
🔸Body Size Filter:
Filter candles based on the size of their body. A Body Size Multiplier determines what is considered a large body relative to historical averages.
🔸Body Percentage Filter:
Filter based on the proportion of the body to the entire candle size. Use the Body Percentage Threshold to highlight candles where the body makes up a certain percentage of the total candle range.
🔸Wick-to-Body Ratio Filter:
Identify candles with specific wick-to-body ratios. A higher Wick-to-Body Ratio can indicate indecision or reversals.
🟦 Volatility & Range Filters
🔸Volatility Filter:
Highlight candles based on price changes relative to volume. The Volatility Multiplier sets the threshold for what is considered a volatile candle.
🔸Candle Range Filter:
Filter based on the range (High - Low) of each candle. Use Minimum Candle Range and Maximum Candle Range to specify your desired candle size in points or pips.
🔸Short-Term and Long-Term Volatility Filters:
Analyze volatility over different periods. Enable Short-Term Volatility or Long-Term Volatility filters to compare recent volatility against historical averages, helping you detect sudden market shifts.
🟦 Candle Color & Open/Close Filters
🔸Candle Color Filter:
Filter based on the candle's color. Choose between Bullish (close > open) or Bearish (close < open) to focus on specific market sentiments.
🔸Open/Close Price Range Filter:
Filter based on the difference between the open and close prices. Use Minimum Open/Close Range and Maximum Open/Close Range to specify your acceptable range in price movements.
🟦 Core Functionality
The CCF indicator combines these filters to provide a final signal whenever a candle meets all the enabled criteria. By default, it highlights any qualifying candle directly on the chart and changes the background color for added visibility.
🟦 Key Features:
🔸Highly Customizable Filters: Adjust the parameters for each filter to tailor the indicator to your specific needs.
🔸Multiple Conditions: Combine several conditions to identify complex candlestick patterns.
🔸Real-Time Alerts: Receive instant notifications when a matching candle pattern is found based on your custom criteria.
🟦 How to Use:
🔸Enable the filters you wish to apply (e.g., Volume Spike, Candle Body Size, Volatility).
🔸Adjust the thresholds for each filter to fine-tune the pattern recognition criteria.
🔸Observe the chart to see visual cues for candles that match your specified conditions.
🟦 Notes:
🔸Ensure that you clearly understand each filter’s role. Over-filtering with very strict criteria may reduce the number of signals.
🔸This indicator is designed to be a customizable tool, not providing buy or sell recommendations.
🔸Use in combination with other analysis tools and indicators for the best results.

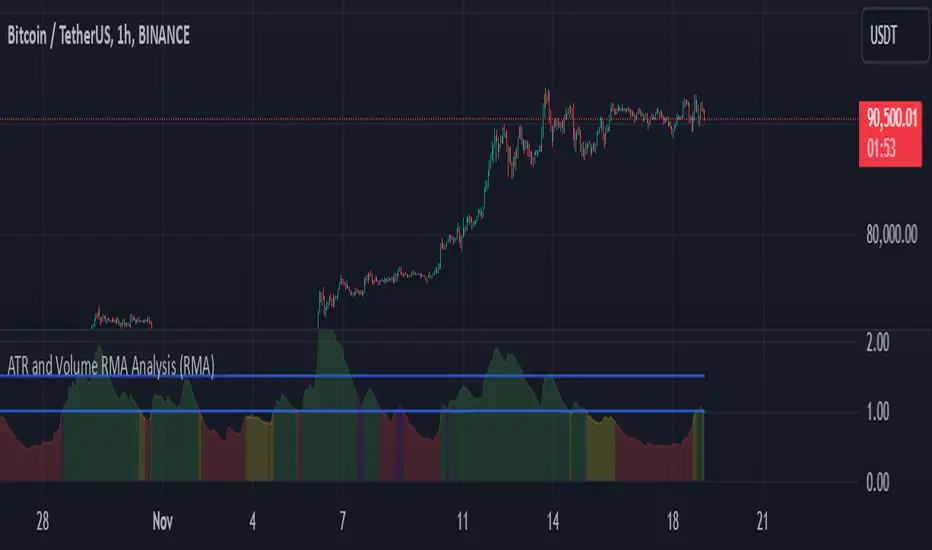
ATR and Volume AnalysisHi!
I would like to present an indicator that's meant to measure ratio of Volatility to Volume.
Basically it measures 2 moving averages (14 and 100 period) of ATR and Volume and then compares them. The output is ATR14 / Vol14
Color scheme
Red: Volume and ATR is both below 14 period
Green: Both are above
Yellow: Volume up, volatility down
Purple: Volume down, volatility up
Then there are two lines - 1 and 1.5
That is, in my opinion, the most optimal state to trade, because 1 means that there is some volatility and it's confirmed by volume. Above 1,5 you could see it as overbought (or oversold) zone. If it's above this line, we could expect a retracement since the volatility is not backed by volume. Above 2 it's quite critical and I would suggest closing trades.
(You can use it across all timeframes. In fact it's better if you do so. Longer timeframes are good for spotting tradeable markets while shorter timeframes show overbought / oversold zones)
I have also added option to choose between 4 different moving averages, but in my opinion RMA works the best.
Feel free to share some feedback, I would really appreciate it.
Sincerely,
Beefmaster
TechniTrendMasterIntroducing "TechniTrendMaster"
The TechniTrendMaster indicator is designed to bring clarity and depth to your trading strategy. This indicator combines robust trend analysis with volume insights, giving you a comprehensive view of the market’s pulse. Let's break down the features.
🔵 Analysis Mode
TechniTrendMaster's Analysis Mode provides various configurations tailored to specific market behaviors. Here are the options you can utilize:
🔹Strong Movements: Focuses on powerful market shifts, ideal for capturing major trend changes and high-momentum moves. Perfect for identifying strong breakout opportunities.
🔹Reversal: Detects potential turning points in the market, signaling when a trend might be about to change direction, allowing for well-timed entries and exits.
🔹Consolidations: Spots periods of low volatility where the market moves sideways, helping you avoid trading traps and anticipate breakout scenarios.
🔹Momentum-Driven: Prioritizes momentum in the market, identifying when the force behind price movement is accelerating or decelerating.
🔹Balanced: Offers a well-rounded view of the market by weighing both trend direction and volume equally, making it suitable for stable market conditions.
🔹Volatility Adapted: Adjusts to periods of increased or decreased volatility, providing accurate signals regardless of market conditions.
🔹Trend Confirmation: Confirms the strength and sustainability of a trend, allowing traders to enter trades with higher confidence.
🔹Short-Term Scalping: Tailored for traders who focus on Short-Term and Scalp trades, offering rapid insights for intraday or short-term trading strategies.
🔵 Trend Analysis Mode
The Trend Analysis Mode allows you to customize how trends are detected and analyzed:
🔹Default: A balanced mode for general use, offering reliable trend identification across different market conditions.
🔹Aggressive: A more sensitive setting that reacts quickly to market changes, ideal for traders looking to capitalize on smaller, quicker movements.
🔹Conservative: Takes a cautious approach, favoring long-term stability over short-term fluctuations, perfect for risk-averse traders.
🔹Volatility Aware: Focuses on adapting to volatility shifts, giving accurate trend signals even in erratic markets.
🔹Range Bound: Targets horizontal price movements and channel trades, helping traders take advantage of well-defined ranges.
🔵 Divergence
Divergence is a powerful tool within TechniTrendMaster, highlighting discrepancies between price movement and underlying volume. These differences can indicate potential reversals or trend continuations before they are visible on price charts alone.
🔵 Hidden Divergence
Hidden divergence is a subtle yet crucial signal that reveals when an existing trend might resume after a temporary correction. This mode provides early detection of trend continuity opportunities, giving traders a significant advantage in timing.
🔵 Divergence Mode
TechniTrendMaster includes different divergence detection settings to suit your analysis style:
🔹Standard: Captures typical divergence patterns for general analysis.
🔹Short-Term Focused: Concentrates on short-lived divergences, offering rapid detection of shifts for active traders.
🔹Long-Term Analysis: Highlights divergence in a broader context, which is better for understanding the overall market direction.
🔹High Sensitivity: Prioritizes capturing even the smallest shifts in the market, making it excellent for high-frequency trading or volatile environments.
🔹Low Sensitivity: Reduces market noise, only reacting to more significant changes in trend or volume. It’s perfect for traders who seek higher accuracy with fewer false signals.
🔵 Dynamic Channel
TechniTrendMaster features a Dynamic Channel, that automatically adapts to market conditions. This channel provides a visual guide to price action, adjusting in real-time based on current trends and volatility. It identifies key support and resistance zones, making it easier to spot breakouts, trend continuations, or potential reversals.
🔵 Volume Integration
Volume is a critical part of TechniTrendMaster, offering deeper insights beyond just price movement. By analyzing volume patterns alongside trends, the indicator highlights the strength and reliability of market shifts. This integration ensures that traders can distinguish between genuine movements backed by solid volume and weak trends that might not hold.
🔵 A Solution for All Trading Styles
TechniTrendMaster’s strength lies in its versatility. No matter your trading approach—be it scalping, swing trading, trend following, or range trading—this indicator adapts to your needs. Here's how it caters to different trader profiles:
🔹Scalpers get precise, quick-response insights through the Short-Term Scalping and High Sensitivity settings, helping them capture minute price movements.
🔹Swing Traders benefit from modes like Reversal, Balanced, and Momentum-Driven, which focus on identifying trends and shifts that occur over several days.
🔹Long-Term Investors will find the Conservative, Low Sensitivity, and Long-Term Analysis modes ideal for filtering noise and sticking to broader market trends.
🔹Volatility Traders can rely on the Volatility Adapted and Volatility Aware options to get accurate signals even during unpredictable periods.
🔓 Unlock Access :
Check out the Author's Instructions or Dm me to Unlock the Access.

Volume Flow ConfluenceVolume Flow Confluence (CMF-KVO Integration)
Core Function:
The Volume Flow Confluence Indicator combines two volume-analysis methods: Chaikin Money Flow (CMF) and the Klinger Volume Oscillator (KVO). It displays a histogram only when both indicators align in their respective signals.
Signal States:
• Green Bars: CMF is positive (> 0) and KVO is above its signal line
• Red Bars: CMF is negative (< 0) and KVO is below its signal line
• No Bars: When indicators disagree
Technical Components:
Chaikin Money Flow (CMF):
Measures the relationship between volume and price location within the trading range:
• Calculates money flow volume using close position relative to high/low range
• Aggregates and normalizes over specified period
• Default period: 20
Klinger Volume Oscillator (KVO):
Evaluates volume in relation to price movement:
• Tracks trend changes using HLC3
• Applies volume force calculation
• Uses two EMAs (34/55) with a signal line (13)
Practical Applications:
1. Signal Identification
- New colored bars after blank periods show new agreement between indicators
- Color intensity differentiates new signals from continuations
- Blank spaces indicate lack of agreement
2. Trend Analysis
- Consecutive colored bars show continued indicator agreement
- Transitions between colors or to blank spaces show changing conditions
- Can be used alongside other technical analysis tools
3. Risk Considerations
- Signals are not predictive of future price movement
- Should be used as one of multiple analysis tools
- Effectiveness may vary across different markets and timeframes
Technical Specifications:
Core Algorithm
CMF = Σ(((C - L) - (H - C))/(H - L) × V)n / Σ(V)n
KVO = EMA(VF, 34) - EMA(VF, 55)
Where VF = V × |2(dm/cm) - 1| × sign(Δhlc3)
Signal Line = EMA(KVO, 13)
Signal Logic
Long: CMF > 0 AND KVO > Signal
Short: CMF < 0 AND KVO < Signal
Neutral: All other conditions
Parameters
CMF Length = 20
KVO Fast = 34
KVO Slow = 55
KVO Signal = 13
Volume = Regular/Actual Volume
Data Requirements
Price Data: OHLC
Volume Data: Required
Minimum History: 55 bars
Recommended Timeframe: ≥ 1H
Credits:
• Marc Chaikin - Original CMF development
• Stephen Klinger - Original KVO development
• Alex Orekhov (everget) - CMF script implementation
• nj_guy72 - KVO script implementation
Enhanced Buy/Sell Pressure, Volume, and Trend Bar analysisEnhanced Buy/Sell Pressure, Volume, and Trend Bar Analysis Indicator
Overview
This indicator is designed to help traders identify buy and sell pressure, volume changes, and overall trend direction in the market. It combines multiple concepts like price action, volume, and trend analysis, candlestick anaysis to provide a comprehensive view of market dynamics. The visual elements are intuitive, making it suitable for traders at different levels. This indicator works together with Enhanced Pressure MTF Screener which is a screener based of this indicator to make it easier to see Bullish/Bearish pressures and trend across multiple timeframes.
Image below: is the Enhanced Buy/Sell Pressure, Volume, and Trend Bar Analysis with the Enhanced Pressure MTF Screener indicator both active together.
Key Features
1.Buy/Sell Pressure Identification
Buy Pressure: Calculated based on price movement where the close price is higher than the opening price.
Sell Pressure: Calculated when the closing price is equal to or lower than the opening price.These pressures help you understand whether buyers or sellers are more dominant for each bar.
2.Volume Analysis
Normalized Volume: Volume data is normalized, making it easier to compare volume levels over different periods.
Volume Histogram: The volume is also presented as a histogram for easy visualization, showing whether the current volume is higher or lower compared to the average.
3.Simplified Coloring Option
You can choose to simplify the coloring of bars to reflect the dominant pressure: green for bullish pressure and red for bearish pressure. This makes it visually easier to identify who is in control. When simplified coloring is disabled, the bars' colors will represent the combined effect of buy and sell pressure.
4.Heikin-Ashi Candles for Pressure Calculation
The indicator includes an option to use Heikin-Ashi candles instead of traditional candles to calculate buy and sell pressure. Heikin-Ashi candles are known for smoothing out price action and providing a clearer trend representation.
5.Trend Background Coloring
This feature uses exponential moving averages (EMAs) to determine the trend:
Short-Term EMA vs. Long-Term EMA: When the short-term EMA is above the long-term EMA, the trend is considered bullish, and vice versa.
The background color changes based on the identified trend: green for an uptrend and red for a downtrend. This feature helps visualize the overall market direction at a glance.
6.Signals for Key Price Actions
The indicator plots various symbols to signal important price movements:
Bullish Close (▲): Indicates a strong upward movement where the close price crosses above the open.
Bearish Close (▼): Indicates a downward movement where the close price falls below the open.
Higher High (•): Highlights new highs compared to previous bars, useful for confirming an uptrend.
Lower Low (•): Highlights lower lows compared to previous bars, which can indicate a downtrend or bearish pressure.
Calculations Explained
1.Buy and Sell Pressure Calculation
The buy pressure is determined by the price range (high - low) if the closing price is above the opening price, indicating an increase in value.
The sell pressure is similarly calculated when the closing price is equal to or below the opening price.
The indicator uses the Average True Range (ATR) for normalization. Normalizing helps you compare pressure across different periods, regardless of market volatility.
2.Volume Normalization
Volume Normalization: To make volume comparable across different periods, the indicator normalizes it using the Simple Moving Average (SMA) of volume over a user-defined length.
Volume Histogram: The histogram provides a clear representation of volume changes compared to the average, making it easier to spot unusual activity that may indicate market shifts.
3.Combined Pressure Calculation
The indicator calculates a combined pressure value by subtracting sell pressure from buy pressure.
When combined pressure is positive, buying is dominant, and when negative, selling is dominant. This helps in visually understanding the ongoing momentum.
4.Trend Calculation
The indicator uses two EMAs to determine the trend:
Short-Term EMA (default 14-period) to capture recent price movements.
Long-Term EMA (default 50-period) to provide a broader trend perspective.
By comparing these EMAs on a higher timeframe, the indicator can identify whether the trend is up or down, making it easier for traders to align their trades with the larger market movement.
Inputs and Customization
The indicator provides several options for customization, allowing you to adjust it to your preferences:
SMA Length: Determines the lookback period for moving averages and volume normalization. A longer length provides more smoothing, whereas a shorter length makes the indicator more responsive.
Buy/Sell/Volume Colors: Customize the colors used to represent buying, selling, and volume to suit your preferences.
Heikin Ashi Option: Toggle between using Heikin Ashi or traditional OHLC (Open-High-Low-Close) candles for pressure calculations.
Trend Timeframe and EMA Periods: You can choose different timeframes and EMA periods for trend analysis to suit your trading strategy.
How to Use This Indicator
Identifying Market Momentum: Use the buy/sell pressure columns to see which side (buyers or sellers) is in control. Positive pressure combined with green color indicates strong buying, while red indicates selling.
Volume Confirmation: Check the volume area plot and histogram. High volume coupled with strong pressure is a sign of conviction, meaning the current move has backing from market participants.
Trend Identification: The trend background color helps identify the overall trend direction. Trade in the direction of the trend (e.g., take long positions during a green background).
Signal Indicators: The plotted symbols like "Bullish Close" and "Bearish Close" provide visual signals of key price actions, useful for timing entry or exit points.
Practical use Example
Scenario: The market is consolidating, and you see alternating green and red bars.
Action: Wait for a consistent sequence of green bars (buy pressure) along with a green background (uptrend) to consider going long, although you can go long without having a green background, the background adds confirmation layer.
Scenario: The market has several bearish closes (red ▼ symbols) accompanied by increasing volume.
Action: This could indicate strong selling pressure. If the background also turns red, it might be a good time to exit long positions or consider shorting.
Higher timeframe pressure and volume: Another way to use the indicator is to check buy/sell volume and pressure of the higher timeframe say weekly or daily or any timeframe you consider higher, once you’ve identified or feel confident in which direction the bar is going along with the full picture of trend, you can go to the lower timeframe and wait for it to sync with the higher timeframe to consider a long or a short. It is also easier to see when markets sync up by also applying the Enhanced Pressure MTF Screener which works in companion to this indicator.
Visual Cues and Interpretation
Combined Pressure Plot: The green and red column plot at the bottom of the chart represents the dominance between buying and selling. Tall green bars signify strong buying, while tall red bars indicate selling dominance.
Trend Background: Helps visualize the overall direction without manually drawing trend lines. When the background turns green, it generally indicates that the shorter-term moving average has crossed above the longer-term average—a sign of a bullish trend.
To Summarize shortly
The Enhanced Buy/Sell Pressure, Volume, and Trend Bar Analysis Indicator is an advanced but simple tool designed to help traders visually understand market dynamics. It combines different aspects of market analysis of candle pressure from buyers and sellers, volume confirmation, and trend identification into a single view, which can assist both new and experienced traders in making informed trading decisions.
This indicator:
Saves time by simplifying market analysis.
Provides clear visual cues for buy/sell pressure, volume, and trend.
Offers customizable settings to suit individual trading styles.
Always, I am happy to share my creations with you all for free. If you guys have cool ideas you would like to share, or suggestions for improvements the comment is below and I hope this overview gave an idea of how to use the indicator :D

VPA Volume Price AverageDescription:
This indicator displays a moving average of volume and its signal line in a separate pane, with conditional highlighting to help interpret buyer and seller pressure. It’s based on two main lines:
Volume Moving Average (red line) : represents the average volume calculated over a configurable number of periods.
Signal Line of the Volume Moving Average (blue line): this is an average of the volume moving average itself, used as a reference for volume trends.
Key Features
Volume Moving Average with Conditional Highlighting:
The volume moving average is plotted as a red line and changes color based on two specific conditions:
The closing price is above its moving average, calculated over a configurable number of periods, indicating a bullish trend.
The volume moving average is greater than the signal line, suggesting an increase in buyer pressure.
When both conditions are met, the volume moving average turns green. If one or both conditions are not met, the line remains red.
Signal Line of the Volume Moving Average:
The signal line is plotted in blue and represents a smoothed version of the volume moving average, useful for identifying long-term volume trends and as a reference for the highlighting condition.
Customizable Periods
The indicator allows you to set the periods for each average to adapt to different timeframes and desired sensitivity:
Period for calculating the volume moving average.
Period for calculating the signal line of the volume moving average.
Period for the price moving average (used in the highlighting condition).
How to Use
This indicator is especially useful for monitoring volume dynamics in detail, with a visual system that highlights conditions of increasing buyer strength when the price is in an uptrend. The green highlight on the volume moving average provides an intuitive signal for identifying potential moments of buyer support.
Try it to gain a clearer and more focused view of volume behavior relative to price movement!
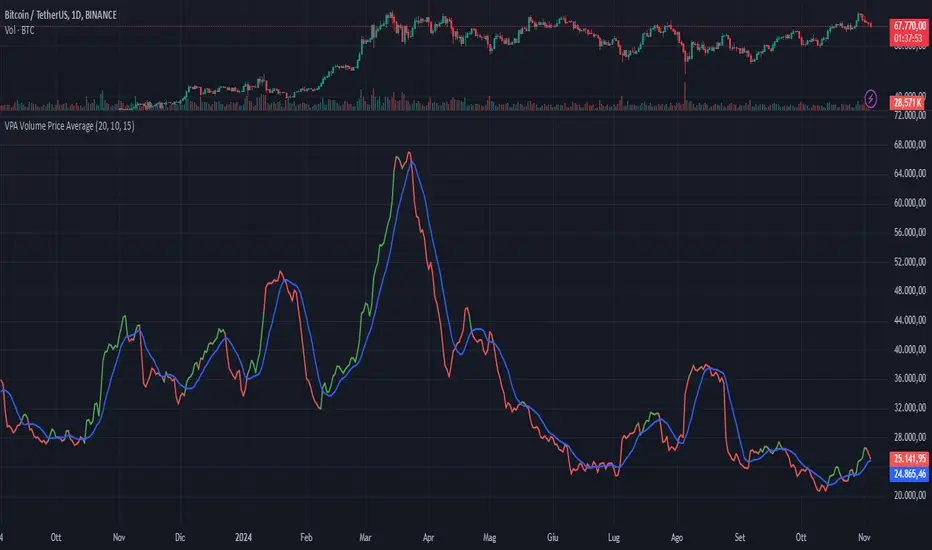
Effective Volume (ADV) v3Effective Volume (ADV) v3: Enhanced Accumulation/Distribution Analysis Tool
This indicator is an updated version of the original script by cI8DH, now upgraded to Pine Script v5 with added functionality, including the Volume Multiple feature. The tool is designed for analyzing Accumulation/Distribution (A/D) volume, referred to here as "Effective Volume," which represents the volume impact in alignment with price direction, providing insights into bullish or bearish trends through volume.
Accumulation/Distribution Volume Analysis : The script calculates and visualizes Effective Volume (ADV), helping traders assess volume strength in relation to price action. By factoring in bullish or bearish alignment, Effective Volume highlights points where volume strongly supports price movements.
Volume Multiple Feature for Volume Multiplication : The Volume Multiple setting (default value 2) allows you to set a multiplier to identify bars where Effective Volume exceeds the previous bar’s volume by a specified factor. This feature aids in pinpointing significant shifts in volume intensity, often associated with potential trend changes.
Customizable Aggregation Types : Users can choose from three volume aggregation types:
Simple - Standard SMA (Simple Moving Average) for averaging Effective Volume
Smoothed - RMA (Recursive Moving Average) for a less volatile, smoother line
Cumulative - Accumulated Effective Volume for ongoing trend analysis
Volume Divisor : The “Divide Vol by” setting (default 1 million) scales down the Effective Volume value for easier readability. This allows Effective Volume data to be aligned with the scale of the price chart.
Visualization Elements
Effective Volume Columns : The Effective Volume bar plot changes color based on volume direction:
Green Bars : Bullish Effective Volume (volume aligns with price movement upwards)
Red Bars : Bearish Effective Volume (volume aligns with price movement downwards)
Moving Average Lines :
Volume Moving Average - A gray line representing the moving average of total volume.
A/D Moving Average - A blue line showing the moving average of Accumulation/Distribution (A/D) Effective Volume.
High ADV Indicator : A “^” symbol appears on bars where the Effective Volume meets or exceeds the Volume Multiple threshold, highlighting bars with significant volume increase.
How to Use
Analyze Accumulation/Distribution Trends : Use Effective Volume to observe if bullish or bearish volume aligns with price direction, offering insights into the strength and sustainability of trends.
Identify Volume Multipliers with Volume Multiple : Adjust Volume Multiple to track when Effective Volume has notably increased, signaling potential shifts or strengthening trends.
Adjust Volume Display : Use the volume divisor setting to scale Effective Volume for clarity, especially when viewing alongside price data on higher timeframes.
With customizable parameters, this script provides a flexible, enhanced perspective on Effective Volume for traders analyzing volume-based trends and reversals.

Salman Indicator: Multi-Purpose Price ActionSalman Indicator: Multi-Purpose Price Action Tool for Pin Bars, Breakouts, and VWAP Anchoring
This indicator provides a comprehensive suite of price action insights, designed for active traders looking to identify key market structures and potential reversals. The script incorporates a Quarterly VWAP for trend bias, marks pin bars for possible reversal points, highlights outside bars for volatility signals, and indicates simple breakouts and pivot-level breaks. Customizable settings allow for flexibility in various trading styles, with default settings optimized for daily charts.
Outside Bars : Represented by an ⤬ symbol on the chart, these indicate bars where the current high is greater than the previous bar’s high, and the low is lower than the previous bar’s low, signaling high volatility and potential market reversals.
Pin Bars : Denoted by a small dot at the top or bottom of a candle’s wick, these are crucial signals of potential reversal areas. Pin bars are identified based on the percentage length of their shadows, with adjustable strictness in settings.
Quarterly VWAP : The light blue line on the chart represents the VWAP (Volume-Weighted Average Price), which is anchored to the Quarterly period by default. The VWAP acts as a directional bias filter, helping you to determine underlying market trends. This period, source, and offset are fully adjustable in the script’s settings.
Simple Breaks : Hollow candles on the chart indicate "simple breaks," defined when the current bar closes above the previous high or below the previous low. This is an effective way to highlight directional momentum in the market.
Bonus Pivot Breaks : The tilde symbol ~ appears when the price closes above or below prior pivot high/low levels, helping traders spot significant breakout or breakdown points relative to recent pivots.
Alerts
Simple Breaks : Alerts you when a breakout occurs beyond the previous bar’s high or low. Pin Bars : Notifies you of potential reversal points as indicated by bullish or bearish pin bars. Outside Bars : Triggers an alert whenever an outside bar is detected, indicating possible volatility changes.
How to Use
VWAP for Trend Bias : Use the Quarterly VWAP line to gauge overall market trend, with settings that allow adjustment to daily, weekly, monthly, or even larger time frames.
Pin Bars for Reversal Potential : Look for the dot markers on candle wicks, where the strictness of the pin bar detection can be adjusted via settings to match your trading preference.
Simple and Pivot Breaks for Momentum : Watch for hollow candles and the tilde symbol ~ as indicators of potential breakout momentum and pivot break levels, respectively.
This script can serve traders on multiple timeframes, from daily to weekly and beyond. The flexible configuration allows for adjustments in VWAP anchoring and pin bar criteria, providing a tailored fit for individual trading strategies.

Volume Based Price Prediction [EdgeTerminal]This indicator combines price action, volume analysis, and trend prediction to forecast potential future price movements. The indicator creates a dynamic prediction zone with confidence bands, helping you visualize possible price trajectories based on current market conditions.
Key Features
Dynamic price prediction based on volume-weighted trend analysis
Confidence bands showing potential price ranges
Volume-based candle coloring for enhanced market insight
VWAP and Moving Average overlay
Customizable prediction parameters
Real-time updates with each new bar
Technical Components:
Volume-Price Correlation: The indicator analyzes the relationship between price movements and volume, Identifies stronger trends through volume confirmation and uses Volume-Weighted Average Price (VWAP) for price equilibrium
Trend Strength Analysis: Calculates trend direction using exponential moving averages, weights trend strength by relative volume and incorporates momentum for improved accuracy
Prediction Algorithm: combines current price, trend, and volume metrics, projects future price levels using weighted factors and generates confidence bands based on price volatility
Customizable Parameters:
Moving Average Length: Controls the smoothing period for calculations
Volume Weight Factor: Adjusts how much volume influences predictions
Prediction Periods: Number of bars to project into the future
Confidence Band Width: Controls the width of prediction bands
How to use it:
Look for strong volume confirmation with green candles, watch for prediction line slope changes, use confidence bands to gauge potential volatility and compare predictions with key support/resistance levels
Some useful tips:
Start with default settings and adjust gradually
Use wider confidence bands in volatile markets
Consider prediction lines as zones rather than exact levels
Best applications of this indicator:
Trend continuation probability assessment
Potential reversal point identification
Risk management through confidence bands
Volume-based trend confirmation
