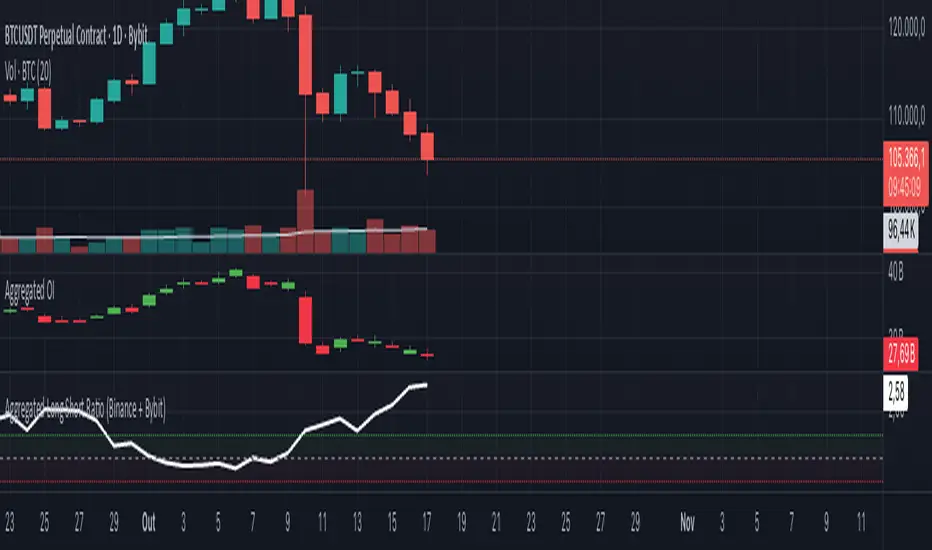
Aggregated Long Short Ratio (Binance + Bybit)This indicator displays the Long/Short Ratio (LSR) from Binance and Bybit exchanges, plus an aggregated average. LSR shows the ratio between traders holding long positions vs short positions.
Settings AvailableExchanges Group:
☑️Show Binance - Display Binance LSR line
☑️ Show Bybit - Display Bybit LSR line
☑️ Show Aggregated LSR - Display combined average
Timeframe - Choose data timeframe (leave empty for chart timeframe)
Visualization Group:
🎨 Binance Color - Default: Yellow
🎨 Bybit Color - Default: Orange
🎨 Aggregated Color - Default: White
📖 How to Read the Indicator
⚠️ CRITICAL: Always analyze LSR together with Open Interest (OI)
Key Levels:
LSR = 1.0 (gray dashed line) = Balance - Equal longs and shorts
LSR > 1.0 = More longs than shorts (bullish sentiment)
LSR < 1.0 = More shorts than longs (bearish sentiment)
Extreme Zones:
LSR > 1.5 (green zone) = Very bullish - Possible market top
LSR < 0.5 (red zone) = Very bearish - Possible market bottom
Why Open Interest Matters:
LSR alone doesn't tell the full story. You MUST check Open Interest:
Rising OI + High LSR (>1.5) = New longs opening → Strong momentum OR potential trap
Rising OI + Low LSR (<0.5) = New shorts opening → Strong momentum OR potential trap
Falling OI + Extreme LSR = Positions closing → Weak signal, avoid trading
Stable OI + Extreme LSR = No new positions → Less reliable signal
💡 Trading Interpretation
⚠️ ALWAYS combine LSR with Open Interest analysis!
Contrarian Strategy (High Leverage Zones):
High LSR (>1.5) + Rising OI → Many new longs → Potential short squeeze OR reversal down
Low LSR (<0.5) + Rising OI → Many new shorts → Potential long squeeze OR reversal up
Trend Confirmation:
Rising LSR + Rising price + Rising OI = Strong bullish trend with new positions
Falling LSR + Falling price + Rising OI = Strong bearish trend with new positions
Weak Signals (Avoid):
Extreme LSR + Falling OI = Positions closing → Low conviction
Extreme LSR + Stable OI = No new money → Wait for confirmation
Divergences:
Price higher highs but LSR falling + Rising OI = Bearish divergence (shorts accumulating)
Price lower lows but LSR rising + Rising OI = Bullish divergence (longs accumulating)
Best Setups:
Reversal: Extreme LSR (>1.5 or <0.5) + Rising OI + Price rejection
Trend: LSR trending with price + Steadily rising OI
Caution: Extreme LSR + Falling OI = Ignore signal
Built-in Alerts
The indicator includes 4 preset alerts:
LSR Crossed Above 1.0 - Market turned bullish
LSR Crossed Below 1.0 - Market turned bearish
LSR Very High - Above 1.5 (possible top)
LSR Very Low - Below 0.5 (possible bottom)
To Set Up Alerts:
Click the "..." on the indicator
Select "Add Alert"
Choose the condition you want
Configure notification method
Best Practices
MANDATORY: Always add Open Interest indicator to your chart alongside LSR
To add OI: Click Indicators → Search "Open Interest" → Add official TradingView OI
Use on perpetual futures charts (symbols ending in .P)
Works best on USDT pairs (BTCUSDT, ETHUSDT, etc.)
Combine LSR + OI + price action + support/resistance levels
Higher timeframes (4h, 1D) give more reliable signals
Don't trade LSR extremes without confirming OI direction
Golden Rule: Rising OI = Strong signal | Falling OI = Weak signal
⚠️ Important Notes
Indicator requires TradingView Premium or above (uses Request library)
Only works on crypto perpetual futures
Data availability depends on exchange API
NA values mean data is not available for that exchange/symbol
Never use LSR without Open Interest context
Volatilität
Risk ModuleThis indicator provides a visual reference for position sizing and approximate stop and target placement. It supports trade planning by calculating equalized risk per trade and maintaining consistent exposure across different markets.
For more information about the concept, see the post Position Sizing and Risk Management .
Fixed Fractional Risk
The indicator calculates the number of shares that can be traded to maintain consistent monetary risk. The formula is based on the distance between the current price and stop reference, adjusting position size proportionally. A closer stop results in a larger position size, while a wider stop results in a smaller one.
Position Size = (Account Size × Risk %) ÷ (Entry Price – Stop Price)
Stop and Target
Stop placement is derived from volatility using the Average True Range (ATR). The target is plotted as a multiple of the stop distance, defining the risk-to-reward relationship in R units.
Stop = Price ± ATR × Multiplier
Target = Price ± (R × Risk Distance)
Chart Elements
The stop and target levels are plotted above and below the current price, with the stop marked by a red dot and the target by a green dot. The information table displayed on the chart shows the number of shares to trade, stop level, and target level.
Setup and Configuration
This configuration only needs to be set once, but can be adjusted later if preferred.
1. Start by setting the account size and risk percentage per trade to define the monetary amount risked on each trade. These values form the basis for position size calculation.
2. Set the ATR multiplier to determine stop distance, common values range between 1 and 3 ATR. Lower values place stops closer to price, increasing sensitivity but risking short-term noise. Higher values widen the stop, which reduces noise impact but extends time in risk.
3. Set the R-multiple to determine target distance relative to the stop. A value of 1 represents a 1:1 risk-to-reward relationship. Lower values reduce potential reward but tend to increase win rate, whereas higher values increase potential reward but tend to reduce win rate. The selection depends on system characteristics and trade expectancy.
When the parameters are defined, the indicator displays the stop, target, and calculated position size on the chart. All that remains is to enter the trade with the number of shares shown in the table and place bracket orders at the plotted stop and target levels.
Settings Overview
Account Size / Risk %: Defines account capital and per-trade exposure.
ATR Multiplier: Adjusts stop distance relative to volatility.
R Multiple: Sets target distance relative to stop (risk-reward ratio).
Position: Choose Long or Short direction.
Table Position: Controls information table placement and scale.

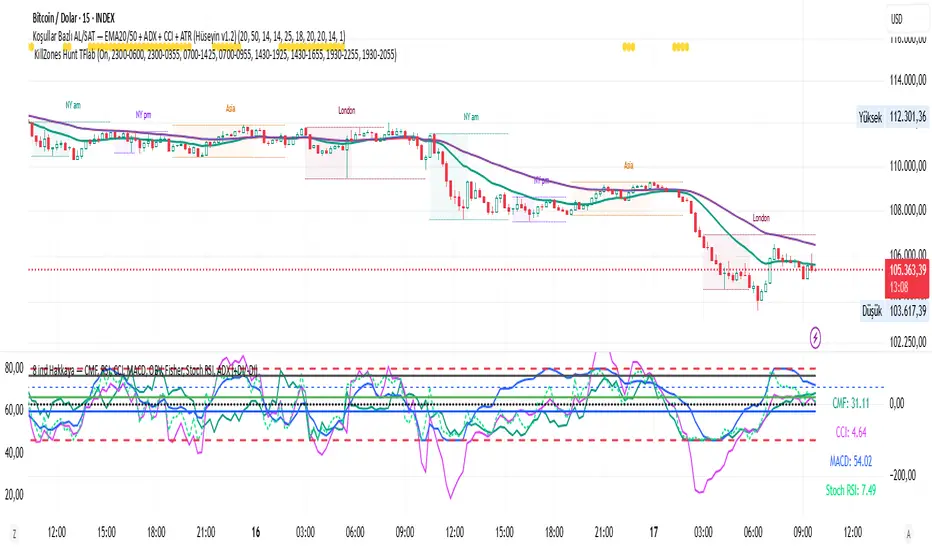
CMF, RSI, CCI, MACD, OBV, Fisher, Stoch RSI, ADX (+DI/-DI)
Stoch RSINine indicators in one, CMF, RSI, CCI, MACD, OBV, Fisher, Stoch RSI, ADX (+DI/-DI) You can use whichever of the nine indicators you want. I use CFM, CCI, MACD, Stoch RSI.
Adaptive Vol Gauge [ParadoxAlgo]This is an overlay tool that measures and shows market ups and downs (volatility) based on daily high and low prices. It adjusts automatically to recent price changes and highlights calm or wild market periods. It colors the chart background and bars in shades of blue to cyan, with optional small labels for changes in market mood. Use it for info only—combine with your own analysis and risk controls. It's not a buy/sell signal or promise of results.Key FeaturesSmart Volatility Measure: Tracks price swings with a flexible time window that reacts to market speed.
Market Mood Detection: Spots high-energy (wild) or low-energy (calm) phases to help see shifts.
Visual Style: Uses smooth color fades on the background and bars—cyan for calm, deep blue for wild—to blend nicely on your chart.
Custom Options: Change settings like time periods, sensitivity, colors, and labels.
Chart Fit: Sits right on your main price chart without extra lines, keeping things clean.
How It WorksThe tool figures out volatility like this:Adjustment Factor:Looks at recent price ranges compared to longer ones.
Tweaks the time window (between 10-50 bars) based on how fast prices are moving.
Volatility Calc:Adds up logs of high/low ranges over the adjusted window.
Takes the square root for the final value.
Can scale it to yearly terms for easy comparison across chart timeframes.
Mood Check:Compares current volatility to its recent average and spread.
Flags "high" if above your set level, "low" if below.
Neutral in between.
This setup makes it quicker in busy markets and steadier in quiet ones.Settings You Can ChangeAdjust in the tool's menu:Base Time Window (default: 20): Starting point for calculations. Bigger numbers smooth things out but might miss quick changes.
Adjustment Strength (default: 0.5): How much it reacts to price speed. Low = steady; high = quick changes.
Yearly Scaling (default: on): Makes values comparable across short or long charts. Turn off for raw numbers.
Mood Sensitivity (default: 1.0): How strict for calling high/low moods. Low = more shifts; high = only big ones.
Show Labels (default: on): Adds tiny "High Vol" or "Low Vol" tags when moods change. They point up or down from bars.
Background Fade (default: 80): How see-through the color fill is (0 = invisible, 100 = solid).
Bar Fade (default: 50): How much color blends into your candles or bars (0 = none, 100 = full).
How to Read and Use ItColor Shifts:Background and bars fade based on mood strength:Cyan shades mean calm markets (good for steady, back-and-forth trades).
Deep blue shades mean wild markets (watch for big moves or turns).
Smooth changes show volatility building or easing.
Labels:"High Vol" (deep blue, from below bar): Start of wild phase.
"Low Vol" (cyan, from above bar): Start of calm phase.
Only shows at changes to avoid clutter. Use for timing strategy tweaks.
Trading Ideas:Mood-Based Plays: In wild phases (deep blue), try chase-momentum or breakout trades since swings are bigger. In calm phases (cyan), stick to bounce-back or range trades.
Risk Tips: Cut trade sizes in wild times to handle bigger losses. Use calm times for longer holds with close stops.
Chart Time Tips: Turn on yearly scaling for matching short and long views. Test settings on past data—loosen for quick trades (more alerts), tighten for longer ones (fewer, stronger).
Mix with Others: Add trend lines or averages—buy in calm up-moves, sell in wild down-moves. Check with volume or key levels too.
Special Cases: In big news events, it reacts faster. On slow assets, it might overstate swings—ease the adjustment strength.
Limits and TipsIt looks back at past data, so it trails real-time action and can't predict ahead.
Results differ by stock or timeframe—test on history first.
Colors and tags are just visuals; set your own alerts if needed.
Follows TradingView rules: No win promises, for learning only. Open for sharing; share thoughts in forums.
With this, you can spot market energy and tweak your trades smarter. Start on practice charts.

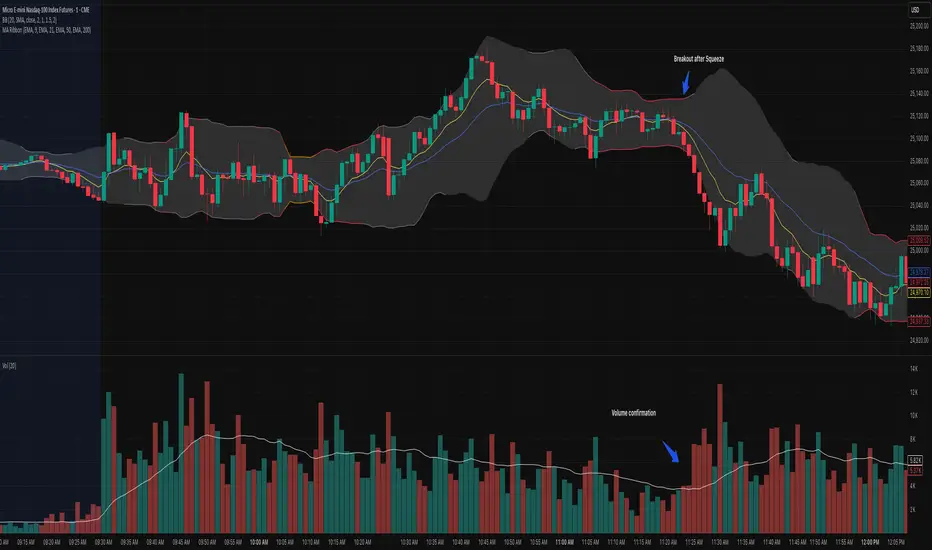
Bollinger Bands Squeeze📈 Bollinger Bands Squeeze
This indicator enhances traditional Bollinger Bands by integrating Keltner Channel layers to visualize market compression and volatility expansion — allowing traders to easily identify when a squeeze is building or releasing.
🔍 Overview
This is a refined version of the classic Bollinger Bands, designed to detect volatility squeezes using multiple Keltner Channel thresholds.
The script plots standard Bollinger Bands and dynamically colors the bands according to the degree of compression relative to the Keltner Channels.
⚙️ How It Works
Bollinger Bands are calculated from a selected moving average (SMA, EMA, SMMA, WMA, or VWMA) and standard deviation multiplier.
Keltner Channels are derived from ATR (True Range) using three sensitivity levels (1.0, 1.5, and 2.0× multipliers).
When Bollinger Bands contract inside a Keltner Channel, the script marks a squeeze state:
🟠 High Compression (Orange): Very tight volatility — expect breakout soon.
🔴 Mid Compression (Red): Moderate contraction — volatility is building.
⚫ Low Compression (Gray/Black): Early compression phase.
🧩 Inputs & Customization
Length : Period for both Bollinger and Keltner calculations.
Basis MA Type: Choose from SMA, EMA, SMMA (RMA), WMA, or VWMA.
StdDev Multiplier : Controls Bollinger Bandwidth.
Keltner Multipliers (1.0 / 1.5 / 2.0) : Adjust compression thresholds.
Offset : Shifts the bands visually on the chart.
🕹️ Best Use Cases
Identify pre-breakout conditions before volatility expansion.
Combine with volume, momentum, or trend indicators (e.g., RSI) for confirmation.
Ideal for scalping, breakout trading, or volatility-based entries during session opens.
Londen & New York Sessies (UTC+2)This script highlights the London and New York trading sessions on the chart, adjusted for UTC+2 timezone. It's designed to help traders easily visualize the most active and liquid periods of the Forex and global markets directly on their TradingView charts. The London session typically provides strong volatility, while the New York session brings increased momentum and overlaps with London for powerful trading opportunities. Ideal for intraday and session-based strategies.

Price Change x% from Prior CloseThis indicator identifies candles where price moved a specified percentage below the prior candle's Close price.
The script plots a gray bar at the threshold price for each candle and a green up-arrow for candles where the price crosses below the threshold price.
The Threshold Price Percentage can be set in the indicator settings window.

Dynamic ATR BandsDescription:
The Dynamic ATR Bands indicator visualizes ATR-based stop-loss, take-profit, and trailing levels. Bands can be drawn relative to a fixed entry price or dynamically relative to the current price. It is ideal for trend-following, swing trading, and hybrid strategies, especially on volatile or noisy instruments.
Key Features:
Base ATR Bands:
Plots ATR-based bands above and below a reference price.
Acts as initial stop-loss or target guidance.
Adjustable multiplier (default 1× ATR).
Extra ATR Band:
Add an additional ATR band at a custom multiplier.
Position it above or below the reference price.
Useful for trailing stops or extended profit targets.
Hybrid Entry Mode:
Use Fixed Entry Price: bands are drawn relative to your entry and remain fixed.
Dynamic Mode: bands behave like standard ATR bands, moving with the current price.
Allows visualization of hybrid ATR stop-loss and trailing strategies.
Clean Visuals:
Color-coded bands differentiate base (solid) from extra (semi-transparent).
How to Use:
Set ATR length and multipliers according to your strategy.
Toggle hybrid entry mode and input your entry price, or leave off for dynamic bands.
Set the extra band multiplier and choose its position (upper/lower).
Use the bands as visual guides for stop-loss, take-profit, and trailing levels.
Inputs:
ATR Length: number of periods for ATR calculation
Base ATR Multiplier: distance of base bands from reference price
Extra ATR Multiplier: distance for the additional band
Extra Band Position: choose Upper or Lower
Use Fixed Entry Price: toggle hybrid entry mode
Entry Price: specify entry price if hybrid mode is enabled
Note:
This script is visual only; it does not place trades. It is designed to help plan ATR-based stop-loss, take-profit, and hybrid trade management visually on the chart.

Custom Bollinger Band Squeeze Screener [Pineify]Custom Bollinger Band Squeeze Screener
Key Features
Multi-symbol scanning: Analyze up to 6 tickers simultaneously.
Multi-timeframe flexibility: Screen across four selectable timeframes for each symbol.
Bollinger Band Squeeze algorithm: Detect volatility contraction and imminent breakouts.
Advanced ATR integration: Measure expansion and squeeze states with custom multipliers.
Customizable indicator parameters: Fine-tune Bollinger and ATR settings for tailored detection.
Visual table interface: Rapidly compare squeeze and expansion signals across all instruments.
How It Works
At the core, this screener leverages a unique blend of Bollinger Bands and Average True Range (ATR) to quantify volatility states for multiple assets and timeframes at once. For each symbol and every selected timeframe, the indicator calculates Bollinger Band width and compares it against ATR levels, offering real-time squeeze (consolidation) and expansion (breakout) signals.
Bollinger Band width is computed using standard deviations around a SMA basis.
ATR is calculated to gauge market volatility independent of price direction.
Squeeze: Triggered when BB width contracts below a multiple of ATR, forecasting lower volatility and set-up for a move.
Expansion: Triggered when BB width expands above a higher ATR multiple, signaling a high-volatility breakout.
Display: Results shown in an intuitive table, marking each status per ticker and TF.
Trading Ideas and Insights
Spot assets poised for volatility-driven breakouts.
Compare squeeze presence across timeframes for optimal entry timing.
Integrate screener results with price action or volume for high-confidence setups.
Use squeeze signals to avoid choppy or non-trending conditions.
Expand and diversify watchlists with multi-symbol coverage.
How Multiple Indicators Work Together
This script seamlessly merges Bollinger Bands and ATR with customized multipliers:
Bollinger Bands identify price consolidation and volatility squeeze zones.
ATR tailors the definition of squeeze and expansion, making signals adaptive to volatility regime changes.
By layering these with multi-symbol/multi-timeframe data, traders access a high-precision view of market readiness for trend acceleration or reversal.
The real synergy is in the screener's ability to visualize volatility states for a diverse asset selection, transforming traditional single-chart analysis into a broad market view.
Unique Aspects
Original implementation: Not a simple trend or scalping indicator; utilizes advanced volatility logic.
Fully multi-symbol and multi-timeframe support uncommon in most screeners.
Custom ATR multipliers for both squeeze and expansion allow traders to match their risk profile and market dynamics.
Visual clarity: Table structure promotes actionable insights and reduces decision fatigue.
How to Use
Add the indicator to your TradingView chart (supports any asset class including crypto, forex, stocks).
Select up to six symbols (tickers) and set your preferred timeframes.
Adjust Bollinger Band Length/Deviation and ATR multipliers to refine squeeze/expansion criteria.
Review the screener table: Look for "SQZ" (squeeze) or "EXP" (expansion) cells for entry/exit ideas.
Combine screener information with other technical or fundamental signals for trade confirmation.
Customization
Symbols: Choose any tickers for scanning.
Timeframes: Select short- to long-term intervals to match your trading style.
Bollinger Band parameters: Modify length and deviation for sensitivity.
ATR multipliers: Set low or high values to adjust squeeze/expansion triggers.
Table size and layout: Adapt display for optimal workflow.
Conclusion
The Bollinger Band Squeeze Screener Pineify delivers an innovative, SEO-friendly multi-asset solution for volatility and trend detection. Harness its original algorithmic design to uncover powerful breakout opportunities and optimize your portfolio. Whether you trade crypto with dynamic volatility or scan stocks for momentum, this tool supercharges your TradingView workflow.

QUANTUM MOMENTUMOverview
Quantum Momentum is a sophisticated technical analysis tool designed to help traders identify relative strength between assets through advanced momentum comparison. This cyberpunk-themed indicator visualizes momentum dynamics between your current trading symbol and any comparison asset of your choice, making it ideal for pairs trading, crypto correlation analysis, and multi-asset portfolio management.
Key Features
📊 Multi-Asset Momentum Comparison
Dual Symbol Analysis: Compare momentum between your chart symbol and any other tradable asset
Real-Time Tracking: Monitor relative momentum strength as market conditions evolve
Difference Visualization: Clear histogram display showing which asset has stronger momentum
🎯 Multiple Momentum Calculation Methods
Choose from four different momentum calculation types:
ROC (Rate of Change): Traditional percentage-based momentum measurement
RSI (Relative Strength Index): Oscillator-based momentum from 0-100 range
Percent Change: Simple percentage change over the lookback period
Raw Change: Absolute price change in native currency units
📈 Advanced Trend Filtering System
Enable optional trend filters to align momentum signals with prevailing market direction:
SMA (Simple Moving Average): Classic trend identification
EMA (Exponential Moving Average): Responsive trend detection
Price Action: Identifies trends through higher highs/lows or lower highs/lows patterns
ADX (Average Directional Index): Measures trend strength with customizable threshold
🎨 Futuristic Cyberpunk Design
Neon Color Scheme: Eye-catching cyan, magenta, and matrix green color palette
Glowing Visual Effects: Enhanced visibility with luminescent plot lines
Dynamic Background Shading: Subtle trend state visualization
Real-Time Data Table: Sleek information panel displaying current momentum values and trend status
How It Works
The indicator calculates momentum for both your current chart symbol and a comparison symbol (default: BTC/USDT) using your selected method and lookback period. The difference between these momentum values reveals which asset is exhibiting stronger momentum at any given time.
Positive Difference (Green): Your chart symbol has stronger momentum than the comparison asset
Negative Difference (Pink/Red): The comparison asset has stronger momentum than your chart symbol
When the trend filter is enabled, the indicator will only display signals that align with the detected market trend, helping filter out counter-trend noise.
Settings Guide
Symbol Settings
Compare Symbol: Choose any tradable asset to compare against (e.g., major indices, cryptocurrencies, forex pairs)
Momentum Settings
Momentum Length: Lookback period for momentum calculations (default: 14 bars)
Momentum Type: Select your preferred momentum calculation method
Display Options
Toggle visibility of current symbol momentum line
Toggle visibility of comparison symbol momentum line
Toggle visibility of momentum difference histogram
Optional zero line reference
Trend Filter Settings
Use Trend Filter: Enable/disable trend-based signal filtering
Trend Method: Choose from SMA, EMA, Price Action, or ADX
Trend Length: Period for trend calculations (default: 50)
ADX Threshold: Minimum ADX value to confirm trend strength (default: 25)
Best Use Cases
✅ Pairs Trading: Identify divergences in momentum between correlated assets
✅ Crypto Market Analysis: Compare altcoin momentum against Bitcoin or Ethereum
✅ Stock Market Rotation: Track sector or index relative strength
✅ Forex Strength Analysis: Monitor currency pair momentum relationships
✅ Multi-Timeframe Confirmation: Use alongside other indicators for confluence
✅ Mean Reversion Strategies: Spot extreme momentum divergences for potential reversals
Visual Indicators
⚡ Cyan Line: Your chart symbol's momentum
⚡ Magenta Line: Comparison symbol's momentum
📊 Green/Pink Histogram: Momentum difference (positive = green, negative = pink)
▲ Green Triangle: Bullish trend detected (when filter enabled)
▼ Red Triangle: Bearish trend detected (when filter enabled)
◈ Yellow Diamond: Neutral/sideways trend (when filter enabled)
Pro Tips
💡 Look for crossovers between the momentum lines as potential trade signals
💡 Combine with volume analysis for stronger confirmation
💡 Use momentum divergence (price making new highs/lows while momentum doesn't) for reversal signals
💡 Enable trend filter during ranging markets to reduce false signals
💡 Experiment with different momentum types to find what works best for your trading style
Technical Requirements
TradingView Pine Script Version: v6
Chart Type: Works on all chart types
Indicator Placement: Separate pane (overlay=false)
Data Requirements: Needs access to comparison symbol data

Volatilidad Multi-TF📊 Multi-Timeframe Volatility (ATR%)
Description
Indicator that displays the current asset's volatility across multiple timeframes simultaneously. It uses the ATR (Average True Range) normalized as a percentage of price, allowing for objective volatility comparison across different timeframes.
✨ Key Features
- Multi-Timeframe Analysis: Visualize volatility across 5 different timeframes (1H, 4H, D, W, M)
- Normalized Volatility: ATR expressed as a percentage of price for accurate comparison
- Compact Table: Clean and easy-to-read interface in the corner of your chart
- Auto-Update: Automatically adapts to the asset you're viewing
- No Additional Plots: Only displays essential information in table format
🎯 How to Use
1. Add the indicator to your chart
2. The table will automatically display the current asset's volatility
3. Percentage values allow you to quickly identify:
- Which timeframe has higher/lower volatility
- Divergences between timeframes
- High or low volatility zones to adjust your strategies
⚙️ Configurable Parameters
- ATR Period: Default 14, adjust according to your strategy
📈 Practical Applications
- Risk Management: Adjust position sizing based on current volatility
- Asset Selection: Identify assets with suitable volatility for your profile
- Entry Timing: Detect volatility expansions/contractions
- Timeframe Analysis: Compare volatility across different time periods
💡 Technical Notes
- Normalized ATR allows volatility comparison between assets with different prices
- Useful for both intraday trading (1H, 4H) and swing/positional trading (D, W, M)
- Compatible with any market: cryptocurrencies, forex, stocks, indices
⚠️ Disclaimer
This indicator is a technical analysis tool. It does not constitute financial advice. Conduct your own analysis and risk management before trading.

Turtle Strategy - Triple EMA Trend with ADX and ATRDescription
The Triple EMA Trend strategy is a directional momentum system built on the alignment of three exponential moving averages and a strong ADX confirmation filter. It is designed to capture established trends while maintaining disciplined risk management through ATR-based stops and targets.
Core Logic
The system activates only under high-trend conditions, defined by the Average Directional Index (ADX) exceeding a configurable threshold (default: 43).
A bullish setup occurs when the short-term EMA is above the mid-term EMA, which in turn is above the long-term EMA, and price trades above the fastest EMA.
A bearish setup is the mirror condition.
Execution Rules
Entry:
• Long when ADX confirms trend strength and EMA alignment is bullish.
• Short when ADX confirms trend strength and EMA alignment is bearish.
Exit:
• Stop Loss: 1.8 × ATR below (for longs) or above (for shorts) the entry price.
• Take Profit: 3.3 × ATR in the direction of the trade.
Both parameters are configurable.
Additional Features
• Start/end date inputs for controlled backtesting.
• Selective activation of long or short trades.
• Built-in commission and position sizing (percent of equity).
• Full visual representation of EMAs, ADX, stop-loss, and target levels.
This strategy emphasizes clean trend participation, strict entry qualification, and consistent reward-to-risk structure. Ideal for swing or medium-term testing across trending assets.

Fury by Tetrad Fury by Tetrad
What it is:
A rules-based Bollinger+RSI strategy that fades extremes: it looks for price stretching beyond Bollinger Bands while RSI confirms exhaustion, enters countertrend, then exits at predefined profit multipliers or optional stoploss. “Ultra Glow” visuals are purely cosmetic.
How it works — logic at a glance
Framework: Classic Bollinger Bands (SMA basis; configurable length & multiplier) + RSI (configurable length).
Long entries:
Price closes below the lower band and RSI < Long RSI threshold (default 28.3) → open LONG (subject to your “Market Direction” setting).
Short entries:
Price closes above the upper band and RSI > Short RSI threshold (default 88.4) → open SHORT.
Profit exits (price targets):
Uses simple multipliers of the strategy’s average entry price:
Long exit = `entry × Long Exit Multiplier` (default 1.14).
Short exit = `entry × Short Exit Multiplier` (default 0.915).
Risk controls:
Optional pricebased stoploss (disabled by default) via:
Long stop = `entry × Long Stop Factor` (default 0.73).
Short stop = `entry × Short Stop Factor` (default 1.05).
Directional filter:
“Market Direction” input lets you constrain entries to Market Neutral, Long Only, or Short Only.
Visuals:
“Ultra Glow” draws thin layered bands around upper/basis/lower; these do not affect signals.
> Note: Inputs exist for a timebased stop tracker in code, but this version exits via targets and (optional) price stop only.
Why it’s different / original
Explicit extreme + momentum pairing: Entries require simultaneous band breach and RSI exhaustion, aiming to avoid entries on gardenvariety volatility pokes.
Deterministic exits: Multiplier-based targets keep results auditable and reproducible across datasets and assets.
Minimal, unobtrusive visuals: Thin, layered glow preserves chart readability while communicating regime around the Bollinger structure.
Inputs you can tune
Bollinger: Length (default 205), Multiplier (default 2.2).
RSI: Length (default 23), Long/Short thresholds (28.3 / 88.4).
Targets: Long Exit Mult (1.14), Short Exit Mult (0.915).
Stops (optional): Enable/disable; Long/Short Stop Factors (0.73 / 1.05).
Market Direction: Market Neutral / Long Only / Short Only.
Visuals: Ultra Glow on/off, light bar tint, trade labels on/off.
How to use it
1. Timeframe & assets: Works on any symbol/timeframe; start with liquid majors and 60m–1D to establish baseline behavior, then adapt.
2. Calibrate thresholds:
Narrow/meanreverting markets often tolerate tighter RSI thresholds.
Fast/volatile markets may need wider RSI thresholds and stronger stop factors.
3. Pick realistic targets: The default multipliers are illustrative; tune them to reflect typical mean reversion distance for your instrument/timeframe (e.g., ATRinformed profiling).
4. Risk: If enabling stops, size positions so risk per trade ≤ 1–2% of equity (max 5–10% is a commonly cited upper bound).
5. Mode: Use Long Only or Short Only when your discretionary bias or higher timeframe model favors one side; otherwise Market Neutral.
Recommended publication properties (for backtests that don’t mislead)
When you publish, set your strategy’s Properties to realistic values and keep them consistent with this description:
Initial capital: 10,000 (typical retail baseline).
Commission: ≥ 0.05% (adjust for your venue).
Slippage: ≥ 2–3 ticks (or a conservative pertrade value).
Position sizing: Avoid risking > 5–10% equity per trade; fixedfractional sizing ≤ 10% or fixedcash sizing is recommended.
Dataset / sample size: Prefer symbols/timeframes yielding 100+ trades over the tested period for statistical relevance. If you deviate, say why.
> If you choose different defaults (e.g., capital, commission, slippage, sizing), explain and justify them here, and use the same settings in your publication.
Interpreting results & limitations
This is a countertrend approach; it can struggle in strong trends where band breaches compound.
Parameter sensitivity is real: thresholds and multipliers materially change trade frequency and expectancy.
No predictive claims: Past performance is not indicative of future results. The future is unknowable; treat outputs as decision support, not guarantees.
Suggested validation workflow
Try different assets. (TSLA, AAPL, BTC, SOL, XRP)
Run a walkforward across multiple years and market regimes.
Test several timeframes and multiple instruments. (30m Suggested)
Compare different commission/slippage assumptions.
Inspect distribution of returns, max drawdown, win/loss expectancy, and exposure.
Confirm behavior during trend vs. range segments.
Alerts & automation
This release focuses on chart execution and visualization. If you plan to automate, create alerts at your entry/exit conditions and ensure your broker/venue fills reflect your slippage/fees assumptions.
Disclaimer
This script is provided for educational and research purposes. It is not investment advice. Trading involves risk, including the possible loss of principal. © Tetrad Protocol.
