Perfect Order Swing Signals✅ Pullback = Setup
✅ Perfect order = Filter
✅ Candle closing back through 20 EMA = Trigger
- Add other confirmations to your analysis before you enter a trade, dont go based just off the long & short signals.
- Now go make some bread $$
DJ FXCM Index

PRO SMC Full Suite BY Mashrur“PRO SMC Full Suite BY Mashrur”
A Pine Script (v5) indicator for TradingView, focused on Smart Money Concepts (SMC). It overlays on price charts and provides visual tools for identifying key institutional trading behaviors.
🎯 Purpose
This script is designed to help traders analyze and trade using SMC principles by automatically detecting:
Order Blocks (OBs)
Fair Value Gaps (FVGs)
Breaks of Structure (BoS)
Liquidity Sweeps (Buy/Sell Side Liquidity Grabs)
Mitigation Entries
⚙️ Inputs / Settings
Show Fair Value Gaps: Toggle FVGs on/off
Higher Timeframe (HTF): Choose HTF for OB analysis
Use HTF OBs: Switch between current TF OBs and HTF OBs
Show Order Blocks: Toggle OBs on/off
Show OB Mitigation Entries: Toggle mitigation entry signals on/off
🧠 Core Logic Overview
🔹 1. Swing Points Detection
Identifies swing highs/lows using a 3-bar pattern (pivot-based structure).
🔹 2. Break of Structure (BoS)
A bullish BoS happens when price closes above the last swing high.
A bearish BoS occurs when price closes below the last swing low.
🔹 3. Order Block Detection
Upon BoS, the script marks the previous candle as the Order Block.
Uses either:
Current TF OBs (based on price action)
HTF OBs (based on candle body direction)
🔹 4. Mitigation Entry Logic
A mitigation occurs when price returns to the OB and reacts with confirmation:
Bullish: price dips into OB and closes above
Bearish: price wicks into OB and closes below
Plots entry markers for these mitigations.
🔹 5. Liquidity Sweeps
Detects equal highs/lows (liquidity zones)
Marks Buy SL when price dips below an equal low then closes above
Marks Sell SL when price breaks above an equal high then closes below
🔹 6. Fair Value Gaps (FVGs)
FVG Up: Gap between candle 3 and candle 1 (low > high )
FVG Down: Gap between candle 3 and candle 1 (high < low )
Plots highlighted boxes on these gaps
📊 Visual Elements
Boxes: For OB zones and FVGs
Shapes:
Labels: OB Buy/Sell entries
Triangles: Buy SL / Sell SL liquidity sweeps
Lines: Equal Highs and Lows
🔔 Alerts
Built-in alerts to notify when:
OB entries are confirmed
Liquidity sweeps happen
Helps in automation or active monitoring
✅ Ideal For
Traders using SMC, ICT concepts, Wyckoff, or institutional trading models
Anyone wanting to automate detection of structural elements on their chart

nNouSignnNouSign
☆
Welcome to a path to trading success in the world of trading, where fortunes are made and dreams come true.
But amidst the excitement and possibilities, there lies the challenge of deciphering the market's complexities.
Fear not, for we present to you the ultimate weapon in your trading arsenal: the nNouSign indicator.
Prepare to embark on a thrilling journey of trading mastery as we guide you through its optimal usage, enlightening you with its potential and empowering you with the ability to navigate the markets with confidence.
Embracing the nNouSign magic as you apply the nNouSign indicator to your TradingView chart, envision a realm where the convergence of art and science births incredible trading opportunities.
• The indicator's smooth moving average line, represented by a vibrant orange hue, acts as your guiding light. It captures the essence of market sentiment and unveils the hidden patterns that govern price movements.
Decoding the colors of success, possess a mystical power to evoke emotions and ignite motivation . The nNouSign indicator harnesses this power, allowing you to personalize your trading experience.
• Choose the color of prosperity for your buy signals, perhaps a vivid shade of green. Let it symbolize the life-giving force of profits flowing into your trading account.
• As for sell signals, embrace the passionate intensity of red, signifying your ability to seize opportunities and protect your gains.
Riding the trend waves is one of the nNouSign indicator's core strengths. It lies in its ability to identify trends.
Whether the market surges upwards like a fearless tide or recedes like a wise old ocean, the indicator whispers the secrets of trend direction.
• When the moving average is conquered by the closing price, rejoice, for it signals a bullish trend.
• Conversely, when the closing price descends beneath the moving average, it reveals a bearish trend.
Harmonizing with the trading signals which are the magical spells that teleport you to the forefront of profitable trades.
Watch as the nNouSign indicator casts its spells in the form of tiny triangles on your chart.
• When a bullish trend is confirmed, a mystical triangle points upwards, signaling a buy opportunity.
• On the contrary, when a bearish trend emerges, a bewitching triangle points downwards, beckoning you to sell.
Embrace these signals and let them guide your path to success.
Unleashing the power of alerts like the modern trader(s) whom thrives on speed and efficiency.
The nNouSign indicator empowers you with its alert system , ensuring you never miss a precious trading moment.
• Customize your alerts to receive notifications when the bullish or bearish trends are confirmed.
Imagine the thrill of being the first to seize an opportunity, swiftly executing trades with confidence, and reaping the rewards.
Dance with the trendline as you journey through the market's ebb and flow, through the nNouSign indicator its visual masterpiece.
Behold the trendline , gracefully drawn on your chart.
• In the presence of a bullish trend, it steps aside, allowing the moving average to shine brightly.
• Yet, in the depths of a bearish trend, it emerges, painted in shades of red, serving as a reminder to exercise caution.
Let this visual spectacle guide your decision-making process.
☆
Intrepid trader! ,may you now have unlocked the secrets of the nNouSign indicator and embark on a journey that will forever transform your trading experience.
Armed with its wisdom and most importantly YOUR OWN WISDOM, may you possess the ability to navigate the markets with confidence and precision.
Embrace its vibrant colors, heed its trading signals and dance with the trendline as you ride the waves of market trends. Let the indicator be your constant companion, guiding you through the ever-changing tides of the financial world.
Remember, trading is not just a science; it is an art. The nNouSign indicator provides you with the tools to create your masterpiece.
Embrace its colors, for they evoke the emotions and motivation necessary for success.
Let the green of buy signals ignite your passion for profit, and the red of sell signals fuel your determination to protect your gains.
But trading is more than just following signals; it requires discipline and adaptability.
Observe the trendlines and understand the market's rhythm.
Be patient when the trend favors the bulls, and exercise cautio n when the bears take control.
The nNouSign indicator, with its magical trendline, will be your compass in navigating these changing conditions.
In the fast-paced world of trading, timing is everything. The alerts generated by the nNouSign indicator will keep you informed, ensuring you never miss an opportunity.
Stay alert, for swift and decisive action can be the key to reaping substantial rewards.
☆
Finally, remember that trading is a journey of growth and learning.
Embrace the educational aspect of using the
nNouSign indicator.
Analyze your trades, study the outcomes, and fine-tune your strategies.
With each trade , you'll gain valuable insights and develop the skills necessary for long-term success .
☆
So, fellow trader, take this guide as your roadmap to trading mastery.
Let the nNouSign indicator be your guide, entertaining you with its vibrant colors, motivating you with its signals, and educating you through each trading experience.
Embrace the power it bestows upon you, and let it unleash your full potential in the exciting world of trading.
Success awaits those who dare to seize it!
-HappyTrading- J

Dollar Index (DXY) Candles [Loxx]Dollar Index (DXY) Candles is an educational/experimental indicator that attempts to recreate the Dollar Index DXY: TVC:DXY .This is useful so others traders can see how the DXY is calculated.
The U.S. Dollar Index (USDX, DXY, DX) is an index (or measure) of the value of the United States dollar relative to a basket of foreign currencies, often referred to as a basket of U.S. trade partners' currencies. The Index goes up when the U.S. dollar gains "strength" (value) when compared to other currencies.
The index is maintained and published by ICE (Intercontinental Exchange, Inc.), with the name "U.S. Dollar Index" a registered trademark.
It is a weighted geometric mean of the dollar's value relative to following select currencies:
Euro (EUR), 57.6% weight.
Japanese yen (JPY) 13.6% weight.
Pound sterling (GBP), 11.9% weight.
Canadian dollar (CAD), 9.1% weight.
Swedish krona (SEK), 4.2% weight.
Swiss franc (CHF) 3.6% weight.
USDX = 50.14348112 × EURUSD^-0.576 × USDJPY^0.136 × GBPUSD^-0.119 × USDCAD^0.091 × USDSEK^0.042 × USDCHF^0.036
These candles won't match the ticker DXY dollar for dollar, but it comes very close. Either way, the general trend and volatility of this synthetic recreation is the same as the DXY.
Read more here: en.wikipedia.org

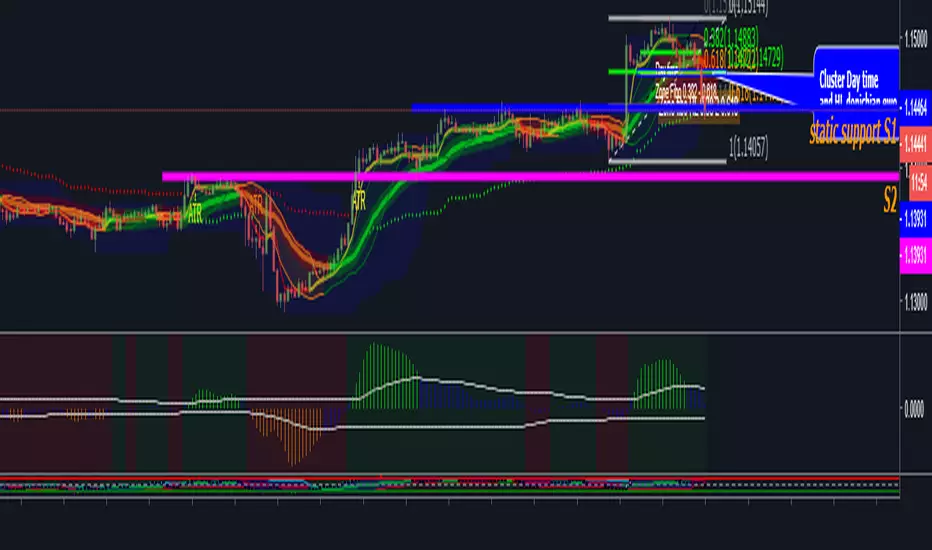
PpSignal Personal TemplateThis is my personal template strategy, I follow the tendency, with
-Donichian: I can se the high and low price.
-CFB: ha can see the trend short.
-Tigger MA: i can see the long trend.
-BB: I can see the short trend and the volatily.
-Ewo break band and Rsi Donicihan channel, the trend and oversold and overbought.
-PPSignal Scalper Double Cross Signal and EWO Smooth V4.0 for the background trend.
PpSignal Candle converter and psignal golden fibo zone.
Correlation of chart symbol to different Index-ETF-currencyScript plots correlation of chart symbol to a variety of indexes, symbols, equities. ** Original idea was to find Bitcoin correlation, which I did not. Built in correlations are: Nikie, DAX, SPY, AAPL, US Dollar, Gold, EURUSD, USDCNY, EEM, QQQ, XLK, XLF, USDJPY, EURGBP

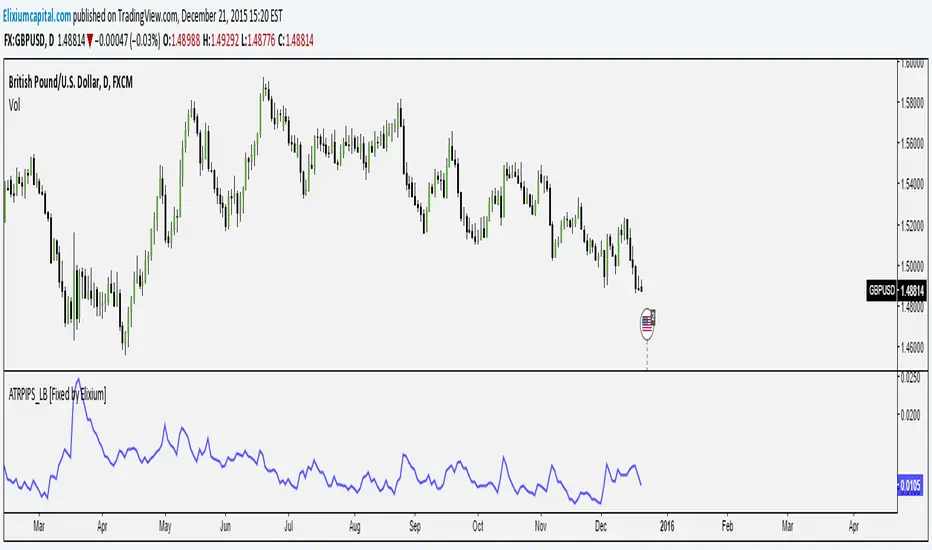
ATR Pips [LazyBear] [Fixed by Elixium]This is ATR in pips. This was requested by user @ElixiumCapital on Twitter. ATRPIPs in his words:
How to use: Change the chart to the Daily time frame. The indicators value e.g. 0.0105 means that the average daily range of the past 5 trading days is 105 pips. (On standard pairs like EURUSD, GBPUSD)
"ATR PIPs is useful for finding markets with your desired amount of volatility, for example I prefer to trade forex pairs with the highest amount of volatility in the past 5 days, setting the length parameter to 5 days. And setting my stop loss at 25% to 33% of the the indicators value."
Fixed: Default parameters and a critical bug.