Directional Deviation Index (DDI)Directional Deviation Index (DDI) is a streamlined, adaptive indicator for analyzing market cycles, detecting trend direction, and gauging momentum. By measuring how far price deviates from a smoothed average, the DDI adapts dynamically to both bullish and bearish conditions.
Key Features:
Unified Smoothing: Choose SMA or EMA for consistent, predictable signals.
Log Scale: Focus on percentage-based moves—ideal for volatile or higher-priced assets.
Adaptive Trend Levels: Auto-adjust uptrend/downtrend thresholds based on market volatility.
Momentum Visualization: Transparent color fills (green for uptrends, red for downtrends) that intensify with stronger deviations.
Customizable Sensitivity: Fine-tune uptrend and downtrend settings to suit any trading style.
Simple Alerts & Status Line: Get notified on key crossovers and track real-time price without chart clutter.
Comparison to Similar Indicators:
Bollinger Bands: Both use deviations from a moving average, but the DDI emphasizes directional momentum and adaptive threshold levels rather than fixed bands.
RSI/Stochastics: While these oscillators focus on overbought or oversold conditions, the DDI tracks how far price strays from its average, giving a clearer picture of trend strength.
MACD: MACD is built on EMA crossovers, whereas the DDI highlights deviations from a mean and adapts more directly to volatility changes.
Use the DDI to identify trend strength, spot potential reversals, and monitor evolving market conditions across stocks, crypto, forex, and beyond. It’s a versatile yet concise tool for traders seeking faster, more confident decisions.
Trendspotter

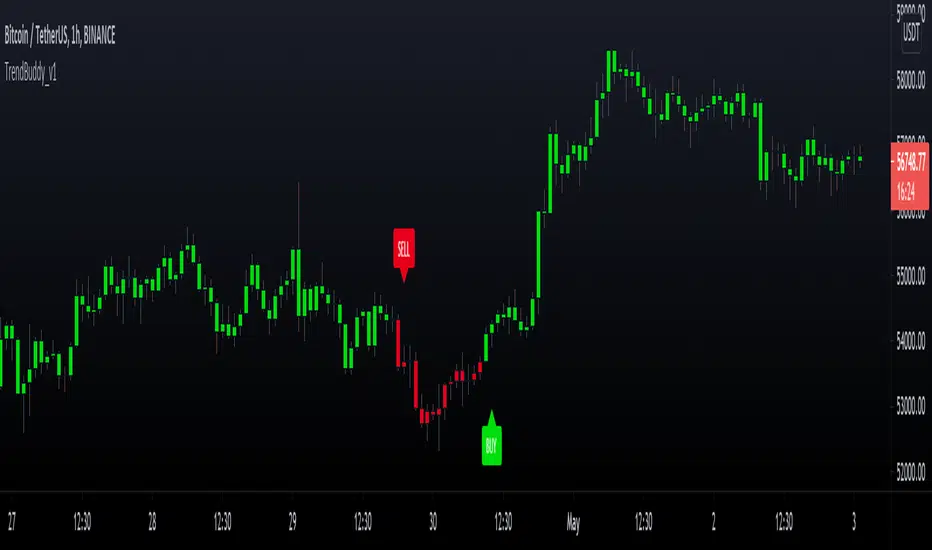
TrendBuddy_v1TrendBuddy is a trend signal generator indicator.
options:
control sensitivity of the signals
Sideways Market Detector
Filter signals based on Side Market
Indicator is based on combination of oscillators, moving averages, bollinger bands and price action.
The traders can use this tool to get trends when market is about to come out of choppy regions.
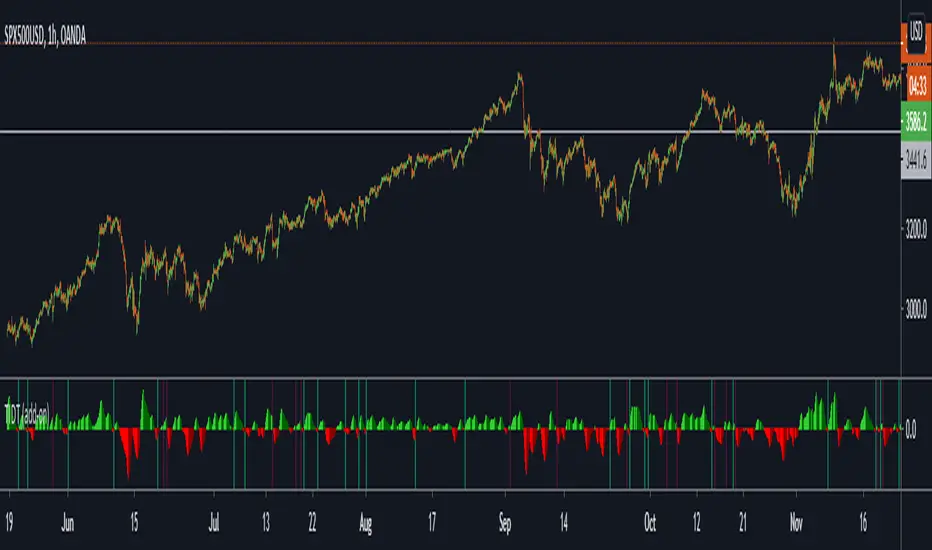
Trend Indicator for Directional Trading (add-on)TIDT is a two-part trend-based indicator designed to recognize the general direction and help you identify good opportunities for going long or short (both indicators are called the same way with "main" and "add-on" additions).
This is the add-on indicator that is added below the chart and aside from identifying trending opportunities, it also shows Bullish and Bearish Divergences. Similar to the main indicator, it is based on 3 Moving Averages over which you have full control. You can choose between the following 7 types:
- Simple Moving Average ( SMA )
- Exponential Moving Average ( EMA )
- Weighted Moving Average ( WMA )
- Running Moving Average (RMA)
- Hull Moving Average ( HMA )
- Volume Weighted Moving Average ( VWMA )
- Arnaud Legoux Moving Average ( ALMA )
I strongly suggest that the types and periods for your MAs in the main and the add-on versions are identical so that you get a better visual of the whole picture. However, you may develop a trading strategy that relies on two different types of signals, so that's entirely up to you. Once you have set up the MAs and chosen the lookback period, the rest is taken care of for you. You get two types of signals:
1) Pullbacks - the divergences between your MAs generate a result, which is then averaged as a percentage gain or loss and worked out into a histogram. The colors of the histogram indicate opportunities to buy (if green), short (if red), or sit tight (if white) unless an explicit signal is given by the indicator. Overall the principle is simple - establish the trend and look for weaknesses so that you can open an order in the direction of the trend.
2) Divergences - generated in a similar way to the Pullbacks strategy with some minor adjustments and improvements to better catch the divergences. The histogram is slightly different, as the positive results are plotted above 0 and the negative ones below 0. As such, the histogram looks a lot like MACD, but with different calculations. The color principle mentioned above is the same - green for longs, red for shorts, and white for neutral unless specified by a signal. The change of the shade of the color shows an increase or a decrease in the momentum. A Long signal comes up when the price makes a lower low, while the momentum makes a higher low. A Short signal comes up when the price makes a higher high, but the momentum makes a lower high.
Ticking a box next to the signal type will show the associated histogram and its signals. Due to the different ways those two histograms are calculated and displayed I recommend having either of them On, but not both. However, you may want to be able to see both types of signals, so I've left this as an option. Once again, all colors are fully configurable.
The complete Trend Indicator for Directional Trading has gone over 1,500 revisions, has been forked over 10 times, and has been worked out to be as minimalistic, useful, and practical as possible. A great deal of work, time, and experience have been poured into this indicator to do what it's supposed to do - help you identify better entry opportunities for increased profitability.
If you have any questions regarding the indicator or suggestions on how it could be improved, please let me know. Thank you.
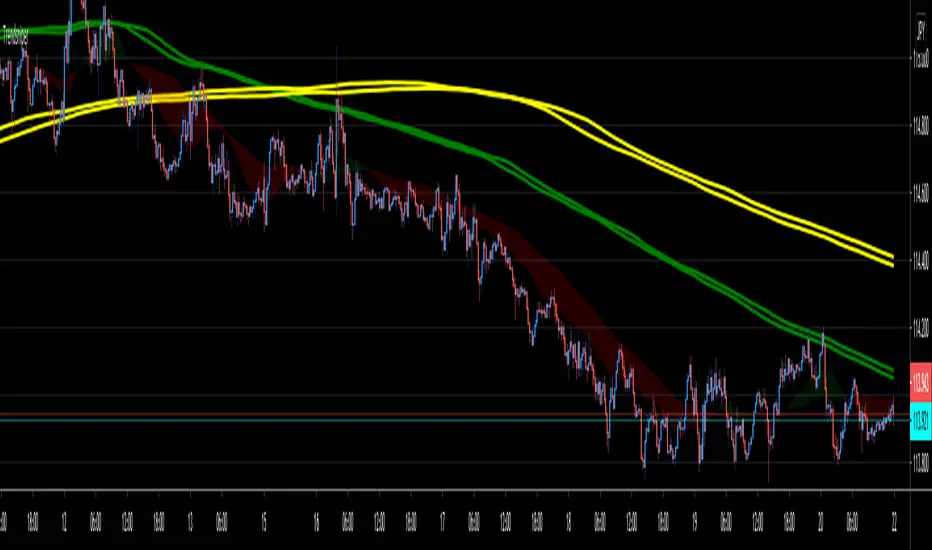
TrendsniperTrendsniper is an indicator built with MTF / 3D capability from the seconds to the weekly chart. It uses 2 key simple moving averages for MTF; the 20 and 21 with the zone fill using the 8 21 cross. We have incorporated the sma to avoid the whipsaw factor that an ema has so one can allow to stay in a trade while the trend remains as noted on the higher time frames and visible with MTF.
The longer time frame MTF moving averages give you a picture of the overall trend allowing trader to objectively trade using them to measure potential reversals and price strength. You will see that every SMA has time designations such as "15S1M" which would mean that that specific SMA is for the local time frame of 15seconds with 1M mtf inclusion. 15M60M would mean that that SMA is for the 15M local time frame chart with 60M mtf inclusion; meaning you're able to see the 60M (60minute) SMA on your 15M (15minute) chart. The same goes for the other SMAs noted in Trendsniper.
You will also notice that moving averages function as support and resistance and MTF moving averages may clearly note that on the chart.
A simple moving average is a technical indicator that can aid in determining if an asset price will continue or if it will reverse a bull or bear trend. We have used the 8, 20, 21 SMAs in this indicator to assist one with identifying the existing trend and exiting a trade when his/her conditions as a trader are met.
Higher Timeframe Trend Indicator V3.0What is it?
An indicator that depicts the trend of up to 5 higher timeframes on the same chart without needing to context-switch between charts.
Features
- Supports up to 5 timeframes
- Trends indicated by 5 colored buttons: one for each timeframe
- Varying shades of green: uptrend
- Varying shades of red: downtrend
- White/silver: sideways/neutral
- Configurable length (time period) for each timeframe
- Increase length to capture long term trends; decrease it to capture only short term ones
- Configurable sensitivity for each timeframe
- Sensitivity determines what angle is considered trending and what is not
- Increase sensitivity to capture weak trends
- Decrease sensitivity to filter out weak trends and capture only strong/steep ones
- Sensitivity ranges from 1 (least sensitive) to 3 (most sensitive)
- Move the labels around vertically for better visibility by changing the "Location" and "Offset" parameters
How should one use it?
Use it to quickly browse through charts to understand the context across timeframes, and zero in on only those that have trends aligning on the higher and lower timeframes as per your strategy. For e.g., a chart that is trending up strongly on the 15min and 60min (indicated by dark green colored buttons), and trending down on the 1 and/or 5 min (indicated by red-colored buttons), can be shortlisted for a potential pullback trade. Use your favorite pullback strategy (Supply/Demand, Support/Resistance, Moving Averages, etc.) to hop in on the trend.
How are trends determined?
The indicator uses normalized %change in price of the linear regression line segment of the chosen price sources (close, high, low, MA, etc.) over a specified length to determine trend direction and intensity
Known Issues
Will indicate the trend correctly only for timeframes *higher* than the current (visible) resolution/timeframe of the chart. Might not indicate it correctly for lower timeframes ( i.e., lower than the current (visible) resolution/timeframe of the chart). For this reason, all timeframes lower than the current resolution will be hidden in the present release.
Future releases
- I am still experimenting with various sensitivity levels and the corresponding trend shades to make the tool as accurate and intuitive as possible. These modifications might come in
- Sensitivity levels might be increased.
- Bug fixes, if any

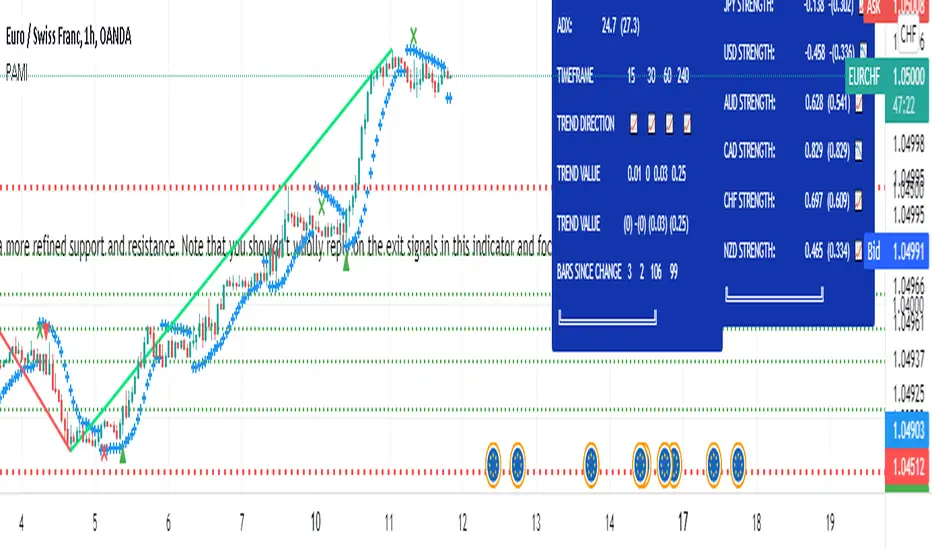
Profit Accumulator Main IndicatorMAIN INDICATOR (PAMI)
I've been using this indicator for several months now and allowed me to make some good profits as a result of this. I use this indicator in conjuntion with a number of others to allow me to make an informed decision on which trades to take and which are false signals.
The main indicator uses a number of methods including trend, momentum, volatility and volume to identify entry points into the market and exit points. The exit points are an estimate and your own target profit levels should also be used.
The following keys are used on the chart:
Green Up Arrow: Long Entry
Green Cross: Long Exit
Red Down Arrow: Short Entry
Red Cross: Short Exit
The main indicator is set up with custom alerts for when a long or short entry and exit signal is triggered.
I've been using this successfully on the one hour FX charts, but seems to work equally as well on higher or lower time frames (not less than 15min).
The main indicator has a number of tools in the settings that can be used to assist with trading. This includes
Bollinger Bands
Current Moving Averages
Multi-Timeframe Moving Averages
Chandelier Exits.
The chart is shown with the Bollinger Band overlay.
The other indicators which are part of the suite are shown on the website which is highlighted in my signature at the bottom of the page. Purchase of the main indicator gives access to the full suite of eight indicators. I use the other indicators to confirm the direction of the trade and to determine if I want to trade or not. I use it along with the 2min, 15min and 4hr timeframes to identify the best entry window and how long I'm likely to be in the trade.
Support can be provided via private message or in the comments below.
The links are provided below for access to the indicator.
TREND +SIDEWAYS OPTIMIZED algo signalsThis indicator will try to capture maximum trend of a stock
it will keep trailing stoploss to capture maximum trend
Works best in trendy markets
FEATURES:
Done and backtested on indian stocks.
Trade session and exit session can be specified as inputs.
Optional Stoploss
Specially developed for intraday trading
It would be good to use on normal candlesticks and time frame between (3 to 15 min)
INPUTS:
TRADE FREQUENCY: it can be an integer from from 1 to 5 , Frequency denotes the trading frequency,
low frequency will take less number of trades and will have HIGHER risk rewads (to use lowest frequency 1 )
High freqency it will take more trades and with less profits good for scalpers , it will have low risk and low reward)
Frequency requirement can be given between 1 to 5 , 1 is the lowest and 5 is the Highest frequency
Sideways Bias:
This is an extra filter to reduce the loss in sideways movement,
Your sideways bias can be given between 0 to 3
0 if No bias on sideways
3 if biased on sideways
Reduce the risk filter:
This would try to bok profit quickly and begginers can use this
Optional stoploss:
you can define your risk in points
Trade Quantity:This is quantity you want to trade on particular day, it is used to plot buy or sell quantity on chart (quantity is not taken into consideration in backtest)
Trade session: Session for entries can be specified
Exit session: session for exit can be specified
Custom Bactesting:
This is to provide backtesting results of a stock in given range of dates

TRENDSPOTTERHi Guys,
So TrendSpotter uses multiple indicators to catch trend moves as they happen. All you have to do it follow the entries when 2 green or red arrows appear, you enter the move.
Basically it has a few rules.
1.I trade the 1 min time-frame
2.The background turns Red ( Short ) or Green ( Long ) when the stock is going that direction.
3. Wait until the Psar is under for Long and over for Short.
4. Wait until the second Green for Long or Red for Short Arrow to appear. You are getting in on the end of the first one.
Here's my profile on Tradingview.com with all the explanations of how to use it. It can be used for FOREX and CRYPTO also.
www.tradingview.com
Check out my videos to see it's not that complicated.
If you have any questions please contact me.
Thanks,
Enda
