Trend Score HTF (Raw Data) Pine Screener📘 Trend Score HTF (Raw Data) Pine Screener — Indicator Guide
This indicator tracks price action using a custom cumulative Trend Score (TS) system. It helps you visualize trend momentum, detect early reversals, confirm direction changes, and screen for entries across large watchlists like SPX500 using TradingView’s Pine Script Screener (beta).
⸻
🔧 What This Indicator Does
• Assigns a +1 or -1 score when price breaks the previous high or low
• Accumulates these scores into a real-time tsScore
• Detects early warnings (primed flips) and trend changes (confirmed flips)
• Supports alerts and labels for visual and automated trading
• Designed to work inside the Pine Screener so you can filter hundreds of tickers live
⸻
⚙️ Recommended Settings (for Beginners)
When adding the indicator to your chart:
Go to the “Inputs” tab at the top of the settings panel.
Then:
• Uncheck “Confirm flips on bar close”
• Check “Accumulate TS Across Flips? (ON = non-reset, OFF = reset)”
This setup allows you to see trend changes immediately without waiting for bar closes and lets the trend score build continuously over time, making it easier to follow long trends.
⸻
🧠 Core Logic
Start Date
Select a meaningful historical start date — for example: 2020-01-01. This provides long-term context for trend score calculation.
Per-Bar Delta (Δ) Calculation
The indicator scores each bar based on breakout behavior:
If the bar breaks only the previous high, Δ = +1
If it breaks only the previous low, Δ = -1
If it breaks both the high and low, Δ = 0
If it breaks neither, Δ = 0
This filters out wide-range or indecisive candles during volatility.
Cumulative Trend Score
Each bar’s delta is added to the running tsScore.
When it rises, bullish pressure is building.
When it falls, bearish pressure is increasing.
Trend Flip Logic
A bullish flip happens when tsScore rises by +3 from the lowest recent point.
A bearish flip happens when tsScore falls by -3 from the highest recent point.
These flips update the active trend direction between bullish and bearish.
⸻
⚠️ What Is a “Primed” Flip?
A primed flip is a signal that the current trend is about to flip — just one point away.
A primed bullish flip means the trend is currently bearish, but the tsScore only needs +1 more to flip. If the next bar breaks the previous high (without breaking the low), it will trigger a bullish flip.
A primed bearish flip means the trend is currently bullish, but the tsScore only needs -1 more to flip. If the next bar breaks the previous low (without breaking the high), it will trigger a bearish flip.
Primed flips are plotted one bar ahead of the current bar. They act like forecasts and give you a head start.
⸻
✅ What Is a “Confirmed” Flip?
A confirmed flip is the first bar of a new trend direction.
A confirmed bullish flip appears when a bearish trend officially flips into a new bullish trend.
A confirmed bearish flip appears when a bullish trend officially flips into a new bearish trend.
These signals are reliable and great for entries, trend filters, or reversals.
⸻
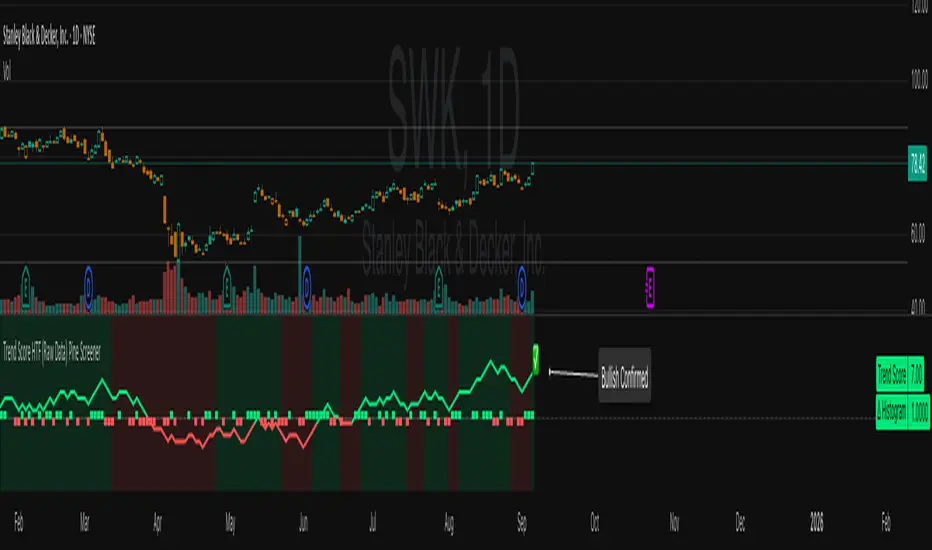
🖼 Visual Cues
The trend score (tsScore) line shows the accumulated trend strength.
A Δ histogram shows the daily price contribution: +1 for breaking highs, -1 for breaking lows, 0 otherwise.
A green background means the chart is in a bullish trend.
A red background means the chart is in a bearish trend.
A ⬆ label signals a primed bullish flip is possible on the next bar.
A ⬇ label signals a primed bearish flip is possible on the next bar.
A ✅ means a bullish flip just confirmed.
A ❌ means a bearish flip just confirmed.
⸻
🔔 Alerts You Can Use
The indicator includes these built-in alerts:
• Primed Bullish Flip — watch for possible bullish reversal tomorrow
• Primed Bearish Flip — watch for possible bearish reversal tomorrow
• Bullish Confirmed — official entry into new uptrend
• Bearish Confirmed — official entry into new downtrend
You can set these alerts in TradingView to monitor across your chart or watchlist.
⸻
📈 How to Use in TradingView Pine Screener
Step 1: Create your own watchlist — for example, SPX500
Step 2: Favorite this indicator so it shows up in the screener
Step 3: Go to TradingView → Products → Screeners → Pine (Beta)
Step 4: Select this indicator and choose a condition, like “Bullish Confirmed”
Step 5: Click Scan
You’ll instantly see stocks that just flipped trends or are close to doing so.
⸻
⏰ When to Use the Screener
Use this screener after market close or before the next open to avoid intraday noise.
During the day, if a candle breaks both the high and low, the delta becomes 0, which may cancel a flip or primed signal.
Results during regular trading hours can change frequently. For best results, scan during stable periods like pre-market or after-hours.
⸻
🧪 Real-World Examples
SWK
NVR
WMT
UNH
Each of these examples shows clean, structured trend transitions detected in advance or confirmed with precision.
PLTR: complicated case primed for bullish (but we don't when it will flip)
⚠️ Risk Disclaimer & Trend Context
A confirmed bullish signal does not guarantee an immediate price increase. Price may continue to consolidate or even pull back after a bullish flip.
Likewise, a primed bullish signal does not always lead to confirmation. It simply means the conditions are close — but if the next bar breaks both the high and low, or breaks only the low, the flip will be canceled.
On the other side, a confirmed bearish signal does not mean the market will crash. If the overall trend is bullish (for example, tsScore has been rising for weeks), then a bearish flip may just represent a short-term pullback — not a trend reversal.
You always need to consider the overall market structure. If the long-term trend is bullish, it’s usually smarter to wait for bullish confirmation signals. Bearish flips in that context are often just dips — not opportunities to short.
This indicator gives you context, not predictions. It’s a tool for alignment — not absolute outcomes. Use it to follow structure, not fight it.
Chande's TrendScore
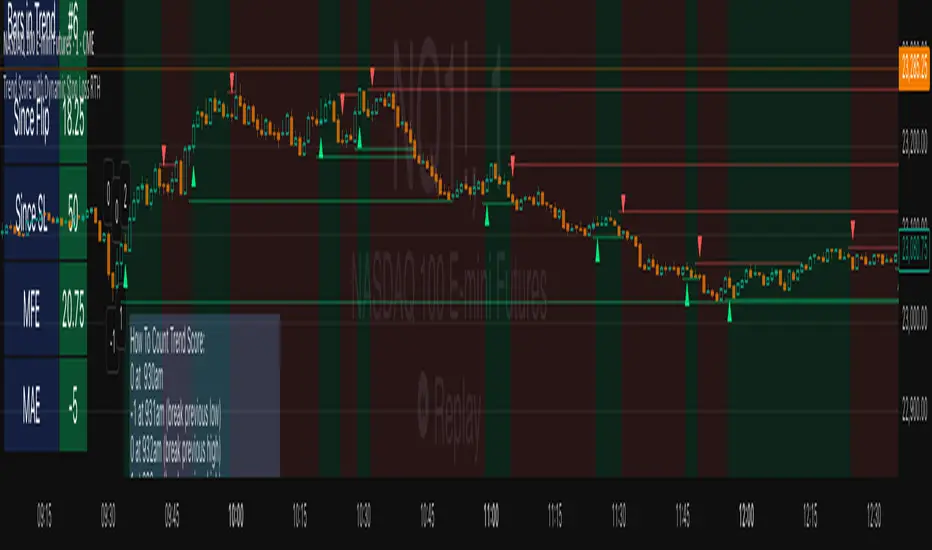
Trend Score with Dynamic Stop Loss RTH
📘 Trend Score with Dynamic Stop Loss (RTH) — Guide
🔎 Overview
This indicator tracks intraday momentum during Regular Trading Hours and flags trend flips using a cumulative TrendScore. It also draws dynamic stop-loss levels and shows a live stats table for quick decision-making and journaling.
⸻
⚙️ Core Concepts
1) TrendScore (per bar)
• +1 if the current bar makes a higher high than the previous bar (counted once per bar).
• –1 if the current bar makes a lower low than the previous bar (counted once per bar).
• If a bar takes both the prior high and low, the net contribution can cancel out within that bar.
2) Cumulative TrendScore (running total)
• The per-bar TrendScore accumulates across the session to form the cumulative TrendScore (TS).
• TS resets to 0 at session open and is cleared at session close.
• Rising TS = persistent upside pressure; falling TS = persistent downside pressure.
⸻
🔄 Flip Rules (3-point reversal of the cumulative TrendScore)
A flip occurs when the cumulative TrendScore reverses by 3 points in the opposite direction of the current trend.
• Bullish Flip
• Trigger: After a decline, the cumulative TrendScore rises by +3 from its down-leg.
• Interpretation: Bulls have taken control.
• Stop-loss: the lowest price of the prior (down) leg.
• Bearish Flip
• Trigger: After a rise, the cumulative TrendScore falls by –3 from its up-leg.
• Interpretation: Bears have taken control.
• Stop-loss: the highest price of the prior (up) leg.
Flip bars are marked with ▲ (lime) for bullish and ▼ (red) for bearish.
Note: If you prefer a different reversal distance, adjust the flip distance setting in the script’s inputs (default is 3).
⸻
📏 Stop-Loss Lines
• A dotted line is drawn at the prior leg’s extreme:
Green (below price) after a bullish flip.
Red (above price) after a bearish flip.
• Options:
Remove on touch for a clean chart.
Freeze on touch to keep a visual record for journaling.
• All stop lines are cleared at session end.
⸻
🧮 Stats Table (what you see)
• Trend: Bull / Bear / Neutral
• Bars in Trend: Count since the flip bar
• Since Flip: Current close minus flip bar close
• Since SL: Current close minus active stop level
• MFE-Maximum Favorable Excursion: Highest favorable move since flip
• MAE-Maximum Adverse Excursion: Largest adverse move since flip
Table colors reflect the current trend (green for bull, red for bear).
⸻
📊 Trading Playbook
Entries
• Aggressive: Enter immediately on a flip marker.
• Conservative: Wait for a small pullback that doesn’t violate the stop.
Stops
• Place the stop at the script’s flip stop-loss line (the prior leg extreme).
Exits
Choose one style and stick with it:
• Stop-only: Exit when the stop is hit.
• Time-based: Flatten at session close.
• Targets: Scale/close at 1R, 2R.
• Trailing: Trail behind minor swings once MFE > 1R.
Ultimately Exit choice is your own edge, so you must decide for yourself.
💡 Best Practices
• Skip the first few bars after the open (gap noise).
• Use regular candles (Heikin-Ashi will distort highs/lows).
• If you want fewer flips, increase the flip distance (e.g., 4 or 5). For more
responsiveness, use 2. Otherwise, increase your time frame to 5m, 10m, 15m.
• Keep SL lines frozen (not auto-removed) if you’re journaling.
Kalman PredictorThe **Kalman Predictor** indicator is a powerful tool designed for traders looking to enhance their market analysis by smoothing price data and projecting future price movements. This script implements a Kalman filter, a statistical method for noise reduction, to dynamically estimate price trends and velocity. Combined with ATR-based confidence bands, it provides actionable insights into potential price movement, while offering clear trend and momentum visualization.
---
#### **Key Features**:
1. **Kalman Filter Smoothing**:
- Dynamically estimates the current price state and velocity to filter out market noise.
- Projects three future price levels (`Next Bar`, `Next +2`, `Next +3`) based on velocity.
2. **Dynamic Confidence Bands**:
- Confidence bands are calculated using ATR (Average True Range) to reflect market volatility.
- Visualizes potential price deviation from projected levels.
3. **Trend Visualization**:
- Color-coded prediction dots:
- **Green**: Indicates an upward trend (positive velocity).
- **Red**: Indicates a downward trend (negative velocity).
- Dynamically updated label displaying the current trend and velocity value.
4. **User Customization**:
- Inputs to adjust the process and measurement noise for the Kalman filter (`q` and `r`).
- Configurable ATR multiplier for confidence bands.
- Toggleable trend label with adjustable positioning.
---
#### **How It Works**:
1. **Kalman Filter Core**:
- The Kalman filter continuously updates the estimated price state and velocity based on real-time price changes.
- Projections are based on the current price trend (velocity) and extend into the future (Next Bar, +2, +3).
2. **Confidence Bands**:
- Calculated using ATR to provide a dynamic range around the projected future prices.
- Indicates potential volatility and helps traders assess risk-reward scenarios.
3. **Trend Label**:
- Updates dynamically on the last bar to show:
- Current trend direction (Up/Down).
- Velocity value, providing insight into the expected magnitude of the price movement.
---
#### **How to Use**:
- **Trend Analysis**:
- Observe the direction and spacing of the prediction dots relative to current candles.
- Larger spacing indicates a potential strong move, while clustering suggests consolidation.
- **Risk Management**:
- Use the confidence bands to gauge potential price volatility and set stop-loss or take-profit levels accordingly.
- **Pullback Detection**:
- Look for flattening or clustering of dots during trends as a signal of potential pullbacks or reversals.
---
#### **Customizable Inputs**:
- **Kalman Filter Parameters**:
- `lookback`: Adjusts the smoothing window.
- `q`: Process noise (higher values make the filter more reactive to changes).
- `r`: Measurement noise (controls sensitivity to price deviations).
- **Confidence Bands**:
- `band_multiplier`: Multiplies ATR to define the range of confidence bands.
- **Visualization**:
- `show_label`: Option to toggle the trend label.
- `label_offset`: Adjusts the label’s distance from the price for better visibility.
---
#### **Examples of Use**:
- **Scalping**: Use on lower timeframes (e.g., 1-minute, 5-minute) to detect short-term price trends and reversals.
- **Swing Trading**: Identify pullbacks or continuations on higher timeframes (e.g., 4-hour, daily) by observing the prediction dots and confidence bands.
- **Risk Assessment**: Confidence bands help visualize potential price volatility, aiding in the placement of stops and targets.
---
#### **Notes for Traders**:
- The **Kalman Predictor** does not predict the future with certainty but provides a statistically informed estimate of price movement.
- Confidence bands are based on historical volatility and should be used as guidelines, not guarantees.
- Always combine this tool with other analysis techniques for optimal results.
---
This script is open-source, and the Kalman filter logic has been implemented uniquely to integrate noise reduction with dynamic confidence band visualization. If you find this indicator useful, feel free to share your feedback and experiences!
---
#### **Credits**:
This script was developed leveraging the statistical principles of Kalman filtering and is entirely original. It incorporates ATR for dynamic confidence band calculations to enhance trader usability and market adaptability.

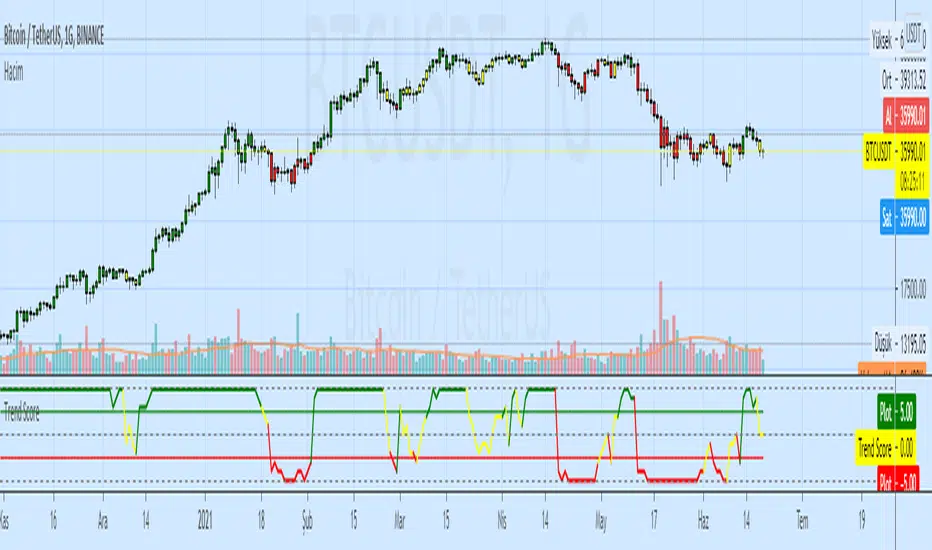
Trend Scores + Volume-Weighted Trend ScoresHere is a simple indicator based on Tushar Chande's TrendScore .
The main purpose of the TrendScore is to determine the strength and direction of a trend, which it does by comparing the current price to the prices within a user-defined window of historical prices.
In the input menu, the user defines the starting and ending period. The current price is then compared to each historical price. If the current price is greater than the given historical price, then the TrendScore is incremented, while it is decremented if it is below the given historical price. TrendScore values fluctuate between a maximum of 100 and a minimum of -100, with 100 meaning that the current price is greater than each historical price in the window and a value of -100 meaning the inverse is true.
We then use the same process to calculate the volume trend score by passing in volume to the 'getTrendScore' function. Lastly, the indicator also also calculates a 'volume-weighted trend score'. This is simply the average of the price trend score and the volume trend score. It is not plotted by default, but users can set the input option to true in the input menu and it will be plotted as a yellow line (as seen in the bottom chart).
The Chart:
The trend scores for price are plotted as a histogram. We've summarized the meaning behind its color changes below:
-If ( trendScore == 100)
then color = dark green
-if ( trendScore < 100 and trendScore is increasing)
then color = light green
-if ( trendScore > 0 and trendScore is DECREASING)
then color = pink
-if ( trendScore < 0)
then color = red
The volume trend score is plotted as a blue line. We felt that using a similar coloring system for the volume trend scores would over-crowd the chart and take away from the simplicity that makes this indicator useful. The volume-weighted trend score is plotted as a yellow line.
The main price bars change color based on the price trend score to make the values easier to visualize as well.
Interpretation:
This is a pretty versatile indicator. We summarized the ways in which traders can use it:
-Enter Long Positions when the trend score crosses zero from negative to positive territory.
-Exit Long Positions when the trend score was previously 100 and begins decreasing (ie bar color changes from dark green to pink).
-Spot bearish divergences when price trend score is 100 or relatively high and the volume trend score decreases significantly.
-Identify bullish divergences when price trend score is relatively low and volume trend score is increasing.
~Happy Trading~

Trend Score by KIVANÇ fr3762Trend Score compares close prices between last close with previous closes by a certain period of time.
It's like momentum but gives a score +1 when close price is equal to or above (defaultly) 10 bars ago and gives a score of -1 when below.
calculation continues from default length to the 2 times of length.
Defaultly (for 10 bars length)
If Trend Score converges to 10; that means there's a strong uptrend
conversely if Trend Score converges to -10; that means a strong downtrend market is on.

