SMA MAD Trend [Alpha Extract]A sophisticated trend identification system that combines Simple Moving Average with Mean Absolute Deviation methodology to create adaptive Super Trend-style bands with advanced strength filtering and gradient visualization. Utilizing ADX-based trend strength validation and slope analysis for signal quality enhancement, this indicator delivers institutional-grade trend detection with dynamic ATR-based ribbon visualization and comprehensive strength measurement. The system's dual-filter architecture eliminates false signals during weak or choppy market conditions while maintaining sensitivity to genuine trend establishment and reversal events.
🔶 Advanced SMA-MAD Band Construction
Implements innovative Mean Absolute Deviation calculation around Simple Moving Average baseline to create volatility-adaptive bands with ratcheting logic for trend persistence. The system calculates MAD by measuring absolute price deviations from the mean, then applies configurable multipliers to generate upper and lower bands that adjust to changing market conditions while preventing premature band violations.
// Core SMA-MAD Framework
SMA_Value = ta.sma(close, SMA_Length)
Mean = ta.sma(close, MAD_Length)
Abs_Deviation = abs(close - Mean)
MAD_Value = ta.sma(Abs_Deviation, MAD_Length)
// Adaptive Bands
Upper_Band = SMA_Value + MAD_Factor * MAD_Value
Lower_Band = SMA_Value - MAD_Factor * MAD_Value
🔶 Intelligent Dual-Filter System
Features comprehensive trend validation using ADX strength measurement and slope analysis to eliminate low-conviction signals during ranging or consolidating markets. The system calculates normalized slope strength using ATR scaling and combines with ADX threshold analysis, generating filtered trend states that distinguish genuine trends from temporary price fluctuations.
🔶 Dynamic Trend Strength Engine
Implements sophisticated strength calculation combining slope intensity and ADX readings to produce normalized 0-100% strength scores with gradient colour intensity modulation. The system normalizes slope by minimum threshold and ADX by configurable level, multiplying factors to create composite strength measurement that drives visual feedback intensity across all indicator elements.
🔶 Super Trend-Style Direction Logic
Utilizes classic Super Trend methodology adapted for SMA-MAD bands, where trend direction flips occur on opposite band violations with persistent state maintenance. The system tracks previous band levels with ratcheting behaviour that adjusts bands only when price movement or new calculations warrant changes, preventing oscillation during normal volatility.
🔶 ATR-Based Ribbon Visualization
Provides dynamic ribbon overlay using ATR-scaled width around the trend line with opacity modulation based on trend strength for intuitive conviction assessment. The system creates upper and lower ribbon bounds at configurable ATR multiples, filling the channel with gradient-adjusted transparency that increases during strong trends and fades during weak conditions.
🔶 Multi-Dimensional Visual Architecture
Provides complete chart integration through trend line overlay, ATR ribbon fills, candle colouring, background glow, and transition signal labels with configurable visibility toggles. The system enables traders to customize display density from minimal (trend line only) to comprehensive (all visual elements) while maintaining consistent colour scheme and strength-based intensity across components.
🔶 Slope Strength Validation
Calculates ATR-normalized slope over configurable lookback periods to measure trend line momentum and filter sideways price action. The system compares absolute slope against minimum threshold requirements, preventing trend signals when price movement relative to the trend line lacks sufficient directional conviction regardless of band position.
🔶 Signal Generation Framework
Generates trend change signals when filtered direction state transitions from bearish to bullish or vice versa, with label placement and alert integration. The system implements state persistence that maintains previous trend until both ADX and slope filters confirm directional change, reducing whipsaw signals while capturing genuine reversals with minimal lag.
🔶 Performance Optimization Framework
Utilizes efficient calculation methods with optimized variable management and configurable parameters for balance between responsiveness and stability. The system includes intelligent state tracking with NA handling for initial bars and smooth gradient calculations that maintain performance across extended historical periods and real-time updates.
This indicator delivers sophisticated trend identification through Mean Absolute Deviation methodology combined with dual-strength filtering for superior signal quality. Unlike traditional Super Trend indicators that rely solely on ATR bands, the SMA-MAD approach uses statistical deviation measurement while incorporating ADX strength and slope validation to eliminate false signals during choppy conditions. The system's gradient-based visual feedback, ATR ribbon visualization, comprehensive dashboard, and multi-dimensional filtering make it essential for traders seeking reliable trend-following approaches with clear conviction measurement across cryptocurrency, forex, and equity markets. The combination of adaptive bands, strength-based transparency, and intelligent filtering creates an institutional-grade trend system suitable for systematic trading strategies.
Trendfollowing

Kijun Sen Standard Deviation | QuantLapse SystemsOverview
The Kijun Sen Standard Deviation indicator by QuantLapse Systems is a volatility-aware trend-following framework that combines the structural equilibrium of the Kijun Sen (基準線) with statistically adaptive standard deviation bands.
By anchoring trend detection to market structure and confirming direction through volatility expansion, the indicator delivers a cleaner, more reliable regime classification across varying market conditions.
Rather than reacting to short-term noise, the system focuses on identifying statistically justified trend phases , making it well-suited for disciplined, rule-based trading.
Technical Composition, Calculation, Key Components & Features
📌 Kijun Sen (基準線) – Structural Trend Baseline
Calculated as the midpoint between the highest high and lowest low over a user-defined period.
Represents market equilibrium and structural balance rather than short-term momentum.
Naturally adapts to expanding and contracting price ranges.
Provides a stable baseline for regime detection and volatility validation.
Acts as the anchor for deviation bands and persistent trend-state logic.
Unlike fast or reactive moving averages, the Kijun Sen emphasizes price structure and equilibrium , making it especially effective for higher-quality trend confirmation.
📌 Volatility Adjustment – Standard Deviation Bands
Standard deviation is calculated over a configurable lookback to measure current price dispersion.
Upper and lower envelopes are formed by applying a deviation multiplier to the Kijun Sen.
Band width expands during volatility surges and contracts during consolidation.
Creates proportional, volatility-aware thresholds instead of static offsets.
Visually represents market energy through expanding and compressing channels.
These adaptive bands ensure that trend signals only occur when volatility supports directional movement.
📌 Trend Signal & Regime Calculation
Bullish Trend is confirmed when price closes above the upper deviation band.
Bearish Trend is confirmed when price closes below the lower deviation band.
Once established, the trend state persists until an opposing volatility break occurs.
This persistence reduces whipsaws and improves regime stability.
Trend state is reinforced with color-coded lines, envelopes, and background shading.
This volatility-confirmed persistence model is visible in the chart, where trends remain intact through minor pullbacks and only flip on decisive expansion.
How It Works in Trading
✅ Volatility-Confirmed Trend Detection – Requires expansion beyond deviation bands.
✅ Noise Suppression – Filters low-energy price movement within volatility envelopes.
✅ Regime Persistence – Maintains trend state until statistical invalidation.
✅ Immediate Visual Context – Direction, strength, and transitions are clear at a glance.
Visual Representation
Trend signals are displayed directly on price using both line and background context:
🟢 Green / Teal Kijun & Envelope → Confirmed bullish regime.
🔴 Red / Pink Kijun & Envelope → Confirmed bearish regime.
Semi-transparent band fill visualizes volatility expansion and compression.
Buy and Sell labels appear only on confirmed regime transitions.
The lower panel includes:
Strategy equity curve based on trend exposure.
Buy & Hold equity for performance comparison.
Background regime shading synchronized with trend state.
Features and User Inputs
The Kijun Sen Standard Deviation framework offers a focused yet powerful set of configurable inputs:
Kijun Sen Length – Controls structural trend sensitivity.
Standard Deviation Controls – Adjust lookback length and multiplier for regime strictness.
Backtesting & Date Filters – Define evaluation periods and starting conditions.
Display Options – Toggle labels, equity curves, and background shading.
Color Customization – Fully configurable buy/sell colors for trends and equity curves.
These controls allow users to balance responsiveness, stability, and clarity without overfitting.
Practical Applications
The Kijun Sen Standard Deviation indicator is designed for traders who prioritize structure, volatility confirmation, and regime awareness.
Primary Trend Filtering – Identify and stay aligned with dominant market direction.
Volatility-Aware Trend Following – Participate only when price expansion confirms intent.
Risk-Managed Exposure – Avoid chop during compression and transitional phases.
Systematic Strategy Development – Use as a regime engine or higher-timeframe filter.
Performance Evaluation – Compare trend-following equity against buy-and-hold benchmarks.
This framework bridges classical Ichimoku structure with modern statistical validation.
Conclusion
The Kijun Sen Standard Deviation indicator by QuantLapse Systems represents a refined evolution of Ichimoku-based trend analysis.
By integrating the structural equilibrium of the Kijun Sen with adaptive standard deviation confirmation, the system delivers clearer regime classification, reduced noise, and more reliable trend participation.
Rather than attempting to predict price, it focuses on confirming when trends are statistically justified .
Who should use Kijun Sen Standard Deviation:
📊 Trend-Following Traders – Stay aligned with dominant market structure.
⚡ Momentum & Swing Traders – Enter only on volatility-backed expansions.
🤖 Systematic & Algorithmic Traders – Ideal as a regime filter or trend-state engine.
Past performance is not indicative of future results.
Disclaimer: All trading involves risk, and no indicator can guarantee profitability.
Strategic Advice: Always backtest thoroughly, optimize parameters responsibly, and align settings with your timeframe, asset class, and risk tolerance before live deployment.

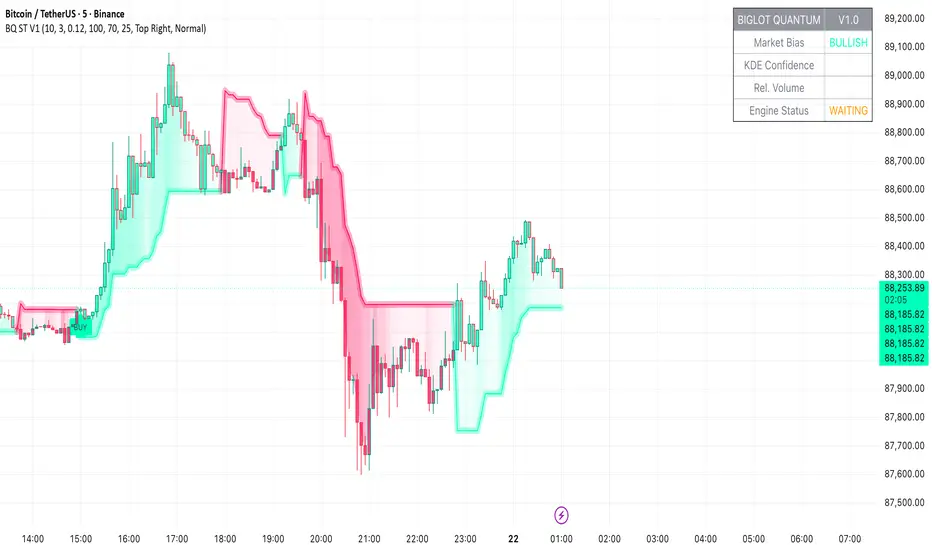
BigLot Quantum SuperTrend V1BigLot Quantum SuperTrend V1 is a trend-following indicator that enhances the traditional SuperTrend by integrating statistical volume analysis.
The script combines an ATR-based SuperTrend engine with Kernel Density Estimation (KDE) applied to relative buy and sell volume. Volume behavior is modeled statistically, allowing the indicator to filter breakout signals and activate only when volume conditions show high probability compared to historical data.
Bullish and bearish signals are generated when price crosses the SuperTrend line and the corresponding volume probability exceeds a user-defined threshold. This approach helps reduce false signals during low-liquidity or sideways market conditions.
The script includes visual trend highlighting, probability-based confidence filtering, and a real-time dashboard displaying trend direction, volume strength, and signal status. It is designed to work across all markets and timeframes without repainting.
Peace of Mind Trader: MA Trend SystemPeace of Mind Trader: MA Trend System (Free Edition)
Developed by: Peace of Mind Trader
Trade with Logic, Profit with Peace.
Contact : wizardkidtrader@gmail.com
facebook : Peace of Mind Trader
----
🇬🇧 English
Simple & Elegant Trend Following System
Stop guessing the market direction. This system is designed to guide you with clarity and peace of mind.
- Trend Ribbon: Auto-coloring EMA ribbon (🟢 Green = Uptrend / 🔴 Red = Downtrend).
- Smart Dashboard: Real-time market status (BULLISH / BEARISH) on your screen.
- Clear Signals: Non-overlapping labels for entry/exit points.
- Clean Chart: Option to hide historical signals and show only the latest one.
How to use: Buy when the ribbon is Green + "BULL" label. Sell when the ribbon is Red + "BEAR" label.
-----
🇹🇭 Thai
ระบบจับเทรนด์ ดูง่าย สบายตา
เลิกเดาทิศทางตลาดด้วยตัวเอง! ให้ระบบช่วยจับจังหวะเทรนด์ใหญ่ให้คุณ ด้วยดีไซน์ที่ทันสมัยและใช้งานง่ายที่สุด
- Trend Ribbon: ริบบิ้นเปลี่ยนสีอัตโนมัติ (🟢 เขียว = ขาขึ้น / 🔴 แดง = ขาลง)
- Smart Dashboard: แผงควบคุมบอกสถานะตลาด (BULLISH / BEARISH) ทันที
- Clear Signals: มีป้ายบอกจุดเปลี่ยนเทรนด์ชัดเจน ไม่ทับแท่งเทียน
- Clean Chart: เลือกปิดสัญญาณเก่าๆ ได้ โชว์แค่สถานะล่าสุด กราฟไม่รก
วิธีใช้: หาจังหวะ Buy เมื่อริบบิ้นสีเขียว และหาจังหวะ Sell เมื่อริบบิ้นสีแดง
----
Developed by: Peace of Mind Trader
Trade with Logic, Profit with Peace.
Contact : wizardkidtrader@gmail.com

Order Flow Pro - CVD - Alphaomega18═══════════════════════════════════════════════════════════════════════════════
ORDER FLOW CVD SIMPLE - TRADINGVIEW PUBLICATION
Created by Alphaomega18
═══════════════════════════════════════════════════════════════════════════════
📝 COMPLETE DESCRIPTION
═══════════════════════════════════════════════════════════════════════════════
🎯 FOLLOW INSTITUTIONAL TREND AT A GLANCE
Order Flow CVD is an ultra-simple and ultra-effective indicator that displays CVD (Cumulative Volume Delta) with a colored fill zone to instantly identify order flow trend.
No complexity, no clutter: just 2 lines and 1 colored zone to know if you should HOLD or EXIT your trade.
🔥 THE GOLDEN RULE OF TRADING
The secret of professional traders:
→ "Let your winners run, cut your losses"
But how do you know WHEN to hold and WHEN to exit?
**The answer: CVD (Cumulative Volume Delta)**
As long as institutional flow goes your way, HOLD the trade.
As soon as flow changes, EXIT.
This is exactly what this indicator does: it shows you the flow in real-time with ultra-clear visualization.
📊 HOW IT WORKS
🔷 **2 SIMPLE LINES**
**WHITE Line** = CVD (Cumulative Volume Delta)
→ Cumulative sum of volume delta
→ Rises when buying > selling
→ Falls when selling > buying
**YELLOW Line** = CVD Moving Average (20 periods default)
→ Smooths CVD to see trend
→ Filters noise
→ Reference for trend
🔷 **COLORED FILL ZONE**
🟢 **GREEN ZONE** = White CVD ABOVE yellow CVD
→ BULLISH trend
→ Institutions are BUYING
→ HOLD your LONG trades
→ Avoid SHORT
🔴 **RED ZONE** = White CVD BELOW yellow CVD
→ BEARISH trend
→ Institutions are SELLING
→ HOLD your SHORT trades
→ Avoid LONG
⚡ **CROSSOVER** = Zone changes color
→ Trend change
→ Exit or reverse position
→ Clear and sharp signal
🎯 USAGE RULES
📌 **RULE #1: HOLD A LONG TRADE**
You're in a LONG:
→ ✅ As long as ZONE IS GREEN → HOLD
→ ❌ As soon as ZONE TURNS RED → EXIT
Real example:
```
LONG entry: 16,500
Zone stays green for 2 hours
Price climbs to 16,650 (+150 points)
Zone turns red → EXIT
You pocket +150 points instead of giving back 50 points!
```
📌 **RULE #2: HOLD A SHORT TRADE**
You're in a SHORT:
→ ✅ As long as ZONE IS RED → HOLD
→ ❌ As soon as ZONE TURNS GREEN → EXIT
Real example:
```
SHORT entry: 16,500
Zone stays red for 1 hour
Price drops to 16,350 (-150 points)
Zone turns green → EXIT
You pocket +150 points!
```
📌 **RULE #3: DON'T ENTER COUNTER-TREND**
Green zone visible:
→ ❌ Do NOT enter SHORT
→ ✅ Look for LONG setups only
Red zone visible:
→ ❌ Do NOT enter LONG
→ ✅ Look for SHORT setups only
📌 **RULE #4: CROSSOVERS = CHANGE**
White CVD crosses yellow CVD:
→ Zone changes color
→ Institutional flow reverses
→ Exit or reverse position
💡 REAL USE CASES
📊 **CASE 1: MNQ Scalping 5min**
Setup:
→ Price breaks resistance
→ CVD zone is GREEN
→ You enter LONG
Management:
→ Price rises, pulls back, rises again
→ Zone STAYS GREEN → You hold
→ +30 points, +40 points, +50 points...
→ Zone turns RED → You exit at +52 points
Without CVD:
→ You would have exited at +15 points out of fear
→ You lose 37 points of gain!
📊 **CASE 2: ES Day Trading 15min**
Setup:
→ Price in range
→ CVD zone RED for 1 hour
→ Price touches top of range
→ You enter SHORT
Management:
→ Zone STAYS RED during decline
→ Price makes -20 points, -30 points, -40 points
→ Zone turns GREEN → You exit at +42 points
Without CVD:
→ You would have exited at +20 points (fear)
→ Or held too long and gave back gains
📊 **CASE 3: Avoid Losing Trade**
Perfect technical setup:
→ Triangle breakout
→ Supportive VWAP
→ FVG below
BUT... CVD zone is RED!
Decision:
→ You DON'T ENTER LONG
→ Price rises 10 points then collapses -30 points
→ Losing trade avoided thanks to CVD!
⚙️ CUSTOMIZABLE PARAMETERS
🔧 **CVD Moving Average Length** (default: 20)
→ Yellow moving average length
→ Shorter (10-15) = More reactive, more signals
→ Longer (30-50) = Smoother, fewer false signals
Recommendations by style:
• Scalping (1-5min): 10-15
• Day Trading (15min-1H): 20 (default)
• Swing Trading (4H-Daily): 30-50
🎨 **Show Fill Between CVD and MA** (On/Off)
→ Show/hide colored zone
→ OFF = Just 2 lines
→ ON = Lines + green/red zone
🎨 **Bullish Fill Color** (Customizable)
→ Bullish zone color
→ Default: Transparent green (80%)
→ Change to blue, cyan, or other
🎨 **Bearish Fill Color** (Customizable)
→ Bearish zone color
→ Default: Transparent red (80%)
→ Change to orange, pink, or other
💡 **Transparency Tip:**
→ 90% transparent = Very subtle
→ 80% transparent = Balanced (recommended)
→ 60% transparent = Well visible
→ 40% transparent = Very visible
📊 RECOMMENDED CONFIGURATIONS
**Scalping (1-5min) - Reactive**
```
CVD MA Length: 10
Show Fill: ✅ ON
Bullish Color: Green 70% transparent
Bearish Color: Red 70% transparent
```
**Day Trading (15min-1H) - Balanced** ⭐
```
CVD MA Length: 20
Show Fill: ✅ ON
Bullish Color: Green 80% transparent
Bearish Color: Red 80% transparent
```
**Swing Trading (4H-Daily) - Smooth**
```
CVD MA Length: 30
Show Fill: ✅ ON
Bullish Color: Green 85% transparent
Bearish Color: Red 85% transparent
```
**Minimalist - Lines only**
```
CVD MA Length: 20
Show Fill: ❌ OFF
(Just white and yellow, no zone)
```
💡 MARKETS AND TIMEFRAMES
✅ **ALL markets compatible:**
• Futures (ES, NQ, YM, RTY, MNQ, MES, etc.)
• Forex (EUR/USD, GBP/USD, USD/JPY, etc.)
• Crypto (BTC, ETH, altcoins)
• Stocks (Tesla, Apple, Nvidia, etc.)
• Indices (S&P 500, Nasdaq, Dow Jones)
✅ **All timeframes:**
• Scalping: 1min, 5min
• Day Trading: 15min, 30min, 1H ⭐ (optimal!)
• Swing Trading: 4H, Daily
Note: More reliable with real volume data
→ TradingView Premium recommended
🏆 UNIQUE ADVANTAGES
✅ **Ultimate simplicity**: 2 lines, 1 zone, 1 rule
✅ **Instant vision**: Green = hold LONG, Red = hold SHORT
✅ **Hold trades longer**: Maximize your gains
✅ **Avoid counter-trend**: Don't trade against flow
✅ **Customizable**: Colors and transparency of choice
✅ **Ultra-light**: Optimized code, no lag
✅ **No repaint**: Reliable signals
✅ **Works everywhere**: All markets, all TF
🎓 QUICK INTERPRETATION
**When zone is GREEN:**
→ Institutions buying
→ Bullish momentum
→ Hold LONG, avoid SHORT
→ Look for buy setups
**When zone is RED:**
→ Institutions selling
→ Bearish momentum
→ Hold SHORT, avoid LONG
→ Look for sell setups
**When zone CHANGES color:**
→ Institutional flow reverses
→ Trend changes
→ EXIT position
→ Or reverse if new setup
**White line volatile:**
→ White CVD zigzags a lot
→ Market indecisive or range
→ Wait for clear zone before trade
💪 TRADER PSYCHOLOGY
What THIS indicator solves:
❌ "I'm afraid, I exit too early" → Green/red zone says WHEN to exit
❌ "I hold my losses too long" → Zone changes = EXIT
❌ "I trade counter-trend" → Zone tells which direction to trade
❌ "I don't know if trend continues" → Green/red zone = answer
Result:
✅ You hold your gains longer
✅ You exit at right time
✅ You avoid counter-trend trades
✅ You trade with institutions
🔗 PERFECT COMPLEMENT
Use with:
• **Order Flow Signals** → Precise signals (💎▲🚀)
• **VWAP** → Institutional price levels
• **Fair Value Gaps** → Inefficiency zones
• **Market Profile** → POC/VPOC
**CVD Simple** tells you WHEN to hold/exit
**Technical analysis** tells you WHERE to enter
⚠️ DISCLAIMER
Technical indicators are decision support tools. No indicator guarantees profits. Always use:
• Appropriate risk management
• Stop loss on every trade
• Proper position sizing
• Demo account testing first
Order Flow CVD improves your trade management but doesn't replace a complete strategy.
🚀 INSTALLATION
1. Copy the Pine Script code
2. Open Pine Editor in TradingView
3. Paste the code
4. Click "Add to Chart"
5. Indicator displays in separate pane (below)
6. Configure colors to your preferences
7. Apply golden rule: Green = LONG, Red = SHORT!
💡 PRO TIP
**CVD Discipline:**
Create this mental rule:
→ "I NEVER exit a position until zone changes color"
This simple discipline will:
✅ Multiply your gains (you hold longer)
✅ Reduce your losses (you exit when flow changes)
✅ Eliminate emotional exits
✅ Align you with institutions
📞 CONTACT AND SUPPORT
Created by Alphaomega18
For questions, bugs or suggestions:
Find my other indicators:
• Order Flow Signals (precise signals on chart)
• Order Flow Dashboard (CVD oscillator + pressures)
• VWAP Multi-Timeframe Pro
• Fair Value Gap Detector

Trading Monster - XAUUSD Trend EngineTrading Monster – XAUUSD Trend Engine is a clean, professional trend-following visual tool designed exclusively for Gold (XAUUSD).
The indicator focuses on identifying dominant market direction and keeping traders away from counter-trend trades. It is built to reduce noise and improve visual clarity during high-volatility sessions.
This tool is best suited for:
• Intraday and swing traders
• Trend continuation setups
• Traders who avoid counter-trend entries
Designed for clarity. Built for discipline.
This tool is best used with Trading Monster - XAUUSD Trend Validator
Trading Monster – XAUUSD Trend Validator
Trading Monster – XAUUSD Trend Validator is a focused confirmation tool designed to work alongside the Trading Monster – XAUUSD Trend Engine for Gold (XAUUSD).
The indicator helps traders validate whether market conditions are aligned with the prevailing trend, reducing the chances of entering during weak, choppy, or counter-trend phases. It acts as an additional layer of discipline by confirming trend strength before execution.
When used together with the Trend Engine, the Validator assists traders in filtering low-quality setups and staying aligned with higher-probability trend conditions.
This tool is best suited for:
• Traders seeking confirmation before entry
• Trend-aligned trade filtering
• Avoiding counter-trend and sideways market conditions
Designed for confirmation. Built for consistency.

Standard Deviation Vidya Moving Average | QuantLapseStandard Deviation Vidya MA by QuantLapse
Overview
The Standard Deviation Vidya MA indicator by QuantLapse is an dynamic and unique trend-following tool that leverages Variable Index Dynamic Average (VIDYA) along with a statistical measure of standard deviation to assess trend strength, direction and volatility. By utilizing adaptive smoothing and volatility adjustment this indicator provides a more responsive and robust signal framework for traders.
______
Technical Composition, Calculation, Key Components & Features
📌 VIDYA (Variable Index Dynamic Average)
An adaptive moving average that automatically adjusts its sensitivity based on prevailing market volatility.
Employs a volatility-weighted smoothing constant derived from standard deviation ratios, allowing the average to respond faster during high-momentum phases and slow down during consolidation.
Reduces lag during trend expansion while suppressing noise in low-volatility environments.
Provides clearer trend structure and regime awareness compared to fixed-length moving averages.
Serves as a dynamic baseline for volatility envelopes and trend-state classification within the system.
📌 Volatility Adjustment – Standard Deviation
The system constructs a volatility-adaptive envelope around the VIDYA baseline using standard deviation, allowing band width to expand and contract dynamically with changing market conditions.
VIDYA’s smoothing factor is adjusted by comparing short-term and longer-term standard deviation, increasing responsiveness during volatility expansion and dampening noise during compression.
Upper and lower bands are calculated by applying a configurable standard deviation multiplier to the VIDYA value, creating a proportional volatility boundary rather than a fixed offset.
Price movement beyond these bands confirms volatility-supported momentum, while price contained within the bands signals consolidation or transitional phases.
📌 Trend Signal Calculation
A bullish trend state is triggered when price closes above the upper standard deviation band, indicating sustained upward momentum with volatility confirmation.
A bearish trend state is triggered when price closes below the lower band, confirming downside momentum under expanding volatility.
Once established, the trend state persists until an opposing volatility break occurs, reducing whipsaw and improving regime stability.
Trend direction is visually reinforced through dynamic color-coding of the VIDYA line and its envelope, providing immediate directional context at a glance.
______
How It Works in Trading
✅ Trend Strength Detection – Evaluates cumulative price movement over a defined window to assess directional conviction.
✅ Noise Reduction – Applies adaptive smoothing techniques to minimize whipsaws during choppy conditions.
✅ Dynamic Thresholding – Utilizes volatility-aware bands to define customizable trend continuation and invalidation levels.
✅ Color-Coded Visualization – Enhances chart readability by clearly distinguishing bullish, bearish, and neutral states.
______
Visual Representation
Trend Signals on Moving Average and Background Color:
🟢 Green/Teal Moving Average – Strong Uptrend
🔴 Red/Pink Candles – Strong Downtrend
✅ Long & Short Labels can be turned on or off for trade signal clarity.
📊 Display of entry & exit points based on entry and exit criteria's.
📊 Display of Indicators equity and buy and hold equity to compare performance.
______
Features and User Inputs
The Standard Deviation Vidya MA framework incorporates a flexible set of user-defined inputs designed to balance adaptability, clarity, and analytical control.
VIDYA Configuration – Customize the Variable Index Dynamic Average length and price source to control trend responsiveness based on volatility-adjusted smoothing.
Volatility & Deviation Controls – Adjust standard deviation lookback periods and multipliers to fine-tune adaptive upper and lower thresholds used for trend qualification.
Backtesting & Date Filters – Define a start date for historical evaluation and enable range filtering to analyze performance during specific market periods.
Display & Visualization Options – Toggle labels, equity curves, and visual overlays to tailor the chart presentation to personal trading preferences.
Color Customization – Fully configurable buy/sell colors for both trend signals and equity curves, allowing intuitive visual differentiation between bullish and bearish phases.
______
Practical Applications
The Standard Deviation VIDYA MA is designed for traders seeking an adaptive trend-following framework that dynamically responds to changing market volatility. By combining VIDYA’s volatility-sensitive smoothing with standard deviation–based thresholds, the indicator offers a robust approach to directional analysis across multiple market conditions.
Key applications include:
Adaptive Trend Identification – Detect sustained bullish and bearish trends using a volatility-adjusted moving average that automatically accelerates or slows based on market activity.
Volatility-Aware Entry & Exit Signals – Utilize standard deviation bands to define dynamic breakout and invalidation zones, helping reduce false signals during low-volatility consolidation phases.
Noise-Filtered Trend Participation – Avoid whipsaws by requiring price expansion beyond adaptive deviation thresholds before confirming trend direction.
Systematic Backtesting & Evaluation – Analyze historical trend performance using built-in equity curves and date filters to assess effectiveness across different market regimes.
Visual Trend Confirmation – Leverage color-coded VIDYA lines, deviation zones, and optional labels to clearly interpret trend state and momentum strength in real time.
This framework bridges volatility analysis with adaptive trend logic, providing a disciplined and data-driven method for trend participation while maintaining clarity and interpretability in live trading environments.
______
Conclusion
The Standard Deviation VIDYA MA by QuantLapse represents a modern evolution of adaptive trend analysis, blending volatility-weighted smoothing with statistically driven deviation thresholds. By integrating VIDYA’s responsiveness with standard deviation-based confirmation, the system delivers clearer trend structure, reduced noise, and more reliable directional context across varying market regimes.
This indicator is particularly well-suited for traders who value adaptability, clarity, and rule-based decision-making over static moving average techniques.
🔹 Who should use Standard Deviation VIDYA MA:
📊 Trend-Following Traders – Identify and stay aligned with sustained directional moves while avoiding premature reversals.
⚡ Momentum Traders – Capture volatility-supported expansions when price breaks beyond adaptive deviation bands.
🤖 Systematic & Algorithmic Traders – Ideal as a volatility-aware trend filter for rule-based entries, exits, and portfolio frameworks.
🔹 Disclaimer: Past performance does not guarantee future results. All trading involves risk, and no indicator or methodology can ensure profitability.
🔹 Strategic Advice: Always backtest thoroughly, optimize parameters responsibly, and align settings with your personal risk tolerance, timeframe, and market conditions before deploying the indicator in live trading.

Smart MA Zone Crossover [HMA-EMA]Smart MA Zone Crossover is a trend-following indicator designed to capture early momentum shifts using the crossover between Hull Moving Average (HMA) and Exponential Moving Average (EMA).
The indicator visually highlights trend direction using a dynamic colored zone, making it easy to identify bullish and bearish market phases at a glance.
🔸 Step 1: Moving Average Calculation
HMA (Hull Moving Average) → Faster, smoother, reacts quickly to price
EMA (Exponential Moving Average) → Stable trend reference
Both MA lengths are **fully adjustable** from the settings panel.
🔸 Step 2: Trend Detection
Bullish Trend: HMA is above EMA
Bearish Trend: HMA is below EMA
The area between the two averages is filled with color to visually represent the current trend state.
Step 3: Signal Generation (Non-Repainting)
Signals are generated **only on confirmed crossovers**:
✅ BUY Signal- HMA crosses above EMA
❌ SELL Signal-HMA crosses belowEMA
Signals do **not repaint** and appear only once per crossover.
🔸 Step 4: Visual Customization
Users can enable or disable:
* Moving average lines
* Colored MA zone fill
* Buy/Sell arrows
* Buy/Sell text labels
This allows the indicator to remain **minimal or detailed**, depending on user preference.
🔹 Key Features
✔ Non-repainting logic
✔ Clean crossover-based signals
✔ Customizable HMA & EMA lengths
✔ Optional MA zone fill
✔ Buy/Sell arrows & labels
✔ Works on all timeframes
✔ Beginner-friendly & scalper-ready
🔹 Best Use Cases
* Trend confirmation
* Momentum trading
* Scalping & intraday trading
* Swing trend filtering
For best results, combine with:
* Support & resistance
* Volume
* Higher-timeframe trend
🔹 Disclaimer
This indicator is provided for **educational purposes only**.
It is **not financial advice**. Always backtest and use proper risk management before trading live markets.

Filtered TEMA CrossoverFiltered Dual TEMA Crossover
This indicator is a trend-following tool based on the classic Dual Triple Exponential Moving Average (TEMA) Crossover strategy, enhanced with two robust filters: the Chop Index and the Average Directional Index (ADX).
The TEMA is known for its low lag and high responsiveness, making the crossover an effective signal for trend reversals. However, trading TEMA crossovers during sideways, choppy markets often leads to false signals. This is where the filters come in.
Key Features
▪️Dual TEMA Crossover: Plots two customizable TEMA lines (Fast and Slow) for clear visualization of the primary trend direction.
▪️Intelligent Signal Filtering: Buy and Sell signals are generated only when the market confirms it is in a trending state, thanks to two integrated filters:
➖Chop Index Filter: Blocks signals when the market is detected as sideways or consolidating (Chop Index reading above a user-defined threshold).
➖ADX Filter: Ensures signals are only taken when the trend strength is sufficient (ADX reading above a user-defined minimum threshold).
▪️Customizable Signals: Full control over the signal shapes (Arrows, Triangles, etc.), colors, text, and size.
How to Use It
Use the Filtered Dual TEMA Crossover to enter positions on trend continuation or reversal while dramatically reducing exposure to low-quality, whipsawing signals common in non-trending environments.
Before the filters:
After the filters:
Minimize Noise. Maximize Clarity. Trade the Trend.

Orderblock Footprints [AlgoAlpha]🟠 OVERVIEW
This script highlights orderblocks and then drills into what actually trades inside them. Zones are created only after an abnormal directional impulse, measured with a z-score on consecutive candle bodies, so the orderblocks are tied to real expansion rather than simple pivots. Once a zone exists, the script overlays lower-timeframe volume footprints inside the candle when price trades back into that zone. The goal is to show not just where an orderblock sits, but whether price is being accepted or absorbed when it is revisited.
🟠 CONCEPTS
Orderblocks are detected after extreme bullish or bearish impulses. The script tracks consecutive body movement up or down, normalizes that distance with a rolling z-score, and only triggers when the move is statistically large. The last opposite candle before that impulse defines the orderblock range. These zones then extend forward until they are either mitigated by price closing through them or they expire by age.
Inside an active zone, the script switches to a lower timeframe and builds a footprint-style profile for each bar. Each candle is split into price rows, counting time-at-price and volume delta. Positive and negative delta are colored separately. Absorption is flagged when opposing delta prints appear in the wick that rejects the zone. In practice: the impulse defines context ; the footprint shows interaction .
🟠 FEATURES
Separate bullish and bearish zones with automatic extension
Volume split inside each zone candle (up vs down volume)
Lower-timeframe footprint with TPO-style rows and delta gradient
Absorption detection using opposing delta in rejection wicks
Alerts for zone creation and absorption events
🟠 USAGE
Setup : Add the script to your chart. It works on any market and timeframe. The lower timeframe for footprints is fixed at 5 minutes, so higher chart timeframes show clearer structure. Use the Z-Score Window to control how strict impulse detection is and Max Box Age to limit how long old zones stay on the chart.
Read the chart : Bullish orderblocks are created after strong upward impulses and are invalidated when price closes below them. Bearish orderblocks are created after strong downward impulses and are invalidated when price closes above them. When price trades inside a zone, footprint rows appear. Green-tinted rows show positive delta; red-tinted rows show negative delta. Absorption labels appear when opposing delta prints into a rejecting wick.
Settings that matter : Increasing the Z-Score Window makes orderblocks rarer but more significant. Disabling Prevent Overlap allows stacked zones if you want to study clustering. Adjusting Rows per bar changes footprint resolution—lower values are cleaner, higher values show more detail but use more objects.

SuperLazyTradeSuperLazyTrade transforms SuperTrend into a professional day-trading system with intelligent quality filtering.
Instead of showing every signal, it rates each setup on a 100-point scale analyzing:
- Signal Freshness - Catch moves early
- Volume Strength - Confirm momentum
- VWAP Alignment - Trade with institutions
- Volatility Regime - Optimal market conditions
- RSI Confirmation - Momentum validation
The system blocks 35-40% of low-quality signals automatically, enforcing discipline with clear verdicts:
✅ JUMP (80+) - Best setups
⚡ TRADE (65-79) - Strong entries
⚠️ CAUTION (55-64) - Proceed carefully
🟡 TREND (45-54) - Mid-trend opportunities
🔴 AVOID (0-44) - Skip it
Features live P&L tracking, professional 11-row dashboard, and anti-repainting architecture. Perfect for traders who value quality over quantity.
⚠️ DISCLAIMER
This indicator does not guarantee profits. Trading involves substantial risk of loss. Past performance is not indicative of future results. Use at your own risk.

TradePulse ProTradepulse is a proprietary trading tool that combines a directional signal engine, a trend-adaptive trailing stop system, and a momentum confirmation oscillator into a unified decision framework. Instead of simply stacking separate indicators on a chart, TradePulse integrates these components into a single rules-based system designed to help traders act with structure rather than emotion by identifying conditions where trend and momentum are aligning.
How It Works:
Directional Signals - TradePulse uses a custom price-average model with ATR-based volatility thresholds to detect transitions between bullish and bearish environments. Buy and Sell markers appear only when price strength and volatility conditions confirm a shift. Reducing noise and late entries.
Trend-Adaptive Trailing Stop - A dynamic trailing system combines smoothed moving averages with ATR expansion logic. As price develops, the trailing level adjusts automatically and target projections update based on symmetry extensions. Helping guide structured exits and trade management.
Momentum Confirmation - A proprietary oscillator blends stochastic positioning with center-of-gravity transformation and dual smoothing. It highlights whether momentum aligns with the directional shift, helping traders avoid weaker setups and focus on higher-quality conditions.
Key Features:
- Clear Buy/Sell transitions based on multi-factor confluence
- Adaptive trailing stop + projected targets for structured management
- Momentum filtering to support higher-quality opportunities
- Sensitivity adjustments to suit different markets & styles
TradePulse is original work protected under invite-only access. It is provided for educational and informational purposes only. Trading involves risk, and signals should always be validated with your own analysis and risk management.

Moving Average Channel Breakout (No Repaint) This indicator creates a channel using two simple moving averages: SMA of highs (upper line) and SMA of lows (lower line).
How it works:
- When a candle closes above the upper channel line, the following candles turn green (bullish trend)
- When a candle closes below the lower channel line, the following candles turn red (bearish trend)
- The trend color remains until a breakout in the opposite direction occurs
Anti-repaint:
This indicator does NOT repaint. The candle color is determined at the open, based on the previous candle's close. Once a candle opens with a color, that color never changes.
Breakout strategy:
- Candle opens green → Long entry signal
- Candle opens red → Short entry signal
The signal and entry moment are perfectly synchronized at the candle open, making it ideal for systematic breakout strategies.

Trend Tracer [AlgoAlpha]🟠 OVERVIEW
This tool builds a two-stage trend model that reacts to structure shifts while also showing how strong or weak the move is. It uses a mid-price band (from the highest high and lowest low over a lookback) and applies two Supertrend passes on top of it. The first pass smoothens the basis. The second pass refines that direction and produces the final trail used for signals. A gradient fill between the two trails uses RSI of price-to-trail distance to show when price is stretched or cooling off. The aim is to give traders a simple way to read trend alignment, pressure, and early turns without guessing.
🟠 CONCEPTS
The script starts with a mid-range basis. This is the average of the rolling highest high and lowest low. It acts as a stable structure reference instead of raw close or typical price. From there, two Supertrend layers are applied:
• The first Supertrend uses a shorter ATR period and lower factor. It reacts faster and sets the main regime.
• The second Supertrend uses a slightly longer ATR and higher factor. It filters noise, waits for confirmed continuation, and generates the signal line.
The interaction between these trails matters. The outer Supertrend provides context by defining the broader regime. The inner Supertrend provides timing by flipping earlier and marking possible shifts. The gradient fill uses RSI of (close − supertrend value) to display when price stretches away from the trail. This shows strength, exhaustion, or compression within the trend.
🟠 FEATURES
Bullish and bearish flip markers placed at recent highs/lows
Rejection signals off the trend tracer line
Alerts for bullish and bearish trend changes
🟠 USAGE
Setup : Add the script to your chart. Timeframe is flexible; lower timeframes show more flips while higher ones give cleaner swings. Adjust Length to change how wide the basis range is. Use the two ATR settings and factors to match the volatility of the market you trade.
Read the chart : When the refined trail (stv_) sits above price the regime is bearish; when below, it is bullish. The wide trail (stv) confirms the larger move. Watch the gradient fill: darker colors appear when price is stretched from the trail and lighter colors appear when the move is weakening. Flip markers ▲ or ▼ highlight the first clean shift of the refined trail.
Settings that matter : Increasing the Main Factor slows main-trend flips and filters chop. Increasing the Signal Factor delays the timing trail but reduces noise. Shortening Length makes the basis more reactive. ATR periods change how sensitive each Supertrend pass is to volatility.

ZynIQ Pullback Zones Lite - (Lite Pack)Overview
ZynIQ Pullback Zones Lite identifies dynamic EMA-based retracement areas inside trending markets. These zones highlight where price is most likely to pull back before continuing in the dominant direction. The tool is intentionally simple, visual, and designed to complement the rest of the ZynIQ Lite package without adding noise or complexity.
This is a contextual tool — ideal for timing continuation entries, filtering counter-trend trades, and improving overall trend structure awareness.
Key Features
• Dynamic pullback zones using profile-based EMA + ATR
• Smart trend detection with optional HTF confirmation
• Fresh-touch recognition for potential continuation setups
• Clean ZynIQ-themed visuals (teal/fuchsia zones)
• Lightweight chart footprint for intraday and swing traders
• ZynIQ Lite HUD with profile, trend and HTF status
• Moveable watermark for clear branding on streams and screenshots
• Alerts for long and short pullback opportunities
Use Cases
• Identifying pullback areas within established trends
• Avoiding early entries during retracements
• Timing continuation setups more cleanly
• Filtering false breakouts and counter-trend traps
• Combining with breakout or momentum tools for confluence
• Works on crypto, forex, indices and commodities
Notes
This tool provides structure and context for pullback-based trend trading.
It is not a standalone strategy and should be combined with your preferred confirmations and risk management rules.

YSR TRIDENT FX - Smoothed Heiken Ashi Candles – Offset Version🧿 What This Indicator Does
This indicator plots Smoothed Heiken Ashi Candles with a custom vertical offset, allowing traders to view both:
Regular price candles
Smoothed Heiken Ashi trend candles
side-by-side without overlapping.
Traditional Heiken Ashi candles can hide real price movement.
This version solves that by adding double smoothing + adjustable spacing, giving crystal-clear trend visualization while preserving real market structure.
🔥 Key Features
✅ 1. Dual EMA Smoothing
The script applies smoothing twice:
First smoothing: EMA applied on OHLC
Second smoothing: EMA applied on Heiken Ashi values
This creates ultra-clean trend candles with reduced noise.
✅ 2. Adjustable Vertical Distance (Offset)
Control how far Smoothed HA candles appear from regular candles.
Great for:
Scalpers
Price Action traders
educators (clean charts)
No overlap → cleaner market structure.
✅ 3. Accurate Heiken Ashi Formula
Uses:
HA Close = Average of smoothed OHLC
HA Open = Previous HA Open + Previous HA Close / 2
HA High / Low = True trend-based levels
Fully compatible with all markets and timeframes.
🌈 Color Coding
Green → Bullish Trend
Red → Bearish Trend
(The colors follow the smoothed structure, not raw candles.)
✔️ Best Used For
Trend following
Reversal filtering
Identifying clean directional bias
Removing noise from volatile markets
⭐ Recommended Settings
Length 1: 9
Length 2: 9
Vertical Distance: 0.3% to 1%

5 DMA Entry Plus5 DMA Entry Plus - Multi-Strategy Entry Signal Indicator
Overview:
The 5 DMA Entry Plus is a versatile entry signal indicator that combines multiple proven technical analysis methods to identify potential buy opportunities. This indicator is designed to be highly customizable, allowing traders to toggle between different entry strategies or combine them for confluence-based entries.
Key Features:
1. Multiple Entry Strategy Options:
Default Close Above Entry: Triggers when price closes above the 5-day moving average (with optional HMA filter)
Green Wick Candle Signal: Identifies bullish candles where the wick pierces above key moving averages, indicating rejection of lower prices
5DMA Zero/Upslope Entry: Generates signals when the 5DMA is flat or sloping upward, confirming momentum
HMA Cross Entry: Triggers when price crosses above the Hull Moving Average, a responsive momentum indicator
2. Adaptive HMA Filter:
Toggle the HMA (Hull Moving Average) filter on or off to adjust signal sensitivity. When enabled, price must be above both the 5DMA and 20 HMA for confirmation. When disabled, only the 5DMA is required, generating more frequent signals.
3. Smart Reset Logic:
The indicator includes intelligent reset functionality that prevents signal spam. Once an entry signal is generated, no new signals appear until price closes below the moving average(s), ensuring clean, actionable entries without clutter.
4. Visual Components:
5-Day Moving Average (Blue Line): The primary trend reference
20-Period Hull Moving Average (Orange Line): Fast-responding momentum filter
Buy Signals (Green Labels): Clear "Buy" labels appear below candles when entry conditions are met
Built-in Alerts: Set up custom alerts to be notified when entry signals trigger
Customizable Inputs:
Use HMA Filter: Enable/disable the 20 HMA confirmation requirement
Include Green Wick Candle Signal: Toggle wick-based entry detection
Use 5DMA Zero/Upslope Entry: Enable slope-based entry logic
Use HMA Cross Entry: Enable HMA crossover signals
HMA Length: Adjust the Hull Moving Average period (default: 20)
Best Use Cases:
Swing trading on daily and 4-hour timeframes
Identifying pullback entries in uptrends
Combining multiple confirmation signals for high-probability setups
Filtering entries in momentum-based strategies
Strategy Flexibility:
This indicator allows you to use each entry method independently or combine multiple methods for confluence. Test different combinations to find what works best for your trading style and the instruments you trade.
Risk Management Note:
This indicator identifies potential entry points but does not provide exit signals or stop-loss levels. Always use proper risk management and combine with your own exit strategy.

Vantage-X (2.0)Vantage-X (2.0) — The Clean-Chart Trading Dashboard
Vantage-X (2.0) is a next-generation, all-in-one chart optimization dashboard designed for traders who want clarity, precision, and zero clutter. Whether you scalp, day trade, or swing trade, this indicator removes the noise and gives you the exact market signals that matter, all from one clean, minimal interface.
Built for traders who are tired of overcrowded charts filled with lines, clouds, bands, and unnecessary indicators, Vantage-X (2.0) brings everything together into a powerful visual dashboard — so you can focus on price action, not distraction.
⸻
🔹 What’s New in Version 2.0
Vantage-X (2.0) adds several high-value trend-tracking systems to improve timing, confirmation, and momentum detection:
• EMA 50 / EMA 200 Cross
A classic long-term momentum and directional bias filter.
Perfect for identifying macro trend shifts or avoiding trades against the dominant trend.
• EMA 20 / EMA 50 Cross
A medium-term trend confirmation system used by professional intraday traders to time pullbacks, continuations, and structure-based setups.
• EMA 5 / EMA 13 Cross
A fast-reaction signal for sudden bursts of volatility.
Ideal for scalpers catching early momentum, breakouts, retests, and reversal flips.
All three systems come with full toggles, so you can enable or disable any layer depending on your style.
All three EMA Crosses work on the current timeframe you are looking at.
⸻
🔹 Core Purpose
The purpose of Vantage-X is simple:
Give traders a clean, powerful dashboard that replaces multiple indicators — without ever touching the price chart.
No more overlapping lines.
No more stacked indicators taking up screen space.
No more analysis paralysis.
Just fast, easy, intuitive signals displayed in a compact table so you can instantly read the market’s story.
⸻
🔹 Features
✔ Ultra-clean dashboard layout (does not clutter your chart)
✔ Trend direction & EMA cross signals
✔ Color-coded bias detection (bullish, bearish, neutral)
✔ Adjustable toggle system for full customization
✔ Works on all markets & timeframes
✔ Designed for scalpers, day traders, and swing traders
✔ Perfect for traders who rely on price action but still want smart confirmation
⸻
🔹 Why Traders Love It
Vantage-X is built for the modern trader — the type who values simplicity, clarity, and speed. Every feature in this dashboard is made to:
• Reduce hesitation
• Improve timing
• Simplify decision-making
• Keep charts visually clean
• Remove emotional noise
• Increase confidence in entries and exits
If you want a chart that stays clean but still gives high-precision market signals, Vantage-X is built for you.
⸻
🔹 Free to Use — For the Trading Community
Vantage-X (2.0) is completely free.
No paywalls. No locked features.
This release is my contribution to traders who want a cleaner, more efficient way to interpret the market without relying on a dozen indicators layered on top of each other.
⸻
🔹 Final Notes
Vantage-X (2.0) is continuously evolving, and future versions will bring even more flexibility, signal refinement, and dashboard intelligence. Feedback is always welcomed — I want this to be one of the most useful and clean charting tools available on TradingView.
🔥 {COMING SOON: You will be able to set different timeframes for each EMA cross Signal. So if you are looking at 5min timeframe but you want to know 15min 20/50 EMA cross. You will be able to adjust that in settings. SO NO SWITCHING BACK AND FORTH BETWEEN DIFFERENT TIMEFRAME CHARTS!!} 🔥

The 'Qualified' POI Scorer [PhenLabs]📊 The “Qualified” POI Scorer (Q-POI)
Version: PineScript™ v6
📌 Description
The “Qualified” POI Scorer helps intermediate traders overcome "analysis paralysis" by filtering Smart Money Concepts (SMC) structures based on their probability. Instead of flooding your chart with every possible Order Block, this script assigns a proprietary “Quality Score” (0-100) to each zone. It analyzes the strength of the displacement, the presence of imbalances (FVG), and liquidity mechanics to determine which zones are worth your attention. It is designed to clean up your charts and enforce discipline by visually fading out low-quality setups.
🚀 Points of Innovation
Dynamic “Glass UI” Transparency that automatically fades weak zones based on their score.
Proprietary Scoring Algorithm (0-100) based on three distinct institutional factors.
Visual Icon System that prints analytical context (💧— 🚀/🐌—🧱) directly on the chart.
Automated Mitigation Tracking that changes the visual state of zones after they are tested.
Displacement Velocity calculation using ATR to verify institutional intent.
🔧 Core Components
Liquidity Sweep Engine: Detects if a pivot point grabbed liquidity from the previous X bars before reversing.
FVG Validator: Checks if the move away from the zone created a valid Fair Value Gap.
Momentum Scorer: Calculates the size of the displacement candle relative to the Average True Range (ATR).
🔥 Key Features
Quality Filtering: Automatically hides or dims zones that score below 50 (user configurable).
State Management: Zones turn grey when mitigated and delete themselves when invalidated.
Visual Scorecard: Displays the exact numeric score on the zone for quick decision-making.
Time-Decay Logic: Keeps the chart clean by managing the lifespan of old zones.
🎨 Visualization
High Score Zones (80-100): Display as bright, semi-solid boxes indicating high probability.
Medium Score Zones (50-79): Display as translucent “glass” boxes.
Low Score Zones (<50): Display as faint “ghost” boxes or are completely hidden.
Rocket Icon (🚀): Indicates high momentum displacement.
Snail Icon (🐌): Indicates low momentum displacement.
Drop Icon (💧): Indicates the zone swept liquidity.
Brick Icon (🧱): Indicates the zone is supported by an FVG.
📖 Usage Guidelines
Swing Structure Length (Default: 5): Controls the sensitivity of the pivot detection; lower numbers create more zones, higher numbers find major swing points.
ATR Length (Default: 14): Determines the lookback period for calculating relative momentum.
Minimum Quality Score (Default: 50): The threshold for which zones are considered “valid” enough to be fully visible.
Bullish/Bearish Colors: Fully customizable colors that adapt their own transparency based on the score.
Show Weak Zones (Default: False): Toggles the visibility of zones that failed the quality check.
✅ Best Use Cases
Filtering noise during high-volatility sessions by focusing only on Score 80+ zones.
Confirming trend continuation entries by looking for the Rocket (🚀) momentum icon.
Avoiding “stale” zones by ignoring any box that has turned grey (Mitigated).
⚠️ Limitations
The indicator is reactive to closed candles and cannot predict news-driven spikes.
Scoring is based on technical structure and does not account for fundamental drivers.
In extremely choppy markets, the ATR filter may produce lower scores due to lack of displacement.
💡 What Makes This Unique
It transforms subjective SMC analysis into an objective, quantifiable score.
The visual hierarchy allows traders to assess chart quality in milliseconds without reading data.
It integrates three separate SMC concepts (Liquidity, Imbalance, Structure) into a single tool.
🔬 How It Works
Step 1: The script identifies a Swing High or Low based on your length input.
Step 2: It looks backward to see if that swing swept liquidity, and looks forward to check for an FVG and displacement.
Step 3: It calculates a weighted score (30pts for Sweep, 30pts for FVG, 40pts for Momentum).
Step 4: It draws the zone with a transparency level designated by the score and appends the relevant icons.
💡 Note:
For the best results, use this indicator on the timeframe you execute trades on (e.g., 15m or 1h). Do not use it to find entries on the 1m chart if your analysis is based on the 4h chart.

Filter Bar1. Indicator Name
Filter Bar
2. One-line Introduction
A trend-aware bar coloring system that visualizes market direction and strength through adaptive transparency based on regression scoring.
3. General Overview
Filter Bar+ is a minimalist but powerful trend visualization tool that colors chart bars according to market direction and momentum strength.
It analyzes the linear regression trend alignment over a specified lookback period and uses a pairwise comparison algorithm to determine whether the market is in a bullish, bearish, or neutral state.
The result is a "trend score" that gets normalized to reflect trend intensity (0~1).
Bar colors are then dynamically updated using the specified bullish or bearish base colors, where higher intensity results in more opaque (darker) bars, and weaker trends lead to lighter, faded tones.
If no strong trend is detected, bars are shown in gray, signaling indecision or neutrality.
The strength of this indicator lies in its simplicity—it doesn’t draw lines, waves, or shapes, but overlays insight directly onto the chart through smart color cues.
It’s particularly effective as a background filter for price action traders, scalpers, and anyone who prefers clean charts but still wants embedded directional context.
4. Key Advantages
🎨 Adaptive Bar Coloring
Bar color opacity increases with trend strength, offering instant visual confirmation without clutter.
📊 Quantified Trend Direction
Uses a regression-based scoring system to reliably detect uptrends, downtrends, or sideways markets.
⚖️ Customizable Sensitivity
Parameters like lookback period and tolerance percentage give users full control over signal responsiveness.
🧼 Clean Chart Presentation
No lines, shapes, or overlays—just color-coded bars that blend into your existing chart setup.
🚀 Lightweight & Fast
Minimal computational load ensures it works smoothly even on lower-end devices or multiple chart setups.
🔒 Secure Internal Logic
Algorithm is neatly encapsulated and optimized, with no critical logic exposed.
📘 Indicator User Guide
📌 Basic Concept
Filter Bar+ evaluates trend direction and strength using a pairwise comparison of linear regression values.
The result determines whether the market is bullish, bearish, or neutral, and adjusts bar colors accordingly.
It visually amplifies the current market state without drawing any indicators on the chart.
⚙️ Settings Explained
Lookback Period: Number of bars used to compare regression values
Range Tolerance (%): Minimum score required to label a trend as bullish or bearish
Regression Source: Data input used for regression (default: close)
Linear Regression Length: Period for generating the base regression line
Bull/Bear Base Colors: Choose colors to represent bullish or bearish bars
📈 Buy Timing Example
Bars are green (or user-set bullish color) and becoming more vivid
Indicates a strengthening bullish trend; helpful when used alongside breakout confirmation or support zones
📉 Sell Timing Example
Bars turn red (or your custom bearish color) with increasing opacity
Signals growing bearish pressure; acts as confirmation during short setups or breakdowns
🧪 Recommended Use Cases
Combine with volume, RSI, or price action setups for direction filtering
Ideal for clean chart strategies where visual simplicity is preferred
Use as a confirmation layer to reduce noise in sideways markets
🔒 Precautions
This is a visual filter, not a signal generator—use alongside other strategies for entries/exits
In choppy markets, bars may flicker between colors—adjust sensitivity as needed
Works best when you already have a directional thesis and want to validate it visually
Always test settings for your asset/timeframe before applying in live trades

Momentum Tide [Alpha Extract]A sophisticated momentum-based trend identification system that measures normalized price deviation from an EMA baseline using ATR scaling and hyperbolic tangent smoothing for precise trend state classification. Utilizing advanced signal processing with configurable neutral bands and slope sensitivity adjustments, this indicator delivers institutional-grade momentum analysis with continuous strength measurement and visual trend confirmation. The system's three-state classification (bullish, bearish, neutral) combined with dynamic color intensity scaling provides comprehensive market momentum assessment across varying volatility conditions.
🔶 Advanced Baseline Deviation Framework
Implements EMA-based baseline calculation with ATR-normalized deviation measurement to create volatility-adjusted momentum signals. The system calculates raw price deviation from the baseline, scales by ATR and slope sensitivity factor, then applies exponential smoothing for stable signal generation with reduced noise and false transitions.
// Core Momentum Calculation
Baseline = ta.ema(close, Baseline_Length)
ATR_Value = ta.atr(ATR_Length)
Raw_Deviation = (close - Baseline) / (ATR_Value * Slope_Scaler)
Signal = ta.ema(Raw_Deviation, Signal_Smoothing)
🔶 Hyperbolic Tangent Normalization Engine
Features sophisticated tanh transformation that clamps raw deviation signals into normalized -1 to +1 range for consistent interpretation across all market conditions. The system applies safe exponential calculations with value capping to prevent overflow while maintaining signal sensitivity, creating bounded momentum readings suitable for systematic threshold analysis.
// Tanh Normalization
Clamped_Signal = tanh(Signal) // Bounded to
Strength = abs(Clamped_Signal) // Momentum intensity
🔶 Three-State Classification System
Implements intelligent trend state determination using configurable neutral band thresholds to reduce whipsaw signals during ranging conditions. The system classifies market as bullish (+1) when momentum exceeds upper neutral band, bearish (-1) below lower neutral band, and neutral (0) within the band, providing clear directional bias with built-in consolidation recognition.
🔶 Dynamic Color Intensity Architecture
Provides advanced visual feedback through momentum strength-based color intensity modulation, where stronger trends display more opaque colors and weaker trends show increased transparency. The system dynamically adjusts color alpha values based on absolute momentum strength, creating intuitive visual representation of trend conviction across baseline, candles, and bars.
🔶 Trend Strength Meter Visualization
Features innovative horizontal gradient meter displaying real-time momentum position across bear-to-bull spectrum with 24-segment resolution. The system creates smooth color transitions from bearish red through neutral gray to bullish green, with arrow indicator showing precise momentum location for instant trend strength assessment without cluttering the price chart.
🔶 Intelligent Flip Detection System
Generates transition markers when trend state changes from neutral/bearish to bullish or neutral/bullish to bearish, with duplicate signal suppression to prevent marker clustering. The system tracks previous signal states and only plots new markers on genuine trend reversals, providing clean entry signal visualization for systematic trading approaches.
snapshot
🔶 Configurable Neutral Band Framework
Implements adjustable neutral zone width using ATR percentage parameters to optimize signal frequency for different trading styles and market conditions. Wider bands reduce flip frequency for position trading while tighter bands increase sensitivity for active trading strategies, enabling customization without code modification.
🔶 Slope Sensitivity Adjustment
Features slope scaler parameter that modulates ATR normalization factor, controlling signal smoothness versus responsiveness trade-off. Higher values create smoother momentum readings with fewer transitions while lower values increase snappiness for faster reaction to price changes, allowing optimization across different volatility regimes and timeframes.
🔶 Comprehensive Visual Integration
Provides multi-dimensional trend visualization through color-coded baseline overlay, momentum-synchronized candle coloring, and bar color modification with configurable display toggles. The system includes optional flip markers and strength meter with position control for complete chart integration without visual overload.
🔶 Performance Optimization Framework
Utilizes efficient calculation methods with optimized table management for strength meter updates and minimal computational overhead for real-time momentum processing. The system includes intelligent state tracking and safe mathematical operations to prevent errors during extreme market conditions while maintaining consistent performance.
🔶 Why Choose Momentum Tide ?
This indicator delivers sophisticated momentum-based trend analysis through normalized deviation measurement and intelligent three-state classification. Unlike traditional momentum oscillators that operate in separate windows, Momentum Tide integrates directly with price action through baseline overlay and candle coloring while providing the analytical depth of bounded momentum measurement. The system's combination of tanh normalization, configurable neutral bands, dynamic color intensity, and innovative strength meter makes it essential for traders seeking adaptive trend-following approaches with clear visual feedback across cryptocurrency, forex, and equity markets. The three-state system naturally filters ranging periods while the momentum strength measurement enables position sizing and confidence assessment for systematic trading strategies.

Change in State of Delivery CISD [AlgoAlpha]🟠 OVERVIEW
This script tracks how price “changes delivery” after failed attempts to push in one direction. It builds swing levels from pivots, watches for those levels to be wicked, and then checks if price delivers cleanly in the opposite direction. When the pattern meets the script’s tolerance rules, it marks a Change in State of Delivery (CISD). These CISD levels are drawn as origin lines and are used to spot shifts in intent, failed pushes, and continuation attempts. A CISD becomes stronger when it forms after opposing liquidity is swept within a defined lookback.
🟠 CONCEPTS
The script first defines structure using swing highs/lows. These levels act as potential liquidity points. When price wicks through a swing, the script registers a mitigation event. After this, it looks for a reversal-style candle sequence: a failed push, followed by a counter-move strong enough to pass a tolerance ratio. This ratio compares how far price expanded away from the failed attempt versus the counter-move that followed. If the ratio is high enough, this becomes a CISD. The idea is simple: liquidity interaction sets context , and the tolerance logic identifies actual intent . CISD levels and sweep markers combine these two ideas into a clean map of where delivery flipped.
🟠 FEATURES
Liquidity tracking: marks swing highs/lows and updates them until expiry
Liquidity sweep confirmation when CISD aligns with recent mitigations
Alert conditions for all key events: mitigations, CISDs, and strong CISDs
🟠 USAGE
Setup : Add the script to your chart. Use it on any timeframe where swing behavior matters. Set the Swing Period for how wide a pivot must be. Set Noise Filter to control how strict the CISD detection is. Liquidity Lookback defines how recent a wick must be to confirm a sweep.
Read the chart : Origin lines mark where the CISD began. A green line signals bullish intent; a red line signals bearish intent. ▲ and ▼ shapes show CISDs that form after liquidity is swept, these mark strong signals for potential entry. Swing dots show recent swing highs/lows. Candle colors follow the latest CISD trend.
Settings that matter : Increasing Swing Period produces fewer but stronger swings. Raising Noise Filter requires cleaner counter-moves and reduces false CISDs. Liquidity Lookback controls how strict the sweep confirmation is. Expiry Bars decides how long swing levels remain active.

Screener (SSA) [AlgoAlpha]🟠 OVERVIEW
This script is a multi-symbol screener that serves as a dashboard companion to the "Smart Signals Assistant (SSA)" indicator. Its purpose is to monitor the entire suite of SSA components—from the core signals to all confluence tools—across a customizable watchlist of up to 18 assets. By displaying the real-time status of each indicator in a single table, it allows traders to get a bird's-eye view of the market, quickly identify assets with strong trend confluence, and filter for high-probability setups without needing to switch charts.
The screener is designed to mirror the modularity of the main SSA indicator, allowing you to enable or disable components in the table to match your preferred trading dashboard.
🟠 CONCEPTS
The screener is built directly on the analytical framework of the Smart Signals Assistant, applying its complex, proprietary algorithms to each symbol in your watchlist and summarizing the results. The combination of these different analytical concepts is what gives the screener its utility, as it helps traders find opportunities where multiple, distinct strategies align.
Each column in the table represents a core trading concept:
Smart Signals: This is the primary signal engine, designed to identify potential entry points. It operates in different modes to capture both long-term swings and faster scalping opportunities.
Fair Value Trail (FVT): This component provides a dynamic, volatility-adjusted baseline for the trend. It acts as a form of dynamic support or resistance, helping to confirm the validity of a trend shown by the Smart Signals.
Trend Spine: This tool is designed to identify the underlying "backbone" of the market's trend. It filters out short-term price noise to provide a more stable, clear indication of the dominant market direction.
Trend Bias: This measures the strength and conviction behind a trend. It helps distinguish between a strong, accelerating move and a weak, decelerating one, adding a layer of momentum analysis.
Firmament Clouds: These are volatility-based bands that create dynamic overbought and oversold zones. They help identify when price is potentially overextended and due for a pullback or consolidation.
Trend-Range Classifier (TRC): A machine-learning model that analyzes market characteristics to classify the current environment as either "Trending" or "Ranging." This is crucial for helping traders apply the right strategy for the current conditions.
🟠 FEATURES
This screener organizes the complex data from the SSA indicator into a simple, color-coded table. Here is a breakdown of each column and its possible values:
Asset: Displays the ticker symbol for the asset being analyzed.
Smart Signals: Shows the latest signal from the core engine.
▲: A standard bullish signal has been detected.
▼: A standard bearish signal has been detected.
▲+: A strong bullish signal with higher conviction has been detected.
▼+: A strong bearish signal with higher conviction has been detected.
Fair Value Trail: Indicates the trend direction based on the volatility trail.
▲: The FVT is in a bullish trend (acting as dynamic support).
▼: The FVT is in a bearish trend (acting as dynamic resistance).
Trend Spine: Shows the direction of the core underlying trend.
▲: The underlying trend backbone is bullish.
▼: The underlying trend backbone is bearish.
Trend Bias: Measures the current momentum strength.
Strong▲: Strong and accelerating bullish momentum.
Weak▲: Bullish momentum exists but is weakening.
Strong▼: Strong and accelerating bearish momentum.
Weak▼: Bearish momentum exists but is weakening.
Firmament Clouds: Identifies overbought/oversold conditions relative to volatility.
Very Overbought / Overbought: Price is significantly extended above its recent range.
Very Oversold / Oversold: Price is significantly extended below its recent range.
Neutral: Price is trading within its normal volatility range.
Trend-Range Classifier: Displays the market state as determined by the ML model.
Trend: The market is in a trending environment, suitable for trend-following strategies.
Range: The market is in a ranging or consolidating environment, suitable for mean-reversion strategies.
Exit Signal Count: Tracks the number of take-profit signals that have occurred since the last primary Smart Signal.
0, 1, 2, 3...: A numerical count of exit signals. A higher number suggests a trend may be maturing or exhausting.
🟠 USAGE
The main purpose of the screener is to quickly identify assets where multiple components of the SSA system are in alignment, indicating a high-confluence trading opportunity.
1. Setup and Configuration:
Add the screener to your chart.
Go into the settings and populate the "Watchlist" group with the symbols you wish to monitor.
Ensure the settings for the components (Time Horizon, Signal Mode, etc.) are synchronized with the settings on your main SSA indicator for consistency.
2. Interpreting the Columns for Trading Decisions:
Start with the Big Picture (TRC): First, look at the "Trend-Range Classifier" column. If it shows "Trend," you should be looking for trend-following setups. If it shows "Range," you might avoid taking strong trend signals.
Establish Directional Bias (Spine & Bias): For trend-following, look for assets where the "Trend Spine" and "Trend Bias" agree. A "▲" in the Spine column combined with a "Strong▲" in the Bias column indicates a healthy and robust uptrend.
Time Your Entry (Smart Signals): Once you have an asset with a clear bias, watch the "Smart Signals" column for a fresh signal that aligns with that bias. A "▲+" signal appearing in an asset with a strong bullish bias across other columns is a high-confluence entry point.
Add Context (FVT & Clouds): Use the "Fair Value Trail" and "Firmament Clouds" to refine your entry. A buy signal is generally stronger if the FVT is also bullish ("▲") and the price is not in a "Very Overbought" state according to the clouds.
Manage the Trade (Exit Count): After entering a trade, keep an eye on the "Exit Signal Count." As the number increases, it serves as a warning that the trend is becoming extended and it might be time to take partial profits or tighten your stop-loss.
Bezahltes Script
