Time Cycles [TMU]Title: Time Cycles
Description:
This indicator is a comprehensive Time-Based Market Structure tool designed to segment the trading day into fixed temporal windows using New York Time logic. Unlike standard price-lagging indicators (like MA or RSI), this script focuses purely on Time and Price geometry, visualizing how price action behaves within specific 90-minute, 30-minute, and 10-minute intervals.
It is engineered to help traders visualize the "Time" component of the chart by projecting historical high/low ranges and key opening prices automatically using advanced array management.
Underlying Logic & Calculation
The script operates on a fixed time schedule (defaulting to America/New_York timezone) to generate three distinct layers of analysis:
1. The "Previous 90-Minute Cycle" Engine The script identifies fixed 90-minute blocks starting from 02:30 NY time.
Logic: At the close of each 90-minute window, the script records the Highest High and Lowest Low of that specific session .
Projection (PCH/PCL): These levels are projected forward into the next 90-minute window as static support/resistance zones (PCH - Previous Cycle High, PCL - Previous Cycle Low) using a "Step-Locked" mechanism that prevents repainting of the projected level.
Equilibrium (EQ): The script automatically calculates the 50% mean level between the PCH and PCL to highlight the premium/discount midpoint of the previous range.
2. Intraday Cycle Phases The indicator visualizes the fractal nature of time by highlighting specific 30-minute and 90-minute sessions.
Phases: The script categorizes sessions into three customizable structural phases: Accumulation (Blue), Manipulation (Red), and Distribution (Green). This helps traders identify the potential intent of price action within a specific time window.
Visualization: It draws background ranges based on hard-coded timestamps (e.g., 02:30–04:00 for the first London cycle) to visually segregate market phases.
3. Key Opening Price Anchors The script plots significant "Time Opens" that act as institutional reference points.
Midnight Open (00:00 NY): The exact opening price of the day.
09:30 Open: The standard US Equity Market Open price.
Weekly/Yearly Opens: Uses non-repainting request.security calls to fetch higher-timeframe open prices.
Cycle Open (C.O.): The opening price of the current 90-minute macro bucket.
Unique Features & Originality
This script implements custom algorithmic solutions to manage time-based data, distinguishing it from standard library indicators:
Custom 10-Minute Box Arrays: Unlike standard security calls, this script uses a box array system to capture and render 10-minute micro-structures (tenBoxes) directly on the chart. It calculates the High/Low of every 10-minute block dynamically and stores them in a rolling array to visualize sub-fractal structure without changing timeframes.
Object-Oriented Line Management: To optimize performance and maintain a clean chart, the script employs a custom User-Defined Type (type Lines). This allows for an advanced "garbage collection" method (manage_lines) that automatically trims, extends, or deletes opening lines based on the current time, ensuring that historical data does not clutter the workspace.
Predictive "Step-Locked" Projection: The code utilizes a logic state that locks the previous cycle's coordinates (prevCycHigh, prevCycLow) only upon the confirmed close of the session, projecting these specific coordinates forward using box.new rather than plot, allowing for precise, interactive visual blocks.
How to Use
PCH/PCL Boxes: Use the projected boxes from the previous 90m cycle as potential Support (PCL) or Resistance (PCH) for the current cycle.
EQ Line: The orange line represents the "Fair Value" of the previous range.
Settings: Users can toggle visibility for 30m cycles, 10m boxes, and opening lines independently to suit their strategy.
Disclaimer: This tool is for structural analysis and visualization of time windows. It does not guarantee future price movement. Past performance is not indicative of future results.
Timeandprice

Range Deviations PRO | Trade SymmetryRange Deviations PRO — Extended Session Levels
An enhanced version of the original Range Deviations by @joshuuu, retaining the full core logic while adding a key upgrade:
🔹 All session ranges, midlines, and deviation levels now extend into the next trading session, giving seamless multi-session context.
Supports Asia, CBDR, Flout, ONS, and Custom Sessions — with options for half/full standard deviations, equilibrium, and range boxes exactly as in the original.
Extending these levels helps identify:
• Liquidity sweeps
• Trap moves / false breaks
• Daily high/low projections
• Premium–discount behavior across sessions
Ideal for traders using ICT concepts who want clearer continuation of session structure into the next day.
Credit: Original logic by @joshuuu — enhancements by TradeSymmetry.
Disclaimer: Educational use only. Not financial advice.

Vault FX Time + Price Indicator v1Collection of tools for analysis:
- Midnight Open Horizontal Price Line
- 09:30 Open Horizontal Price Line
- Midnight and 09:30 Vertical Price Lines
- NWOG painter
- Asia Range Box
- Asia Range H/L lines (Lines extend until purged or 10:00 AM NY, whichever occurs first)
- Asia Range Standard Deviation Levels (Customizable)
- Day Separators
- PDH/PDL | PWH/PWL | PMH/PML Lines w/ Alerts
- First Presented FVG for NY-AM Session (1min Chart)
- Timeframe Specific Swing High/Low Sweeps w/ Alerts (Requires user setup)
Some features are still being tested, let me know if you find any bugs!

Smart Money Time (SMT)SMT Divergence – 90m / 30m / 10m (Prev-Cycle, Real-Time, Trailing)
Purpose:
This indicator finds SMT (Smart Money Technique) divergences between two related markets (e.g., CME_MINI:NQ1! vs CME_MINI:ES1! ). It does this per 90m/30m/10m cycles and only compares the current cycle to the immediately previous cycle —never older. It supports three cycle granularities:
90-minute cycles (9 blocks from 02:30–16:00 NY time)
30-minute sub-cycles (27 blocks)
10-minute sub-cycles (81 blocks; exactly 3 per 30-minute cycle)
For each cycle, the script tracks each symbol’s extreme (highest high for potential bearish SMT, lowest low for potential bullish SMT). When the leader sets a new extreme vs its own previous cycle while the lagger fails to do so vs its previous cycle, an SMT divergence is formed and plotted on the chart in real time. Lines trail as price makes new extremes within the same cycle.
What you’ll see on the chart:
A line from the previous cycle’s extreme to the current cycle’s extreme on the symbol pane where the indicator is applied (Primary A).
An optional text label at the current extreme (e.g., “90m SMT”, “30m SMT”, “10m SMT”).
Lines update (“trail”) as the current cycle goes on. When a new cycle begins, tracking resets for that cycle.
Default styling (editable):
90m SMT: solid, width 1, black
30m SMT: solid, width 1, black
10m SMT: dotted, width 1, black
You can toggle the text on/off and change width, style, and colors separately for 90m, 30m, and 10m.
Signals (definitions)
Bearish SMT: One market makes a Higher High vs its own previous cycle, while the other fails to make a Higher High vs its previous cycle.
Bullish SMT: One market makes a Lower Low vs its own previous cycle, while the other fails to make a Lower Low vs its previous cycle.
The line is drawn on Primary A by default.
Settings (explained)
Symbols
Primary Symbol A – the chart’s “leader/lagger” pane the script draws on.
Comparison Symbol B – the second market used for SMT checks.
Detection toggles
Detect SMT: 90m / 30m / 10m – turn on/off detection for each timeframe.
Note: The script always compares current cycle ↔ previous cycle only.
Validate candle direction
When enabled, the bar that makes the new extreme must also close in the confirming direction on that same market:
Bearish SMT: the bar that made the new Higher High must be a down close (close < open).
Bullish SMT: the bar that made the new Lower Low must be an up close (close > open).
This filter removes many “wick-only” probes and reduces false positives.
Turn off if you prefer to register SMTs on any intrabar extreme, regardless of bar close.
Delete SMT when invalidated
After an SMT forms, if the lagger later breaks the previous extreme it initially failed to break, the divergence is considered invalid and the script deletes the line and its label. (An “SMT invalidated” alert can fire if alerts are enabled.)
Enable alerts
Fires on SMT formed (separate messages for 90m/30m/10m and bullish/bearish) and on SMT invalidated.
To use, click Create Alert on the indicator and choose “Any alert() function call”. Use “Once per bar” (or per bar close) to taste.
Appearance – per timeframe (90m / 30m / 10m)
Bullish/Bearish colors, Line width, Line style, Show text (toggle subtitle label).
Text Options
Text color, Text size, Text offset (vertical spacing from the extreme).
How to use
Add to chart and select two related markets, e.g., NQ (A) vs ES (B).
Choose which cycles to monitor (90m / 30m / 10m).
Optionally enable Validate candle direction to demand a confirming close on the bar that made the extreme.
Watch for plotted SMTs:
Bearish SMT (HH vs no HH) often signals potential weakness
Bullish SMT (LL vs no LL) often signals potential strength
Use SMTs as context/confluence—e.g., near session highs/lows, liquidity pools, PD arrays, or your own levels. Combine with structure, order flow, and risk rules.
Turn on alerts to be notified when SMTs form or are invalidated in real time.
Notes & behavior
New-York session timing: Cycles are fixed windows in America/New_York and automatically handle DST.
Real-time & trailing: Lines trail to the most recent extreme within the same cycle but there’s no look-ahead across cycles.
No repaint across cycles: Each signal is strictly current cycle vs previous cycle.
Cleanup: On invalidation the script deletes the label first, then the line, preventing orphan labels.
Tips
10m SMTs are more frequent/noisier; 90m are fewer but more meaningful. Many traders look for multi-frame agreement (e.g., a 30m SMT aligning with a fresh 10m SMT).
If you want fewer signals, keep Validate candle direction on; if you want maximum sensitivity, turn it off.
Disclaimer: Educational use only. Markets are risky; do your own research and manage risk responsibly.

DTLLC Time & PriceDTLLC Time and Price with Signals
This indicator is built for traders who understand ICT concepts and want a structured, visual way to align time-based price action with key market levels. By combining customizable trading windows, breakout logic, and daily reference points, it helps you identify high-probability trade opportunities while filtering out market noise.
Key Features
1. Dual Custom Time Ranges (Kill Zones)
Set two independent time ranges per day (start/end hour and minute).
Each range identifies the highest high and lowest low within its window.
Built-in breakout detection generates buy/sell signals when price moves beyond these levels.
2. Volatility Filtering
Adjustable volatility threshold based on True Range relative to ATR.
Filters out low-quality signals during choppy, low-volatility conditions.
3. ATR-Based Stop Loss
Custom ATR length and stop-loss multiplier settings.
Automatically plots ATR-based stop levels for triggered trades.
4. Daily Key Levels
Plots Previous Day High, Previous Day Low, and Midnight Open continuously on the chart.
Useful for spotting breakout and reversal opportunities in line with ICT market structure concepts.
5. Liquidity & Engulfing Candle Highlights
Highlights potential liquidity grab zones (yellow candles) when significant highs/lows are set within your lookback period.
Detects bullish (green) and bearish (red) engulfing patterns for added confluence.
6. Visual & Signal Tools
Buy/Sell signals plotted directly on chart (separate colors for Range 1 and Range 2). Continuous plotting of reference levels to maintain market context throughout the session.
Example Use Case:
A common ICT-inspired reversal setup:
Wait for price to sweep the Previous Day’s High or Low during your chosen time range.
Look for a buy or sell signal with volatility confirmation.
Manage risk using the ATR-based stop-loss plot.
Disclaimer: This script is for educational purposes only and is not financial advice. Trade responsibly and always test strategies before applying them in live markets.

IMGPro - V1.0IMG PRO uses nine sequential stages to analyse price action and alert users to potential Trade Setups using various Price Action Concepts as detailed below:
1. Identify Higher Timeframe Market Structure and Points of Interest (HTF-POIs)
2. Calculate position size based on your risk appetite, fees and account leverage and customisable maximum trade risk
3. Verify price is in a premium or discount
4. Determine Lower Timeframe Market Structure Break Type
5. Apply Early Warning Systems if enabled
6. Alert you to risk managed trade setups at enabled HTF-POIs
7. Alert you to unentered trade invalidations
8. Alert you to trade exits based on your set criteria
9. Provide Additional Alerts such as Higher Timeframe SFPs and Market Structure Breaks that act as potential early warnings that a trade setup may be forming
1. HTF POIs Available with IMG PRO:
a. HTF Market Structure Range Highs and Lows
b. HTF Order Blocks
c. HTF Order Blocks & FVG Overlaps
d. HTF Breakers
e. HTF Breakers & FVG Overlaps
f. HTF FVGs
g. Internal Liquidity Levels
These levels are used for Trade Signals based on user settings applied. Details provided in the trade setup section below
a. Higher Timeframe Market Structure Range High and Low through Multiple Timeframe Analysis:
Market Structure can be defined using several techniques. The IMG indicators employ the Close through High/Low technique, which necessitates a candle to close through a structural level to validate a structural break and designate a new range.
Example: H12 Market Structure visualisation on a H12 Chart with annotations:
By selecting a particular Market Structure timeframe in the settings, the indicator immediately illustrates both current and historical market structures for the chosen timeframe across all subordinate timeframes, subject to the limitations of your Tradingview subscription.
Example: H12 Market Structure visualisation on a H1 Chart with annotations:
b. Higher Timeframe Order Blocks
An Order Block represents the last candle of the opposite direction preceding a Market Structure Break. For instance, a bullish Order Block is identified as the final bearish candle leading to a bullish market structure break, and vice versa for bearish Order Blocks.
Example: H12 OB visualisation on a H12 Chart with annotations:
When activated, the indicator will highlight the Higher Timeframe Order Blocks responsible for a Market Structure Break on all subordinate timeframes relative to the chosen Market Structure Timeframe.
Note: if multiple OBs exist, the indicator will display the OB closest to the new range extreme
Example: H12 OB visualisation on a H1 Chart with annotations:
c. HTF Order Blocks & HTF FVG Overlaps
When enabled, the IMG Pro will only display overlaps of Order Blocks and FVGs. These are strong points of interest to look for trade setups
Example of the indicator displaying a Higher Timeframe’s (HTF) OBs + FVGs on a Lower Timeframe (LTF) chart:
The upper chart labelled H12/H12 is the indicator displaying H12 Structure and OB+FVGs on a H12 chart.
The lower chart labelled H12/H1 is the indicator displaying H12 OB+FVGs on a H1 chart:
d. Higher Timeframe Breakers
A Breaker Block is identified as the most recent Order Block that has been breached by price, leading to an opposite Market Structure Break. For example, a bullish Breaker Block is the last bearish Order Block that price has passed through, confirming a bullish structural break, and the inverse is true for bearish Breakers.
Example: H12 Breaker visualisation on a H12 Chart with annotations:
Once enabled, the system will display Higher Timeframe Breaker Blocks after an opposite Market Structure Break is confirmed on all subordinate timeframes.
Example: H12 Breaker visualisation on a H1 Chart with annotations:
e. HTF Breakers & HTF FVG Overlaps
When enabled, the IMG Pro will only display overlaps of Breakers and FVGs. These are strong points of interest to look for trade setups
Example:
The upper chart labelled H12/H12 is the indicator displaying H12 Structure and Breakers+FVGs on a H12 chart
The lower chart labelled H12/H1 is the indicator displaying H12 Breakers+FVGs on a H1 chart
f. Higher Timeframe Fair Value Gaps (FVGs)
A Fair Value Gap is a concept used by price action traders to identify market inefficiencies, where buying and selling are not balanced. It appears on a chart as a triple-candle pattern, with a large candle flanked by two others whose highs and lows do not overlap with the large candle, creating a gap. This gap often attracts the price towards it before the market resumes its previous direction.
Example of the indicator displaying a Higher Timeframe’s FVGs on a Lower Timeframe (LTF) chart:
-The upper chart labelled H12/H12 is the indicator displaying H12 Structure and FVGs on a H12 chart.
-The lower chart labelled H12/H1 is the indicator displaying H12 FVGs on a H1 chart
g. HTF Internal Liquidity Levels (FVGs)
A HTF Liquidity Level is a Higher Timeframe three bar Pivot that forms inside an active range.
When enabled, the system will display all UNTESTED HTF pivots formed within an active range. Lines will stop extending once they are either tested or HTF Market Structure Breaks
Example: H12 Liquidity Levels on a H1 Chart:
2. Risk Management and Position Sizing:
a. Automated Position Sizing:
The System will automatically calculate position size based on the account size, max leverage and risk appetite (capital risk per trade) details input in settings. Calculated trade details are included in the Tradingview Alerts as well as interactive labels on the charts.
Details include but are not limited to:
Trade Timeframe
Side: Long/Short
Type: Limit/Market
Position Size in $ and Units
Lot sizes if applicable
Trade Risk %
Take Profit Level
Entry Price
Stoploss Price
b. Maximum Trade Risk:
IMG PRO has the ability to invalidate potential trade entries if it exceeds your maximum Trade Risk threshold. Trade Risk is the % price difference between entry and stoploss.
When an invalid signal is generated, the signal will not be shaded and the interactive label will display the reason for invalidation
In the example below, Max Trade Risk is set to 2% , but the trade signal had a trade risk of 5.11% invalidating the signal with a grey triangle
3. Verify Premium / Discount:
The system can be setup to only display signals that are in the top or bottom n% of the Market Structure Range
A value of 0 (default) will disable the premium/discount system and utilize the entire range for all signal types (bullish and bearish)
EXAMPLES:
A value of 50% will only display bullish signals that have, at minimum, tagged the bottom half of the range and vice versa for bearish signals.
A value of 25% will only display bullish signals that have tagged the bottom quarter of the range and vice versa.
A value of 38.2% will display signals that tag the top and bottom 38.2% of the range (equivalent of the 61.8% OTE. retracement) Etc.
4. Determine Lower Timeframe Market Structure Break Type
IMG Pro has two options for Lower Timeframe Structure Breaks:
Market Structure Breaks: When selected, the system will use the first opposite pivot (in the current chart timeframe) to the left of a confirmed SFP to calculate a break in market structure when price closes through it:
Market Structure Shifts: When selected, the system will use the first opposite pivot (in the current chart timeframe) to the left OR right of a confirmed SFP to calculate a break in market structure when price closes through it. MSS’ are more sensitive and may provide more false signals but are useful when there are big spike liquidity runs:
5. Apply Early Warning Systems if enabled:
The IMG Pro indicator has an early warning system that will generate a potential setup alert before a HTF SFP is confirmed
There are two types of early warnings:
LTF Structure Break Early Warning:
If enabled, the system will generate a potential setup alert if price cuts through a HTF level (Range Extreme / Internal Liquidity) and prints an opposite LTF MSB back through that level. This is a more aggressive approach where the system does not wait for the HTF SFP to be confirmed.
Example: In the screenshot below, the system did not wait for a H12 SFP to be confirmed, allowing it to signal an entry that would have otherwise been missed if the LTF Structure Break early warning system was not enabled
LTF FVG Early Warning:
If enabled, the system will generate a potential setup alert if price cuts through a HTF level (Range Extreme / Internal Liquidity) and prints an opposite LTF FVG back through that level. No LTF MSB is required and a limit order at the FVG is signalled. This is a more aggressive approach where the system does not wait for the HTF SFP to be confirmed.
Example: In the screenshot below, the system did not wait for a H12 SFP to be confirmed, signalling an entry as soon as an opposite LTF FVG is confirmed pushing price back through the HTF Liquidity Levels
6. Trade Setup Types Available with IMG PRO:
The system will alert you to potential trade setups at these HTF POIs: .
a. Higher Timeframe (HTF) Swing Failure followed by a Lower Timeframe (LTF) MSB at Range Extremes
b. Higher Timeframe (HTF) Swing Failure followed by a Lower Timeframe (LTF) MSB at enabled HTF POIs
c. Higher Timeframe (HTF) Swing Failure followed by a Lower Timeframe (LTF) MSB at All Internal Liquidity Levels (With Trend and Counter Trend)
d. Higher Timeframe (HTF) Swing Failure followed by a Lower Timeframe (LTF) MSB at All Internal Liquidity Levels (With Trend ONLY)
e. Lower Timeframe (LTF) Swing Failure followed by a Lower Timeframe (LTF) MSB at enabled HTF POIs
f. Multiple LTF Entry Options once a signal is confirmed
a. HTF Swing Failure followed by a LTF MSB at Range Extremes
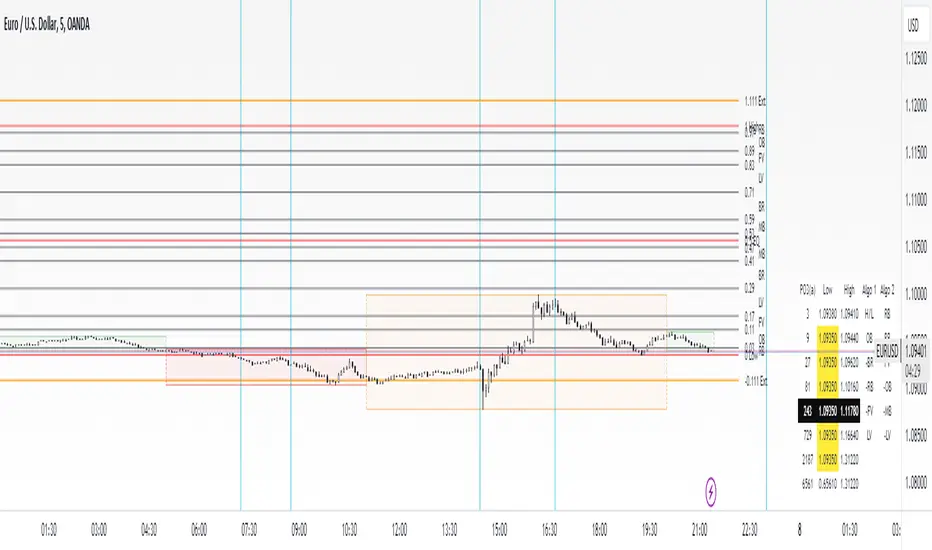
A Swing Failure Pattern (SFP) is a technical analysis concept used in trading to identify potential reversals in price trends. It occurs when the price attempts to surpass a previous high or low but fails to sustain that level, indicating a possible change in market direction. There are multiple methods to define a SFP but this indicator uses the failure to close through a Key Level. When confirmed, HTF SFPs will be displayed on-screen and an alert will fire if enabled.
Example: EURUSD H12 Trade Setup Alerts at Range Extremes on a H1 Chart:
Alerts to Enter at Lower Timeframe MSBs
When enabled, a potential trade setup label and alert will generate when a HTF SFP is confirmed at a Range Extreme followed by a Chart Timeframe (Lower Timeframe) Market Structure Break (MSB). These signals are agnostic to current Market Structure bias and will generate at both extremes.
b. HTF Swing Failure followed by a LTF MSB at HTF POIs:
When enabled, a trade setup label and alert will generate when a HTF SFP is confirmed at an enabled Higher Timeframe POI (Order Blocks / Breakers / FVGs) followed by a Chart Timeframe (Lower Timeframe) Market Structure Break (MSB). These signals are always in line current Market Structure bias.
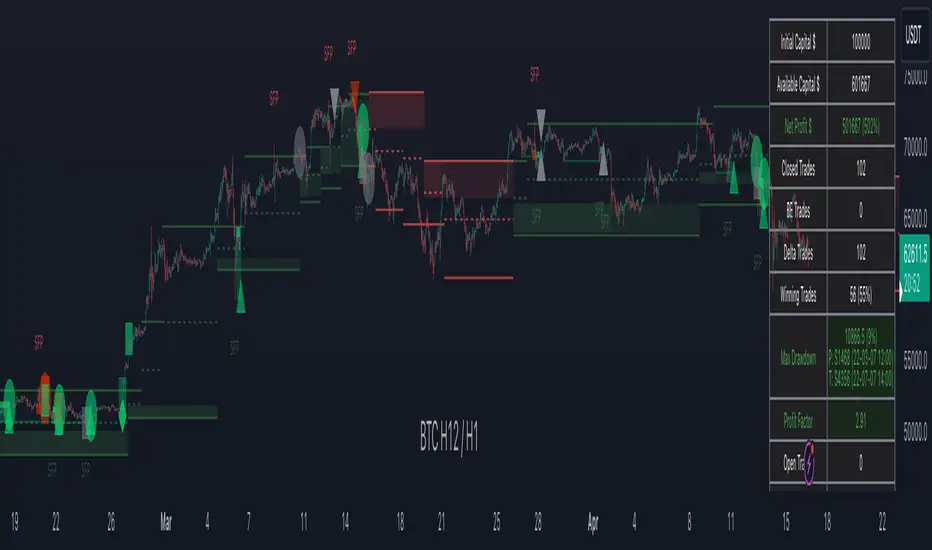
Example: H12 SFPs and Trade Setups at HTF POIs with Fluid Exits on a H1 Chart:
c. HTF Swing Failure followed by a LTF MSB at All Internal Liquidity Levels ( With Trend and Counter Trend ):
When enabled, a trade setup label and alert will generate when a HTF SFP is confirmed at an Internal Liquidity Level followed by a LTF Market Structure Break (MSB) or Market Structure Shift(MSS). These signals are agnostic to HTF Market Structure bias and will alert to setups with and counter trend.
Example:
d. HTF Swing Failure followed by a LTF MSB at All Internal Liquidity Levels ( With Trend ONLY )
Same as (c), but will only signal trades that are in line with higher timeframe structure. I.e If HTF Structure is bullish, then only bullish trades will be signalled.
e. LTF Swing Failure followed by a LTF MSB at enabled HTF POIs
The system will alert you to a lower timeframe setup if these conditions are met inside enabled HTF POIs (OBs / Breakers / FVGs):
- LTF SFP
- LTF MSB
Example:
f. LTF Entry Options:
IMG PRO provides the following options for LTF Entries:
i. Limit Entry at MSB Level
ii. Limit Entry at Breaker
iii. Limit Entry at Raid Candle
iv. Limit Entry at OTE 70.5% Retracement
v. Market Entries (where applicable)
Trade entry alerts will detail limit entry prices based on the option selected here.
7. Unentered Trade Invalidations:
IMG Pro can invalidate unentered signals based on these custom criteria:
a. Opposite HTF SFP Before Entry
b. TP Hit Before Entry
c. Confirmed Opposite Signal Before Entry
If enabled and criteria met, the system will alert you to cancel any limit orders for the trade that is being invalidated.
8. Trade Exit Types Available with IMG PRO:
The system provides the following options for trade exit alerts:
a. Exit at Fixed R:R
b. Exit at a confirmed Opposite Signal (Fluid Exits)
c. Exit at enabled and untested HTF POIs
d. Exit on an opposite HTF SFP at a liquidity level
Example: H12 SFPs and Potential Trade Setups at Internal Liquidity Levels with Exit at closest untested HTF POI on a H1 Chart:
9. IMG PRO Alerts Overview
The system provides notifications of:
a. Confirmed HTF Market Structure Breaks
b. Confirmed HTF SFPs at Range Extremes
c. Confirmed HTF SFPs at HTF POIs
d. Confirmed HTF SFPs at Liquidity Levels
e. Potential Trade Setups at Range Extremes
f. Potential Trade Setups at HTF Points of Interest
g. Potential Trade Setups at HTF Liquidity Levels
h. LTF SFPs inside HTF POIs
i. Potential LTF Setups at HTF POIs
j. All Exit Types including Stoplosses
k. All Trade Invalidations
To enable alerts, right-click on the indicator and select “Add Alert on IMG ...”. You may customise the alert name as desired and then click 'Create' to finalise the alert setup.
General Note:
There is no system, indicator, algorithm, or strategy that can provide absolute certainty in predicting market movements. Use trading indicators as a tool to assist with trading decisions; manage your risk wisely.
Stay safe and Happy Trading!
IMGLite - V1.0IMG indicators use five sequential stages to analyse price and alert users to potential Trade Setups using various Price Action Concepts as detailed below:
a. Identify Higher Timeframe Market Structure and Points of Interest (HTF-POIs)
b. Calculate position size based on your risk appetite, fees and account leverage
c. Alert you to risk managed trade setups at enabled HTF-POIs
d. Alert you to trade exits based on your set criteria
e. Provide Additional Alerts such as Higher Timeframe SFPs and Market Structure Breaks that act as potential early warnings that a trade setup may be forming
a. HTF POIs Available with IMG LITE:
1. HTF Market Structure Range Highs and Lows
2. HTF Order Blocks
3. HTF Breakers
4. HTF FVGs
1. Higher Timeframe Market Structure Range High and Low through Multiple Timeframe Analysis:
Market Structure can be defined using several techniques. The IMG indicators employ the Close through High/Low technique, which necessitates a candle to close through a structural level to validate a structural break and designate a new range.
Example: H12 Market Structure visualisation on a H12 Chart with annotations:
By selecting a particular Market Structure timeframe in the settings, the indicator immediately illustrates both current and historical market structures for the chosen timeframe across all subordinate timeframes, subject to the limitations of your Tradingview subscription.
Example: H12 Market Structure visualisation on a H1 Chart with annotations:
2. Higher Timeframe Order Blocks
An Order Block represents the last candle of the opposite direction preceding a Market Structure Break. For instance, a bullish Order Block is identified as the final bearish candle leading to a bullish market structure break, and vice versa for bearish Order Blocks.
Example: H12 OB visualisation on a H12 Chart with annotations:
When activated, the indicator will highlight the Higher Timeframe Order Blocks responsible for a Market Structure Break on all subordinate timeframes relative to the chosen Market Structure Timeframe.
Note: if multiple OBs exist, the indicator will display the OB closest to the new range extreme
Example: H12 OB visualisation on a H1 Chart with annotations:
Higher Timeframe Breakers
A Breaker Block is identified as the most recent Order Block that has been breached by price, leading to an opposite Market Structure Break. For example, a bullish Breaker Block is the last bearish Order Block that price has passed through, confirming a bullish structural break, and the inverse is true for bearish Breakers.
Example: H12 Breaker visualisation on a H12 Chart with annotations:
Once enabled, the system will display Higher Timeframe Breaker Blocks after an opposite Market Structure Break is confirmed on all subordinate timeframes.
Example: H12 Breaker visualisation on a H1 Chart with annotations:
Higher Timeframe Fair Value Gaps (FVGs)
A Fair Value Gap is a concept used by price action traders to identify market inefficiencies, where buying and selling are not balanced. It appears on a chart as a triple-candle pattern, with a large candle flanked by two others whose highs and lows do not overlap with the large candle, creating a gap. This gap often attracts the price towards it before the market resumes its previous direction.
Example of the indicator displaying a Higher Timeframe’s FVGs on a Lower Timeframe (LTF) chart:
-The upper chart labelled H12/H12 is the indicator displaying H12 Structure and FVGs on a H12 chart.
-The lower chart labelled H12/H1 is the indicator displaying H12 FVGs on a H1 chart
b. Risk Management and Position Sizing:
The System will automatically calculate position size based on the account size, max leverage and risk appetite details input in settings. Calculated trade details are included in the Tradingview Alerts as well as interactive labels on the charts.
Details include but are not limited to:
Trade Timeframe
Side: Long/Short
Type: Limit/Market
Position Size in $ and Units
Lot sizes if applicable
Trade Risk %
Take Profit Level
Entry Price
Stoploss Price
c. Trade Setup Types Available with IMG LITE:
The system will alert you to potential trade setups at these HTF POIs: .
1. Higher Timeframe (HTF) Swing Failure followed by a Lower Timeframe (LTF) MSB at Range Extremes
2. Lower Timeframe (LTF) Swing Failure followed by a Lower Timeframe (LTF) MSB at enabled HTF POIs
1. HTF Swing Failure followed by a Lower Timeframe (LTF) MSB at Range Extremes
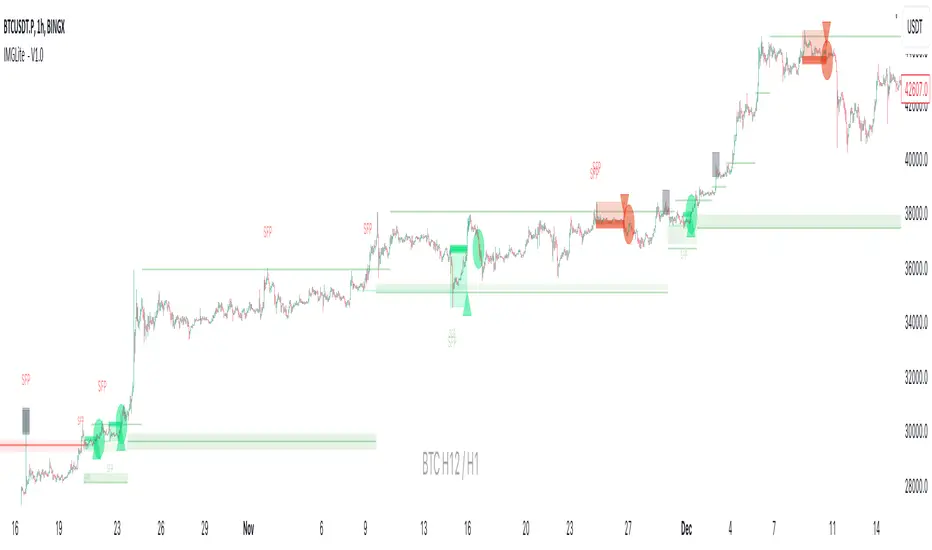
A Swing Failure Pattern (SFP) is a technical analysis concept used in trading to identify potential reversals in price trends. It occurs when the price attempts to surpass a previous high or low but fails to sustain that level, indicating a possible change in market direction. There are multiple methods to define a SFP but this indicator uses the failure to close through a Key Level. When confirmed, HTF SFPs will be displayed on-screen and an alert will fire if enabled.
Example: H12 SFPs at Range Extremes on a H1 Chart:
Alerts to Enter at Lower Timeframe MSBs
When enabled, a potential trade setup label and alert will generate when a HTF SFP is confirmed at a Range Extreme followed by a Chart Timeframe (Lower Timeframe) Market Structure Break (MSB). These signals are agnostic to current Market Structure bias and will generate at both extremes.
Signals will alert you to enter a Limit Entry at the Lower Timeframe MSB Level
2. LTF Swing Failure followed by a LTF MSB at Range Extremes at enabled HTF POIs
The system will alert you to a lower timeframe setup if these conditions are met inside enabled HTF POIs (OBs / Breakers / FVGs):
- LTF SFP
- LTF MSB
Signals will alert you to enter a Limit Entry at the Lower Timeframe MSB Level
Example:
d. Trade Exit Types Available with IMG Lite:
Exit alerts will trigger at user defined R:R
Example: H12 SFPs and Potential Trade Setups with Exits at fixed 2R on a H1 Chart:
e. IMG LITE Alerts Overview
Higher Timeframe Market Structure Breaks (HTF MSBs)
The system provides notifications of confirmed Market Structure Breaks based on the selected Higher Timeframe Market Structure Timeframe. For instance, selecting a weekly structure will trigger an alert when weekly price closes through a weekly structural level, and the same logic applies to other timeframes like D, H12, H4, H1 etc.
The system provides notifications of:
1. Confirmed HTF Market Structure Breaks
2. Confirmed HTF SFPs at Range Extremes
3. Potential Trade Setups (defined above)
4. Fixed R Trade Exits
To enable alerts, right-click on the indicator and select “Add Alert on IMG ...”. You may customise the alert name as desired and then click 'Create' to finalise the alert setup.
General Note:
There is no system, indicator, algorithm, or strategy that can provide absolute certainty in predicting market movements. Use trading indicators as a tool to assist with trading decisions; manage your risk wisely.
Stay safe and Happy Trading!
TimeLy Moving Average - TMAHello traders, I'm Only Fibonacci.
With this indicator, you will see the averages according to the hourly, weekly and monthly price movements in many periods on the chart.
This will show you the moving average values of the price over different periods in a progressive manner on the chart that is open to you.
Options and Usage
To see the hourly average, your chart's time range must be less than or equal to 60 minutes, otherwise it will produce a NaN value.
In order to see the daily average, your chart must be open for any minute period or (even if the second is open, it must be greater than 6 seconds). Otherwise, it does not produce any value.
Your chart must be larger than the second chart to see the weekly average. In other words, you can see the weekly average with at least 1 minute chart open.
In order to see the monthly average, your chart time interval must be above 10 minutes, otherwise you will not be able to see data again.
Settings
You choose the moving average type and the time interval value you want to see from the indicator settings.
You can also select a source for moving averages.
Enjoy it, you can make improvements on it.
Please do not forget to comment for various bug reports.

Range H/L Buy and Sell SignalThe "Range H/L Buy and Sell Signal" indicator is designed to identify potential buy and sell signals based on a specified price range and market volatility. This indicator can be used in the TradingView platform to assist traders in making informed decisions.
The indicator allows customization of several parameters to adapt to different trading strategies. These parameters include the start and end times for the price range, the volatility threshold, and the desired breakout conditions.
To begin, the indicator calculates the range start and end timestamps based on the provided hours and minutes. This defines the time period within which the indicator will analyze price movements.
Next, the indicator determines the highest high (High) and lowest low (Low) within the specified price range. These levels represent the upper and lower boundaries of the range and act as potential breakout points.
Volatility is also taken into account to filter out false signals. The indicator calculates the true range and the average true range over a period of 14 bars. The true range measures the price range from the current high to low, while the average true range provides an indication of market volatility.
Based on the breakout conditions and the volatility threshold, buy and sell signals are generated. A buy signal occurs when the closing price crosses above the High and the true range is greater than the volatility threshold multiplied by the average true range. Conversely, a sell signal is triggered when the closing price crosses below the Low and the true range exceeds the volatility threshold multiplied by the average true range.
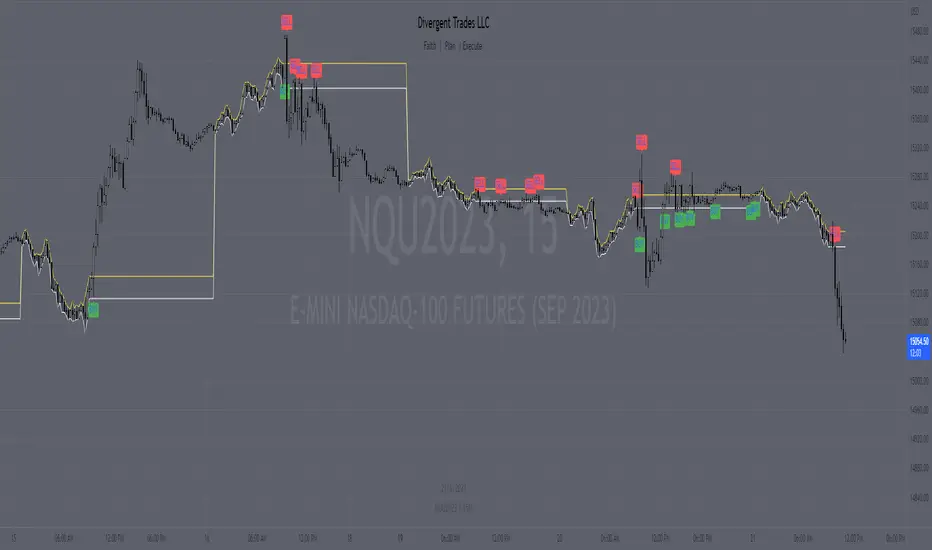
The indicator visually displays the High and Low levels as plotted lines on the chart. Additionally, it marks the buy signals with green labels labeled "BUY" below the corresponding bars and the sell signals with red labels labeled "SELL" above the bars.
It is important to note that this indicator should be used in conjunction with other technical analysis tools and indicators for comprehensive market analysis. Trading always carries risks, and it is crucial to exercise caution and conduct thorough analysis before making any trading decisions.
Divergent Trades LLC:
Disclaimer: The information provided by the Divergent Trades LLC indicator is for educational and informational purposes only. It should not be considered financial advice or a recommendation to buy, sell, or trade any financial instrument. Divergent Trades LLC is not responsible for any losses incurred as a result of using this indicator. Trading in the financial markets carries a high level of risk and may not be suitable for all investors. Before making any investment decisions, please consult with a financial advisor and do your own due diligence. Past performance is not indicative of future results. By using the Divergent Trades LLC indicator, you acknowledge that you have read and understand this disclaimer and agree to its terms and conditions.
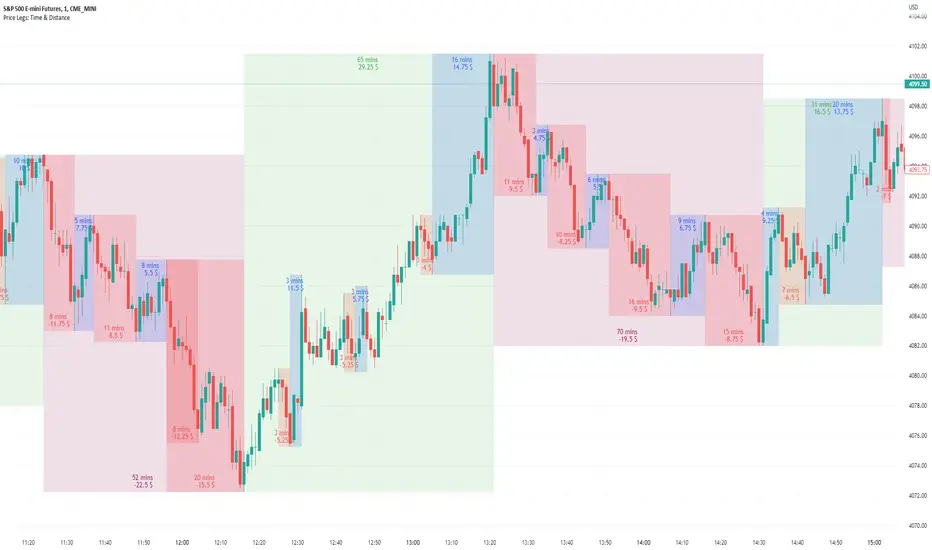
Price Legs: Time & Distance. Measuring moves in time & price-Tool to measure price legs in terms of both time and price; gives an idea of frequency of market movements and their typical extent and duration.
-Written for backtesting: seeing times of day where setups are most likely to unfold dynamically; getting an idea of typical and minimum sizes of small/large legs.
-Two sets of editable lookback numbers to measure both small and large legs independently.
-Works across timeframes and assets (units = mins/hours/days dependent on timeframe; units = '$' for indices & futures, 'pips' for FX).
~toggle on/off each set of bull/bear boxes.
~choose lookback/forward length for each set. Increase number for larger legs, decrease for smaller legs.
(for assets outside of the big Indices and FX, you may want to edit the multiplier, pMult, on lines 23-24)
small legs
large legs
dmn's ICT AMD-Goldbach█ OVERVIEW
This script is built on ICT time & price theory and the theory of algorithmic market maker models, and visualizes the intraday divided using powers of three into accumulation, manipulation and distribution cycles.
It also includes an automatically calculated and plotted Goldbach level (a.k.a. IPDA level or Huddleston level) overlay, to help visualize where in the current market maker profile price is in relation to the AMD cycles, and where it might trade to.
█ CONCEPTS
Accumulation, Manipulation, Distribution Cycles
A 24 hour day, with the default set to start at 20:00 CET (the start of the Forex CLS Settlement operational timeline) is split in three parts - 9, 6 and 9 hours for the three cycles (roughly corresponding with Asia, London Open and New York + London Close sessions).
Since charts are fractals, there's also intra-cycle time fibs available in the script, to highlight the smaller fractal equivalents in each cycle.
These cycles are used to visualize the three phases (AMD) for easier identification of the current daily profile by analyzing during what cycle highs and lows of the day are made.
An example of a bullish day could be price rallying before making a low during the accumulation cycle, being manipulated higher and retracing to form an optimal trade entry during the manipulation cycle, expanding and creating the high of the day before selling off during the distribution cycle, with a potential reversal before it ends.
Goldbach levels
The Goldbach levels are based on the size of a price range (or price swing, if you will) expressed as a factor of power of three (3^n).
To decide what number to tell the script to use for the calculation, we look at what 3^n number best fits an average swing on the preferred timeframe we're trading.
For example; PO3 27 (3^3)might be fit for scalping, while PO3 243 (3^5) may correspond to the daily or weekly range, depending on the asset.
The script then calculates a range high and a range low using a power of three formula based on the current price and divides it into levels using Goldbach numbers.
At these levels one might expect to see price form various "blocks" as defined in concept by Michael J. Huddleston.
The blocks that correspond to the Goldbach levels are labeled with abbreviations as follows:
Ext = External range
Low = Range low
High = Range high
FVG = Fair value gap
RB = Rejection block
OB = Order block
LV = Liquidity void
BR = Breaker
MB = Mitigation block
Using these levels and said blocks we identify where in the current running market maker profile price is offered, and trade the preferred timeframe in line with the AMD cycles accordingly.
█ FEATURES
Custom AMD time cycles session times.
Custom time fib for fractal cycles.
Color and style customization.
Show only current or also historical cycles.
Equilibrium mode for Goldbach levels (show only high/low and midpoint)
Autodetection of asset type, with manual override.
█ NOTE
The default timings for the AMD cycles are set up for Forex pairs. For other asset types, such as indices, other timings are nessecary for optimal results.
Goldbach levels requires the correct symbol type setting for the calculation to work properly. Disable the script's autodetection and enable/disable the Forex option according to the type of chart if it fails.