ChasinAlts_LibraryLibrary "ChasinAlts_Library"
rci(_BCgtg, _Tgtg, _close, _smaLen, _bar_index)
Parameters:
_BCgtg
_Tgtg
_close
_smaLen
_bar_index
printedBC(_time, _minPerc, _Tgtg, _lkbk)
Parameters:
_time
_minPerc
_Tgtg
_lkbk
form123(_ppLen, _BCgtg, _Tgtg, _high, _low, _close, _bar_index)
Parameters:
_ppLen
_BCgtg
_Tgtg
_high
_low
_close
_bar_index
obosCnt(_BCgtg, _Tgtg, _rci, _obosMin, _obosMax, _thresh)
Parameters:
_BCgtg
_Tgtg
_rci
_obosMin
_obosMax
_thresh
div(_thresh, _HLestLen, _Tgtg, _BCgtg, _rci, _time, _price, _LSL, _SSL, _LTP, _STP, _colorid, _long, _short)
Parameters:
_thresh
_HLestLen
_Tgtg
_BCgtg
_rci
_time
_price
_LSL
_SSL
_LTP
_STP
_colorid
_long
_short
tradeSim(_SL, _TP, _BCgtg, _Tgtg, _ppLen, _high, _low, _close, _bar_index, _time, _bull_rev, _bear_rev, _bull_obosCnt_gtg, _bear_obosCnt_gtg)
Parameters:
_SL
_TP
_BCgtg
_Tgtg
_ppLen
_high
_low
_close
_bar_index
_time
_bull_rev
_bear_rev
_bull_obosCnt_gtg
_bear_obosCnt_gtg
Techindicator
TrailingStopsLibrary "TrailingStops"
This library contains functions to output trailing stop lines.
f_marketStructureStop(_restartMode, _flipMode, _restartLowIn, _restartHighIn)
Parameters:
_restartMode - Defines how the stop lines persist. Allowed values are:
"Always On" - The stop lines are always present and they just reset when they're crossed.
"Flip" - The stop lines flip when they're crossed.
"Manual" - The stop lines turn off when they're crossed, and turn back on again when _restartLowIn or _restartHighIn are passed into the function as true.
_flipMode - Defines whether the stop lines are broken by wicks or closes. Allowed values are "Wick", and "Close".
_restartLowIn - If _restartMode is "Manual", passing this parameter as true restarts the Low stop line.
_restartHighIn - If _restartMode is "Manual", passing this parameter as true restarts the High stop line.
@returns - floats for the Low and High stop line.

MarketStructureLibrary "MarketStructure"
This library contains functions for identifying Lows and Highs in a rule-based way, and deriving useful information from them.
f_simpleLowHigh()
This function finds Local Lows and Highs, but NOT in order. A Local High is any candle that has its Low taken out on close by a subsequent candle (and vice-versa for Local Lows).
The Local High does NOT have to be the candle with the highest High out of recent candles. It does NOT have to be a Williams High. It is not necessarily a swing high or a reversal or anything else.
It doesn't have to be "the" high, so don't be confused.
By the rules, Local Lows and Highs must alternate. In this function they do not, so I'm calling them Simple Lows and Highs.
Simple Highs and Lows, by the above definition, can be useful for entries and stops. Because I intend to use them for stops, I want them all, not just the ones that alternate in strict order.
@param - there are no parameters. The function uses the chart OHLC.
@returns boolean values for whether this bar confirms a Simple Low/High, and ints for the bar_index of that Low/High.
f_localLowHigh()
This function finds Local Lows and Highs, in order. A Local High is any candle that has its Low taken out on close by a subsequent candle (and vice-versa for Local Lows).
The Local High does NOT have to be the candle with the highest High out of recent candles. It does NOT have to be a Williams High. It is not necessarily a swing high or a reversal or anything else.
By the rules, Local Lows and Highs must alternate, and in this function they do.
@param - there are no parameters. The function uses the chart OHLC.
@returns boolean values for whether this bar confirms a Local Low/High, and ints for the bar_index of that Low/High.
f_enhancedSimpleLowHigh()
This function finds Local Lows and Highs, but NOT in order. A Local High is any candle that has its Low taken out on close by a subsequent candle (and vice-versa for Local Lows).
The Local High does NOT have to be the candle with the highest High out of recent candles. It does NOT have to be a Williams High. It is not necessarily a swing high or a reversal or anything else.
By the rules, Local Lows and Highs must alternate. In this function they do not, so I'm calling them Simple Lows and Highs.
Simple Highs and Lows, by the above definition, can be useful for entries and stops. Because I intend to use them for trailing stops, I want them all, not just the ones that alternate in strict order.
The difference between this function and f_simpleLowHigh() is that it also tracks the lowest/highest recent level. This level can be useful for trailing stops.
In effect, these are like more "normal" highs and lows that you would pick by eye, but confirmed faster in many cases than by waiting for the low/high of that particular candle to be taken out on close,
because they are instead confirmed by ANY subsequent candle having its low/high exceeded. Hence, I call these Enhanced Simple Lows/Highs.
The levels are taken from the extreme highs/lows, but the bar indexes are given for the candles that were actually used to confirm the Low/High.
This is by design, because it might be misleading to label the extreme, since we didn't use that candle to confirm the Low/High..
@param - there are no parameters. The function uses the chart OHLC.
@returns - boolean values for whether this bar confirms an Enhanced Simple Low/High
ints for the bar_index of that Low/High
floats for the values of the recent high/low levels
floats for the trailing high/low levels (for debug/post-processing)
bools for market structure bias
f_trueLowHigh()
This function finds True Lows and Highs.
A True High is the candle with the highest recent high, which then has its low taken out on close by a subsequent candle (and vice-versa for True Lows).
The difference between this and an Enhanced High is that confirmation requires not just any Simple High, but confirmation of the very candle that has the highest high.
Because of this, confirmation is often later, and multiple Simple Highs and Lows can develop within ranges formed by a single big candle without any of them being confirmed. This is by design.
A True High looks like the intuitive "real high" when you look at the chart. True Lows and Highs must alternate.
@param - there are no parameters. The function uses the chart OHLC.
@returns - boolean values for whether this bar confirms an Enhanced Simple Low/High
ints for the bar_index of that Low/High
floats for the values of the recent high/low levels
floats for the trailing high/low levels (for debug/post-processing)
bools for market structure bias

TechnicalRating█ OVERVIEW
This library is a Pine Script™ programmer’s tool for incorporating TradingView's well-known technical ratings within their scripts. The ratings produced by this library are the same as those from the speedometers in the technical analysis summary and the "Rating" indicator in the Screener , which use the aggregate biases of 26 technical indicators to calculate their results.
█ CONCEPTS
Ensemble analysis
Ensemble analysis uses multiple weaker models to produce a potentially stronger one. A common form of ensemble analysis in technical analysis is the usage of aggregate indicators together in hopes of gaining further market insight and reinforcing trading decisions.
Technical ratings
Technical ratings provide a simplified way to analyze financial markets by combining signals from an ensemble of indicators into a singular value, allowing traders to assess market sentiment more quickly and conveniently than analyzing each constituent separately. By consolidating the signals from multiple indicators into a single rating, traders can more intuitively and easily interpret the "technical health" of the market.
Calculating the rating value
Using a variety of built-in TA functions and functions from our ta library, this script calculates technical ratings for moving averages, oscillators, and their overall result within the `calcRatingAll()` function.
The function uses the script's `calcRatingMA()` function to calculate the moving average technical rating from an ensemble of 15 moving averages and filters:
• Six Simple Moving Averages and six Exponential Moving Averages with periods of 10, 20, 30, 50, 100, and 200
• A Hull Moving Average with a period of 9
• A Volume-Weighted Moving Average with a period of 20
• An Ichimoku Cloud with a conversion line length of 9, base length of 26, and leading span B length of 52
The function uses the script's `calcRating()` function to calculate the oscillator technical rating from an ensemble of 11 oscillators:
• RSI with a period of 14
• Stochastic with a %K period of 14, a smoothing period of 3, and a %D period of 3
• CCI with a period of 20
• ADX with a DI length of 14 and an ADX smoothing period of 14
• Awesome Oscillator
• Momentum with a period of 10
• MACD with fast, slow, and signal periods of 12, 26, and 9
• Stochastic RSI with an RSI period of 14, a %K period of 14, a smoothing period of 3, and a %D period of 3
• Williams %R with a period of 14
• Bull Bear Power with a period of 50
• Ultimate Oscillator with fast, middle, and slow lengths of 7, 14, and 28
Each indicator is assigned a value of +1, 0, or -1, representing a bullish, neutral, or bearish rating. The moving average rating is the mean of all ratings that use the `calcRatingMA()` function, and the oscillator rating is the mean of all ratings that use the `calcRating()` function. The overall rating is the mean of the moving average and oscillator ratings, which ranges between +1 and -1. This overall rating, along with the separate MA and oscillator ratings, can be used to gain insight into the technical strength of the market. For a more detailed breakdown of the signals and conditions used to calculate the indicators' ratings, consult our Help Center explanation.
Determining rating status
The `ratingStatus()` function produces a string representing the status of a series of ratings. The `strongBound` and `weakBound` parameters, with respective default values of 0.5 and 0.1, define the bounds for "strong" and "weak" ratings.
The rating status is determined as follows:
Rating Value Rating Status
< -strongBound Strong Sell
< -weakBound Sell
-weakBound to weakBound Neutral
> weakBound Buy
> strongBound Strong Buy
By customizing the `strongBound` and `weakBound` values, traders can tailor the `ratingStatus()` function to fit their trading style or strategy, leading to a more personalized approach to evaluating ratings.
Look first. Then leap.
█ FUNCTIONS
This library contains the following functions:
calcRatingAll()
Calculates 3 ratings (ratings total, MA ratings, indicator ratings) using the aggregate biases of 26 different technical indicators.
Returns: A 3-element tuple: ( [(float) ratingTotal, (float) ratingOther, (float) ratingMA ].
countRising(plot)
Calculates the number of times the values in the given series increase in value up to a maximum count of 5.
Parameters:
plot : (series float) The series of values to check for rising values.
Returns: (int) The number of times the values in the series increased in value.
ratingStatus(ratingValue, strongBound, weakBound)
Determines the rating status of a given series based on its values and defined bounds.
Parameters:
ratingValue : (series float) The series of values to determine the rating status for.
strongBound : (series float) The upper bound for a "strong" rating.
weakBound : (series float) The upper bound for a "weak" rating.
Returns: (string) The rating status of the given series ("Strong Buy", "Buy", "Neutral", "Sell", or "Strong Sell").

TurntLibraryLibrary "TurntLibrary"
Collection of functions created for simplification/easy referencing. Includes variations of moving averages, length value oscillators, and a few other simple functions based upon HH/LL values.
ma(source, length, type)
Apply a moving average to a float value
Parameters:
source : Value to be used
length : Number of bars to include in calculation
type : Moving average type to use ("SMA","EMA","RMA","WMA","VWAP","SWMA","LRC")
Returns: Smoothed value of initial float value
curve(src, len, lb1, lb2)
Exaggerates curves of a float value designed for use as an exit signal.
Parameters:
src : Initial value to curve
len : Number of bars to include in calculation
lb1 : (Default = 1) First lookback length
lb2 : (Default = 2) Second lookback length
Returns: Curved Average
fragma(src, len, space, str)
Average of a moving average and the previous value of the moving average
Parameters:
src : Initial float value to use
len : Number of bars to include in calculation
space : Lookback integer for second half of average
str : Moving average type to use ("SMA","EMA","RMA","WMA","VWAP","SWMA","LRC")
Returns: Fragmented Average
maxmin(x, y)
Difference of 2 float values, subtracting the lowest from the highest
Parameters:
x : Value 1
y : Value 2
Returns: The +Difference between 2 float values
oscLen(val, type)
Variable Length using a oscillator value and a corresponding slope shape ("Incline",Decline","Peak","Trough")
Parameters:
val : Oscillator Value to use
type : Slope of length curve ("Incline",Decline","Peak","Trough")
Returns: Variable Length Integer
hlAverage(val, smooth, max, min, type, include)
Average of HH,LL with variable lengths based on the slope shape ("Incline","Decline","Trough") value relative to highest and lowest
Parameters:
val : Source Value to use
smooth
max
min
type
include : Add "val" to the averaging process, instead of more weight to highest or lowest value
Returns: Variable Length Average of Highest Lowest "val"
pct(val)
Convert a positive float / price to a percentage of it's highest value on record
Parameters:
val : Value To convert to a percentage of it's highest value ever
Returns: Percentage
hlrange(x, len)
Difference between Highest High and Lowest Low of float value
Parameters:
x : Value to use in calculation
len : Number of bars to include in calculation
Returns: Difference
midpoint(x, len, smooth)
The average value of the float's Highest High and Lowest Low in a number of bars
Parameters:
x : Value to use in calculation
len
smooth : (Default=na) Optional smoothing type to use ("SMA","EMA","RMA","WMA","VWAP","SWMA","LRC")
Returns: Midpoint
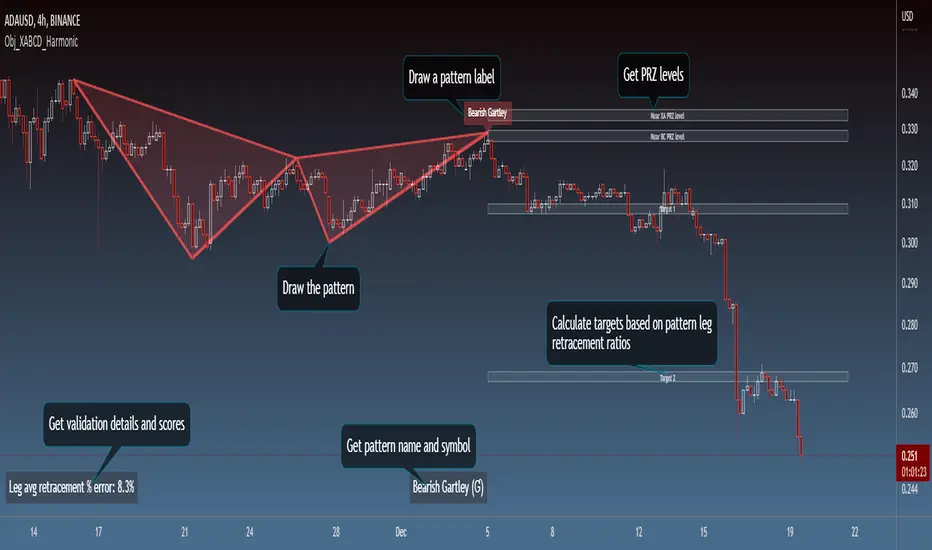
Obj_XABCD_HarmonicLibrary "Obj_XABCD_Harmonic"
Harmonic XABCD Pattern object and associated methods. Easily validate, draw, and get information about harmonic patterns. See example code at the end of the script for details.
init_params(pct_error, pct_asym, types, w_e, w_p, w_d)
Create a harmonic parameters object (used by xabcd_harmonic object for pattern validation and scoring).
Parameters:
pct_error : Allowed % error of leg retracement ratio versus the defined harmonic ratio
pct_asym : Allowed leg length/period asymmetry % (a leg is considered invalid if it is this % longer or shorter than the average length of the other legs)
types : Array of pattern types to validate (1=Gartley, 2=Bat, 3=Butterfly, 4=Crab, 5=Shark, 6=Cypher)
w_e : Weight of ratio % error (used in score calculation, dft = 1)
w_p : Weight of PRZ confluence (used in score calculation, dft = 1)
w_d : Weight of Point D / PRZ confluence (used in score calculation, dft = 1)
Returns: harmonic_params object instance. It is recommended to store and reuse this object for multiple xabcd_harmonic objects rather than creating new params objects unnecessarily.
init(xX, xY, aX, aY, bX, bY, cX, cY, dX, dY, params, tp, p)
Initialize an xabcd_harmonic object instance.
If the pattern is valid, an xabcd_harmonic object instance is returned. If you want to specify your
own validation and scoring parameters, you can do so by passing a harmonic_params object (params).
Or, if you prefer to do your own validation, you can explicitly pass the harmonic pattern type (tp)
and validation will be skipped. You can also pass in an existing xabcd_harmonic instance if you wish
to re-initialize it (e.g. for re-validation and/or re-scoring).
Parameters:
xX : Point X bar index
xY : Point X price/level
aX : Point A bar index
aY : Point A price/level
bX : Point B bar index
bY : Point B price/level
cX : Point C bar index
cY : Point C price/level
dX : Point D bar index
dY : Point D price/level
params : harmonic_params used to validate and score the pattern. Validation will be skipped if a type (tp) is explicitly passed in.
tp : Pattern type
p : xabcd_harmonic object instance to initialize (optional, for re-validation/re-scoring)
Returns: xabcd_harmonic object instance if a valid harmonic, else na
get_name(p)
Get the pattern name
Parameters:
p : Instance of xabcd_harmonic object
Returns: Pattern name (string)
get_symbol(p)
Get the pattern symbol
Parameters:
p : Instance of xabcd_harmonic object
Returns: Pattern symbol (1 byte string)
get_pid(p)
Get the Pattern ID. Patterns of the same type with the same coordinates will have the same Pattern ID.
Parameters:
p : Instance of xabcd_harmonic object
Returns: Pattern ID (string)
set_target(p, target, target_lvl, calc_target)
Set value for a target. Use the calc_target parameter to automatically calculate the target for a specific harmonic ratio.
Parameters:
p : Instance of xabcd_harmonic object
target : Target (1 or 2)
target_lvl : Target price/level (required if calc_target is not specified)
calc_target : Target to auto calculate (required if target is not specified)
Options:
Returns: Target price/level (float)
erase_pattern(p)
Erase the pattern
Parameters:
p : Instance of xabcd_harmonic object
Returns: p
draw_pattern(p)
Draw the pattern
Parameters:
p : Instance of xabcd_harmonic object
Returns: Pattern lines
erase_label(p)
Erase the pattern label
Parameters:
p : Instance of xabcd_harmonic object
Returns: p
draw_label(p, txt, tooltip, clr, txt_clr)
Draw the pattern label. Default text is the pattern name.
Parameters:
p : Instance of xabcd_harmonic object
txt : Label text
tooltip : Tooltip text
clr : Label color
txt_clr : Text color
Returns: Label
harmonic_params
Validation and scoring parameters for a Harmonic Pattern object (xabcd_harmonic)
Fields:
pct_error : Allowed % error of leg retracement ratio versus the defined harmonic ratio
pct_asym
types
w_e
w_p
w_d
xabcd_harmonic
Harmonic Pattern object
Fields:
bull : Bullish pattern flag
tp
xX
xY
aX
aY
bX
bY
cX
cY
dX
dY
r_xb
re_xb
r_ac
re_ac
r_bd
re_bd
r_xd
re_xd
score
score_eAvg
score_prz
score_eD
prz_bN
prz_bF
prz_xN
prz_xF
t1Hit : Target 1 flag
t1
t2Hit
t2
sHit : Stop flag
stop : Stop level
entry : Entry level
eHit
eX
eY
pLines
pLabel
pid
params
ZigZag█ OVERVIEW
This library is a Pine Script™ programmer’s tool containing custom user-defined types and functions to calculate Zig Zag indicators within their scripts. It is not a stand-alone indicator.
Pine Script™ libraries are publications that contain reusable code for importing into Pine Script™ indicators, strategies, and other libraries. For more information on libraries and incorporating them into your scripts, see the Libraries section of the Pine Script™ User Manual .
█ CONCEPTS
Zig Zag
Zig Zag is a popular indicator that filters out minor price fluctuations to denoise data and emphasize trends. Traders commonly use Zig Zag for trend confirmation, identifying potential support and resistance, and pattern detection. It is formed by identifying significant local high and low points in alternating order and connecting them with straight lines, omitting all other data points from their output. There are several ways to calculate the Zig Zag's data points and the conditions by which its direction changes. This script uses pivots as the data points, which are the highest or lowest values over a defined number of bars before and after them. The direction only reverses when a newly formed pivot deviates from the last Zig Zag point in the opposite direction by an amount greater than or equal to a specified percentage.
To learn more about Zig Zag and how to calculate it, see this entry from the Help Center.
█ FOR Pine Script™ CODERS
Notes
This script's architecture utilizes user-defined types (UDTs) to create custom objects which are the equivalent of variables containing multiple parts, each able to hold independent values of different types . UDTs are the newest addition to Pine Script™ and the most advanced feature the language has seen to date. The feature's introduction creates a new runway for experienced coders to push the boundaries of Pine. We recommend that newcomers to the language explore the basics first before diving into UDTs and objects.
Demonstration Code
Our example code shows a simple use case by displaying a Zig Zag with user-defined settings. A new ZigZag object is instantiated on the first bar using a Settings object to control its attributes. The fields for the Settings object are declared using variables assigned to input.* functions, allowing control of the field values from the script's settings. The `update()` function is invoked on each bar to update the ZigZag object's fields and create new lines and labels when required.
Look first. Then leap.
█ TYPES
This library contains the following types:
Settings
Provides calculation and display attributes to ZigZag objects.
Fields:
devThreshold : The minimum percentage deviation from a point before the ZigZag will change direction.
depth : The number of bars required for pivot detection.
lineColor : Line color.
extendLast : Condition allowing a line to connect the most recent pivot with the current close.
displayReversalPrice : Condition to display the pivot price in the pivot label.
displayCumulativeVolume : Condition to display the cumulative volume for the pivot segment in the pivot label.
displayReversalPriceChange : Condition to display the change in price or percent from the previous pivot in the pivot label.
differencePriceMode : Reversal change display mode. Options are "Absolute" or "Percent".
draw : Condition to display lines and labels.
Point
A coordinate containing time and price information.
Fields:
tm : A value in UNIX time.
price : A value on the Y axis (price).
Pivot
A level of significance used to determine directional movement or potential support and resistance.
Fields:
ln : A line object connecting the `start` and `end` Point objects.
lb : A label object to display pivot values.
isHigh : A condition to determine if the pivot is a pivot high.
vol : Volume for the pivot segment.
start : The coordinate of the previous Point.
end : The coordinate of the current Point.
ZigZag
An object to maintain Zig Zag settings, pivots, and volume.
Fields:
settings : Settings object to provide calculation and display attributes.
pivots : An array of Pivot objects.
sumVol : The volume sum for the pivot segment.
extend : Pivot object used to project a line from the last pivot to the last bar.
█ FUNCTIONS
This library contains the following functions:
lastPivot(this)
Returns the last Pivot of `this` ZigZag if there is at least one Pivot to return, and `na` otherwise.
Parameters:
this : (series ZigZag) A ZigZag object.
Returns: (Pivot) The last Pivot in the ZigZag.
update(this)
Updates `this` ZigZag object with new pivots, volume, lines, labels.
Parameters:
this : (series ZigZag) a ZigZag object.
Returns: (bool) true if a new Zig Zag line is found or the last Zig Zag line has changed.
newInstance(settings)
Instantiates a new ZigZag object with `settings`. If no settings are provided, a default ZigZag object is created.
Parameters:
settings : (series Settings) A Settings object.
Returns: (ZigZag) A new ZigZag instance.

EMAFlowLibrary "EMAFlow"
Functions that manipulate a set of 5 MAs created within user-supplied maximum and minimum lengths. The MAs are spaced out (within the range) in a way that approximates how Fibonnaci numbers are spaced.
Using MA flow, as opposed to simple crosses of the minimum and maximum lengths, gives more detail, and can result in faster changes and more resistance to chop, depending how you use it.
f_emaFlowBias()
@function f_emaFlowBias: Gives a bullish or bearish bias reading based on the EMA flow from the user-supplied range.
@param int _min: The minimum length of the EMA set.
@param int _max: The maximum length of the EMA set.
@param: string _source: The source for the EMA set. Must be in standard format (open, close, ohlc4, etc.)
@returns: An integer, representing the bias: 1 is bearish, 2 is slightly bearish, 3 is neutral, 4 is slightly bullish, 5 is bullish.

taLibrary "ta"
Collection of all custom and enhanced TA indicators. Same as enhanced_ta. But, removed all the displays to make it faster.
ma(source, maType, length)
returns custom moving averages
Parameters:
source : Moving Average Source
maType : Moving Average Type : Can be sma, ema, hma, rma, wma, vwma, swma, highlow, linreg, median
length : Moving Average Length
Returns: moving average for the given type and length
atr(maType, length)
returns ATR with custom moving average
Parameters:
maType : Moving Average Type : Can be sma, ema, hma, rma, wma, vwma, swma, highlow, linreg, median
length : Moving Average Length
Returns: ATR for the given moving average type and length
atrpercent(maType, length)
returns ATR as percentage of close price
Parameters:
maType : Moving Average Type : Can be sma, ema, hma, rma, wma, vwma, swma, highlow, linreg, median
length : Moving Average Length
Returns: ATR as percentage of close price for the given moving average type and length
bb(source, maType, length, multiplier, sticky)
returns Bollinger band for custom moving average
Parameters:
source : Moving Average Source
maType : Moving Average Type : Can be sma, ema, hma, rma, wma, vwma, swma, highlow, linreg, median
length : Moving Average Length
multiplier : Standard Deviation multiplier
sticky : - sticky boundaries which will only change when value is outside boundary.
Returns: Bollinger band with custom moving average for given source, length and multiplier
bbw(source, maType, length, multiplier, sticky)
returns Bollinger bandwidth for custom moving average
Parameters:
source : Moving Average Source
maType : Moving Average Type : Can be sma, ema, hma, rma, wma, vwma, swma, highlow, linreg, median
length : Moving Average Length
multiplier : Standard Deviation multiplier
sticky : - sticky boundaries which will only change when value is outside boundary.
Returns: Bollinger Bandwidth for custom moving average for given source, length and multiplier
bpercentb(source, maType, length, multiplier, sticky)
returns Bollinger Percent B for custom moving average
Parameters:
source : Moving Average Source
maType : Moving Average Type : Can be sma, ema, hma, rma, wma, vwma, swma, highlow, linreg, median
length : Moving Average Length
multiplier : Standard Deviation multiplier
sticky : - sticky boundaries which will only change when value is outside boundary.
Returns: Bollinger Percent B for custom moving average for given source, length and multiplier
kc(source, maType, length, multiplier, useTrueRange, sticky)
returns Keltner Channel for custom moving average
Parameters:
source : Moving Average Source
maType : Moving Average Type : Can be sma, ema, hma, rma, wma, vwma, swma, highlow, linreg, median
length : Moving Average Length
multiplier : Standard Deviation multiplier
useTrueRange : - if set to false, uses high-low.
sticky : - sticky boundaries which will only change when value is outside boundary.
Returns: Keltner Channel for custom moving average for given souce, length and multiplier
kcw(source, maType, length, multiplier, useTrueRange, sticky)
returns Keltner Channel Width with custom moving average
Parameters:
source : Moving Average Source
maType : Moving Average Type : Can be sma, ema, hma, rma, wma, vwma, swma, highlow, linreg, median
length : Moving Average Length
multiplier : Standard Deviation multiplier
useTrueRange : - if set to false, uses high-low.
sticky : - sticky boundaries which will only change when value is outside boundary.
Returns: Keltner Channel Width for custom moving average
kpercentk(source, maType, length, multiplier, useTrueRange, sticky)
returns Keltner Channel Percent K Width with custom moving average
Parameters:
source : Moving Average Source
maType : Moving Average Type : Can be sma, ema, hma, rma, wma, vwma, swma, highlow, linreg, median
length : Moving Average Length
multiplier : Standard Deviation multiplier
useTrueRange : - if set to false, uses high-low.
sticky : - sticky boundaries which will only change when value is outside boundary.
Returns: Keltner Percent K for given moving average, source, length and multiplier
dc(length, useAlternateSource, alternateSource, sticky)
returns Custom Donchian Channel
Parameters:
length : - donchian channel length
useAlternateSource : - Custom source is used only if useAlternateSource is set to true
alternateSource : - Custom source
sticky : - sticky boundaries which will only change when value is outside boundary.
Returns: Donchian channel
dcw(length, useAlternateSource, alternateSource, sticky)
returns Donchian Channel Width
Parameters:
length : - donchian channel length
useAlternateSource : - Custom source is used only if useAlternateSource is set to true
alternateSource : - Custom source
sticky : - sticky boundaries which will only change when value is outside boundary.
Returns: Donchian channel width
dpercentd(useAlternateSource, alternateSource, length, sticky)
returns Donchian Channel Percent of price
Parameters:
useAlternateSource : - Custom source is used only if useAlternateSource is set to true
alternateSource : - Custom source
length : - donchian channel length
sticky : - sticky boundaries which will only change when value is outside boundary.
Returns: Donchian channel Percent D
oscillatorRange(source, method, highlowLength, rangeLength, sticky)
oscillatorRange - returns Custom overbought/oversold areas for an oscillator input
Parameters:
source : - Osillator source such as RSI, COG etc.
method : - Valid values for method are : sma, ema, hma, rma, wma, vwma, swma, highlow, linreg, median
highlowLength : - length on which highlow of the oscillator is calculated
rangeLength : - length used for calculating oversold/overbought range - usually same as oscillator length
sticky : - overbought, oversold levels won't change unless crossed
Returns: Dynamic overbought and oversold range for oscillator input
oscillator(type, length, shortLength, longLength, source, highSource, lowSource, method, highlowLength, sticky)
oscillator - returns Choice of oscillator with custom overbought/oversold range
Parameters:
type : - oscillator type. Valid values : cci, cmo, cog, mfi, roc, rsi, stoch, tsi, wpr
length : - Oscillator length - not used for TSI
shortLength : - shortLength only used for TSI
longLength : - longLength only used for TSI
source : - custom source if required
highSource : - custom high source for stochastic oscillator
lowSource : - custom low source for stochastic oscillator
method : - Valid values for method are : sma, ema, hma, rma, wma, vwma, swma, highlow, linreg, median
highlowLength : - length on which highlow of the oscillator is calculated
sticky : - overbought, oversold levels won't change unless crossed
Returns: Oscillator value along with dynamic overbought and oversold range for oscillator input
multibands(bandType, source, maType, length, useTrueRange, sticky, numberOfBands, multiplierStart, multiplierStep)
multibands - returns Choice of oscillator with custom overbought/oversold range
Parameters:
bandType : - Band type - can be either bb or kc
source : - custom source if required
maType : Moving Average Type : Can be sma, ema, hma, rma, wma, vwma, swma, highlow, linreg, median
length : - Oscillator length - not used for TSI
useTrueRange : - if set to false, uses high-low.
sticky : - for sticky borders which only change upon source crossover/crossunder
numberOfBands : - Number of bands to generate
multiplierStart : - Starting ATR or Standard deviation multiplier for first band
multiplierStep : - Incremental value for multiplier for each band
Returns: array of band values sorted in ascending order
mbandoscillator(bandType, source, maType, length, useTrueRange, stickyBands, numberOfBands, multiplierStart, multiplierStep)
mbandoscillator - Multiband oscillator created on the basis of bands
Parameters:
bandType : - Band type - can be either bb or kc
source : - custom source if required
maType : Moving Average Type : Can be sma, ema, hma, rma, wma, vwma, swma, highlow, linreg, median
length : - Oscillator length - not used for TSI
useTrueRange : - if set to false, uses high-low.
stickyBands : - for sticky borders which only change upon source crossover/crossunder for band detection
numberOfBands : - Number of bands to generate
multiplierStart : - Starting ATR or Standard deviation multiplier for first band
multiplierStep : - Incremental value for multiplier for each band
Returns: oscillator currentStates - Array containing states for last n bars

Hurst Exponent (Dubuc's variation method)Library "Hurst"
hurst(length, samples, hi, lo)
Estimate the Hurst Exponent using Dubuc's variation method
Parameters:
length : The length of the history window to use. Large values do not cause lag.
samples : The number of scale samples to take within the window. These samples are then used for regression. The minimum value is 2 but 3+ is recommended. Large values give more accurate results but suffer from a performance penalty.
hi : The high value of the series to analyze.
lo : The low value of the series to analyze.
The Hurst Exponent is a measure of fractal dimension, and in the context of time series it may be interpreted as indicating a mean-reverting market if the value is below 0.5 or a trending market if the value is above 0.5. A value of exactly 0.5 corresponds to a random walk.
There are many definitions of fractal dimension and many methods for its estimation. Approaches relying on calculation of an area, such as the Box Counting Method, are inappropriate for time series data, because the units of the x-axis (time) do match the units of the y-axis (price). Other approaches such as Detrended Fluctuation Analysis are useful for nonstationary time series but are not exactly equivalent to the Hurst Exponent.
This library implements Dubuc's variation method for estimating the Hurst Exponent. The technique is insensitive to x-axis units and is therefore useful for time series. It will give slightly different results to DFA, and the two methods should be compared to see which estimator fits your trading objectives best.
Original Paper:
Dubuc B, Quiniou JF, Roques-Carmes C, Tricot C. Evaluating the fractal dimension of profiles. Physical Review A. 1989;39(3):1500-1512. DOI: 10.1103/PhysRevA.39.1500
Review of various Hurst Exponent estimators for time-series data, including Dubuc's method:
www.intechopen.com

Traders_Reality_LibLibrary "Traders_Reality_Lib"
This library contains common elements used in Traders Reality scripts
calcPvsra(pvsraVolume, pvsraHigh, pvsraLow, pvsraClose, pvsraOpen, redVectorColor, greenVectorColor, violetVectorColor, blueVectorColor, darkGreyCandleColor, lightGrayCandleColor)
calculate the pvsra candle color and return the color as well as an alert if a vector candle has apperared.
Situation "Climax"
Bars with volume >= 200% of the average volume of the 10 previous chart TFs, or bars
where the product of candle spread x candle volume is >= the highest for the 10 previous
chart time TFs.
Default Colors: Bull bars are green and bear bars are red.
Situation "Volume Rising Above Average"
Bars with volume >= 150% of the average volume of the 10 previous chart TFs.
Default Colors: Bull bars are blue and bear are violet.
Parameters:
pvsraVolume : the instrument volume series (obtained from request.sequrity)
pvsraHigh : the instrument high series (obtained from request.sequrity)
pvsraLow : the instrument low series (obtained from request.sequrity)
pvsraClose : the instrument close series (obtained from request.sequrity)
pvsraOpen : the instrument open series (obtained from request.sequrity)
redVectorColor : red vector candle color
greenVectorColor : green vector candle color
violetVectorColor : violet/pink vector candle color
blueVectorColor : blue vector candle color
darkGreyCandleColor : regular volume candle down candle color - not a vector
lightGrayCandleColor : regular volume candle up candle color - not a vector
@return
adr(length, barsBack)
Parameters:
length : how many elements of the series to calculate on
barsBack : starting possition for the length calculation - current bar or some other value eg last bar
@return adr the adr for the specified lenght
adrHigh(adr, fromDo)
Calculate the ADR high given an ADR
Parameters:
adr : the adr
fromDo : boolean flag, if false calculate traditional adr from high low of today, if true calcualte from exchange midnight
@return adrHigh the position of the adr high in price
adrLow(adr, fromDo)
Parameters:
adr : the adr
fromDo : boolean flag, if false calculate traditional adr from high low of today, if true calcualte from exchange midnight
@return adrLow the position of the adr low in price
splitSessionString(sessXTime)
given a session in the format 0000-0100:23456 split out the hours and minutes
Parameters:
sessXTime : the session time string usually in the format 0000-0100:23456
@return
calcSessionStartEnd(sessXTime, gmt)
calculate the start and end timestamps of the session
Parameters:
sessXTime : the session time string usually in the format 0000-0100:23456
gmt : the gmt offset string usually in the format GMT+1 or GMT+2 etc
@return
drawOpenRange(sessXTime, sessXcol, showOrX, gmt)
draw open range for a session
Parameters:
sessXTime : session string in the format 0000-0100:23456
sessXcol : the color to be used for the opening range box shading
showOrX : boolean flag to toggle displaying the opening range
gmt : the gmt offset string usually in the format GMT+1 or GMT+2 etc
@return void
drawSessionHiLo(sessXTime, show_rectangleX, show_labelX, sessXcolLabel, sessXLabel, gmt, sessionLineStyle)
Parameters:
sessXTime : session string in the format 0000-0100:23456
show_rectangleX : show the session high and low lines
show_labelX : show the session label
sessXcolLabel : the color to be used for the hi/low lines and label
sessXLabel : the session label text
gmt : the gmt offset string usually in the format GMT+1 or GMT+2 etc
sessionLineStyle : the line stile for the session high low lines
@return void
calcDst()
calculate market session dst on/off flags
@return indicating if DST is on or off for a particular region
timestampPreviousDayOfWeek(previousDayOfWeek, hourOfDay, gmtOffset, oneWeekMillis)
Timestamp any of the 6 previous days in the week (such as last Wednesday at 21 hours GMT)
Parameters:
previousDayOfWeek : Monday or Satruday
hourOfDay : the hour of the day when psy calc is to start
gmtOffset : the gmt offset string usually in the format GMT+1 or GMT+2 etc
oneWeekMillis : the amount if time for a week in milliseconds
@return the timestamp of the psy level calculation start time
getdayOpen()
get the daily open - basically exchange midnight
@return the daily open value which is float price
newBar(res)
new_bar: check if we're on a new bar within the session in a given resolution
Parameters:
res : the desired resolution
@return true/false is a new bar for the session has started
toPips(val)
to_pips Convert value to pips
Parameters:
val : the value to convert to pips
@return the value in pips
rLabel(ry, rtext, rstyle, rcolor, valid, labelXOffset)
a function that draws a right aligned lable for a series during the current bar
Parameters:
ry : series float the y coordinate of the lable
rtext : the text of the label
rstyle : the style for the lable
rcolor : the color for the label
valid : a boolean flag that allows for turning on or off a lable
labelXOffset : how much to offset the label from the current position
rLabelOffset(ry, rtext, rstyle, rcolor, valid, labelXOffset)
a function that draws a right aligned lable for a series during the current bar
Parameters:
ry : series float the y coordinate of the lable
rtext : the text of the label
rstyle : the style for the lable
rcolor : the color for the label
valid : a boolean flag that allows for turning on or off a lable
labelXOffset : how much to offset the label from the current position
rLabelLastBar(ry, rtext, rstyle, rcolor, valid, labelXOffset)
a function that draws a right aligned lable for a series only on the last bar
Parameters:
ry : series float the y coordinate of the lable
rtext : the text of the label
rstyle : the style for the lable
rcolor : the color for the label
valid : a boolean flag that allows for turning on or off a lable
labelXOffset : how much to offset the label from the current position
drawLine(xSeries, res, tag, xColor, xStyle, xWidth, xExtend, isLabelValid, labelXOffset, validTimeFrame)
a function that draws a line and a label for a series
Parameters:
xSeries : series float the y coordinate of the line/label
res : the desired resolution controlling when a new line will start
tag : the text for the lable
xColor : the color for the label
xStyle : the style for the line
xWidth : the width of the line
xExtend : extend the line
isLabelValid : a boolean flag that allows for turning on or off a label
labelXOffset : how much to offset the label from the current position
validTimeFrame : a boolean flag that allows for turning on or off a line drawn
drawLineDO(xSeries, res, tag, xColor, xStyle, xWidth, xExtend, isLabelValid, labelXOffset, validTimeFrame)
a function that draws a line and a label for the daily open series
Parameters:
xSeries : series float the y coordinate of the line/label
res : the desired resolution controlling when a new line will start
tag : the text for the lable
xColor : the color for the label
xStyle : the style for the line
xWidth : the width of the line
xExtend : extend the line
isLabelValid : a boolean flag that allows for turning on or off a label
labelXOffset : how much to offset the label from the current position
validTimeFrame : a boolean flag that allows for turning on or off a line drawn
drawPivot(pivotLevel, res, tag, pivotColor, pivotLabelColor, pivotStyle, pivotWidth, pivotExtend, isLabelValid, validTimeFrame, levelStart, pivotLabelXOffset)
draw a pivot line - the line starts one day into the past
Parameters:
pivotLevel : series of the pivot point
res : the desired resolution
tag : the text to appear
pivotColor : the color of the line
pivotLabelColor : the color of the label
pivotStyle : the line style
pivotWidth : the line width
pivotExtend : extend the line
isLabelValid : boolean param allows to turn label on and off
validTimeFrame : only draw the line and label at a valid timeframe
levelStart : basically when to start drawing the levels
pivotLabelXOffset : how much to offset the label from its current postion
@return the pivot line series
getPvsraFlagByColor(pvsraColor, redVectorColor, greenVectorColor, violetVectorColor, blueVectorColor, lightGrayCandleColor)
convert the pvsra color to an internal code
Parameters:
pvsraColor : the calculated pvsra color
redVectorColor : the user defined red vector color
greenVectorColor : the user defined green vector color
violetVectorColor : the user defined violet vector color
blueVectorColor : the user defined blue vector color
lightGrayCandleColor : the user defined regular up candle color
@return pvsra internal code
updateZones(pvsra, direction, boxArr, maxlevels, pvsraHigh, pvsraLow, pvsraOpen, pvsraClose, transperancy, zoneupdatetype, zonecolor, zonetype, borderwidth, coloroverride, redVectorColor, greenVectorColor, violetVectorColor, blueVectorColor, lightGrayCandleColor)
a function that draws the unrecovered vector candle zones
Parameters:
pvsra : internal code
direction : above or below the current pa
boxArr : the array containing the boxes that need to be updated
maxlevels : the maximum number of boxes to draw
pvsraHigh : the pvsra high value series
pvsraLow : the pvsra low value series
pvsraOpen : the pvsra open value series
pvsraClose : the pvsra close value series
transperancy : the transparencfy of the vecor candle zones
zoneupdatetype : the zone update type
zonecolor : the zone color if overriden
zonetype : the zone type
borderwidth : the width of the border
coloroverride : if the color overriden
redVectorColor : the user defined red vector color
greenVectorColor : the user defined green vector color
violetVectorColor : the user defined violet vector color
blueVectorColor : the user defined blue vector color
lightGrayCandleColor : the user defined regular up candle color
cleanarr(arr)
clean an array from na values
Parameters:
arr : the array to clean
@return if the array was cleaned
calcPsyLevels(oneWeekMillis, showPsylevels, psyType, sydDST)
calculate the psy levels
4 hour res based on how mt4 does it
mt4 code
int Li_4 = iBarShift(NULL, PERIOD_H4, iTime(NULL, PERIOD_W1, Li_0)) - 2 - Offset;
ObjectCreate("PsychHi", OBJ_TREND, 0, Time , iHigh(NULL, PERIOD_H4, iHighest(NULL, PERIOD_H4, MODE_HIGH, 2, Li_4)), iTime(NULL, PERIOD_W1, 0), iHigh(NULL, PERIOD_H4,
iHighest(NULL, PERIOD_H4, MODE_HIGH, 2, Li_4)));
so basically because the session is 8 hours and we are looking at a 4 hour resolution we only need to take the highest high an lowest low of 2 bars
we use the gmt offset to adjust the 0000-0800 session to Sydney open which is at 2100 during dst and at 2200 otherwize. (dst - spring foward, fall back)
keep in mind sydney is in the souther hemisphere so dst is oposite of when london and new york go into dst
Parameters:
oneWeekMillis : a constant value
showPsylevels : should psy levels be calculated
psyType : the type of Psylevels - crypto or forex
sydDST : is Sydney in DST
@return

RS_TD_Library_2Library "RS_TD_Library_2"
TradingView Library for showing option prices on the chart
Here is a simple way to draw options to an underlying asset on the chart. At the top right there is a table with the summary of the corresponding premiums. A tooltip shows the corresponding buy/sell prices for each option.
showTable(sumShortPut, sumLongPut, sumShortCall, sumLongCall, sumTotal, smallLayout)
Shows the table of profit/loss of all options to the given underlying
Parameters:
sumShortPut : Sum of all short put options
sumLongPut : Sum of all long put options
sumShortCall : Sum of all short call options
sumLongCall : Sum of all long call options
sumTotal : Sum of all kind of options
smallLayout : Usage of a small table layout
debugging_labelOnEachBar(_text)
Shows a debugging label on each bar
Parameters:
_text : Text to show on the label
showLine(date1, date2, strike, color)
Prints a line at the strike of the option
Parameters:
date1 : Buying date of the option
date2 : Selling date of the option
strike : Strike of the option
color : Color of the line
showLabel(date, strike, color, tooltip)
Prints a label at the strike of the option
Parameters:
date : Buying/Selling date of the option
strike : Strike of the option
color : Color of the line
tooltip : ToolTip of the option with the detailed prices

LibIndicadoresUteisLibrary "LibIndicadoresUteis"
Collection of useful indicators. This collection does not do any type of plotting on the graph, as the methods implemented can and should be used to get the return of mathematical formulas, in a way that speeds up the development of new scripts. The current version contains methods for stochastic return, slow stochastic, IFR, leverage calculation for B3 futures market, leverage calculation for B3 stock market, bollinger bands and the range of change.
estocastico(PeriodoEstocastico)
Returns the value of stochastic
Parameters:
PeriodoEstocastico : Period for calculation basis
Returns: Float with the stochastic value of the period
estocasticoLento(PeriodoEstocastico, PeriodoMedia)
Returns the value of slow stochastic
Parameters:
PeriodoEstocastico : Stochastic period for calculation basis
PeriodoMedia : Average period for calculation basis
Returns: Float with the value of the slow stochastic of the period
ifrInvenenado(PeriodoIFR, OrigemIFR)
Returns the value of the RSI/IFR Poisoned of Guima
Parameters:
PeriodoIFR : RSI/IFR period for calculation basis
OrigemIFR : Source of RSI/IFR for calculation basis
Returns: Float with the RSI/IFR value for the period
calculoAlavancagemFuturos(margem, alavancagemMaxima)
Returns the number of contracts to work based on margin
Parameters:
margem : Margin for contract unit
alavancagemMaxima : Maximum number of contracts to work
Returns: Integer with the number of contracts suggested for trading
calculoAlavancagemAcoes(alavancagemMaxima)
Returns the number of batches to work based on the margin
Parameters:
alavancagemMaxima : Maximum number of batches to work
Returns: Integer with the amount of lots suggested for trading
bandasBollinger(periodoBB, origemBB, desvioPadrao)
Returns the value of bollinger bands
Parameters:
periodoBB : Period of bollinger bands for calculation basis
origemBB : Origin of bollinger bands for calculation basis
desvioPadrao : Standard Deviation of bollinger bands for calculation basis
Returns: Two-position array with upper and lower band values respectively
theRoc(periodoROC, origemROC)
Returns the value of Rate Of Change
Parameters:
periodoROC : Period for calculation basis
origemROC : Source of calculation basis
Returns: Float with the value of Rate Of Change
KernelFunctionsLibrary "KernelFunctions"
This library provides non-repainting kernel functions for Nadaraya-Watson estimator implementations. This allows for easy substitution/comparison of different kernel functions for one another in indicators. Furthermore, kernels can easily be combined with other kernels to create newer, more customized kernels. Compared to Moving Averages (which are really just simple kernels themselves), these kernel functions are more adaptive and afford the user an unprecedented degree of customization and flexibility.
rationalQuadratic(_src, _lookback, _relativeWeight, _startAtBar)
Rational Quadratic Kernel - An infinite sum of Gaussian Kernels of different length scales.
Parameters:
_src : The source series.
_lookback : The number of bars used for the estimation. This is a sliding value that represents the most recent historical bars.
_relativeWeight : Relative weighting of time frames. Smaller values result in a more stretched-out curve, and larger values will result in a more wiggly curve. As this value approaches zero, the longer time frames will exert more influence on the estimation. As this value approaches infinity, the behavior of the Rational Quadratic Kernel will become identical to the Gaussian kernel.
_startAtBar : Bar index on which to start regression. The first bars of a chart are often highly volatile, and omitting these initial bars often leads to a better overall fit.
Returns: yhat The estimated values according to the Rational Quadratic Kernel.
gaussian(_src, _lookback, _startAtBar)
Gaussian Kernel - A weighted average of the source series. The weights are determined by the Radial Basis Function (RBF).
Parameters:
_src : The source series.
_lookback : The number of bars used for the estimation. This is a sliding value that represents the most recent historical bars.
_startAtBar : Bar index on which to start regression. The first bars of a chart are often highly volatile, and omitting these initial bars often leads to a better overall fit.
Returns: yhat The estimated values according to the Gaussian Kernel.
periodic(_src, _lookback, _period, _startAtBar)
Periodic Kernel - The periodic kernel (derived by David Mackay) allows one to model functions that repeat themselves exactly.
Parameters:
_src : The source series.
_lookback : The number of bars used for the estimation. This is a sliding value that represents the most recent historical bars.
_period : The distance between repititions of the function.
_startAtBar : Bar index on which to start regression. The first bars of a chart are often highly volatile, and omitting these initial bars often leads to a better overall fit.
Returns: yhat The estimated values according to the Periodic Kernel.
locallyPeriodic(_src, _lookback, _period, _startAtBar)
Locally Periodic Kernel - The locally periodic kernel is a periodic function that slowly varies with time. It is the product of the Periodic Kernel and the Gaussian Kernel.
Parameters:
_src : The source series.
_lookback : The number of bars used for the estimation. This is a sliding value that represents the most recent historical bars.
_period : The distance between repititions of the function.
_startAtBar : Bar index on which to start regression. The first bars of a chart are often highly volatile, and omitting these initial bars often leads to a better overall fit.
Returns: yhat The estimated values according to the Locally Periodic Kernel.
inChart - LibLibrary "inChart"
determine if price value is between chart high + x% and low - x% on the visible chart.
inChart()

taLibrary "ta"
This library is a Pine Script™ programmer’s tool containing calcs for my oscillators and some helper functions.
buoyancy(src, targetPeriod, maxLookback)
Calculates buoyancy using a target of `src` summed over `targetPeriod` bars, not searching back farther than `maxLookback` bars. See:
Parameters:
src : (series float) The source value that is summed to constitute the target.
targetPeriod : (series int) The qty of bars to sum `src` for in order to calculate the target.
maxLookback : (simple int) The maximum number of bars back the function will search.
Returns: (series float) Buoyancy: the gap between the avg distance of past up and dn bars added to reach the target, divided by the max distance reached. Returns zero when an error condition occurs.
efficientWork(length)
Calculates Efficient Work on `length` bars. See:
Parameters:
length : (simple int) The length of the ALMA used to calculate the result.
Returns: (series float) A -1 to +1 value representing the efficiency of price travel, bar to bar.
ma(type, src, length)
Returns the `type` MA of the `src` over the `length`.
Parameters:
type : (simple string) The type of MA required (uses constants that must be defined earlier in the script).
src : (series float) The source value used to calculate the MA.
length : (simple int) The length value used to calculate the MA.
Returns: (series float) The MA value.
divergenceChannel(divergence, hiSrc, loSrc, breachHiSrc, breachLoSrc)
Calculates the levels and states of divergence channels, which are created when divergences occur.
Parameters:
divergence : (series bool) `true` on divergences, which can be defined any way. On breached channels it creates a new channel, otherwise, channel levels are expanded.
hiSrc : (series float) The price source used to set the channel's hi level when a divergence occurs.
loSrc : (series float) The price source used to set the channel's lo level when a divergence occurs.
breachHiSrc : (series float) The price source that must breach over the channel's `channelHi` level for a breach to occur.
breachLoSrc : (series float) The price source that must breach under the channel's `channelLo` level for a breach to occur.
Returns: A tuple containing the following values:
sourceStrToFloat(srcString)
Converts the name of a source in the `srcString` to its numerical equivalent.
Parameters:
srcString : (series string) The string representing the name of the source value to be returned.
Returns: (series float) The source's value.

TR_Base_LibLibrary "TR_Base_Lib"
TODO: add library description here
SetHighLowArray()
ChangeHighLowArray()
ShowLabel(_Text, _X, _Y, _Style, _Size, _Yloc, _Color)
TODO: Function to display labels
Parameters:
_Text : TODO: text (series string) Label text.
_X : TODO: x (series int) Bar index.
_Y : TODO: y (series int/float) Price of the label position.
_Style : TODO: style (series string) Label style.
_Size : TODO: size (series string) Label size.
_Yloc : TODO: yloc (series string) Possible values are yloc.price, yloc.abovebar, yloc.belowbar.
_Color : TODO: color (series color) Color of the label border and arrow
Returns: TODO: No return values
GetColor(_Index)
TODO: Function to take out 12 colors in order
Parameters:
_Index : TODO: color number.
Returns: TODO: color code
Tbl_position(_Pos)
TODO: Table display position function
Parameters:
_Pos : TODO: position.
Returns: TODO: Table position
Tbl_position_JP(_Pos)
TODO: テーブル表示位置 日本語表示位置を定数に変換
Parameters:
_Pos : TODO: 日本語表示位置
Returns: TODO: _result:表示位置の定数を返す
TfInMinutes(_Tf)
TODO: 足変換、TimeFrameを分に変換
Parameters:
_Tf : TODO: TimeFrame文字
Returns: TODO: _result:TimeFrameを分に変換した値、_chartTf:チャートのTimeFrameを分に変換した値
TfName_JP(_tf)
TODO: TimeFrameを日本語足名に変換して返す関数 引数がブランクの時はチャートの日本語足名を返す
Parameters:
_tf : TODO: TimeFrame文字
Returns: TODO: _result:日本語足名
DeleteLine()
TODO: Delete Line
Parameters:
: TODO: No parameter
Returns: TODO: No return value
DeleteLabel()
TODO: Delete Label
Parameters:
: TODO: No parameter
Returns: TODO: No return value
SupportResitanceAndTrendLibrary "SupportResitanceAndTrend"
Contains utilities for finding key levels of support, resistance and direction of trend.
superTrendPlus(multiple, h, l, atr, closeBars)
A more flexible version of SuperTrend that allows for supplying the series used and sensitivity adjustment by confirming close bars.
Parameters:
multiple : The multiple to apply to the average true range.
h : The high values.
l : The low values.
atr : The average true range values.
closeBars : The number of bars to confirm a change in trend.
Returns:
superTrend(multiple, period, mode, closeBars)
superTrendPlus with simplified parameters.
Parameters:
multiple : The multiple to apply to the average true range.
period : The number of bars to measure.
mode : The type of moving average to use with the true range.
closeBars : The number of bars to confirm a change in trend.
Returns:
superTrendCleaned(multiple, period, mode, closeBars, maxDeviation)
superTrendPlus with default compensation for extreme volatility.
Parameters:
multiple : The multiple to apply to the average true range.
period : The number of bars to measure.
mode : The type of moving average to use with the true range.
closeBars : The number of bars to confirm a change in trend.
maxDeviation : The optional standard deviation level to use when cleaning the series. The default is the value of the provided level.
Returns:
stochSR()
Identifies support and resistance levels by when a stochastic RSI reverses.
Returns:
stochAVWAP()
Identifies anchored VWAP levels by when a stochastic RSI reverses.
Returns:

MovingAveragesLibrary "MovingAverages"
vawma(len, src, volumeDefault)
VAWMA = VWMA and WMA combined. Simply put, this attempts to determine the average price per share over time weighted heavier for recent values. Uses a triangular algorithm to taper off values in the past (same as WMA does).
Parameters:
len : The number of bars to measure with.
src : The series to measure from. Default is 'hlc3'.
volumeDefault : The default value to use when a chart has no (N/A) volume.
Returns: The volume adjusted triangular weighted moving average of the series.
cma(n, D, C, compound)
Coefficient Moving Avereage (CMA) is a variation of a moving average that can simulate SMA or WMA with the advantage of previous data.
Parameters:
n : The number of bars to measure with.
D : The series to measure from. Default is 'close'.
C : The coefficient to use when averaging. 0 behaves like SMA, 1 behaves like WMA.
compound : When true (default is false) will use a compounding method for weighting the average.
ema(len, src)
Same as ta.ema(src,len) but properly ignores NA values.
Parameters:
len : The number of samples to derive the average from.
src : The series to measure from. Default is 'close'.
wma(len, src, startingWeight)
Same as ta.wma(src,len) but properly ignores NA values.
Parameters:
len : The number of samples to derive the average from.
src : The series to measure from. Default is 'close'.
startingWeight : The weight to begin with when calculating the average. Higher numbers will decrease the bias.
vwma(len, src, volumeDefault)
Same as ta.vwma(src,len) but properly ignores NA values.
Parameters:
len : The number of bars to measure with.
src : The series to measure from. Default is 'hlc3'.
volumeDefault : The default value to use when a chart has no (N/A) volume.
get(type, len, src)
Generates a moving average based upon a 'type'.
Parameters:
type : The type of moving average to generate. Values allowed are: SMA, EMA, WMA, VWMA and VAWMA.
len : The number of bars to measure with.
src : The series to measure from. Default is 'close'.
Returns: The moving average series requested.
DataCleanerLibrary "DataCleaner"
outlierLevel(src, len, level)
Gets the (standard deviation) outlier level for a given series.
Parameters:
src : The series to average and add a multiple of the standard deviation to.
len : The The number of bars to measure.
level : The positive or negative multiple of the standard deviation to apply to the average. A positive number will be the upper boundary and a negative number will be the lower boundary.
Returns: The average of the series plus the multiple of the standard deviation.
naOutliers(src, len, maxDeviation)
Returns only values that are within the maximum deviation.
Parameters:
src : The series to filter results from.
len : The The number of bars to measure.
maxDeviation : The maximum deviation before considered an outlier.
normalize(src, len, maxDeviation, baseline)
Returns the source value adjusted by its standard deviation.
Parameters:
src : The series to measure.
len : The number of bars to measure the standard deviation.
maxDeviation : The maximum deviation before considered an outlier.
baseline : The value considered to be at center. Typically zero.
cleanUsing(src, result, len, maxDeviation)
Returns an array representing the result series with (outliers provided by the source) removed.
Parameters:
src : The source series to read from.
result : The result series.
len : The maximum size of the resultant array.
maxDeviation : The positive or negative multiple of the standard deviation to apply to the average. A positive number will be the upper boundary and a negative number will be the lower boundary.
Returns: An array containing the cleaned series.
clean(src, len, maxDeviation)
Returns an array representing the source series with outliers removed.
Parameters:
src : The source series to read from.
len : The maximum size of the resultant array.
maxDeviation : The positive or negative multiple of the standard deviation to apply to the average. A positive number will be the upper boundary and a negative number will be the lower boundary.
Returns: An array containing the cleaned series.
cleanArray(src, maxDeviation)
Returns an array representing the source array with outliers removed.
Parameters:
src : The source series to read from.
maxDeviation : The positive or negative multiple of the standard deviation to apply to the average. A positive number will be the upper boundary and a negative number will be the lower boundary.
Returns: An array containing the cleaned series.
naArrayOutliers(src, maxDeviation)
Returns an array representing the source array with outliers removed.
Parameters:
src : The array to set outliers to N/A.
maxDeviation : The maximum deviation before considered an outlier.
Returns: True if there were any outliers; otherwise false.
outlierLevelAdjusted(src, len, level, maxDeviation)
Gets the (standard deviation) outlier level for a given series after a single pass of removing any outliers.
Parameters:
src : The series to average and add a multiple of the standard deviation to.
len : The The number of bars to measure.
level : The positive or negative multiple of the standard deviation to apply to the average. A positive number will be the upper boundary and a negative number will be the lower boundary.
maxDeviation : The optional standard deviation level to use when cleaning the series. The default is the value of the provided level.
Returns: The average of the series plus the multiple of the standard deviation.

obvFilterThis library comes with everything you need to add an On Balance Volume (OBV) filter to your strategy.
getOnBalanceVolumeFilter(source, maType, fastMaLength, fastMaLength)
Get the fast and slow moving average for on balance volume
Parameters:
source : hook this up to an 'input.source' input
maType : Choose from EMA, SMA, RMA, or WMA
fastMaLength : int smoothing length for fast moving average
fastMaLength : int smoothing length for fast moving average int smoothing length for slow moving average
Returns: Tuple with fast obv moving average and slow obv moving average
Add this to your strategy
▾ ▾ ▾ ▾ ▾ ▾ ▾ ▾ ▾ ▾ ▾ ▾ ▾ ▾ ▾ ▾ ▾ ▾ ▾ ▾ ▾ ▾ ▾ ▾
import jordanfray/obvFilter/1 as obv
obvSource = input.source(defval=close, title="OBV Source", group="On Balance Volume Filter")
obvMaType = input.string(defval="EMA", title="OBV Smoothing Type", options = , group="On Balance Volume Filter")
fastMaLength = input.int(title = "Fast OBV MA Length", defval = 9, minval = 2, maxval = 200, group="On Balance Volume Filter")
slowMaLength = input.int(title = "Slow OBV MA Length", defval = 21, minval = 1, maxval = 200, group="On Balance Volume Filter")
= obv.getOnBalanceVolumeFilter(obvSource, obvMaType, fastMaLength, slowMaLength)
Moving Averages ProxyLibrary "MovingAveragesProxy"
Moving Averages Proxy - Library of all moving averages spread out in different libraries
rvwap(_src, fixedTfInput, minsInput, hoursInput, daysInput, minBarsInput)
Calculates the Rolling VWAP (customized VWAP developed by the team of TradingView)
Parameters:
_src : (float) Source. Default: close
fixedTfInput : (bool) Use a fixed time period. Default: false
minsInput : (int) Minutes. Default: 0
hoursInput : (int) Hours. Default: 0
daysInput : (int) Days. Default: 1
minBarsInput : (int) Bars. Default: 10
Returns: (float) Rolling VWAP
correlationMa(src, len, factor)
Correlation Moving Average
Parameters:
src : (float) Source. Default: close
len : (int) Length
factor : (float) Factor. Default: 1.7
Returns: (float) Correlation Moving Average
regma(src, len, lambda)
Regularized Exponential Moving Average
Parameters:
src : (float) Source. Default: close
len : (int) Length
lambda : (float) Lambda. Default: 0.5
Returns: (float) Regularized Exponential Moving Average
repma(src, len)
Repulsion Moving Average
Parameters:
src : (float) Source. Default: close
len : (int) Length
Returns: (float) Repulsion Moving Average
epma(src, length, offset)
End Point Moving Average
Parameters:
src : (float) Source. Default: close
length : (int) Length
offset : (float) Offset. Default: 4
Returns: (float) End Point Moving Average
lc_lsma(src, length)
1LC-LSMA (1 line code lsma with 3 functions)
Parameters:
src : (float) Source. Default: close
length : (int) Length
Returns: (float) 1LC-LSMA Moving Average
aarma(src, length)
Adaptive Autonomous Recursive Moving Average
Parameters:
src : (float) Source. Default: close
length : (int) Length
Returns: (float) Adaptive Autonomous Recursive Moving Average
alsma(src, length)
Adaptive Least Squares
Parameters:
src : (float) Source. Default: close
length : (int) Length
Returns: (float) Adaptive Least Squares
ahma(src, length)
Ahrens Moving Average
Parameters:
src : (float) Source. Default: close
length : (int) Length
Returns: (float) Ahrens Moving Average
adema(src)
Ahrens Moving Average
Parameters:
src : (float) Source. Default: close
Returns: (float) Moving Average
autol(src, lenDev)
Auto-Line
Parameters:
src : (float) Source. Default: close
lenDev : (int) Length for standard deviation
Returns: (float) Auto-Line
fibowma(src, length)
Fibonacci Weighted Moving Average
Parameters:
src : (float) Source. Default: close
length : (int) Length
Returns: (float) Moving Average
fisherlsma(src, length)
Fisher Least Squares Moving Average
Parameters:
src : (float) Source. Default: close
length : (int) Length
Returns: (float) Moving Average
leoma(src, length)
Leo Moving Average
Parameters:
src : (float) Source. Default: close
length : (int) Length
Returns: (float) Moving Average
linwma(src, period, weight)
Linear Weighted Moving Average
Parameters:
src : (float) Source. Default: close
period : (int) Length
weight : (int) Weight
Returns: (float) Moving Average
mcma(src, length)
McNicholl Moving Average
Parameters:
src : (float) Source. Default: close
length : (int) Length
Returns: (float) Moving Average
srwma(src, length)
Square Root Weighted Moving Average
Parameters:
src : (float) Source. Default: close
length : (int) Length
Returns: (float) Moving Average
EDSMA(src, len)
Ehlers Dynamic Smoothed Moving Average.
Parameters:
src : Series to use ('close' is used if no argument is supplied).
len : Lookback length to use.
Returns: EDSMA smoothing.
dema(x, t)
Double Exponential Moving Average.
Parameters:
x : Series to use ('close' is used if no argument is supplied).
t : Lookback length to use.
Returns: DEMA smoothing.
tema(src, len)
Triple Exponential Moving Average.
Parameters:
src : Series to use ('close' is used if no argument is supplied).
len : Lookback length to use.
Returns: TEMA smoothing.
smma(src, len)
Smoothed Moving Average.
Parameters:
src : Series to use ('close' is used if no argument is supplied).
len : Lookback length to use.
Returns: SMMA smoothing.
hullma(src, len)
Hull Moving Average.
Parameters:
src : Series to use ('close' is used if no argument is supplied).
len : Lookback length to use.
Returns: Hull smoothing.
frama(x, t)
Fractal Reactive Moving Average.
Parameters:
x : Series to use ('close' is used if no argument is supplied).
t : Lookback length to use.
Returns: FRAMA smoothing.
kama(x, t)
Kaufman's Adaptive Moving Average.
Parameters:
x : Series to use ('close' is used if no argument is supplied).
t : Lookback length to use.
Returns: KAMA smoothing.
vama(src, len)
Volatility Adjusted Moving Average.
Parameters:
src : Series to use ('close' is used if no argument is supplied).
len : Lookback length to use.
Returns: VAMA smoothing.
donchian(len)
Donchian Calculation.
Parameters:
len : Lookback length to use.
Returns: Average of the highest price and the lowest price for the specified look-back period.
Jurik(src, len)
Jurik Moving Average.
Parameters:
src : Series to use ('close' is used if no argument is supplied).
len : Lookback length to use.
Returns: JMA smoothing.
xema(src, len)
Optimized Exponential Moving Average.
Parameters:
src : Series to use ('close' is used if no argument is supplied).
len : Lookback length to use.
Returns: XEMA smoothing.
ehma(src, len)
EHMA - Exponential Hull Moving Average
Parameters:
src : Source
len : Period
Returns: Exponential Hull Moving Average (EHMA)
covwema(src, len)
Coefficient of Variation Weighted Exponential Moving Average (COVWEMA)
Parameters:
src : Source
len : Period
Returns: Coefficient of Variation Weighted Exponential Moving Average (COVWEMA)
covwma(src, len)
Coefficient of Variation Weighted Moving Average (COVWMA)
Parameters:
src : Source
len : Period
Returns: Coefficient of Variation Weighted Moving Average (COVWMA)
eframa(src, len, FC, SC)
Ehlrs Modified Fractal Adaptive Moving Average (EFRAMA)
Parameters:
src : Source
len : Period
FC : Lower Shift Limit for Ehlrs Modified Fractal Adaptive Moving Average
SC : Upper Shift Limit for Ehlrs Modified Fractal Adaptive Moving Average
Returns: Ehlrs Modified Fractal Adaptive Moving Average (EFRAMA)
etma(src, len)
Exponential Triangular Moving Average (ETMA)
Parameters:
src : Source
len : Period
Returns: Exponential Triangular Moving Average (ETMA)
rma(src, len)
RMA - RSI Moving average
Parameters:
src : Source
len : Period
Returns: RSI Moving average (RMA)
thma(src, len)
THMA - Triple Hull Moving Average
Parameters:
src : Source
len : Period
Returns: Triple Hull Moving Average (THMA)
vidya(src, len)
Variable Index Dynamic Average (VIDYA)
Parameters:
src : Source
len : Period
Returns: Variable Index Dynamic Average (VIDYA)
zsma(src, len)
Zero-Lag Simple Moving Average (ZSMA)
Parameters:
src : Source
len : Period
Returns: Zero-Lag Simple Moving Average (ZSMA)
zema(src, len)
Zero-Lag Exponential Moving Average (ZEMA)
Parameters:
src : Source
len : Period
Returns: Zero-Lag Exponential Moving Average (ZEMA)
evwma(src, len)
EVWMA - Elastic Volume Weighted Moving Average
Parameters:
src : Source
len : Period
Returns: Elastic Volume Weighted Moving Average (EVWMA)
tt3(src, len, a1_t3)
Tillson T3
Parameters:
src : Source
len : Period
a1_t3 : Tillson T3 Volume Factor
Returns: Tillson T3
gma(src, len)
GMA - Geometric Moving Average
Parameters:
src : Source
len : Period
Returns: Geometric Moving Average (GMA)
wwma(src, len)
WWMA - Welles Wilder Moving Average
Parameters:
src : Source
len : Period
Returns: Welles Wilder Moving Average (WWMA)
cma(src, len)
Corrective Moving average (CMA)
Parameters:
src : Source
len : Period
Returns: Corrective Moving average (CMA)
edma(src, len)
Exponentially Deviating Moving Average (MZ EDMA)
Parameters:
src : Source
len : Period
Returns: Exponentially Deviating Moving Average (MZ EDMA)
rema(src, len)
Range EMA (REMA)
Parameters:
src : Source
len : Period
Returns: Range EMA (REMA)
sw_ma(src, len)
Sine-Weighted Moving Average (SW-MA)
Parameters:
src : Source
len : Period
Returns: Sine-Weighted Moving Average (SW-MA)
mama(src, len)
MAMA - MESA Adaptive Moving Average
Parameters:
src : Source
len : Period
Returns: MESA Adaptive Moving Average (MAMA)
fama(src, len)
FAMA - Following Adaptive Moving Average
Parameters:
src : Source
len : Period
Returns: Following Adaptive Moving Average (FAMA)
hkama(src, len)
HKAMA - Hilbert based Kaufman's Adaptive Moving Average
Parameters:
src : Source
len : Period
Returns: Hilbert based Kaufman's Adaptive Moving Average (HKAMA)
getMovingAverage(type, src, len, lsmaOffset, inputAlmaOffset, inputAlmaSigma, FC, SC, a1_t3, fixedTfInput, daysInput, hoursInput, minsInput, minBarsInput, lambda, volumeWeighted, gamma_aarma, smooth, linweight, volatility_lookback, jurik_phase, jurik_power)
Abstract proxy function that invokes the calculation of a moving average according to type
Parameters:
type : (string) Type of moving average
src : (float) Source of series (close, high, low, etc.)
len : (int) Period of loopback to calculate the average
lsmaOffset : (int) Offset for Least Squares MA
inputAlmaOffset : (float) Offset for ALMA
inputAlmaSigma : (float) Sigma for ALMA
FC : (int) Lower Shift Limit for Ehlrs Modified Fractal Adaptive Moving Average
SC : (int) Upper Shift Limit for Ehlrs Modified Fractal Adaptive Moving Average
a1_t3 : (float) Tillson T3 Volume Factor
fixedTfInput : (bool) Use a fixed time period in Rolling VWAP
daysInput : (int) Days in Rolling VWAP
hoursInput : (int) Hours in Rolling VWAP
minsInput : (int) Minutrs in Rolling VWAP
minBarsInput : (int) Bars in Rolling VWAP
lambda : (float) Regularization Constant in Regularized EMA
volumeWeighted : (bool) Apply volume weighted calculation in selected moving average
gamma_aarma : (float) Gamma for Adaptive Autonomous Recursive Moving Average
smooth : (float) Smooth for Adaptive Least Squares
linweight : (float) Weight for Volume Weighted Moving Average
volatility_lookback : (int) Loopback for Volatility Adjusted Moving Average
jurik_phase : (int) Phase for Jurik Moving Average
jurik_power : (int) Power for Jurik Moving Average
Returns: (float) Moving average
TALibrary "TA"
General technical analysis functions
div_bull(pS, iS, cp_length_after, cp_length_before, pivot_length, lookback, no_broken, pW, iW, hidW, regW)
Test for bullish divergence
Parameters:
pS : Price series (float)
iS : Indicator series (float)
cp_length_after : Bars after current (divergent) pivot low to be considered a valid pivot (optional int)
cp_length_before : Bars before current (divergent) pivot low to be considered a valid pivot (optional int)
pivot_length : Bars before and after prior pivot low to be considered valid pivot (optional int)
lookback : Bars back to search for prior pivot low (optional int)
no_broken : Flag to only consider divergence valid if the pivot-to-pivot trendline is unbroken (optional bool)
pW : Weight of change in price, used in degree of divergence calculation (optional float)
iW : Weight of change in indicator, used in degree of divergence calculation (optional float)
hidW : Weight of hidden divergence, used in degree of divergence calculation (optional float)
regW : Weight of regular divergence, used in degree of divergence calculation (optional float)
Returns:
flag = true if divergence exists (bool)
degree = degree (strength) of divergence (float)
type = 1 = regular, 2 = hidden (int)
lx1 = x coordinate 1 (int)
ly1 = y coordinate 1 (float)
lx2 = x coordinate 2 (int)
ly2 = y coordinate 2 (float)
div_bear(pS, iS, cp_length_after, cp_length_before, pivot_length, lookback, no_broken, pW, iW, hidW, regW)
Test for bearish divergence
Parameters:
pS : Price series (float)
iS : Indicator series (float)
cp_length_after : Bars after current (divergent) pivot high to be considered a valid pivot (optional int)
cp_length_before : Bars before current (divergent) pivot highto be considered a valid pivot (optional int)
pivot_length : Bars before and after prior pivot high to be considered valid pivot (optional int)
lookback : Bars back to search for prior pivot high (optional int)
no_broken : Flag to only consider divergence valid if the pivot-to-pivot trendline is unbroken (optional bool)
pW : Weight of change in price, used in degree of divergence calculation (optional float)
iW : Weight of change in indicator, used in degree of divergence calculation (optional float)
hidW : Weight of hidden divergence, used in degree of divergence calculation (optional float)
regW : Weight of regular divergence, used in degree of divergence calculation (optional float)
Returns:
flag = true if divergence exists (bool)
degree = degree (strength) of divergence (float)
type = 1 = regular, 2 = hidden (int)
lx1 = x coordinate 1 (int)
ly1 = y coordinate 1 (float)
lx2 = x coordinate 2 (int)
ly2 = y coordinate 2 (float)
