dize Automatic Support and ResistanceHi Trader,
the "Automatic Support and Resistance" indicator is one part of our holistic approach to identifying trading setups. It is one of many indcators of our dize indicator package and should always be used in conjunction with the other dize indicators.
💡 What is the Automatic Support and Resistance indicator?
The "Support and Resistance" indicator calculates support and resistance zones based on our proprietary algorithm. It is a "Price Action" indicator where the market behavior is decisive. You can choose between 5 modes for the calculation of the respective zones - swing, volume point-of-control, price point-of-control, closing or average prices. Each mode builds a unique underlying dataset to calculate the support and resistance levels.
Note: The support and resistance level will be recalculated on each candle to keep them accurate. It can therefore repaint those levels or print new levels as time progresses. That is an intended feature.
💡 How to use it?
Looking at the settings, the "Depth" and "Resolution" parameter come into play, when you use the "Volume POC" or the "Price POC" mode. Please be aware, that the resolution should always be smaller than the selected timeframe displayed on your chart. The Depth parameter determines how precise the calculation for the volume POC and price POC levels will be. A higher number means smaller cluster and therefore more precise values.
The "Number of data points"-parameter can be used to specify how far the indicator should look into the history for calculating the zones. While the "Mode" decides how the underlaying dataset will be interpreted. Our calculation method is unique and therefore so powerful. Due to a continuous calculation, the indicator always shows the zones accurately, so that the zones have a great significance.
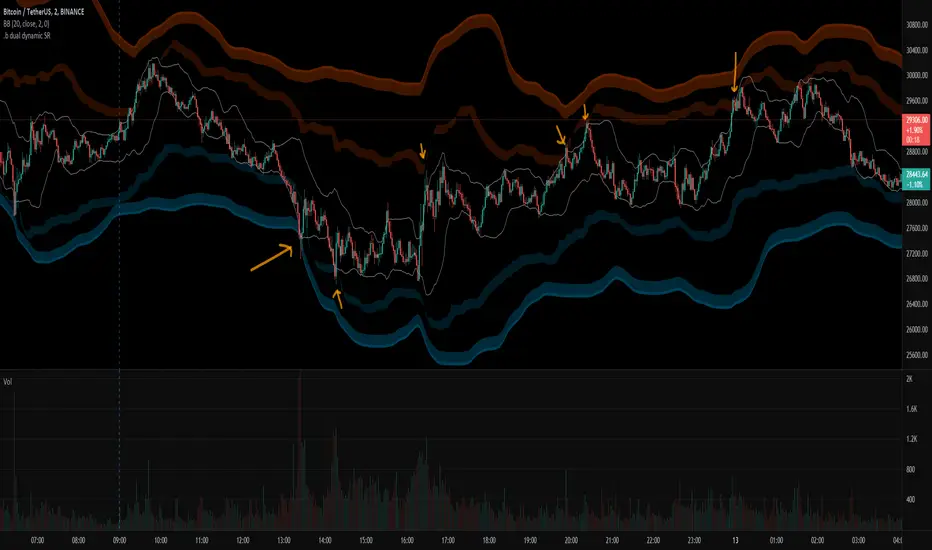
In addition to the settings for the calculation, there are also settings that affect the visualization. The display can be changed using the "Show Level" checkbox, switching between the "Level"- and the "Box"-mode. Based on the positioning of the closing price to the respective support or resistance zone, the indicator colors the zone using the colors specified in the settings.
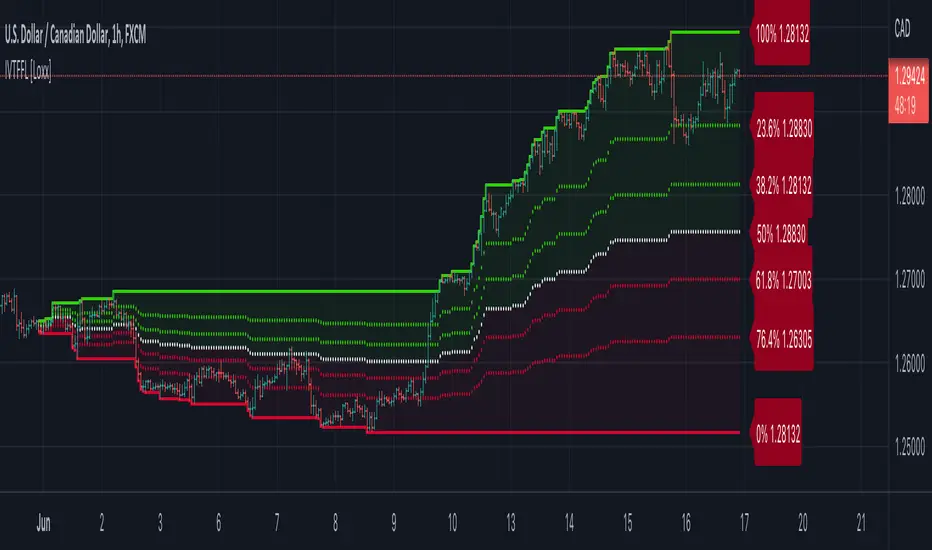
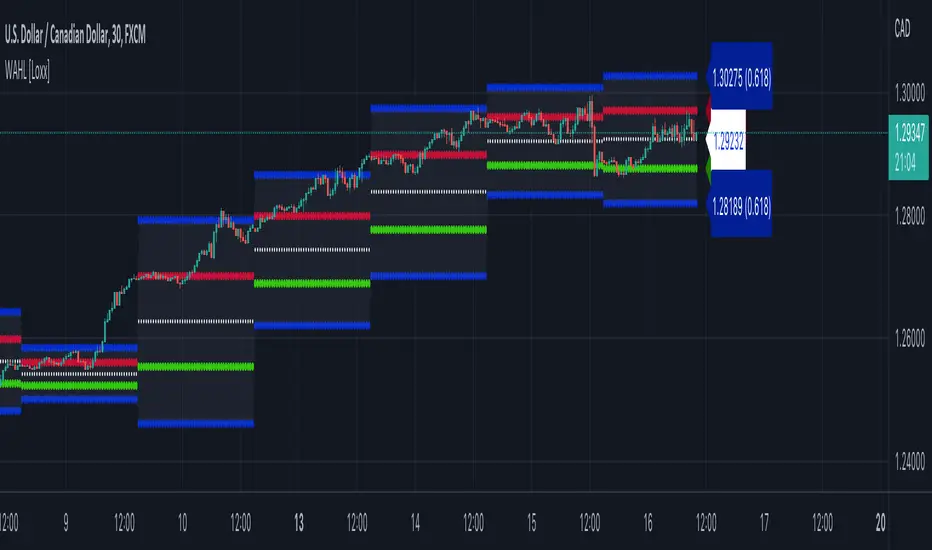
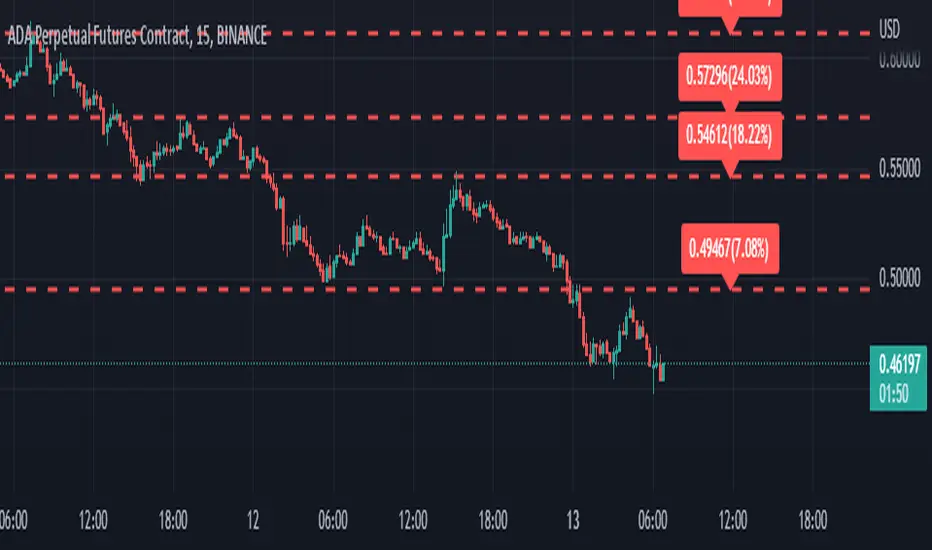
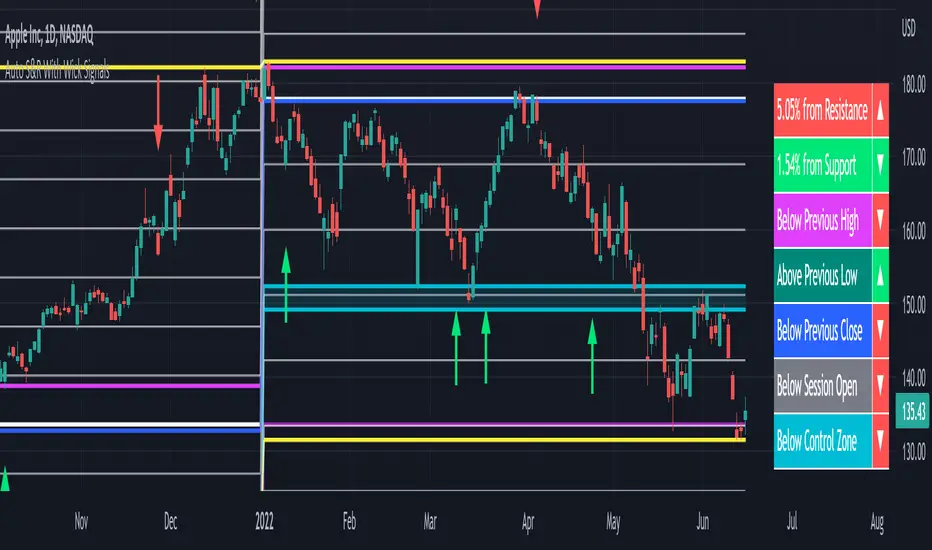
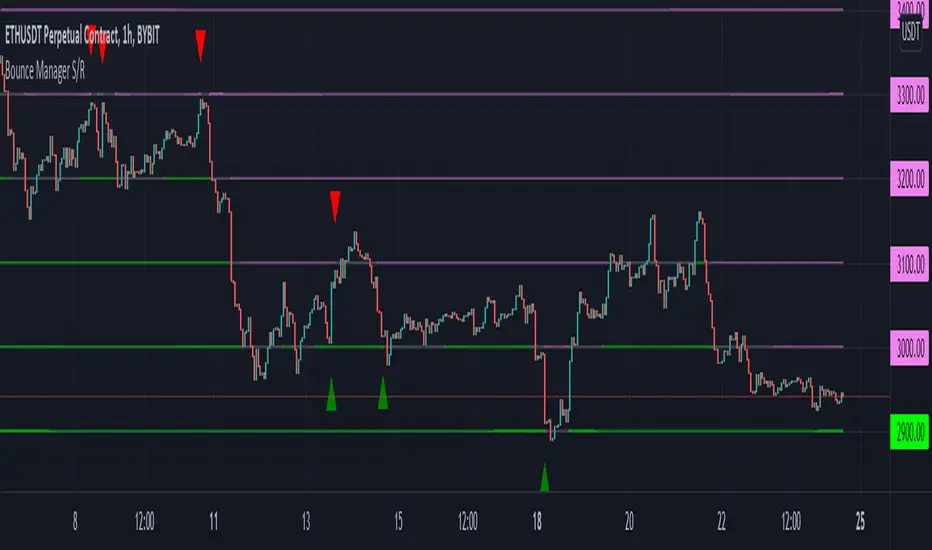
Let's have a look how we can use the Suport and Resistance indicator to our advantage:
As you can see the price hit the displayed support and resistance level multiple times. The above example is one of many use cases for the power index indicator.
🔓 To gain access to this indicator, please read the signature field.
Pine Script® Indikator