Stochastic RSI HeatmapStochastic RSI presented as a heatmap starting from the oversold (20) / overbought (80) levels respectively. The more oversold / overbought the price, the more intense the color (blue / fuchsia).
Stohastic

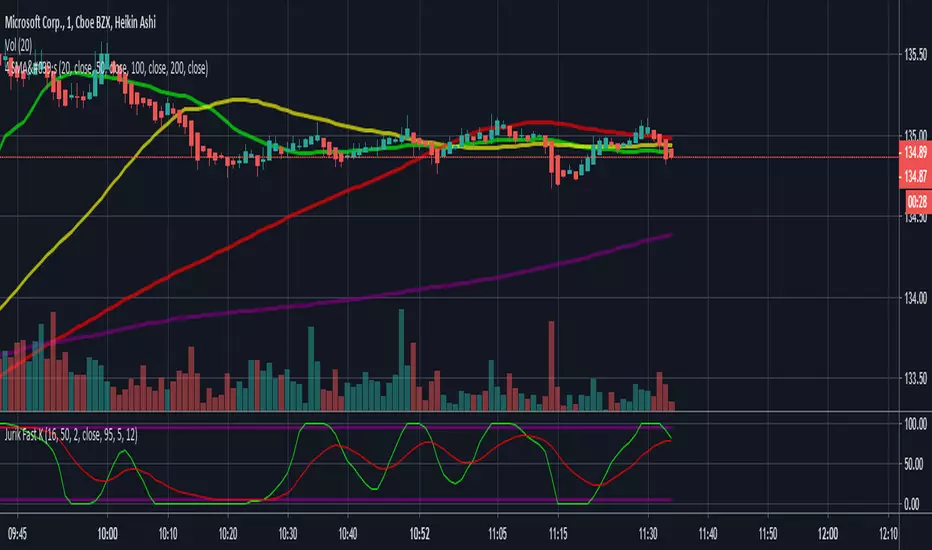
Jurik Fast K copyPretty good copy of the Jurik Fast-K indicator. The phase and power shouldn't really need to be messed with but you can play with the lengths. Jurik's default is 24 and 16 but I prefer the 16 and 12 that I coded into it on here. Enjoy!
3 Oscillator (RSI + Stochastics + MFI) with over bought/soldThis is a combined oscillator indicator which includes:
Relative Strength Index ( RSI )
Money Flow Index ( MFI )
Stochastic or StochasticRSI
In addition there are some advanced features including:
Custom time frame (Have the indicator running 5 minute candles while on a 1 hour chart)
Highlight Overbought/Oversold (The intensity of highlight changes when it is 5% below the threshold to 5% above the threshold)
Moving average trend for highlights (This will prevent the threshold-5 highlight from showing in a uptrend to reduce false signals)
It is important to know that the highlight feature is not designed as a buy/sell signal, it is only there as and oversold/overbought indicator to suggest when a trend change may be approaching.
The highlights are dependent on all three oscillators being above or below their thresholds respectively, this is to provide confluence that the market is indeed oversold and not just a single indicator.
