Naked Put - Growth IndicatorDISCLAIMER: Do NOT follow this strategy unless you are aware of the risks of selling naked options.
1) I have identified 20 companies with 30%+ YoY revenue growth (using the most recent quarter) and minimum "average trading volume": ZEN, TEAM, BABA, SHOP, RNG, SPLK, NFLX, FB, WIX, SQ, MULE, WDAY, MU, HUBS, ABT, LOGM, NEWR, NVDA, MELI, AMZN, NOW. I like companies that fit this criteria because 30%+ revenue growth means their revenue double every ~2.5 year and their "market cap" is based on their revenue.
2) When you see a green "$" icon above a candle on a DAILY chart, that means it's a good time to "sell naked puts" using the solid green line as the approximate "strike price". I prefer 3-9 months until expiration and "stagger" my expirations so it's not possible for everything to be put to me all at once.
3) I use a "minimum premium" and "max contracts" that I sell that suits my risk tolerance, you will need to calculate your own contract size based on your risk tolerance.
*NOTE: This only works on a DAILY chart, and only works on the companies identified above -- if you are using intraday, weekly or monthly, the "$" signs do NOT appear.
RISK NOTE: I do NOT sell any naked puts unless I am 100% ready to own the shares AND have enough capital in my account if they are put to me, you should do the same. Don't follow this strategy unless you are prepared to OWN shares at expiration.
Aktien

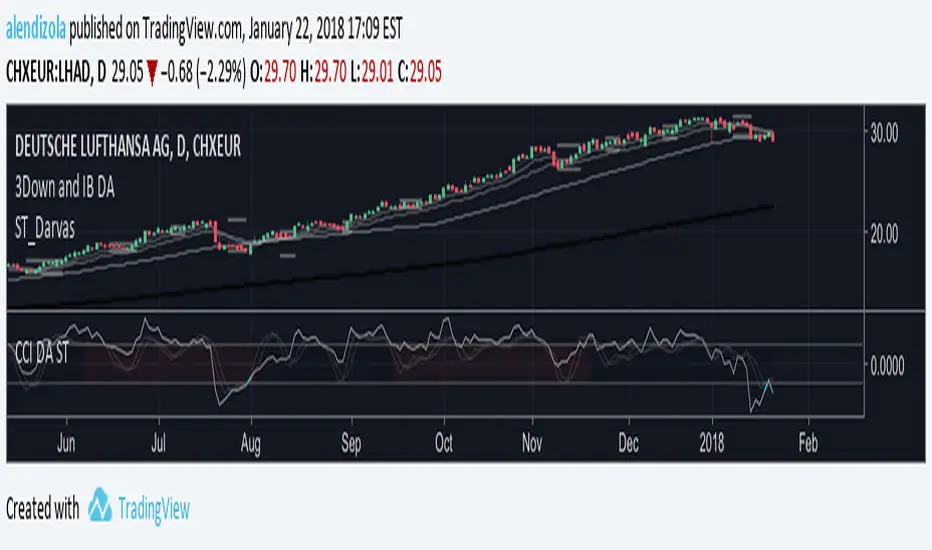
Three Bars Down and Inside Bar v2Updated Version of my Script. Script includes a Filter for stocks that are down three days in a row. Also it checks for oversold rsi and inside bars. Works best daily with stocks.

3Down and IB DAScript provides Multiple MAs and checks for 3 Bars down in a row. On top it displays inside Bars. Works best on a daily timeframe with stocks.

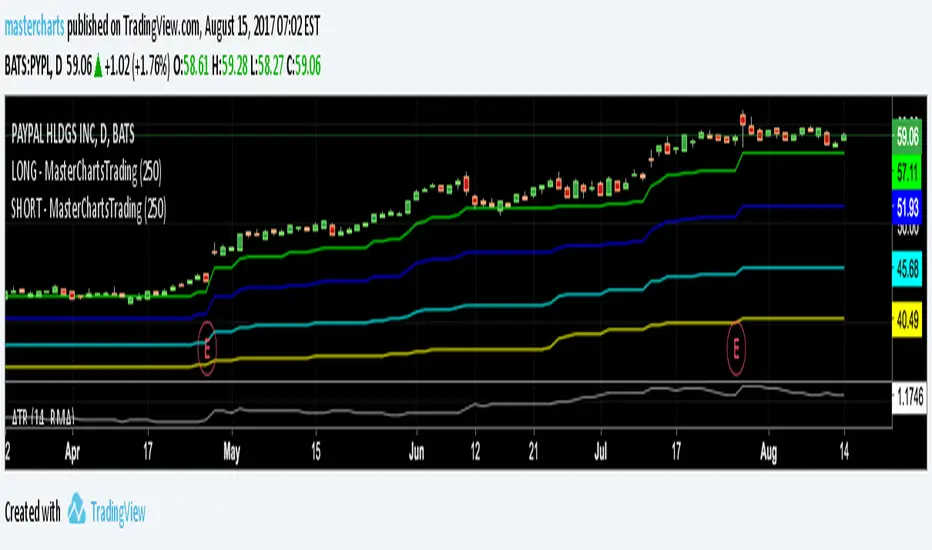
Current Trend Indicator-Visually See The TrendThe Current Trend Indicator compliments the TradeSpec indicator to visually see the trend direction of the symbol based on the gray trend line. It can be placed above, on, or below the main chart.
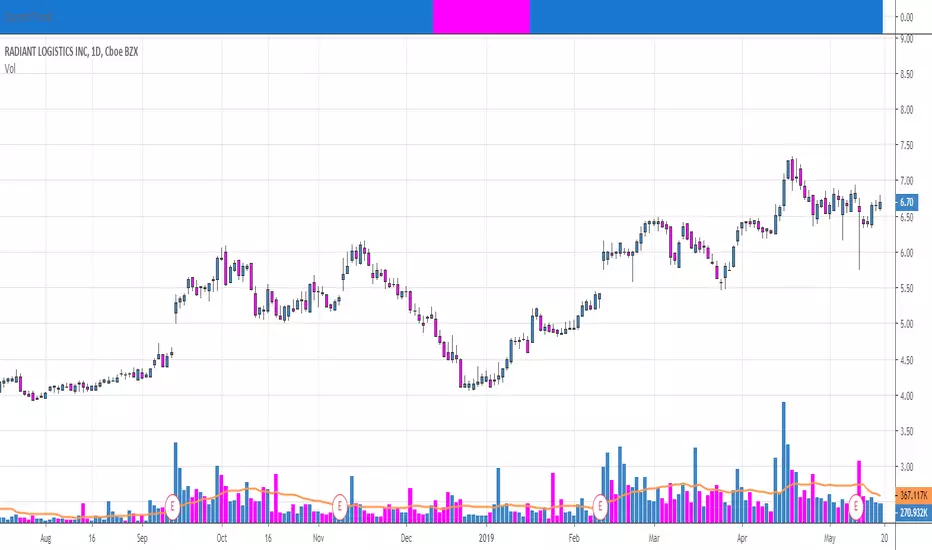
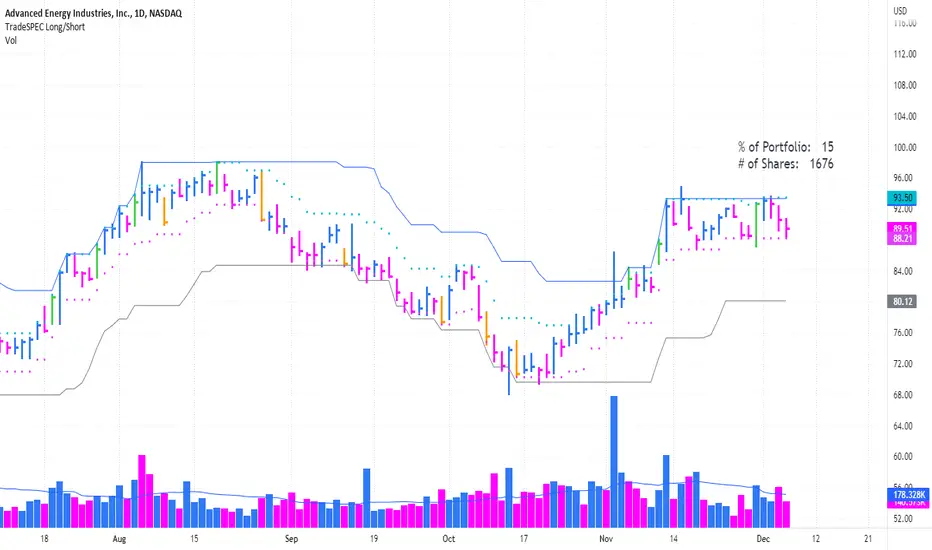
TradeSpec-Designed for Crypto, Stocks, Currencies and Futures TradeSpec- Overview
1. Main Trend (gray line) lets you see your trailing stop as the the trend progresses and provide a definitive point to know where to execute your sell and lock in your profits. Also, you have the ability to adjust the indicator value based on your trading time frame and objective.
2. Initial stop value (pink dotted line) can be used to determine position size.
3. Specific price bars ( yellow or green) are highlighted to show potential starting points for new or continued trends.
4. Price Alerts Indicator (orange or green crosses above price) looks to highlight areas of importance during a trend. Become aware when the trend could be ready to plateau for a while or when a top could be forming. The alert markers can be used to tighten your trailing stop, remove a portion of the trade, or be used as an indication to remove the position entirely.
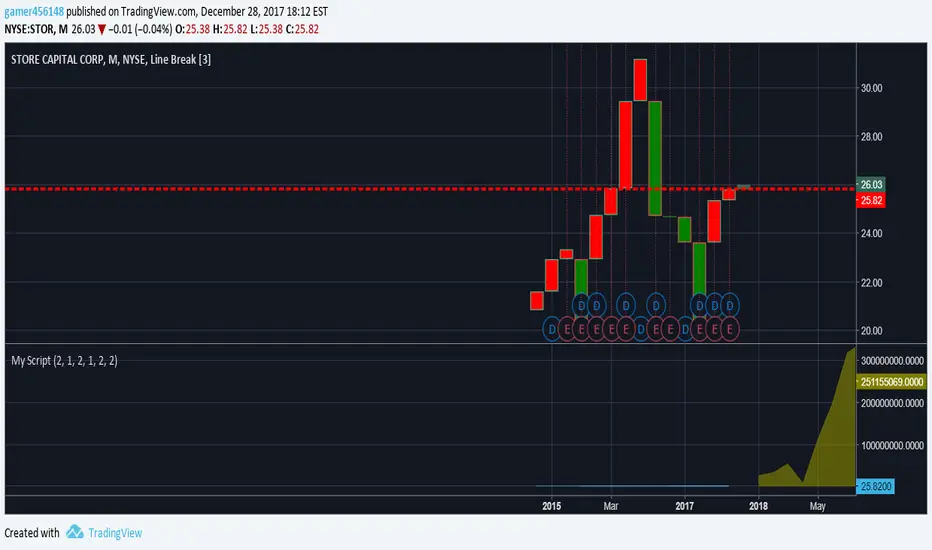
Stock Analysis IndicatorThis is a script for a line break study that includes my Accumulation/Distribution views, and utilizes the Alice study from Benjamin Lupton's repo. Also included is an SWMA moving average strategy, set bar resistance and color options. This is best utilized for predicting the rise of stocks post market as well as chart views for predictive analysis. This is one of the things I am building as a newbie to pinescript, so still improvements to be made. Use this indicator as an extension to your own strategy or custom chart views.
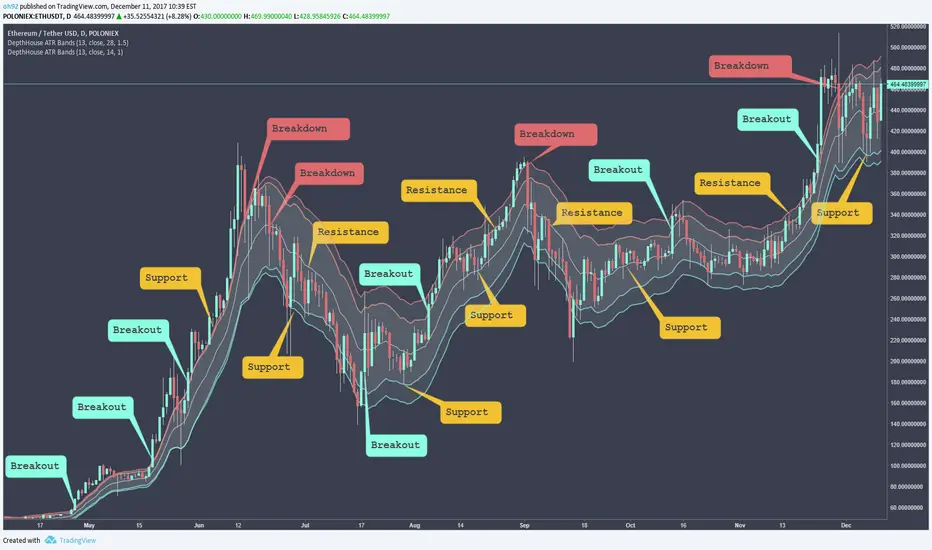
DepthHouse - ATR BandsDepthHouse ATR Bands is a FREE INDICATOR
Similar to the well-known Bollinger Bands.
Instead of using the standard deviation formula, ATR Bands determines the size of the bands based on the adjustable average range.
IF you use this FREE Indicator:
Please like and comment!
Check out my channel on YouTube! youtu.be
Bitcoin and Ethereum Donations are always appreciated :)
BTC : 1MLnVPqebcFTqYEVAKm9dSCRWhyNDmAb5W
ETH : 0xEEcD7Ce6E22AfA6083074c4CCd326Be0b1C932d9
How to use:
The bands tighten while the markets’ range becomes lower, and widens as its' range becomes broader. Giving the indicator a loaded spring effect.
A break outside of the bands in either direction indicates a possible breakout.
All 3 bands serve as possible support and/or resistance. Meaning breaks back into the bands could indicate a reversal, or end of the breakout.
This indicator is completely customizable, so compiling multiple sized bands on top of each other may create a strong competitive edge.
--
IF YOU SUBSCRIBED
This indicator was intended to be available for purchase Jan 2018.
However, with recent change of mind I have decided to make it free to use.
IF you previously subscribed. I greatly appreciate your interest and I hope you enjoy this now FREE indicator!
Once again, thank you!
Technology-Adjusted Parabolic Stop and Reverse (TAPSAR)Finally, a more accurate PSAR is here!
Request access in the comments.
This PSAR will show up, and stick around when a majority of the Technology companies in the index below conform in the same direction.
The TAPSAR can be applied to any technology company and ANY time-frame!
This Tech-Index consists of the largest technology companies on the NASDAQ stock exchange that are similar in subsector.
1. Apple Inc (NASDAQ:AAPL)
Market Cap: $888.06B
Subsector: Computer Manufacturing
2. Alphabet Inc (NASDAQ:GOOGL)
Market Cap: $738.53B
Subsector: Computer Software: Programming, Data Processing
3. Microsoft Corporation (NASDAQ:MSFT)
Market Cap: $654.81B
Subsector: Computer Software: Prepackaged Software
4. Facebook Inc (NASDAQ:FB)
Market Cap: $529.9B
Subsector: Computer Software: Programming, Data Processing
5. Oracle Corporation (NASDAQ:ORCL)
Market Cap: $204.54B
Subsector: Computer Software: Prepackaged Software
6. International Business Machines Corporation (NASDAQ:IBM)
Market Cap: $141.16B
Subsector: Computer Manufacturing
Thick Blue lines beneath the price indicate a change in direction, and momentum up.
Thick Red lines above the price indicate a change in direction, and momentum down.
UPDATE: The lines will become thicker with confidence of movement.
This indicators holds three editable parameters:
1. "Start" - The starting value for the Acceleration Factor (.02 is the Default).
2. "Increment" = The increment in which the Acceleration Factor will move (.02 is Default).
3. "Max" - The maximum value of the Acceleration Factor (.20 is the Default)

Technology-Adjusted Parabolic Stop and Reverse (TAPSAR)Finally, a more accurate PSAR is here!
Request access in the comments.
This PSAR will show up , and stick around when a majority of the Technology companies in the index below conform in the same direction.
The TAPSAR can be applied to any technology company and ANY time-frame!
This Tech-Index consists of the largest technology companies on the NASDAQ stock exchange that are similar in subsector.
1. Apple Inc (NASDAQ:AAPL)
Market Cap: $888.06B
Subsector: Computer Manufacturing
2. Alphabet Inc (NASDAQ:GOOGL)
Market Cap: $738.53B
Subsector: Computer Software: Programming, Data Processing
3. Microsoft Corporation (NASDAQ:MSFT)
Market Cap: $654.81B
Subsector: Computer Software: Prepackaged Software
4. Facebook Inc (NASDAQ:FB)
Market Cap: $529.9B
Subsector: Computer Software: Programming, Data Processing
5. Oracle Corporation (NASDAQ:ORCL)
Market Cap: $204.54B
Subsector: Computer Software: Prepackaged Software
6. International Business Machines Corporation (NASDAQ:IBM)
Market Cap: $141.16B
Subsector: Computer Manufacturing
Thick Blue lines beneath the price indicate a change in direction, and momentum up.
Thick Red lines above the price indicate a change in direction, and momentum down.
This indicators holds three editable parameters:
1. "Start" - The starting value for the Acceleration Factor (.02 is the Default).
2. "Increment" = The increment in which the Acceleration Factor will move (.02 is Default).
3. "Max" - The maximum value of the Acceleration Factor (.20 is the Default)

Block TransactionThis script will allow you to view block transactions as they occur on ANY time frame, and ANY instrument!
Now you can visualise in real-time exactly where the big money goes in and how much.
The smaller transactions are shown by smaller blocks, and the larger transactions are shown by bigger blocks. It is as simple as that!
If the block transaction is larger than $US5 million the block be red, and if the transaction is larger than $US10 million, the block be black.
This indicator will identify block transactions within the range of 100k - 1 bn. If a block transaction larger than or the equivalent of $US1 bn is to occur, the block will be orange.
Large institutions invest in many different markets and sectors in various ways and so it is difficult to find trading strategies that always work. This indicator was designed to encompass an, "If you can't beat them, join them" and "follow the money" approach to trading.
There will be more developments in the near future.
Like and comment for access to the script. I may be offline so it may take up to 12 hours for your access to be granted.
Kind Regards.

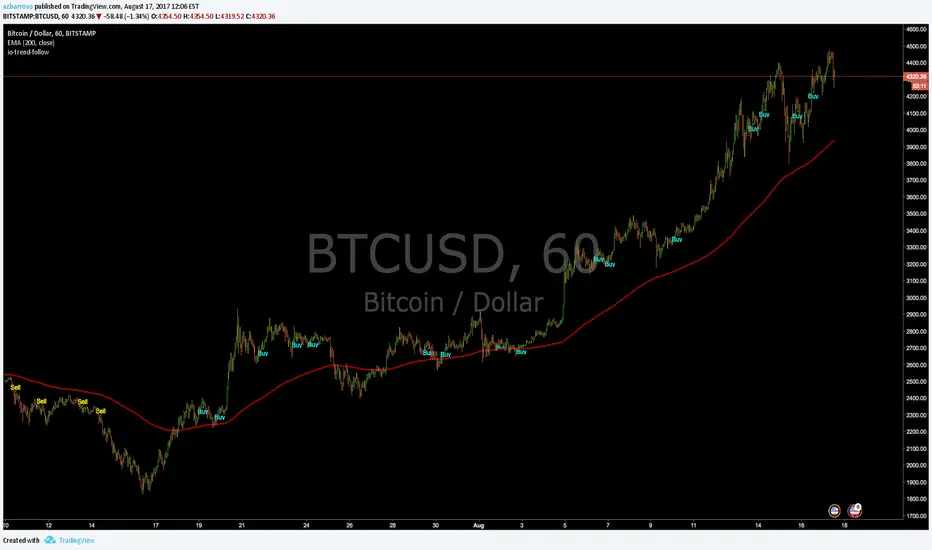
io-trend-follow (1.5)Trend Follow script to be used across all market instruments and timeframes.
You can display long only, short only or both signals.
version 1.5 -> Filter by EMA 200 option added
version 1.4 -> Alerts added
version 1.2 -> Only one signal per trend (default) or multiple entry signals per trend
version 1.1 -> White theme option added
io-counter-trend (1.5)Counter Trend script to be used across all market instruments and timeframes.
You can display long only, short only or both signals.
version 1.5 -> Filter by EMA 200 option added
version 1.4 -> Alerts added
version 1.1 -> White theme option added


SMART4TRADER-UP-DOWN Stock Exchange Volume (SPY)Shows the trend direction for the S&P500
Показывает направление тренда для S&P500

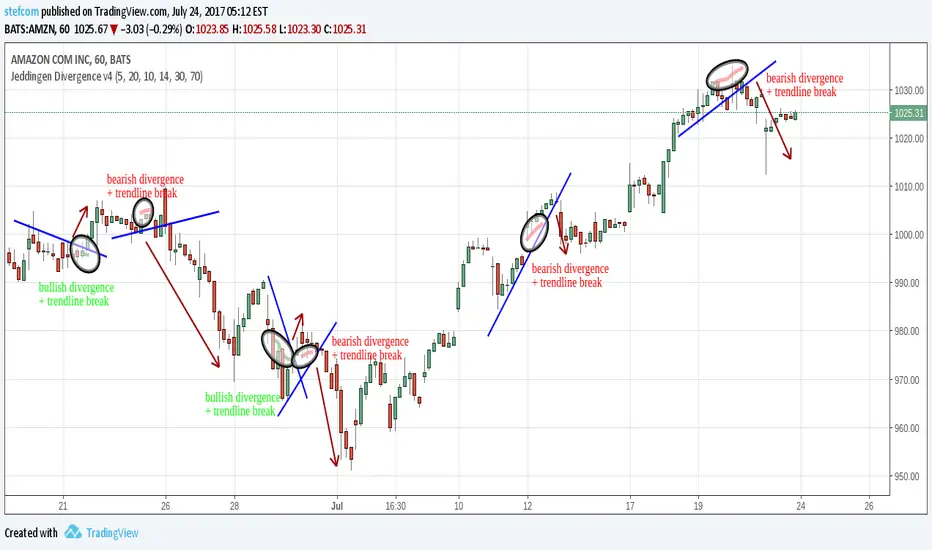
Jeddingen Divergence v4Momentum vs. price divergence. Sell signals on bearish divergence, buy signals on bullish divergence .
Indicator includes an RSI filter, alert-conditions and lots of other configuration options.
There is also a TradingView strategy available to backtest everything!
Lazy Strength v2Enhancement on the Lazy Strength Indicator
1. Diamond at the bottom shows the trends
RED: Downtrend
BLUE: Uptrend
2. Arrows at the top show the Buy/Sell signals
BLUE: BUY
RED: SELL
Wait for the Diamond and Arrows to be aligned.
RED diamond + RED Arrow = SELL at the next candle open
BLUE arrow + BLUE Arrow = Buy at the next candle open
This indicator works on the tradingview Apple app

Kovach ReversalsWith the Kovach Reversals indicator, we automate the process of scanning for technical candlestick reversal patterns. A bearish reversal is shown by a red triangle above the high of the most recent candlestick in the pattern, a green triangle indicates a bullish reversal. To mitigate false positives, we filter for the reversal patterns at the extrema of the price range, where a reversal is highly likely to occur. While many indicators are susceptible to time lag, the reversals are drawn instantaneously as the bar forms, giving you the ability to get in on a trade as the setup develops.
This indicator works best with the Kovach Momentum, Kovach Chande, or Kovach OBV indicators, where we can leverage the strengths of both to increase our probability of success.

Multiple MA Cross for Forex, Commodity and StocksTrade using Multiple Moving Averages
Works well on most Forex, Commodity and Stocks.
Backtest Results :
80% signal accuracy on
OANDA:EURUSD
OANDA:GBPJPY
OANDA:BCOUSD
77% signal accuracy on
OANDA:XAGUSD
OANDA:XAUUSD

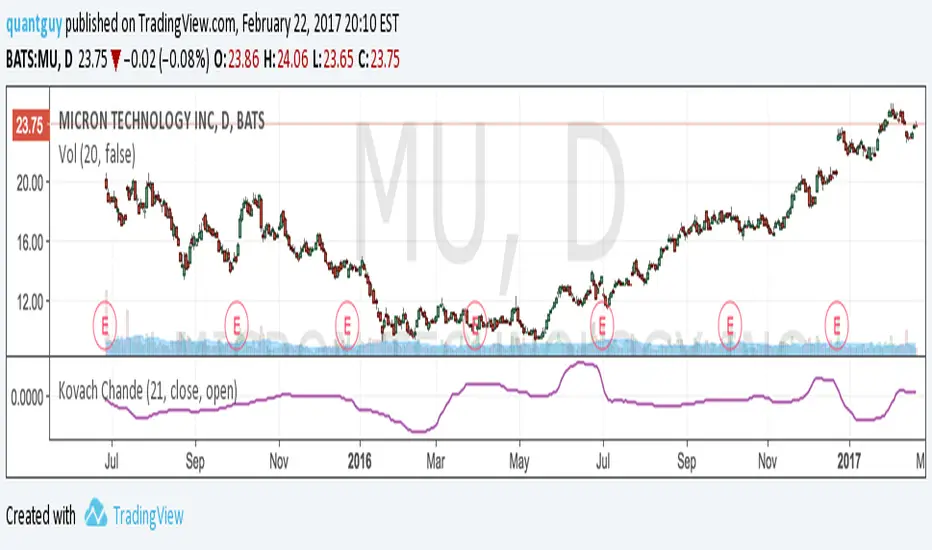
Kovach ChandeThe Kovach Chande indicator measures instantaneous buying pressure. It features advanced signal processing algorithms to minimize lag and filter the effects of volatility. Consider using it with the Kovach OBV indicator and Kovach Momentum indicator. When used with the Kovach OBV, divergences may be used to isolate entry points.
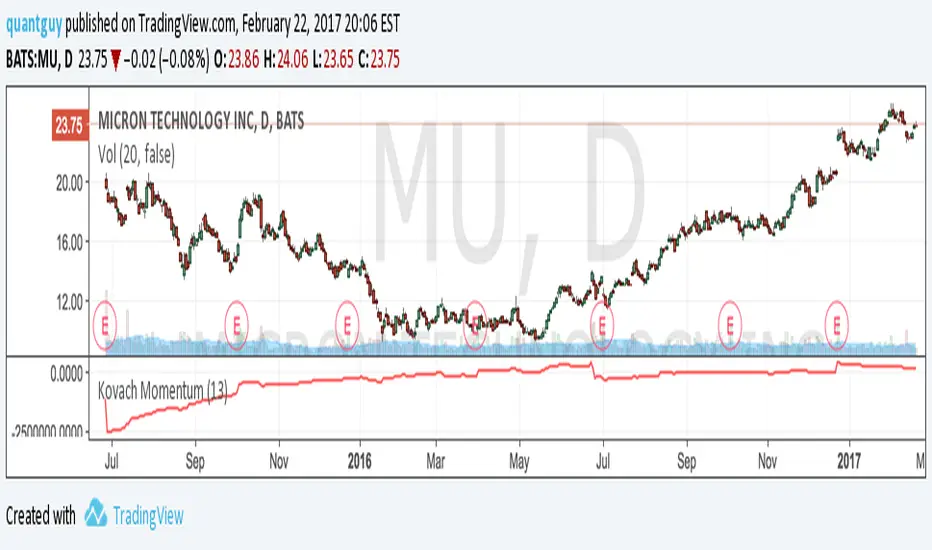
Kovach MomentumThe Kovach Momentum indicator averages instantaneous momentum, while employing advanced signal processing algorithms to minimize lag and filter the effects of volatility. Consider using it with the Kovach Chande indicator and Kovach OBV indicator.
Kovach OBVThe Kovach OBV measures sustained buying pressure. It features advanced signal processing algorithms to minimize lag and filter the effects of volatility. Consider using it with the Kovach Chande indicator and Kovach Momentum indicator.
