High Low Index SPY Top 40Modification from original code for "High Low Index" by © LonesomeTheBlue
- Made modification specifically for Top 40 AMEX:SPY holdings
- Added Market sentiment histogram (Total count green vs red), and SMA line for it
- Added arrows for peaks and dips on High Low Index and Market Sentiment MA
Idea behind this indicator is that SPY should follow the overall sentiment of its top holdings. I believe this bring great value to SPY traders.
Enjoy~!
SPDR S&P 500 ETF (SPY)

JPM VIX Signal - Non OverlayJPMorgan Chase & Co . strategists have identified what they say is a near bulletproof indicator to strengthen their argument that stock markets are poised to rally.
The buy signal is triggered when the Cboe Volatility Index ( VIX ) rises by more than 50% of its 1-month (30 day) moving average, which it last did on January 25th 2022, according to the strategists led by Mislav Matejka. The indicator has proven 100% accurate outside of recessions over the last three decades.
Instructions:
Symbol - SPY
Timeframe - Daily
Signal - Indicator exceeds horizontal line of 1.5

3 Candle Strike StretegyMainly developed for AMEX:SPY trading on 1 min chart. But feel free to try on other tickers.
Basic idea of this strategy is to look for 3 candle reversal pattern within trending market structure. The 3 candle reversal pattern consist of 3 consecutive bullish or bearish candles,
followed by an engulfing candle in the opposite direction. This pattern usually signals a reversal of short term trend. This strategy also uses multiple moving averages to filter long or short
entries. ie. if the 21 smoothed moving average is above the 50, only look for long (bullish) entries, and vise versa. There is option change these moving average periods to suit your needs.
I also choose to use Linear Regression to determine whether the market is ranging or trending. It seems the 3 candle pattern is more successful under trending market. Hence I use it as a filter.
There is also an option to combine this strategy with moving average crossovers. The idea is to look for 3 candle pattern right after a fast moving average crosses over a slow moving average.
By default , 21 and 50 smoothed moving averages are used. This gives additional entry opportunities and also provides better results.
This strategy aims for 1:3 risk to reward ratio. Stop losses are calculated using the closest low or high values for long or short entries, respectively, with an offset using a percentage of
the daily ATR value. This allows some price fluctuation without being stopped out prematurely. Price target is calculated by multiplying the difference between the entry price and the stop loss
by a factor of 3. When price target is reach, this strategy will set stop loss at the price target and wait for exit condition to maximize potential profit.
This strategy will exit an order if an opposing 3 candle pattern is detected, this could happen before stop loss or price target is reached, and may also happen after price target is reached.
*Note that this strategy is designed for same day SPY option scalping. I haven't determined an easy way to calculate the # of contracts to represent the equivalent option values. Plus the option
prices varies greatly depending on which strike and expiry that may suits your trading style. Therefore, please be mindful of the net profit shown. By default, each entry is approximately equal
to buying 10 of same day or 1 day expiry call or puts at strike $1 - $2 OTM. This strategy will close all open trades at 3:45pm EST on Mon, Wed, and Fri.
**Note that this strategy also takes into account of extended market data.
***Note pyramiding is set to 2 by default, so it allows for multiple entries on the way towards price target.
Remember that market conditions are always changing. This strategy was only able to be back-tested using 1 month of data. This strategy may not work the next month. Please keep that in mind.
Also, I take no credit for any of the indicators used as part of this strategy.
Enjoy~

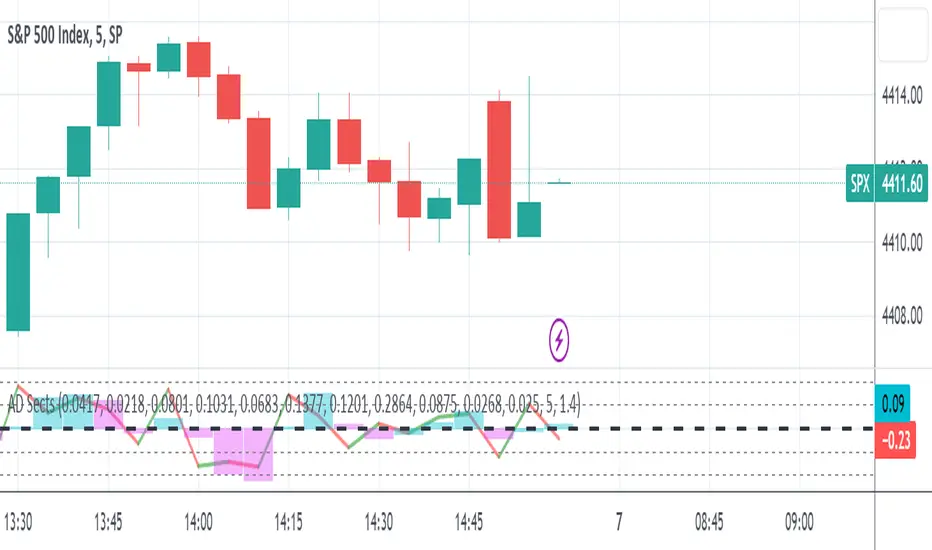
S&P Sector Advance/Decline Weighted -Tom1traderEnjoy, enhance your trading (I hope), copy or adapt to your needs and keep smiling!
Thanks to @MartinShkreli. The sector variables and the "repaint" option (approx lines 20 through 32 of this script) are used directly from your script "Sectors"
RECOMMENDATION: Update the sector weightings -inputs are provided. They change as often as monthly and the
annual changes are certainly significant. When updating weighting percentages use the decimal value. I.E. 29% is .29
Good on any time frame. Especially SPY, SPX and ES scalpers and 0DTE options traders may like this a lot.
This gives good signals on S & P and related (ES, SPY) and indicates / plots differently than the AD line or ratio.
Each sector's entire % weight is added or subtracted depending of whether that sector advanced or declined.
Example: Information Tech weight at 29% so that % of 500 (145) is added if InfoTech is up a penny and subtracted if it is
down a penny. All sectors processed the same way so that for a given bar/candle the value will be between +500 (all
sectors up) and -500 (all sectors down). This weighted AD line of sectors is scaled to +/- 350 and plotted as a red/green line
along with aqua/fuchsia columns of its 5 period ema. The line is actual sector behavior and the columns seem to make a
good signal with column zero crosses standing out.
The columns aqua / fuchsia are a 5 period ema of the Sector AD line and give pretty good signals at
zero cross for SPX. I colored the AD red green line also to emphasize the times it opposes the ema
for example the histo/colums zero cross signal is NOT true when the AD line is showing all or most sectors
going the other way.
For readability, the AD line itself is scaled to 350. This lets the columns of the ema stand out better. The hlines at
350 and at 175 give an idea for the AD green red line how much of the sector's weight is up or down.
350 is all sectors up (advancing) and -350 is all sectors down (declining). The hlines at +/- 175 seem to outline
a more or less "neutral" zone. For example in an uptrend with most of the AD level positive and the columns positive;
a negative spike that does not pass the -175 line and returns positive does not seem to impact the price as much as
a deeper negative spike.
Litt Internals ProThe Litt Internal Pro is based on the four major U.S. Equity Indexes. This is to not be used for any other markets. If you need more information on any of the indexes, you can google or watch YouTube videos on what they are. Typically if we are looking for to be long we want to see all four of the indexes green and have buy ratings. If we are looking to be short we want to see all four of the indexes red and have sell ratings. If you see Overbought or Oversold ratings it may be best to wait for a pullback to get long or not take the trade at all.
For the stocks that you trade, you should know what index they are in. The reason for this is that you can still take trades if not all four indexes are aligned the same color. For example, maybe small caps (IWM) are on a hot streak and seeing buying momentum from institutions meanwhile tech (QQQ), is being sold. If you held a long in a company that is in IWM then you could be more comfortable holding your long position. Meanwhile, if you held a long position in a stock that is in QQQ then you might want to cut your loss or take profit. There are multiple different use cases for this indicator so it is best to look for outside resources on more information on the indexes and what stocks are in each index. This can be a very powerful tool to see sector rotation by hedge funds and institutions.

SPY Sub-Sector Daily Money Flow TableThis calculates the dollar volume per candlestick (2nd row) and cumulative (3rd row) of the entire trading day for each subsector of the SPY.
The 'Total' column is the total of all the subsectors combined. It is calculated separately from SPY volume.
The money flow is calculated with (open+close)/2 which means different timeframes yield different results and won't be especially accurate day-by-day. This is useful to quickly see rotation and possible divergences.
Enjoy!

Trend Volatility Tops and Bottoms
Big Picture:
Overall what this script try's to capture is bounces off of moving trend lines.
What you will see when using this script
one Green line, one red line, two gray lines and circles in colors blue, green, red, and purple.
RED AND GREEN LINES:
There are two trend lines, an upper and a lower line that are 1 to 2 standard deviations from the linear regression line formed by the closing price for a look back period. The green is the distance from the close price and the lower line. The red is the list from the close and the upper line. (you don't see the lower and upper lines, but yo do see the green and red lines)
The goal is too easily see when price is approaching those support and resistance levels.
GRAY LINES:
GRAY lines are a form of volatility metric. GRAYS represent the distance from the RED and GREEN lines talked about above. low volatility mean the two GRAY lines will be close and times of high volatility will be father apart.
COLORED CIRCLES:
the color circles represent possible bounce zones, when price is high or low for for a given time period.
PURPLE is caution that there could be a possible price drop
RED is a critical zone for rejection and price drop
BLUE is caution that there could be a possible price increase
GREEN is a critical zone for bounce and price increase
how its used
feel free to play around and Try new things but, how its intended to be used is on 4hr time Frame looking for longer term trends on assets that tend to be less volatile on average.
settings
some settings:
buy deviation, this will say how many standard deviations do you want the lower bounce line to be from the linear regression line
sell deviation, this will say how many standard deviations do you want the upper bounce line to be from the linear regression line
dist to zero buy: how close dose the price has to be to put out a possible bounce.
Recap
-red and purple = possible upcoming price drop... red is more critical than purple
-green and blue = possible upcoming price increase... green is more critical than blue
-use on less volatile assents and on 4hr timeframe
good luck!

Market Breadth EMAs V2Second version of Market Breadth EMAs for $SPY. Getting a little more complicated than V1 but removed noise.
Key:
Green line = % of stocks above their 20-period moving average, the "twitch line"
Red line = % of stocks above their 200-period moving average, the "long term trend"
White line = weighted average of the % of stocks above the 20/50/100/200 averages, the "general trend." Captures bursts that the 200 misses, and is more trustworthy than the 20.
Background colors = limits of the red/green/white where reversals have happened historically. The darker the color, the stronger the signal.
Histogram = the change in the white line over time, for different time periods: 1/4/10/20, the "trend strength/confidence." i.e. If the white line "General Trend" has been drifting lower for a month but started increasing the past 2 days, you might have 3 red histograms and 1 green one.
Techniques:
If the green, red, or white line is above 50%, then more than half the stocks are above that average. So, if they're in the top half, bullish market. Bottom half, bearish market.
If the green line is above the red, market has rising/bullish momentum. If red is above green, market has falling/bearish momentum.
If the white line is rising, bullish momentum. If it's falling, bearish momentum.
If the histograms are all green, there is strong momentum in that direction. The % of stocks above their important averages has been increasing each day for both the short term and long term.
If the histograms go from all green to a mix of green and red, be on the lookout for a reversal from one of the background levels. Usually initiates from the 20 (green line) first.
If price dips without the histogram changing, HODL.

Market Breadth EMAsThis is the combined market breadth tickers: S5TW, S5FI, S5OH, and S5TH representing the percentage of S&P 500 stocks above their 20, 50, 100, and 200 EMA respectively. The colors go from green (20) to red (200) because if 20 crosses above the 200, the market's bullish, and if the 20 crosses below the 200, the market is bearish. So if green is on top = bull market. If red is on top = bear market. In general the market sentiment is whichever color is highest up.
The background is colored in depending on a few historical extremes in the 200. The darker the color the more significant the buy/sell signal. These can be adjusted by changing the hline's in the code.

S&P Sector CorrelationScript for Macro:
This indicator shows the 9 day average of the correlation of the 11 S&P500 sectors with the security.
Recommend you use the indicator on SPX or SPY, but you can change the values to be compared.
GLHF
- DPT

Vix Jump for Selling Puts or Buying CallsThis script aims to identify optimal times when to write Puts for premium, for example using the SPX Weeklies model or simply buying Calls. Not perfect but provides some additional confidence when playing Puts on SPX or the Wheel on SPY.
What it does:
We compare current VIX with a lookback VIX for X% delta. If there is a jump of say 20% over a defined period then that would indicate an opportunity to sell Puts, run a straddle or buy Calls. We use VVIX as a check to stop to many false positives ie VVIX falls of faster than VIX.
You can also use this loosely as a bottom finder.

Momentum Rotation Indicator [CC]I have developed this custom indicator very loosely based on the Sector Rotation Model (Giorgos E. Siligardos. Technical Analysis of Stocks & Commodities, August 2012) and I called it the MRI because this is essentially a brain scan of any particular stock. This will not only tell you when a stock is breaking out over the market at large but also how the stock is doing compared to its own history. Buy when the line turns green and sell when the line turns red.
Let me know if there are any other indicators you would like to see me publish!
VIX Implied Move Bands for ES/Emini futuresThis script uses the close of the VIX on a daily resolution to provide the 'implied move' for the E-mini SP500 futures. While it can be applied to any equity index, it's crucial to know that the VIX is calculated using SPX options, and may not reflect the implied volatility of other indices. The user can adjust the length of the moving average used to calculate the bands, the window of days used to calculate the implied move, and the multiplier that effects the width of the bands.

Volatility Bands Reversal Strategy [Long Only]This strategy based on existng indicator available on TV
If finds the reversals for LONG entries ... I have modified the settings to back test it ...
BUY
====
When the price touches lower band , and tries to close above lower band
some signals are mixed up, you can research and look for a confirmation ...
if the middle band is above EMA50 , you can simply follow the strategy BUY signal
but if the middle band is EMA50 , wait for the price to close above middle band
Sell / Close
==========
wait for the sell signa OR close when price touches the upper band
How do you want to close , you can chose in settings. Chnage these values and see the performance
Please note , sell means just closing the existing LONG position , not short selling
Stop Loss
=========
Stop Loss is defaulted to 6%
This is tested in 1HR, 2HR and 4 HRs chart for SPY and QQQ ETFS ...
for long term investing style , 4 Hrs is the best time frme for this strategy
Warning
========
It is not a financial advise , it is for educational purposes only. Please do your own research before taking any trading decission
Yield CurveThis script tracks the U.S. 2Yr/10Yr Spread and uses inversions of the curve to predict recessions. Whenever a red arrow appear on the yield curve, expect a recession to begin within the next 2 years. Use this signal to either exit the market, or hedge current positions. Whenever a green arrow appears on the yield curve, expect a recession to have nearly ended. Use this signal to enter the market, or cut current hedges against a recession. (I may update this script in the future to better incorporate the effective federal funds rate into exit points, but for now I am satisfied with the results).

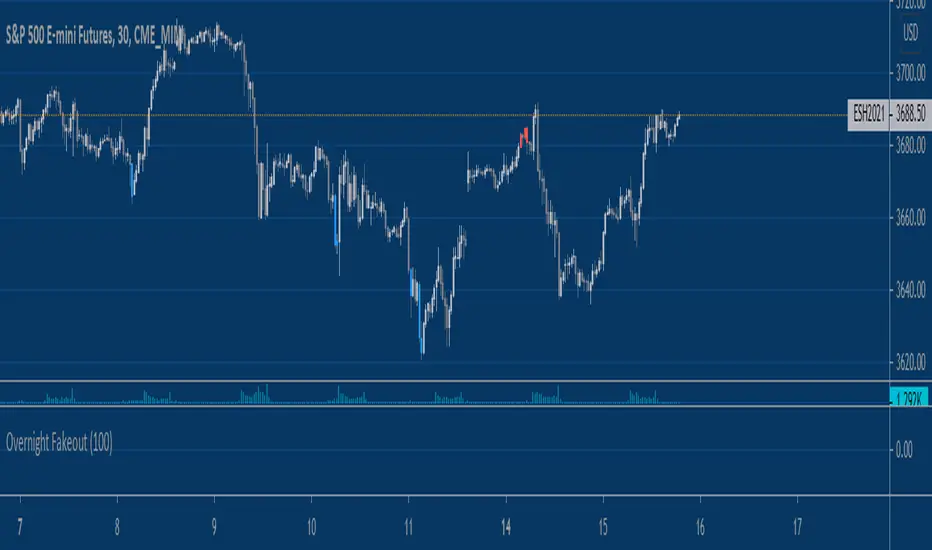
Equity Index Overnight FakeoutThis script highlights when price violates the highest high or lowest low within the user's selected lookback period, with the caveat that it occurs during the GLOBEX session. The script is designed to work exclusively with the trading hours for CME and CBOT Equity Index futures. I'm planning to make a more customizable version down the line.
My reasoning behind this very simple script is that the low liquidity and participation of the overnight session creates a tendency for moves at extremes to mean revert. Let me know what you think.
VIX Term StructureThis script allows users to visualize the state of the VIX Futures Term Structure. The user is able to select from five CBOE VIX Indices; VIX, VIX9D, VIX3M, VIX6M, and VIX1Y and the script will color the candles based on the price relationship between selected indices. Visit the CBOE website for more info on how the various VIX indices are calculated.

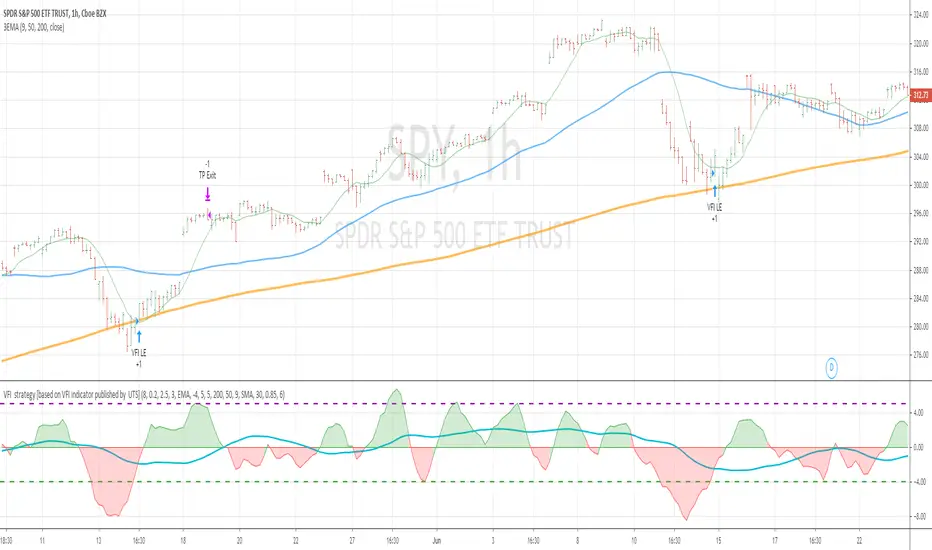
VFI strategy [based on VFI indicator published by UTS]This strategy is based on VFI indicator published by UTS.
for the strategy purpose , I have added buy line and sell line to the indicator and tested SPY stock/index on one hour chart
BUY RULE
==========
1. EMA 50 is above EMA 200
2. vfi line is pulled down and crossing above -4
EXIT RULE
==========
1. when vfi line crossing down 5
STOP LOSS
=========
1. default stop loss is set to 5%
ALL the above values (Buy Line , Sell line and Stop Loss ) can be modified in settings window
Notes :
more details of VFI indicator can be found at mkatsanos.com and precisiontradingsystems.com
Warning:
for educational purposes only
S&P Bear Warning IndicatorTHIS SCRIPT HAS BEEN BUILT TO BE USED AS A S&P500 SPY CRASH INDICATOR ON A DAILY TIME FRAME (should not be used as a strategy).
THIS SCRIPT HAS BEEN BUILT AS A STRATEGY FOR VISUALIZATION PURPOSES ONLY AND HAS NOT BEEN OPTIMIZED FOR PROFIT.
The script has been built to show as a lower indicator and also gives visual SELL signal on top when conditions are met. BARE IN MIND NO STOP LOSS, NOR ADVANCED EXIT STRATEGY HAS BEEN BUILT.
As well as the chart SELL signal an alert option has also been built into this script.
The script utilizes a VIX indicator (maroon line) and 50 period Momentum (blue line) and Danger/No trade zone(pink shading).
When the Momentum line crosses down across the VIX this is a sell off but in order to only signal major sell offs the SELL signal only triggers if the momentum continues down through the danger zone.
A SELL signal could be given earlier by removing the need to wait for momentum to continue down through the Danger Zone however this is designed only to catch major market weakness not small sell offs.
As you can see from the picture between the big October 2018 and March 2020 market declines only 2 additional SELLS were triggered.
To use this indicator to identify ideal buying then you should only buy when Momentum line is crossed above the VIX and the Momentum line is above the Danger Zone (ideally 3 - 5 days above danger zone)

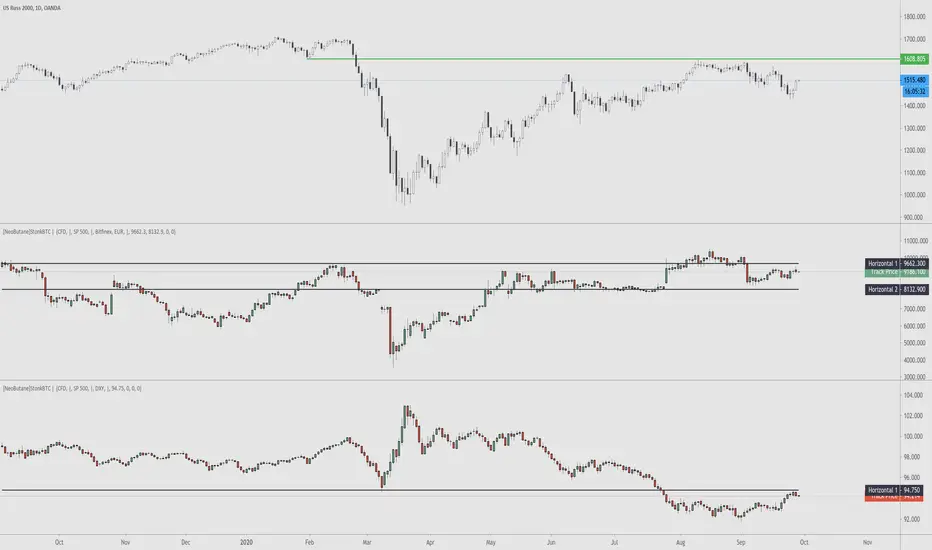
StonkBTC - autoswitch secondary series for scalpersSince the drop in March of 2020, the U.S. ETF , SPY, has been correlated with bitcoin's moves, especially during the NY session.
This tool is meant to help traders who want to take advantage of that without having to switch the secondary series between BTCUSD and (generally) SPY when changing the ticker they are viewing.
How this works:
The indicator will automatically switch between bitcoin or equity index depending on what ticker your current chart is. Ideally this tool would be very simple to use.
Options:
Show/hide a 'track price' line
Index choice of SP500, Nasdaq 100, and Russell 2000. Further selection by ETF, futures, and CFD
Varied bitcoin price sources
Notes:
You will need a separate subscription to TradingView to view realtime CME futures data (if not, it will be delayed by 10 minutes). Because of this, the default option chosen is the CFD for the most complete chart when viewing bitcoin.
NY Core Trading Session: 9:30 a.m. to 4:00 p.m. ET
www.nyse.com
SPY RelativeShows an instrument's sentiment in a day (or week) compared to the market (SPY default). The Red line shows bearish sentiment compared to the market and the green is bullish. Technically this works like a proxy for Alpha/Beta factor.

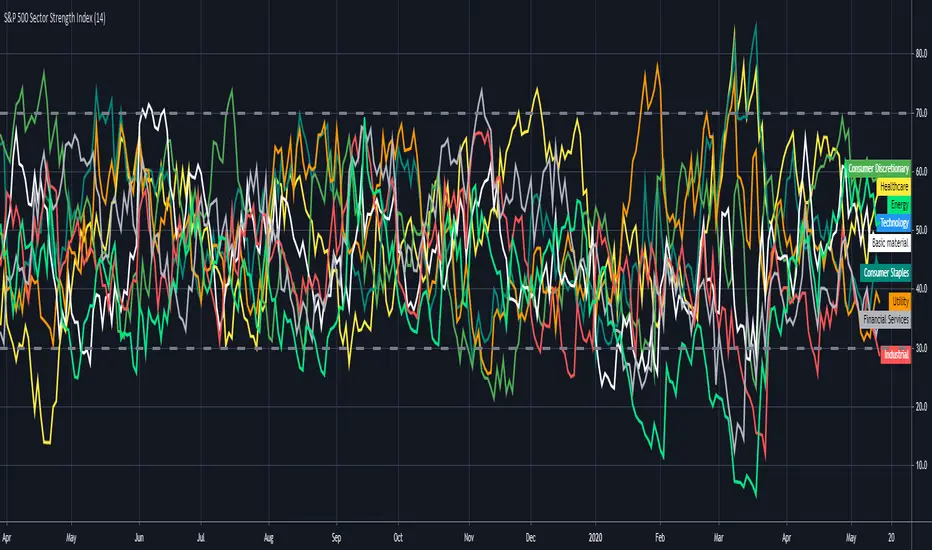
S&P 500 Sector Strength IndexHi traders , this is lonelygrass again 😄, and I am going to show what you don't often see out there and share it with you.
This indicator is called "s&p 500 sector strength index"😎 , which allows you to distinguish strengths and weaknesses between different sectors in s&p500, and to create meaningful trading frameworks around it.
Similar to the RSI indicator , it also has overbought and oversold levels , you can clearly figure out the degree of crowd behaviors in various sectors' stocks .
For me 🤣, I will use it to "BUY LOW⬇️ , SELL HIGH⬆️". When a sector is oversold at the moment, I will try to buy those stocks when I find price actions and chart patterns in comply with the analysis by this indicator , the opposite for shortselling.
Also, for sake of being more user-friendly 👍, I added a function which enables you to only select the sector(s) you want to look at in order to make it less messy.
If you can't help to know what I will share with you coming up, then FOLLOW my account 😙 . Also , your likes and shares are really important 🎊. I will get more motivated to bring you new thing every day!!! ✍
Monthly MA Close Generates buy or sell signal if monthly candle closes above or below the signal MA.
Long positions only.
Inputs:
-Change timeframe MA
-Change period MA
-Use SMA or EMA
-Display MA
-Use another ticker as signal
-Select time period for backtesting
This script is not necessarily written to maximize profits, but to minimize losses.
Although it can outperform 'Buy & Hold' on some occasions when there is a multiple month bearisch trend.
You can optimise this strategy by changing the signal MA inputs.
I would suggest aiming for the best Profit Factor starting from the monthly ("M") setting.
You can always fine-tune the results at a lower timeframe.
The option to use another ticker for providing signals can give you a more stable and unified results.
For example using AMEX:SPY as signal with default parameters gives better results with NASDAQ:AAPL than if you would use NASDAQ:AAPL itself.
I used the anti-repainting function from PineCoders to prevent repainting.
This script is best used for multi-month trading positions & Daily or 4H setting of your chart.
