MPT - MEDIAN PRICE TRADING - custom forex indicator
MPT is a unique custom indicator i created to enter a trade with the right timing
This indicator catches the momentum of a Forex pair and tells you when to enter
It's based on the idea that when the median price in the current timeframe is crossing the median price of the higher timeframe, the momentum is changing and that is an opportunity to trade
red line is median line of current timeframe (default is 1D)
aqua line is projection of past median line on higher timeframe (default is 1W)
white crosses can be used as a trail stop values to follow a trend
when red cross aqua up the background is green and so momentum of the pair is up
when red cross aqua down no background color and momentum down
You can try this indicator for a limited period, just ask for access in comments
If you want unlimited access you can PM me
Trading is a risky business, use it at your own risk. I'm not responsible for any profit or loss
Signals

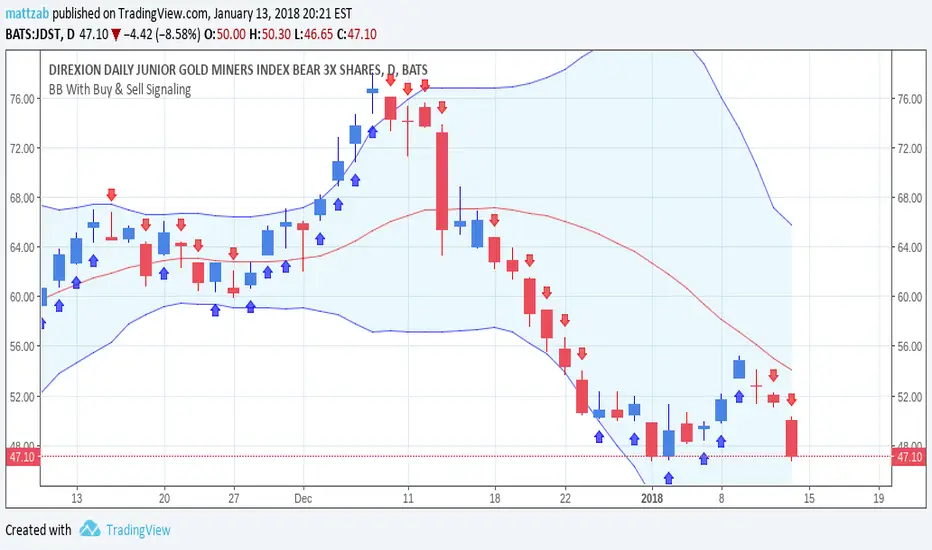
Advanced Buy/Sell Signals with BB by mattzabThe Basics
Buy and Sell Signal Arrows
Tack Marks to show how close the next opposite arrow might be- showing possible trend reversals
Standard Bollinger Bands
The Nitty Gritty
The buy and sell signal arrows are based on price and MACD histogram.
The MACD settings are as follows: 10 day fast EMA, 20 day slow EMA, 5 day SMA signal smoothing. Instead of close price, we are using the average point of the day's high, low, and close.
For the arrows, current price and yesterday's price are the average point between price high and low.
A BUY arrow is created when:
Current Price IS GREATER THAN Previous Price _AND_ Current MACD Histogram IS GREATER THAN Previous MACD Histogram
A SELL arrow is created when:
Current Price IS LESS THAN Previous Price _AND_ Current MACD Histogram IS LESS THAN Yesterday's MACD Histogram
The Red Tack is the threshold, or barrier, for the next arrow. It will not move.
The Blue Tack is the current point in space for our average Price and MACD Delta Values. It will move throughout the day (or hour or minute depending on your resolution). The Blue Tack will give you an indication of how close or how far from the reversal threshold (Red Tack) the ticker is at that point.
While the Blue Tack is ABOVE Red, the most recent signal arrow will be a buy, and we are in a buy/hold period.
While the Blue Tack is BELOW Red, the most recent signal arrow will be a sell, and we are in a sell/wait period.
If the Blue Tack crosses above or below Red, you'll get the next arrow.
The Bollinger Bands are unmodified and are just a background indicator for your use. If you prefer not to see the Bollinger Bands, change their transparency to 0% to hide them.
Please leave feedback on how the script works for you, if you run into problems, if you have any changes you'd like to see, etc.

BB With Buy & Sell Signaling by mattzabThis is an unmodified Bollinger Band, with the addition of buy/sell arrows.
No arrow = hold the position (whether in or out)
Blue up = buy
Red down = sell
Arrows are produced by MACD histogram moving in the same direction as price.
MACD settings are:
Fast EMA = 10
Slow EMA = 20
Signal Smoothing SMA = 5
EMA Bollinger Bands w/ Breakout Signals (EMA BBs)EMA Bollinger Bands with Signals When Price Exits Either Top or Bottom Bollinger Bands (Marked with either Red or Blue Triangles) (EMA BBs)
EMA BBs work even better for day trading and scalping!
These are Multi Bands,
P.S. Sorry Chart Pictured is a mess Ichimoku Cloud is Turned On
This indicator is Bollinger Bands Only w/ Signals of price exiting of bands

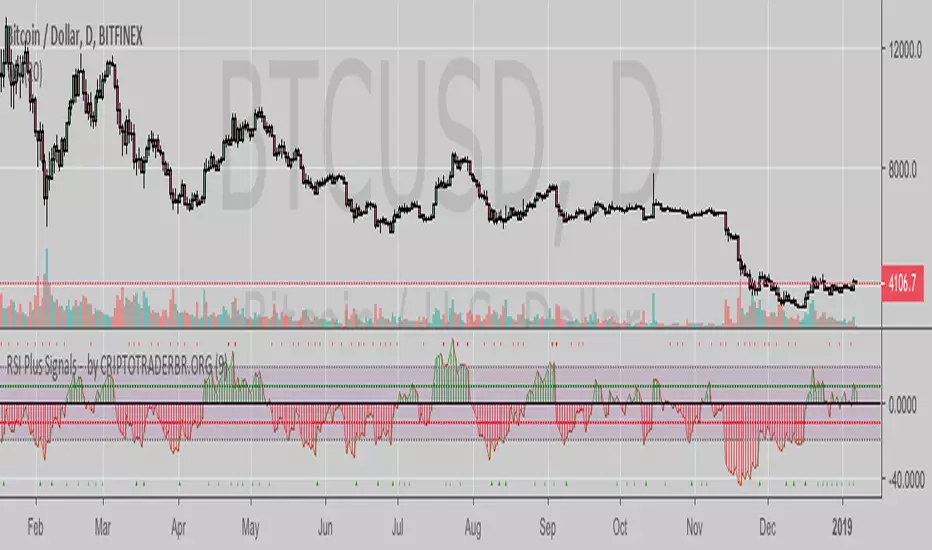

Crypto Money Index - buy Signals for Bitcoin and MoreAn updated version of my previous script, this one includes buy alerts.
It has been tested with Bitcoin (BTC), Monero (XMR), Ethereum (ETH), Dash (DSH), Bitcoin Cash (BCH), LiteCoin (LTC), and IOTA (IOT).
To use for Futures on BitMex (as shown in examples), you need to use the Override feature and set the prefix. For example, Bitcoin futures on BitMex is XBTZ17 - so you would set the override to true and pair to BTC. For Ethereum futures on BitMex, you would turn the override to true and set the pair to ETH.
For USD based pairs (BTCUSD, ETHUSD) it will update automatically.
Ok, on to examples...
Here is how we can see the Bitcoin Cash pump that happened this week BEFORE it happened by seeing price action in the indicator:
Here is a similar example with DASH:
Here is another (again) example with Monero (XMR):
Lastly, IOTA (IOT) with lots of buying signals and double bottoms to play with... regardless if you got in early and rode a small loss for a bit, it popped as well.
ALERTS
To have an alert, create one on the chart and set it based on Trigger being greater than 0.
ACCESS
If you'd like to use my custom indicator - send 0.01 BTC to 32Hagdtq7PCR4inF4ZPkCReEjyecm2eNaP then email me at samurai_crypto@protonmail.com with your TradingView username and your transaction ID and I will add you.
Costs are lifetime with full support via email on how to use it.

DepthHouse - ATR BandsDepthHouse ATR Bands works very similar to the well-known Bollinger Bands.
However, these bands are calculated slightly different.
Instead of using the standard deviation formula, ATR Bands determines the size of the bands based on the average range.
How to use:
The bands tighten while the markets’ range becomes lower, and widens as its' range becomes broader. Giving the indicator a loaded spring effect.
A break outside of the bands in either direction usually indicates a breakout.
All 3 bands serve as possible support and/or resistance. Meaning breaks back into the bands could indicate a reversal, or end of the breakout.
This indicator is completely customizable, so compiling multiple sized bands on top of each other may create a strong competitive edge.
This indicator is free until January,1st 2018 – see how to get below
--
DepthHouse's ATR Bands is 1 of 3 indicators that will be available for purchase via subscription come Jan 2018.
This indicator package will come with the following 3 indicators:
:: MaxADX ::
::Premium oscillator to help spot forming trends and reversals.
:: MaxADX Signals ::
::Taking MaxADX a step farther by creating an overlay that show possible trend strengthening and reversals via bar colors and shapes.
:: ATRBands ::
::Like Bollinger Bands , this indicator is uses to help spot breakouts, and overbought/sold areas.
--
How to get:
To qualify for the trial period which ends January, 1st 2018, please go to the link on my profile and click subscribe!
You will then be sent directions for your account to be added to the whitelist.
If you have already subscribed to one of my previous indicators, you will be added to the list shortly
Likes and comments are so very much appreciated!

Grahn Gyllene Kors [Alerts]Grahn Gyllene Kors is the companion study for the Grahn Gyllene Kors strategy...
This is an EMA / Trend Explorer & Strategy useful for identifying trends before EMA's cross and also identifying and experimenting with various EMA lengths and candle trends. There is also a companion Alerts study for this in which trend signals may be sent to the user via sms or email AND/OR buy and sell alerts may be sent to bots for automated trading of this strategy. Once you have optimized your settings and backtested with this strategy, apply your same settings into the Alerts study and create your alerts.
NOTICE: This script does not require access from me, simply open Indicators on chart and search for "Grahn". By accessing this script you acknowledge that you have read and understood that this is for research purposes only and I am not responsible for any financial losses you may incur by using this script!
EMA Fast and EMA Slow - may be adjusted in length and color.
Bullish F>S % - controls what percentage the EMA Fast should be above EMA Slow before considered bullish and is represented by the Green band on the chart.
Neutral % - is what percentage surrounding the EMA Slow should be considered neutral and is represented by the Yellow band on the chart.
Bearish F

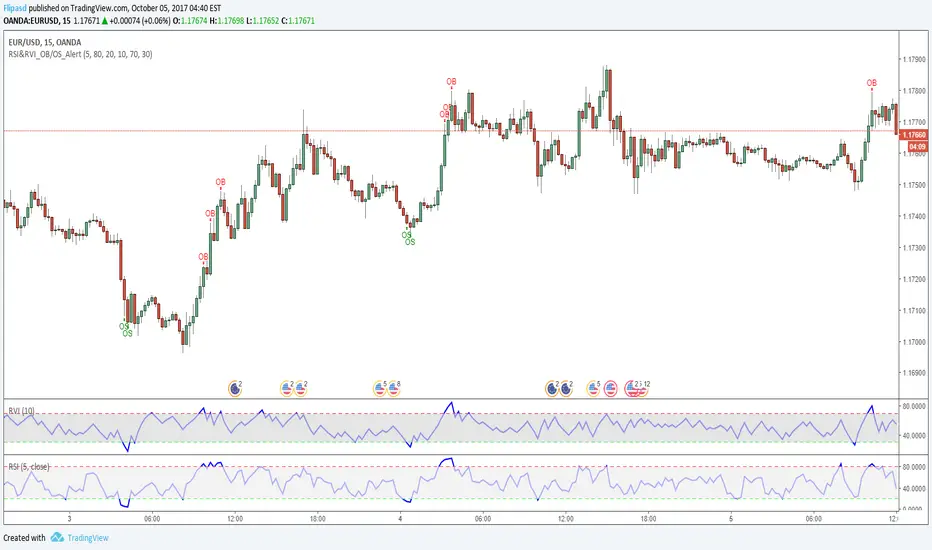
RSI & RVI OB/OS Alert ArrowThe script shows arrows on bars that are in overbought or oversold, based on the set parameters of Relative Strength Index ( RSI ) and Relative Volatility Index (RVI).
Also there is a universal allert, which includes both conditions - overbought and oversold.
You can change the period of RSI and RVI, as well as the upper and lower boundaries of these indicators.
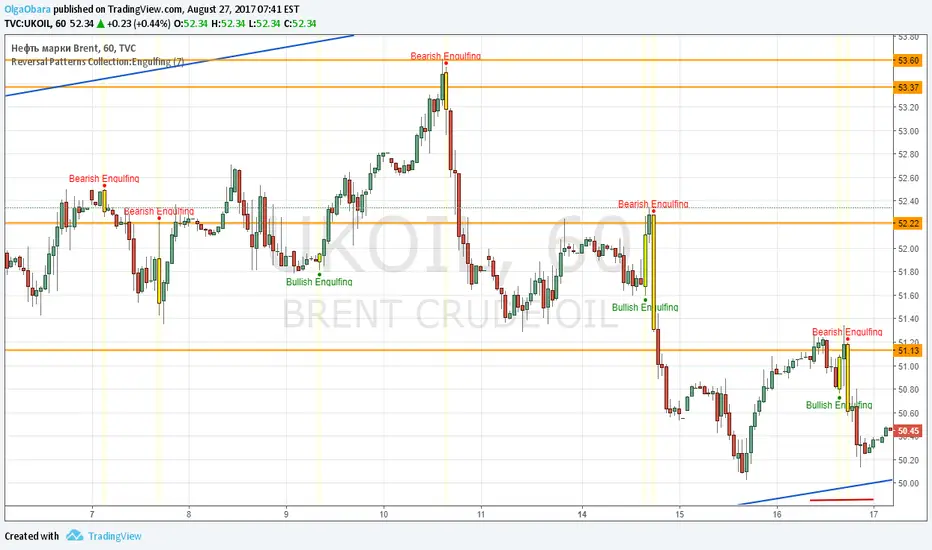
Reversal Patterns Collection:EngulfingScript contains Engulfing patterns (busllish and bearish). User can select period for candle size calculation (for distinguish short and long candles), on/off patterns highlighting.
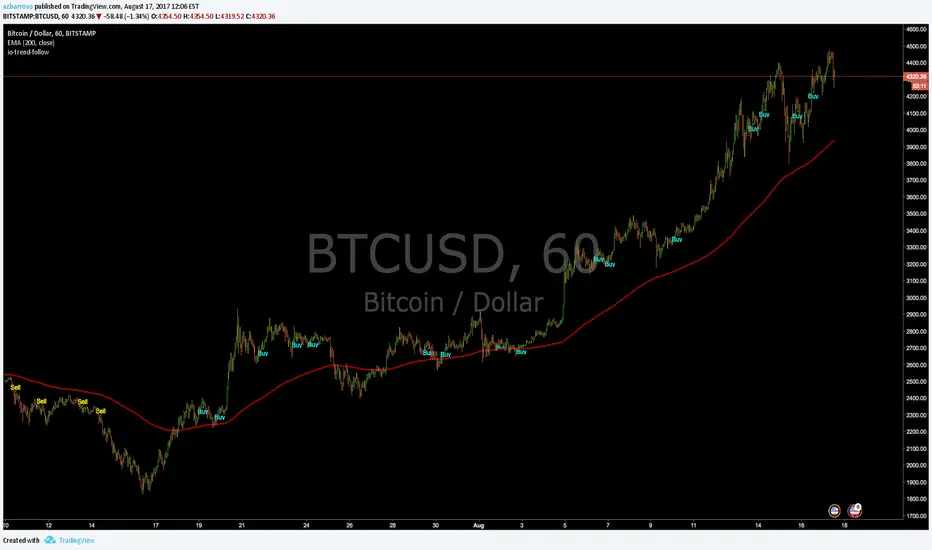
io-trend-follow (1.5)Trend Follow script to be used across all market instruments and timeframes.
You can display long only, short only or both signals.
version 1.5 -> Filter by EMA 200 option added
version 1.4 -> Alerts added
version 1.2 -> Only one signal per trend (default) or multiple entry signals per trend
version 1.1 -> White theme option added
io-counter-trend (1.5)Counter Trend script to be used across all market instruments and timeframes.
You can display long only, short only or both signals.
version 1.5 -> Filter by EMA 200 option added
version 1.4 -> Alerts added
version 1.1 -> White theme option added

Buy Low Sell High CompositeCombines RSI, EMA difference, and MacD into a single indicator. Buy when it's very red, sell when it's very green.

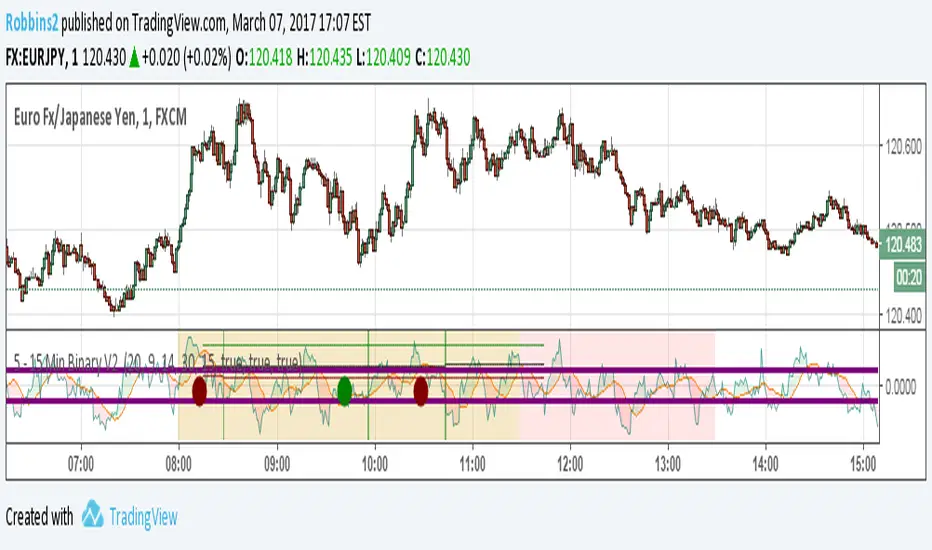
5 - 15 Min Binary V2 Hey guys
As promised back with the updated indicator without needing my blessing to use. Please post feedback so that I can perfect it.
Works great on EU/JP and USDCAD with a risk factor of 20 – 25. Use 1 time frame with 15 mins Expiry for nest results. Possible to get 90% ITM with this setup.
Updated Feature
Risk Factor: Higher the number lowers the risk but also means lower trade setups. Best between 20 – 25.
Added an additional Filter to minimize bad setups
No trading between 11.30 EST to 13.00 EST. Not worth the risk.
Displays ITM rate in Green, Red and total in Black.
Alert capable for Both, Call or Put
Please demo before you take it live. Also during normal trading hours I have not seen more than 3 consecutive loses, (unless there is a news release) so with money management you can greatly increase your total ITM rate.
If you like this indicator, feel free to donate some BTC at 18qrzku9LrQuMq9LyRYmiTbqUtC2bSAv3y
It does take considerable amount of tweaking and testing to put out something like this.
Post feedback so that everyone can benefit.
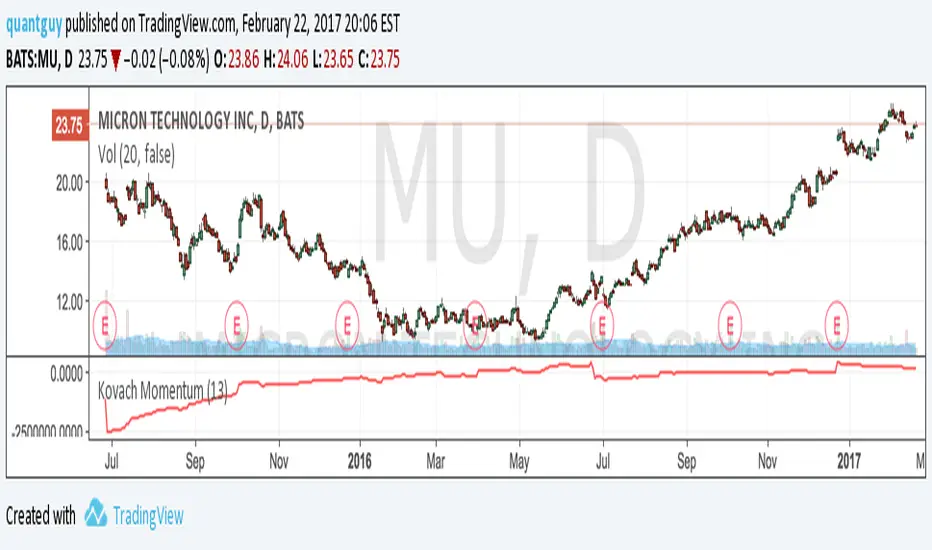
Kovach MomentumThe Kovach Momentum indicator averages instantaneous momentum, while employing advanced signal processing algorithms to minimize lag and filter the effects of volatility. Consider using it with the Kovach Chande indicator and Kovach OBV indicator.

MM-Microtrend-Reversal-IndicatorThis indicator detects microtrend reversals based on crossing of the DMI+ and DMI- + signals
It indicates the trigger event on the chart as well as the reversal candle
In addition to that it shows a countdown above the bars
This is helping when multiple reversals occur
Important: when the Bollinger Bands are crossed in the previous bars it's possible that the prognosted reversal will NOT show up
Recommended timeframes are M1 and M2
Avoid trading sideway trends, the reverals are low and reversal triggers and assumed reversal candles could get chaotic

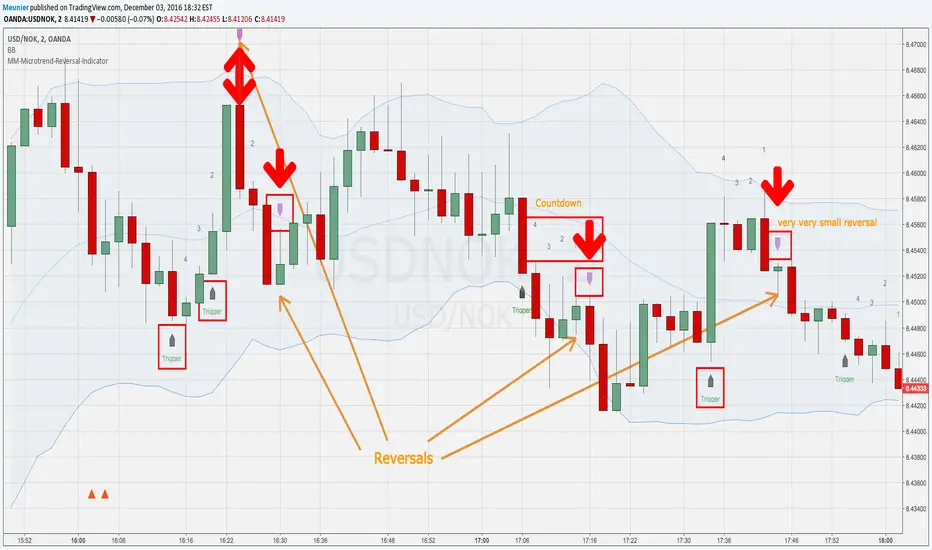
MM-Microtrend-Reversal-IndicatorThis indicator detects microtrend reversals based on crossings of the DMI+ and DMI- signals
It indicates the trigger event on the chart as well as the reversal candle
In addition to that it shows a countdown above the bars
This is helping when multiple reversals occur.
Important: when the Bollinger Bands are crossed in the previous bars it's possible that the prognosted reversal will NOT show up
Recommended timeframes are M1 and M2
Avoid trading sideway trends, the reversals are low and reversal triggers and assumed reversal candles could get chaotic sometimes
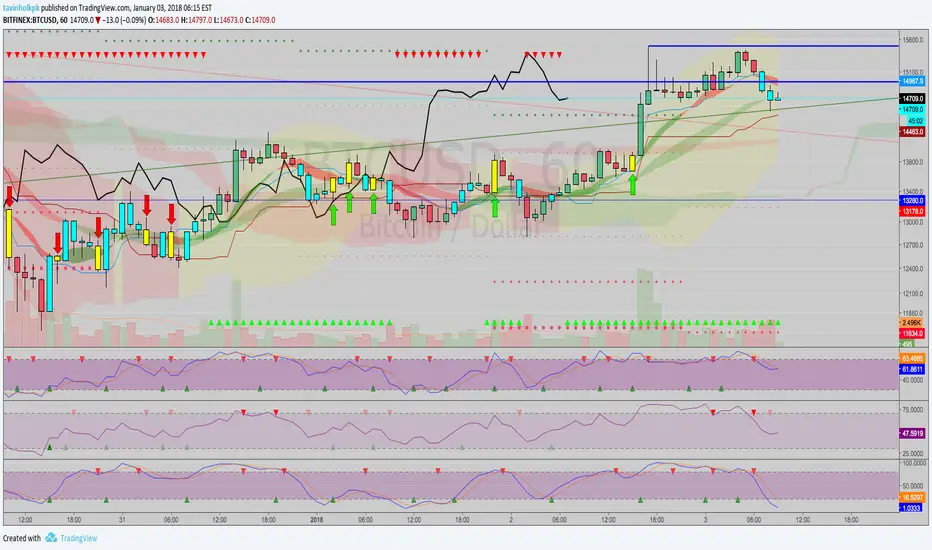
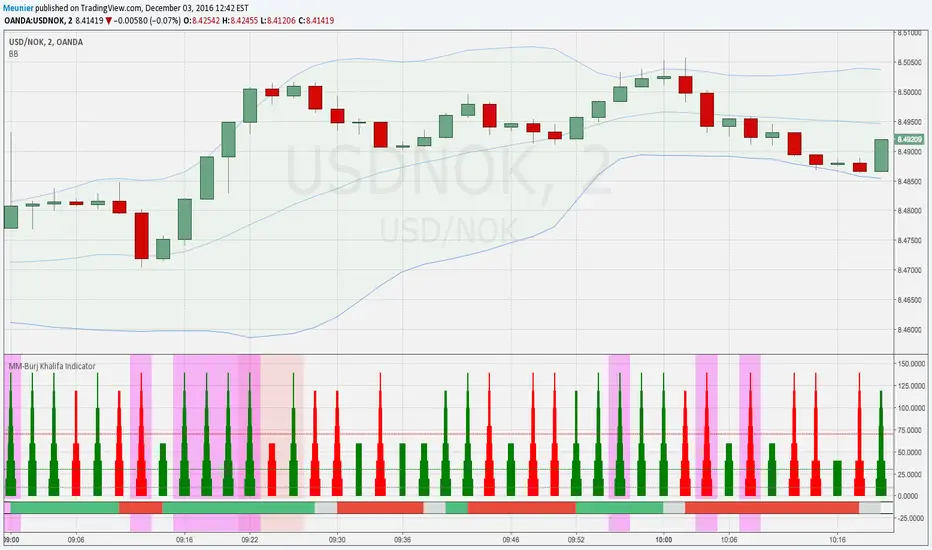
MM-Burj Khalifa Indicator
This indicator uses several signals to visualize a "perfect candle" to enter a trade.
It colors the background to identify the zones of interest (multiple configurable high or low RSI zones). Underlying is a trendbar with the current MACD direction. It's possible to tweak the indicator with a lot of options in the settings section (e.g. for which period you want a rising DM+-signal, etc.)
The indicator is using signals of:
--MACD
--RSI
--PVT
--ATR
--AD and DMI+/DMI-
When all 7 criterias are met it highlights the candle.
It also creates different colums with different height and width, so that you can see which signal is OK and which is maybe missing. When all signals are on GO you'll see a Burj-Khalifa-like figure. If not all signals are on GO you'see crippled versions.
To be clear:
it's not intended to detect trends or supertrends or reversals. It's purpose it's just to decide if this current candle is really going in the right direction. It doesn't prevent upcoming reversals in the opposite direction.
The Burj-Khalifa indicator could help to confirm the entry point of an trade which was already planned.
I'll come up with a more detailed documentation.
MM-Burj Khalifa IndicatorThis indicator uses several signals to visualize a "perfect candle" to enter a trade.
It colors the background to identify the zones of interest (multiple configurable high or low RSI zones). Underlying is a trendbar with the current MACD direction.
The indicator is using signals of:
--MACD
--RSI
--PVT
--ATR
--AD and DMI+/DMI-
When all 7 criterias are met it highlights the candle.
It also creates different colums with different height and width, so that you can see which signal is OK and which is maybe missing. When all signals are on GO you'll see a Burj-Khalifa-like figure. If not all signals are on GO you'see crippled versions.
To be clear:
it's not intended to detect trends or supertrends or reversals. It's purpose it's just to decide if this current candle is really going in the right direction.
The Burj-Khalifa indicator could help to confirm the entry point of an trade which was already planned.
