Shadow Increase SignalThis indicator Calculates the average upper shadow of the previous 200 candles for issuing SELL signals.
And calculates the average lower shadow of the previous 200 candles for issuing BUY signals.
If the upper shadow of the new candle is %1000 greater than the average upper shadow of the previous 200 candles, a SELL signal is issued and a red arrow appears above the candle.
If the lower shadow of the new candle is %1000 greater than the average lower shadow of the previous 200 candles, a BUY signal is issued and a green arrow appears below the candle.
Shadow

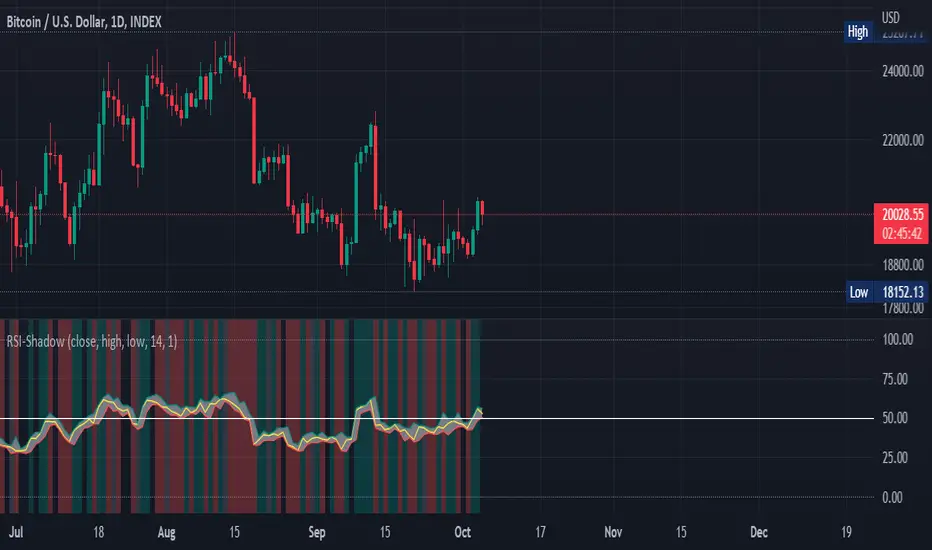
RSI Shadow by TartigradiaHave you ever wondered how much the RSI can vary during an open session? How much wicks can make the RSI overshoots before it retraces for the close?
This indicator plots the RSI shadow, which is the area between the highest and lowest RSI values attained during each open session, from the high/low wick price candle (ie, not the open value).
Technically, we calculate the RSI as usual for all past bars, except for current bar for which we use the high and low values to calculate the RSI Shadow bounds. The invisible PineScript loop then repeats this process for each bar.
In practice, the RSI Shadow provides 2 different informations:
1. This allows to visually represent the variability that historically happened for each bar, which help in better understanding the context at the time and may help predict future similar patterns.
2. The closer the RSI is to one bound, high or low, the more bullish or bearish respectively the price action is. Intuitively, when RSI is close to the high shadow bound, it means that price action is so bullish it often closes in proximity to the highest value attained during the open session, hence very bullish sentiment. And inversely for low and bearish sentiment. To ease visualization of these sentiments, a background highlighting is provided.
The indicator works under all timeframes, but it appears to provide a very reliable information with longer timeframe. The background highlighting showing the bullish/bearish sentiment based on the RSI Shadow appears to indicate crypto market cycles relatively reliably, with 2-3 consecutive bars with the same background color indicating a strong trend.
False positives can be reduced by looking at both the background color and the RSI direction, if both are congruent (ie, both bullish), then the trend indication is good, otherwise the trend indicated by the background color should be disregarded. An option was added to uncolor background if incongruent with RSI's direction.
There is also a "shadow margin" setting that allows to further reduce the number of false positives, at the expense of reduced sensitivity (a margin of 3 seems to eliminate most false positives).
Note: if you need a more complete RSI indicator with overbought/oversold signals, check out RSI+ (alt), which includes all RSI related indicators I make (such as RSI Shadow):
Shadow BusterScript that detech when the shadow is higher than the body.
Should be 3x higher for be detected. (personal preference)

PRIME - ShadoW ZoneZ with RSI LevelsIn This experimental study, we've taken RSI data, Volume Profile, and Trend analysis, combining them into one unique package that will allow a trader to analyze market trend lines and their proposed channels, trend momentum through candle color augmentation similar to "Pulse", and Visible Volume index price levels on chart for the current sequence. Below are explanations of each function within the system.
The Semafor is used to spot future multi-level Supports and Resistance zones.
It is also useful to spot HL or LL or HH or LH zones at different Depth settings.
The red zones are the extreme places where the market has a higher chance of reversing while the green zones have the lowest setting with lower chances of the market reversal
Automatic Trend Lines
The indicator takes in 2 timeframes to detect High and Low values from which to draw the trend lines of each timeframe.
As the values change with price movement, the lines are updated. They are color coded for uptrend and downtrend based on the direction of each individual line. Trend lines can be set up to color with only the default value on the configurations panel.
- Toggle on/off Color Coded
- Change Default, Uptrend, Downtrend color
- Change Line Width
- Change Line Style
- Toggle on/off Line Extensions
- Change Extended Line Width
- Change Extended Line Style
- Toggle On/Off labels for 7 data points of each timeframe
Automatic Trend Sights
This is a neat feature that may help you get a better feel for the direction the current movement is heading towards in correlation with the short or medium length timeframe trends. The sight draws a line from the middle vertical point of the trend coordinates towards the current price. They are toggled off by default but can be enabled in the configurations panel.
- Toggle on/off sight on each timeframe
- Change Width
- Change Line Style
Support & Resistance Levels, the main aim of the study. Level calculations are based on Relative Strength Index ( RSI ) threshold levels of oversold/overbought and bull/bear zones, where all threshold values are customizable through the user dialog box. Background of the levels can be colored optionally.
RSI Weighted Colored Bars and/or Mark Overbought/Oversold Bars , Bar colors can be painted to better emphasis RSI values. Darker colors when the oscillator is in oversold/overbought zones, light colors when oscillator readings are below/above the bull/bear zone respectively, and remain unchanged otherwise. Besides the colors, with “Display RSI Overbought/Oversold Price Bars” option little triangle shapes can be plotted on top or bottom of the bars when RSI is in oversold/overbought zones .
Disclaimer:
Trading success is all about following your trading strategy and the indicators should fit within your trading strategy, and not to be traded upon solely
The script is for informational and educational purposes only. Use of the script does not constitute professional and/or financial advice. You alone have the sole responsibility of evaluating the script output and risks associated with the use of the script. In exchange for using the script, you agree not to hold dgtrd TradingView user liable for any possible claim for damages arising from any decision you make based on use of the script

Big Shadow IndicatorNaked Forex Big Shadow Indicator for TradingView
Big Shadow Indicator is a pattern recognition indicator for Forex, Stocks, Indices, Futures, Commodities, and Cryptos.
When you have a Big Shadow on your chart then this is a strong signal meaning that you might be ahead of a reversal. You can take other elements (momentum, trend, volatility, price action, fundamentals) to build a complete strategy and confirm your entries. Beware that you might not make money just following the arrows generated by the pattern recognition.
The Big Shadow pattern is a simple and effective pattern to trade.
The strategy that comes with the Big Shadow is based on price action.
Inputs:
MaxBars: number of bars back used to calculate the indicator
BuySignals (true/false): you can filter signals and decide to show BUY signals or not. Default settings is true (no filter).
SellSignals (true/false): you can filter signals and decide to show SELL signals or not. Default settings is true (no filter).
Alerts:
The alerts are managed by TradingView trading platform features and not by the indicator itself. You must use Big Shadow Sell less than zero and Big Shadow Buy greater than zero as settings for the alerts.
Trading rules:
For BUY: wait for a bullish Big Shadow to print on a support zone after a down trend. Wait for price to break high of the Big Shadow candle (5 pips above the high for H1 and higher time frames). Immediately enter in the trade once high is broken. You also can use a BUY STOP order placed 5 pips above the high of the candle (plus spread). Stop Loss should be placed below the low of the Big Shadow candle. If order is not triggered in the next candle then trade is invalidated and should be canceled.
For SELL: wait for a bearish Big Shadow to print on resistance zone after an up trend. Wait for price to break the low of the Big Shadow candle (5 pips below the low for H1 and higher time frames). Immediately enter in the trade once low is broken. You also can use a SELL STOP order place 5 pips below the low of the candle. Stop Loss should be placed above the high of the Big Shadow candle. If order is not triggered in the next candle then trade is invalidated and should be canceled.
The Big Shadow indicator can be used with any time frame.
The Big Shadow indicator can be used with any class of asset: Forex, Stocks, Indices, Futures, Commodities and Cryptos.
Other indicators: you might also be interested in the Kangaroo Tail Indicator (very good pattern which is part of the Naked Forex)
For updates of this description please visit our website (see signature below). Beware that due to TradingView house rules we are not allowed to update the present description nor to mention our website. At the time you are reading this description it might be outdated information.
For any question or request please feel free to contact me in private. I usually answer all requests at reception.

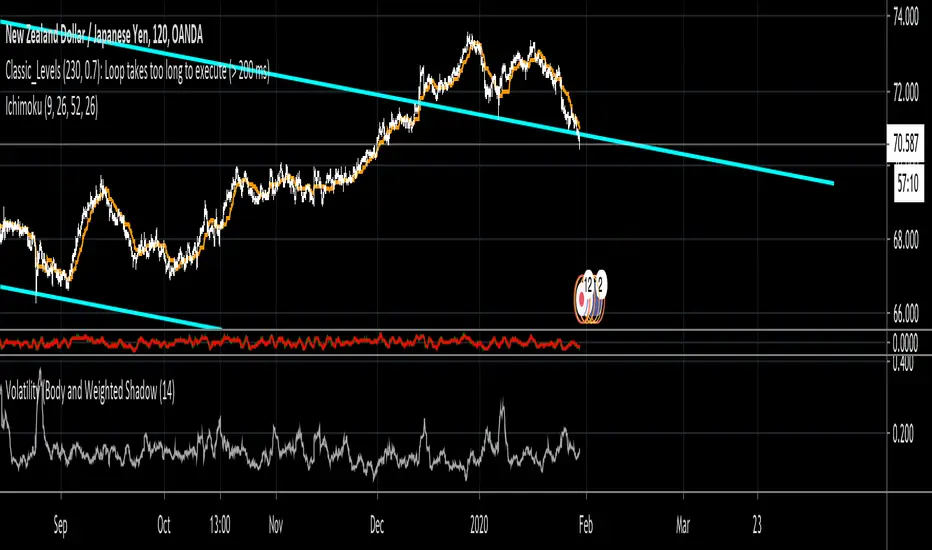
Volatility (Body and Weighted Shadow)- Volatility Indicator
- Replacement for ATR
- As each pair holds a different level of volatility, a stop loss can be set using this indicator rather than via a ratio 2:1, etc. e.g. 2 X Volatility Value = S/L...
- This indicator averages the bodies of candlesticks over a default length of 14 periods. It also considers the length of shadows via a weighted average. This is done as it is assumed that financial institutions tend to move price to levels that do not hold (shadows). Therefore, wick lengths are less significant than the candlestick bodies, so they are weighted to hold less value.
Shadow MAShadow/Wick Moving Average
- Moving Average comparing top and bottom Shadow / Wick length
- Shadows represent price levels that have been hit, but did not close
- Not an all-purpose, all-in-one indicator for entry and exit
- Used as a visual aid to better understand price movement. For example. if price is bearish, but the Shadow MA is showing high, positive values, it is a sign that price is not tending to close at its highest point; therefore, there is bearish resistance.
- Can be used in combination with momentum oscillators and trend analysis.

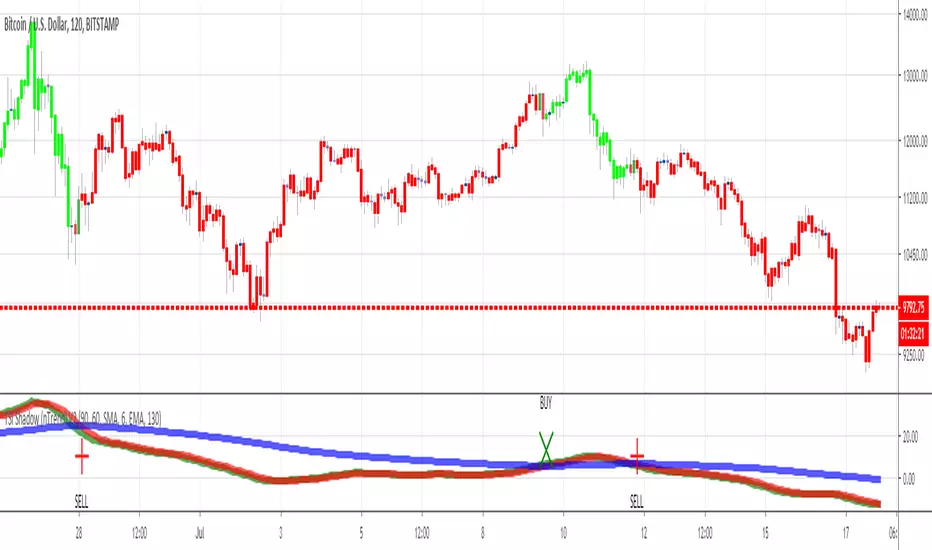
TSI Shadow (with custom candle coloring)Hello traders
This indicator is based on my TSI shadow previously published
This custom version will also color the candles based on the TSI shadow trend
Bullish condition = TSI > MA2 and MA1> MA2
Bearish condition = TSI < MA1 and MA1 < MA2
I made alerts available for this indicator so you can set them on your account
Enjoy
Dave

Moving Average Shaded Fill Area Crossover EMA Color - EditableMoving Average Shaded Fill Area Crossover EMA Color with option to change EMA value

Shadow Index by WentalThe indicator shows the ratio of the upper and lower shadows of the candlestick chart.


Shadow MACDThis Script is basically made by looking this video (watch it for more informations)
-> www.youtube.com
For me MACD is one of the best indicators out there so with a faster macd it can help me find my entrys easier in the market
So i added the 4C MACD ( by vkno422) with a histogram MACD
Those are the best settings that i found for this strategy. if you find better just let me know ;)

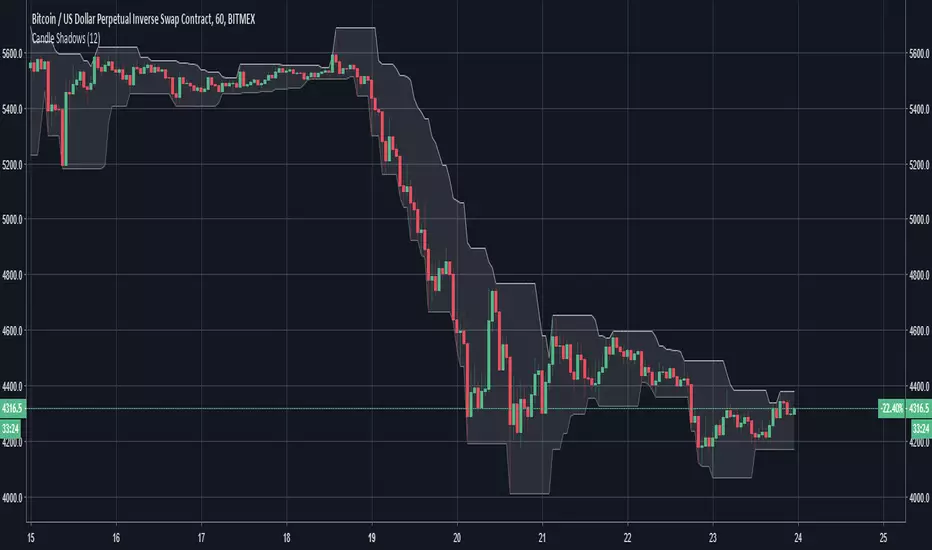
Candle ShadowsQuick and dirty script to show "shadows" off of wicks so they're easier to see, especially when zoomed out.
Naked Forex Trading Strategy v2v1 Big Shadow candles based on "How Naked Trading Works" video by Walter Peters: https://youtu created by AlistarElvis
v2 Bugfix calculation largest candle, added parameter for alternative calculation largest candle
