Simple Moving Average 20,50,100This SMA Script is modified and is based on 3 bands which are of 20 days, 50 days, 100 days average line.
This is a very appropriate for Indian Markets.
**How to Use :**
***BUY***
When the chart pattern is as follows :-
- SMA 200 (Black)
- SMA 50 (Red)
- SMA 20 (Green)
- "Last Traded Price"
***SELL***
When the chart pattern is as follows :-
- "Last Traded Price"
- SMA 20 (Green)
- SMA 50 (Red)
- SMA 200 (Black)
And Book Good Profits!!!
In den Scripts nach "黄金近20年走势" suchen

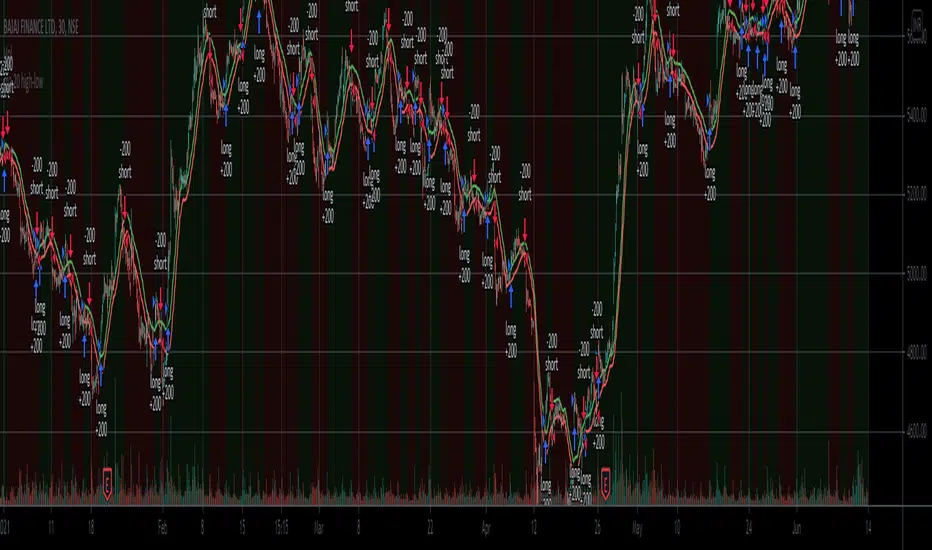
ma 20 high-lowThis is a simple 20-period high and low SMA strategy. We buy the stock when it closes above the 20 period SMA of high prices and sell when it closes below it. We sell when the price closes below 20 period SMA of low prices. This strategy works phenomenally well for a few stocks examples are bajaj finance and bajaj finserv. I want to see if it makes a good return in future. It works well for 30 mins and a daily time frame.
SMA price-based 20 SMA 100 SMA 200Three Simple Moving Averages to detect changes in short time frame direction as well longer time frame swing movements.
sma 20 based on price - Two colors. Green if closing price is above the 20 sma. Red if closing price is below 20 sma.
sma 100
sma 200
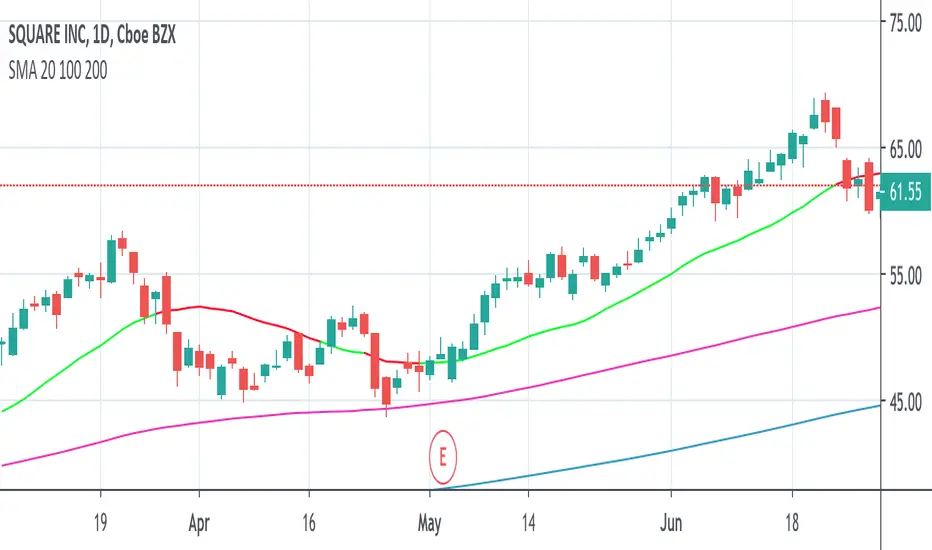
SMA 20, 50, 200This Script provides the 50 and 200 day moving average to provide a way to keep track of the classic Death Cross and Golden Cross. The 20 day moving average is just used as an early prediction of what the 50 day may do so you can keep and eye on it. If you are the kind of person that freaks out at sudden changes in the graphs it is probably best to just turn the 20 day off.
A Golden Cross is when the 50 day MA raises above the 200 day MA. This indicates the start of a Bull Market. This is the best time to buy as the market commonly will increase over the next few months or even years.
A Death Cross is when the 50 day MA drops below the 200 day MA. This indicates the start of a Bear Market. This is the best time to sell as the market will commonly decrease at least 20 percent or more over the next couple months or more.
I am not a financial advisor and this is just a tool to help you make your own decisions with your investments. My information is just based on common knowledge.

EMA Trend Alignment (10/20/50) with MTF & SignalsBullish Crossovers 10>20>50 and Bearish Crossover 10<20<50

J&C Indicator 20/40 MA4H SMA Signal Map (20/40) Strategy
Timeframe: 4-Hour
Overview:
This is a momentum-based trend confirmation system using dual moving averages. The strategy identifies potential entry points when price action aligns with moving average positioning.
LONG Signal:
Triggers when the market demonstrates bullish momentum with price confirming an upside breakout while both moving averages are in a favorable uptrend alignment.
SHORT Signal:
Triggers when the market demonstrates bearish momentum with price confirming a downside breakdown while both moving averages are in a favorable downtrend alignment.
Key Features:
Uses a 20-period and 40-period simple moving average on the 4-hour timeframe
Filters out false signals by requiring multi-factor confirmation
Generates clear visual alerts with background highlighting
Real-time dashboard showing current MA values and trend direction
Sound/notification alerts for immediate signal awareness
Best Used For:
Swing trading on higher timeframes with proper risk management and support from additional confluence factors on your trading setup.

Turtle 20-Day Breakout (Donchian)Yes, the most important indicator used in the Turtle Rules (Turtle Trading Strategy) for finding breakouts above previous highs is the Donchian Channel. 🐢📈
Donchian Channel
The Donchian Channel is a trend-following indicator composed of three lines plotted on the chart:
Shutterstock
Upper Band: The highest high over the defined number of periods.
Lower Band: The lowest low over the defined number of periods.
Middle Line: The average of the Upper and Lower bands (not always used, but sometimes added for orientation).
The Turtle Rules use the following periods for the entry signals (breakouts) you mentioned in your query:
Short-Term (System 1): Crossing the 20-day high (this corresponds to the upper band of a Donchian Channel with a 20-period setting).
Mid-Term/Long-Term (System 2): Crossing the 55-day high (this corresponds to the upper band of a Donchian Channel with a 55-period setting).
Crossing the upper band signals a breakout and serves as the buy signal for a long position (for short positions, crossing below the lower band is used).
Is there anything else I can translate for you, or would you like me to elaborate on the Average True Range (ATR), the other key indicator used by the Turtles?

EMA 9/20 Crossover AlertThis EMA 9/20 Crossover Alert indicator is a technical tool used on price charts to detect and notify traders when the short-term 9-period Exponential Moving Average (EMA) crosses above or below the longer-term 20-period EMA. This crossover often signals potential shifts in market momentum, signaling possible buy or sell opportunities. The indicator visually plots both EMAs on the chart and creates alert conditions so traders can be promptly informed of these crossover events, aiding in timely decision-making without needing to constantly watch the chart. It is widely used in momentum and trend-following trading strategies to identify trend reversals or continuations

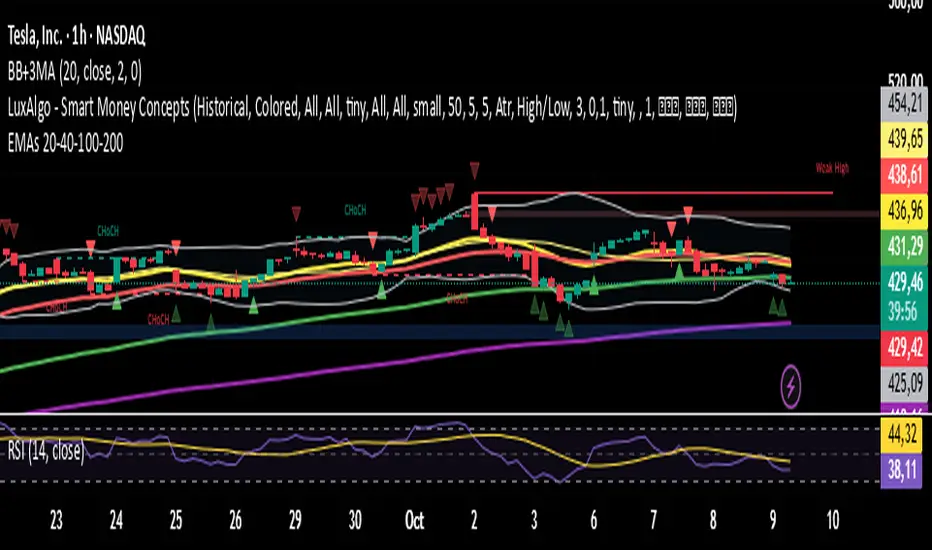
EMAs 20 - 40 - 100 - 200
This script contains the 20-40-100-200 EMAs.
EMA (Exponential)
Best for active or short-term trading because:
It adjusts more quickly to recent price changes.
It allows for earlier detection of trend reversals.
It is preferred by traders who trade calls and puts for a few days or weeks.
Example:
On 15-minute, 1-hour, or daily time frames, the 20-EMA or 40-EMA gives you early signals to open or close options.
It is good for momentum trades or quick breakouts.
指定周期 EMA (20, 40, 60, 80)This indicator allows you to display EMA (20, 40, 60, 80) from a higher timeframe directly on your current chart.
It helps you identify trend direction, confluence zones, and dynamic support/resistance based on multi-timeframe EMAs.
Features:
Choose any higher timeframe (e.g. 60 = 1H, 240 = 4H, D = 1D)
Plots 4 EMAs: 20, 40, 60, and 80
Works seamlessly across all timeframes
Ideal for trend confirmation and multi-timeframe analysis
💡 Tip:
Try viewing the 1H EMAs on a 15min chart or 4H EMAs on a 1H chart — this helps identify where price interacts with higher timeframe structure.

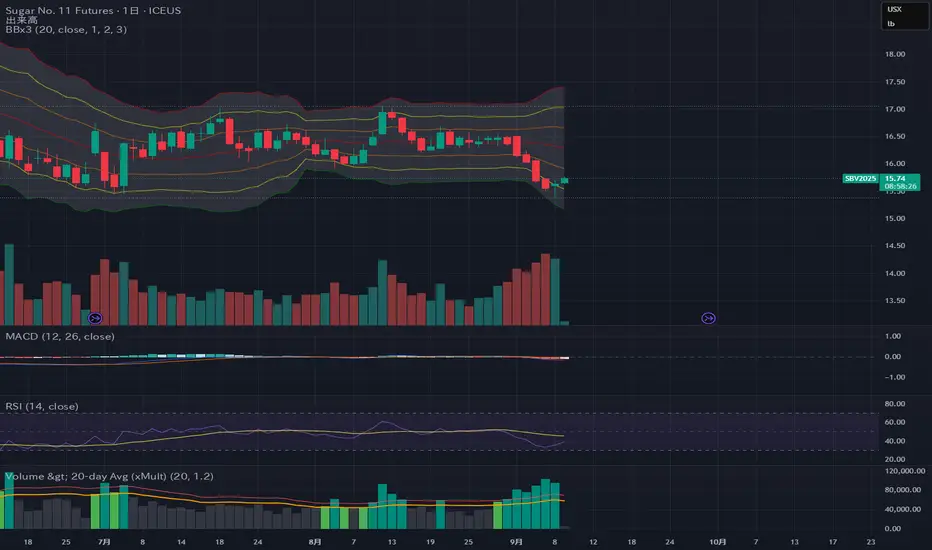
Volume > 20-day Avg (xMult)It’s an indicator that changes color and triggers an alert when volume exceeds the 20-day average. By default, the threshold is set to 1.2× the 20-day average (i.e., 120%), and the value is user-configurable.
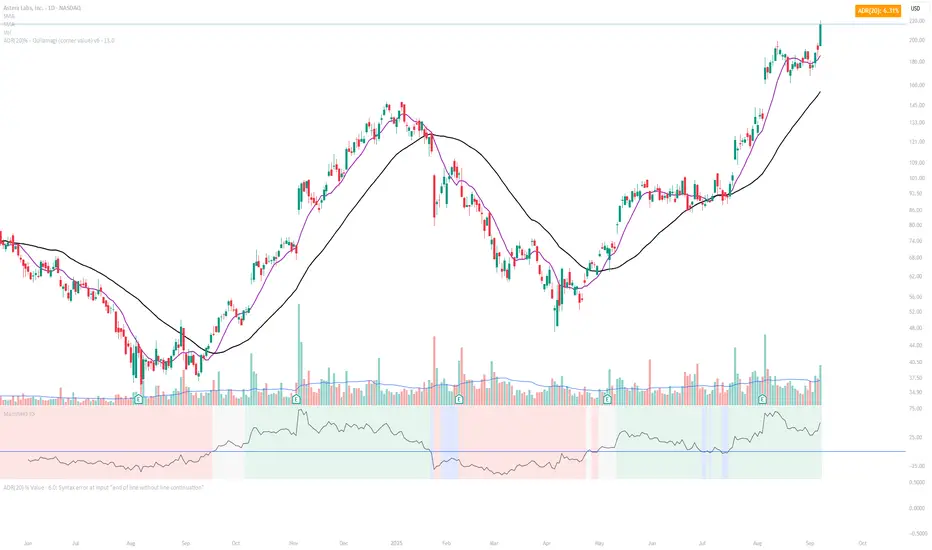
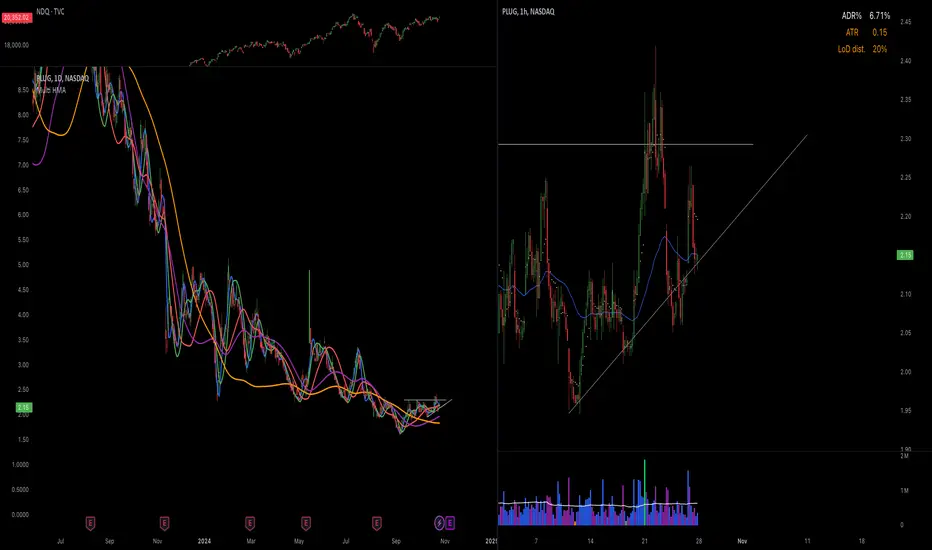
ADR(20)% - Qullamagi (corner value) v6This indicator displays the 20-bar Average Daily Range (ADR) either as a percentage of price or in raw dollar terms, shown in a clean corner box on the chart.
Switch between % ADR and $ ADR with a single checkbox.
Place the output box in any chart corner.
Useful for volatility assessment, stop-loss sizing, and stock selection.
Inspired by the trading approach of Kristjan Qullamägi (Qullamaggie), who uses ADR(20) both to filter high-momentum stocks and to size risk (stops should generally be ≤ 1×ADR).

ADR(20)% - Qullamagi (corner value) v6Description:
This indicator calculates the 20-day Average Daily Range (ADR) as a percentage (or in raw $) and displays it in a clean corner table on the chart.
Formula: average of (High ÷ Low – 1) over the last 20 bars.
Use % or $ mode via settings.
Position the box in any chart corner.
Inspired by Kristjan Qullamägi (Qullamaggie), who uses ADR to filter strong movers and size stop-losses (stops should generally be ≤ 1×ADR).
EMA 20–55 + SMMA50 (20↔55 Band, Alerts, Color Controls)This script plots a customizable EMA ribbon and a smoothed moving average (SMMA).
Key features:
EMA 20 (blue) and EMA 55 (yellow) highlighted with a green/red background ribbon depending on trend.
Optional middle EMAs (25, 30, 35, 40, 45, 50) can be shown or hidden.
SMMA (50) plotted in white as a trend smoother.
Customizable line colors, band colors, and transparency.
Alerts for EMA20/EMA55 bullish or bearish crossovers.
Optional candle bar coloring based on trend.
This is useful for quickly spotting medium-term trend shifts when EMA20 crosses EMA55, while still tracking the broader EMA ribbon context.

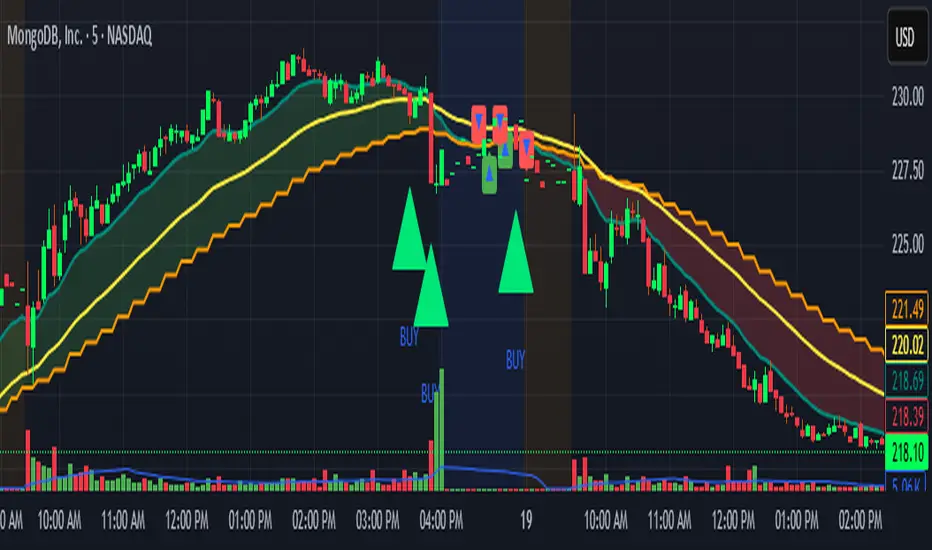
Locked 5m 13 EMA & 15m 20 EMA with Mid EMA & SignalsThis indicator overlays the 5-minute 13 EMA and the 15-minute 20 EMA on any chart timeframe up to 15 minutes, along with a mid EMA (5-minute 36-period) for reference.
Features include:
EMA Cross Detection: Shows bullish and bearish cross arrows when the 5m 13 EMA crosses the 15m 20 EMA.
EMA Fill: Highlights the area between the EMAs in green (bullish) or red (bearish).
Mid EMA Buy/Sell Signals: Generates buy signals when price touches the mid EMA in a bullish stack and sell signals in a bearish stack.
Custom Alerts: Alerts for EMA crosses, EMA stack direction, and mid EMA buy/sell triggers.
Timeframe Safety Warning: Alerts if applied on timeframes higher than 15 minutes.
Ideal For:
Traders who want a locked, non-repainting EMA setup for multi-timeframe analysis and clear entry/exit signals based on mid-range EMA interaction.
Inputs:
Show/Hide arrows for EMA crosses
Show/Hide fill between EMAs
Show/Hide mid EMA line
Show/Hide buy/sell signals
Fill transparency adjustment
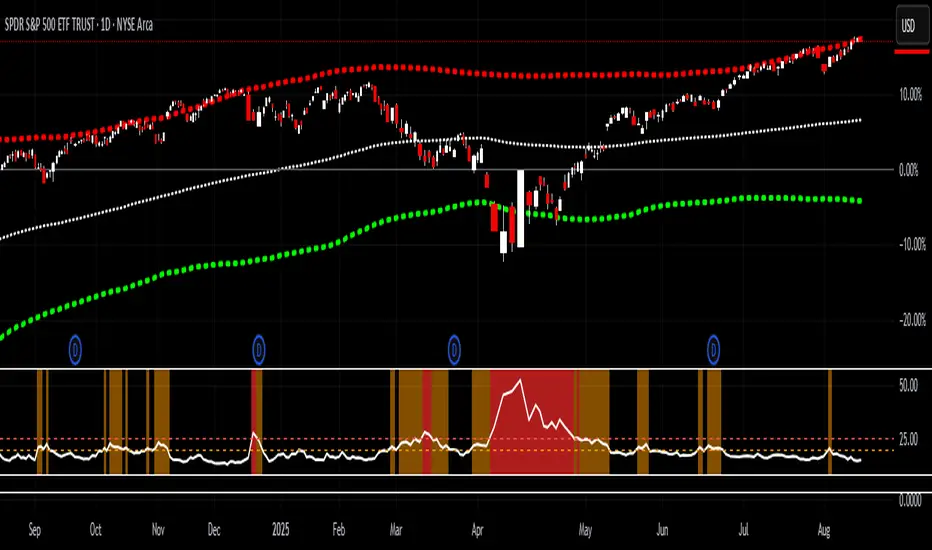
VIX > 20/25 HighlightThis indicator tracks the CBOE Volatility Index (VIX) and highlights when volatility exceeds critical thresholds.
Plots the VIX with dashed reference lines at 20 and 25.
Background turns orange when the VIX is above 20.
Background turns bright red when the VIX is above 25.
Includes alert conditions to notify you when the VIX crosses above 20 or 25.
Use this tool to quickly visualize periods of elevated market stress and manage risk accordingly.
Multi EMA (9, 20, 50, 100) Individual EMA Controls:
Show EMA 9 - Toggle checkbox to turn EMA 9 on/off
Show EMA 20 - Toggle checkbox to turn EMA 20 on/off
Show EMA 50 - Toggle checkbox to turn EMA 50 on/off
Show EMA 100 - Toggle checkbox to turn EMA 100 on/off
📋 Organized Settings:
EMA Display group - Contains all the on/off toggle switches
EMA Settings group - Contains period lengths and source settings
🔔 Smart Alerts:
Alerts only trigger when both EMAs involved in the crossover are enabled
Added EMA 50/100 crossover alerts

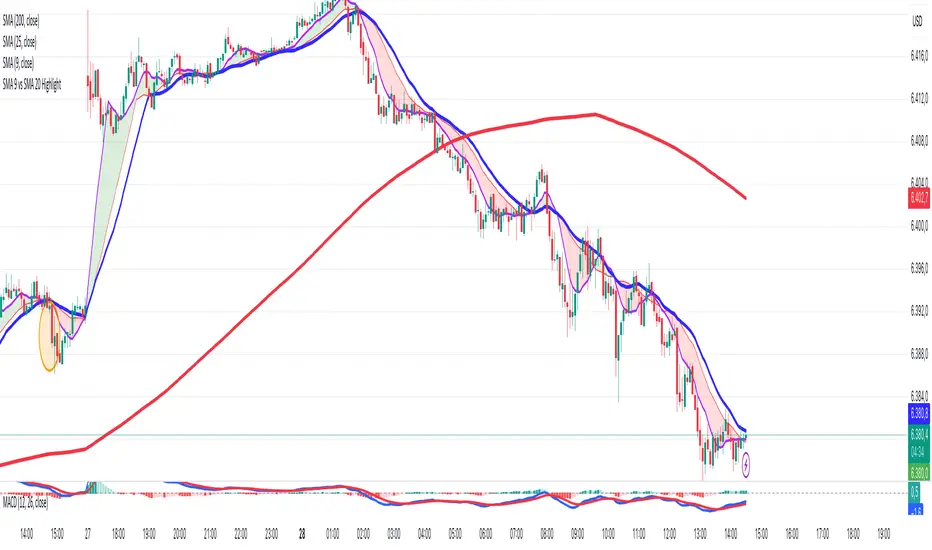
SMA 9 vs SMA 20 Highlight CrossoverHighlight in green the area in between the two SMA do that when the SMA cross above the SMA 20 periods the area is colored in green and when the SMA cross below the SMA 20 periods the area is colored in red
Hourly Markers 09:00 - 20:00 Adjusted for UTC+2A line for every hour from 0900 to 2200
Description:
This TradingView Pine Script plots small red markers (downward arrows) at the top of the chart for every full hour between 09:00 AM and 08:00 PM (20:00) based on UTC+2 time. The markers appear precisely at the opening minute of each hour within the defined range, helping traders visually track key time intervals during the day.
Features:
✔ Displays markers from 09:00 to 20:00 local time (UTC+2 adjustment)
✔ Only plots markers at the first minute of each hour
✔ Uses clear, unobtrusive triangle-down symbols above the bars
✔ Works on any chart timeframe that captures hourly intervals
Use Case:
Ideal for traders who want a quick visual reference of hourly intervals during the main trading hours, especially when working with charts set to UTC or different time zones.

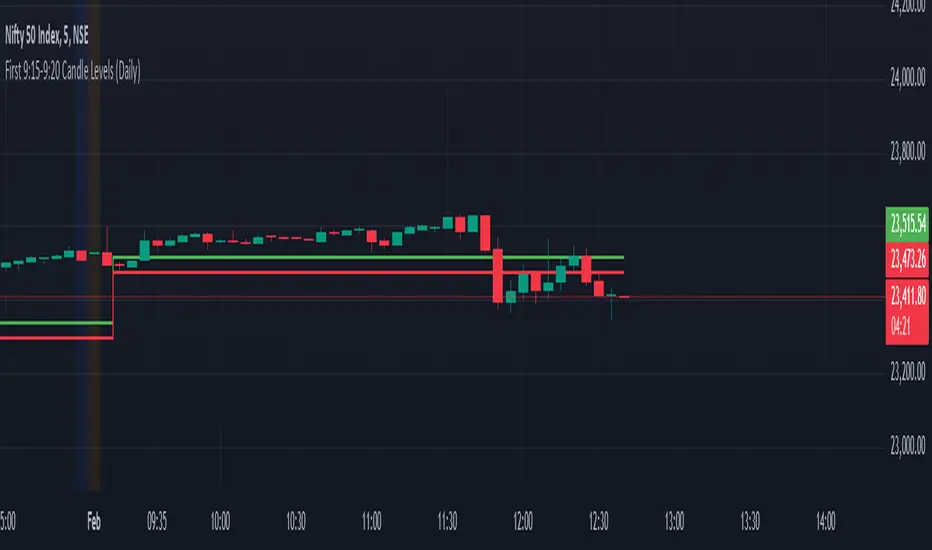
First 9:15-9:20 Candle Levels (Daily)This indicator captures the closing price of the first 5-minute candle (9:15 - 9:20 AM) every trading day. It then calculates 0.09% above and below this closing price and plots horizontal lines. The indicator resets daily at 9:15 AM, ensuring it always tracks the latest market open. After 9:20 AM, the calculated levels remain visible throughout the day. The upper level is displayed in green, while the lower level is in red. This tool helps traders identify key price levels early in the session, useful for setting stop-losses, take-profit zones, or identifying potential breakout points.
Hull Moving Averages 10, 20, 50, 100, 200This script generates multiple Hull Moving Averages (HMAs) on a trading chart, allowing for comprehensive trend analysis across different timeframes. Five HMAs with lengths of 10, 20, 50, 100, and 200 periods are plotted on the chart, providing insights into short, medium, and long-term market trends.
Each HMA can be customized with individual colors to easily distinguish between the different timeframes, helping traders visually track momentum changes and trend strength across these intervals. The Hull Moving Average is known for reducing lag compared to other moving averages, which makes it particularly useful for identifying turning points more accurately.
With this script:
You can adjust the colors of each HMA line individually, ensuring optimal visual differentiation.
You can analyze short-term trends with HMA 10 and HMA 20, medium-term trends with HMA 50, and long-term trends with HMA 100 and HMA 200.
The chart provides an at-a-glance view of multi-timeframe trends, making it useful for trading strategies that rely on crossovers or divergence patterns.
This tool is ideal for traders who want to identify trend direction, strength, and possible reversal points with minimal lag.
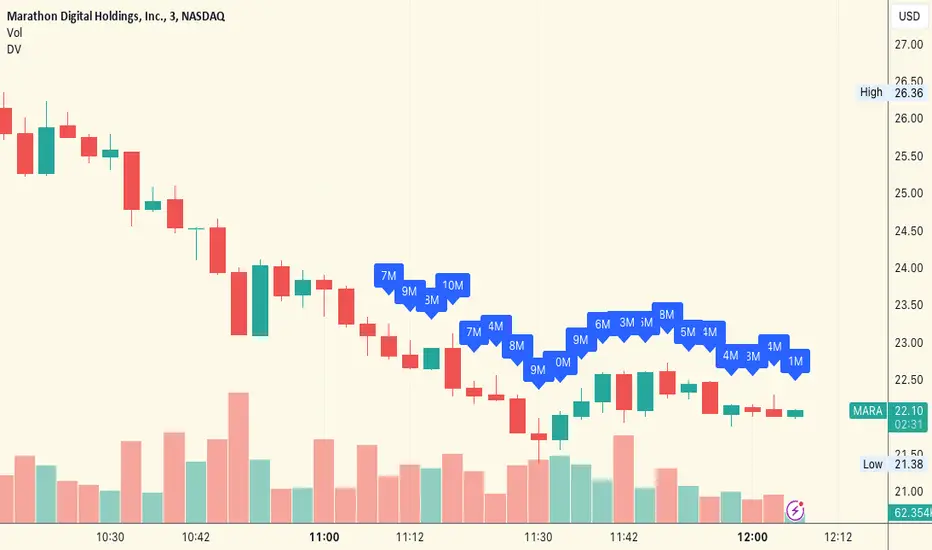
Dollar Volume Last 20 CandlesThe "Dollar Volume Last 20 Candles" indicator, abbreviated as "DV", is a practical and insightful tool for traders and analysts.
This indicator focuses on enhancing the visualization of trading data by calculating and displaying the dollar volume for each of the last 20 bars on a financial chart. It achieves this by multiplying the closing price of each bar with its trading volume, providing a clear dollar value of the trading activity.
The script also features an intuitive formatting system that simplifies large numbers into 'k' (thousands) and 'M' (millions), making the data easily digestible.
The dollar volume data is displayed directly above each bar, adjusted for visibility using the Average True Range (ATR), ensuring that it is both unobtrusive and readily accessible. This overlay feature integrates seamlessly with the existing chart, offering traders a quick and efficient way to assess monetary trading volume at a glance, which is particularly useful for identifying trends and market strength.
Volume with EMA 20 and 2 BB SALEM_ALSALEM1The highest candle amounts in trading volume exceed
average 20
Bollinger Band 1-15
Bollinger Band 20-2
Identified in dark blue
