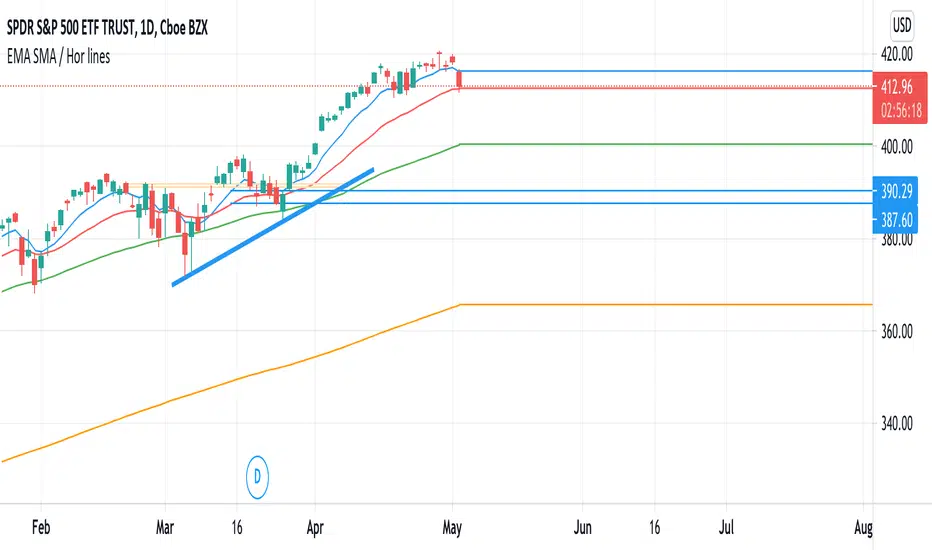
EMA 8,21 SMA 50,200 / Show horizontal linesShow horizontal lines after the last point of EMA8, EMA21, SMA50 and SMA200
Muestra líneas horizontales que continúan del último punto de la EMA8, EMA21, SMA50 y SMA200
In den Scripts nach "流通市值在50亿至200亿之间的股票中,成交量持续放大的个股有哪些?" suchen
Multi Timeframe EMAs Timified Version for CryptoKUCOIN:BEPROUSDT
Rework of felipeprenholato 's glorious work here . This script allows you to see our most important EMA's on any time frame you're working on.
So our Weekly 7, 10, 21 can be seen on the hourly.
Same with our Daily 10, 50, 200 EMAs.
This will save you time and give you a better sense of where price in relation to higher TF MA's no matter what time frame you're looking at. I'll work on a version where you can set any input you like, but these EMAs are hard coded and can't be changed. You can change colors and line styles and what not though.
Have fun Cryptillians and Crypto-C-Heads 👽👽👽


MA10 50 200 CROSSThe Indicator is a revision version from calumon's "MA50 and MA200 Crossing" script
I added with additional MA which is the MA10, together with the original MA50 and MA200 crossing.
MA20 will have a crossing color change from with MA50.
Short Term Bullish signal if MA10 > MA50
MA50 will have a crossing color change with MA200.
Mid-Long Term Bullish signal if MA50 > MA200
This MA trend crossing indicator should use with others indicator for more accurate decision making.
***The indicator do not meant for buy or sell call. Trade with own risk.***

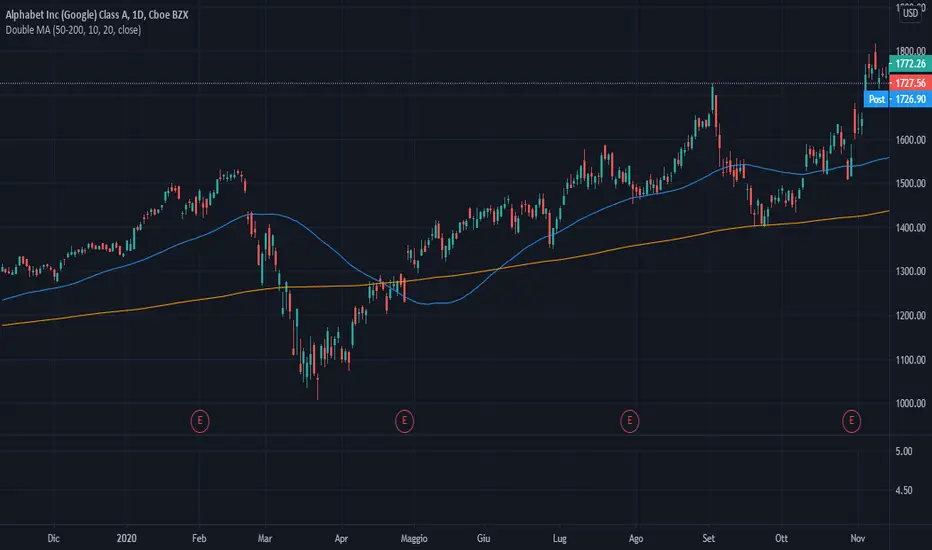
Double Moving AverageWith this script you can view TWO moving average with ONE indicator (really helpful if you have the limit of four indicator in the chart).
It is very simple to use:
1) In "Preset" you can choose between three standard pairs (7-21, 11-22, 50-200) or "Custom".
2) The parameters "Custom M1" and "Custom M2" only work if "Custom Preset" is selected, otherwise they are IGNORED.
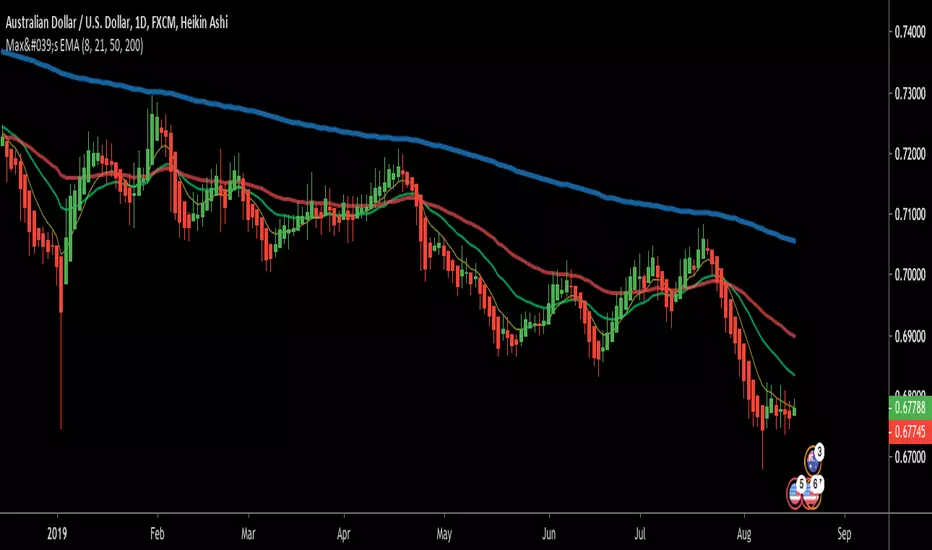
ASFX EMAs, ADR, Asian Range, and Pivot PointsThis indicator combines the essential indicators that ASFX traders use, including the EMAs (8, 21, 50, 200, 800), the Average Daily Range, the Asian Range, and the Pivot Points.
The EMAs should be used as dynamic supports and resistances. We could use it to find entries like when there is a bullish engulfing coming off the 21 EMA.
The Average Daily Range tells us the how many pips the pair moves on average. We could use it to measure risk/reward ratios or see it as another resistance.
The Asian Range is displayed as two lines indicating the Asian Session's High and Low. This could help us to determine whether the pair is ready for a breakout. We might avoid setups that are still in the Asian Range as the pair might still be indecisive.
The Pivot Points are also another form of support and resistance which are calculated using the previous day's data. The Pivot Points displayed in this indicator only include the Pivot, R1, R2, R3, S1, S2, S3. (R4, R5, S4, S5 are not included)
All of these indicators should give us a read of the trend. If the EMAs are beautifully fanned out with the 8 EMA on the top and the 800 EMA on the bottom and the price is above the Asian Range and the Pivot, we might keep an eye for a long entry.


Multi EMA+SMAMulti EMA+SMA with default value of 20/50/200 ... User can change value and color as required... As ema and sma both has same value thats why only three lines are visible, changing value will reflect other Moving averages. Hope it will help my trader friends.
Love
Indyan...

MA 10,20,50,200Indicator consist of moving averages (MA).
This indicator make it easier for me to switch between few MA lines.
1. MA10
- used for intraday.
2. MA50 and Ichimoku
- to analyze swing trend
- display only MA50 and ichimoku cloud
3. MA20, MA50 and MA200
- to analyze the trend
- for swing trade
4. Lines 52 Week High / Low
- display both lines as guide when trading
Strategy VS Buy & HoldSUMMARY:
A strategy wrapper that makes a detailed and visual comparison between a given strategy and the buy & hold returns of the traded security.
DESCRIPTION:
TradingView has a "Buy & Hold Return" metric in the strategy tester that is often enough to assess how our strategy compares to a simple buy hold. However, one may want more information on how and when your strategy beats or is beaten by a simple buy & hold strategy. This script aims to show such detail by providing a more comprehensive metrics and charting the profit/loss of the given strategy against buy & hold.
As seen in the script, it plots/draws 4 elements:
1) Strategy P/L: strategy net profit + strategy open profit
2) Buy & Hold P/L: unrealized return
3) Difference: Strategy P/L - Buy & Hold P/L
4) Strategy vs Buy Hold Stats
> Percent of bars strategy P/L is above Buy & Hold
> Percent of bars strategy P/L is below Buy & Hold
> All Time Average Difference
ADJUSTABLE PARAMETERS:
All labels/panels can be disabled by unchecking these two options:
>bnh_info_panel = input(true, title='Enable Info Panel')
>bnh_indicator_panel = input(true, title='Enable Indicator Panel')
Comparison Date Range can be changed to better isolate specific areas:
>From Year, From Month, From Day
default: 1970 01 01
>To Year, To Month, To Day
default: 2050 12 31
Default settings basically covers all historical data.
HOW TO USE:
The default script contains a simple 50-200 SMA cross strategy, just delete and replace it. Those are everything between these lines:
/////////////////////////////////////////////////////////////////////////////////////
//////////////////////////////STRATEGY SCRIPT START//////////////////////////////////
(STRATEGY SCRIPT GOES HERE)
//////////////////////////////STRATEGY SCRIPT END////////////////////////////////////
/////////////////////////////////////////////////////////////////////////////////////
Removing all plots and drawings from your strategy is advisable.
If you are going to use the Comparison Date Range, apply "bnh_timeCond" to your strategy to align the dates. A sample on how it’s applied can be seen on the Placeholder MA cross strategy.
Note: bnh_timeCond returns a boolean series

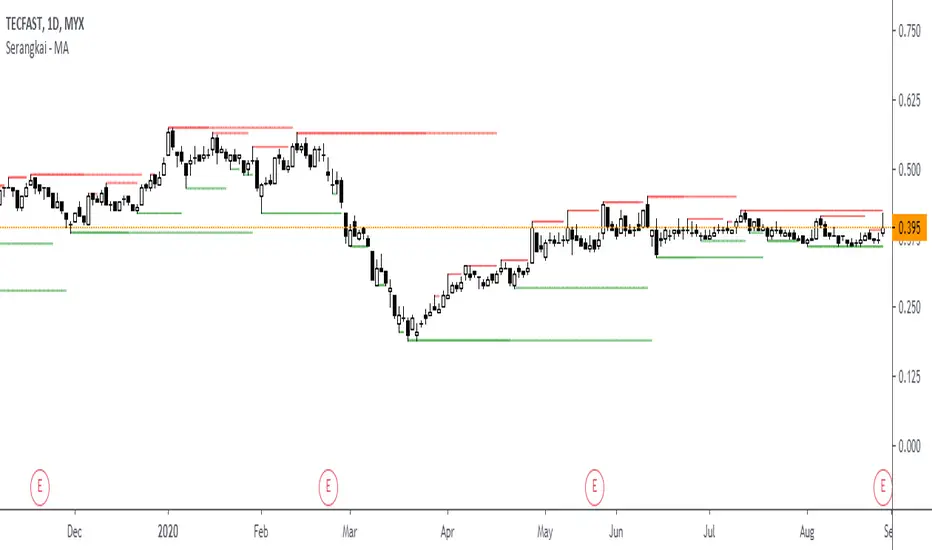
Golden Ratio Fibonacci Multipliers Top Detector [UO]Fibonacci levels that show the critical top and bottom levels. There is no way to miss the top and bottom. And a top detector.
Also the most important SMA lines (SMA 50, 200), EMA21. Those are the most frequently used lines by traders.
This indicator is based on the work of www.tradingview.com
His work set me thinking. Could I also see the bottom using Fibonacci numbers? Yes, of course.
My favorite timeframes with this indicator are 6H, 1D, 3D.
Intensively used for BTC and BNB. And useful for any other coin.


Krown EMA MA ComboThis is a copy of the ema ma combo that changes the 50ema to 55 ema and the thickness of the simple 50, 200, and 377 go from least thick to most thick in red.
Uzbekinvest 20-50-200 EMA Swing Trading Strategy in 15 min timefI made some little changes to Philakone's EMA trading strategy. I just adjusted to myself to get signals earlier than originally made.

EMA's 5/20/50/200For those who want to use multiple EMA's in a single indicator.
You can also change ema by just editing in pine editor.
For example:
open pine editor and then just alter => "short = ema(close, 5)" to "short = ema(close, 6)"
By doing this your short ema will be changed at your desire.
Just like this you can increase more ema in your script.
For any help you can pm me :)


Daily Moving Averages(10,20,50,200)This is a simple script displaying the common daily moving averages I use:
the 10dma, 50dma, 200dma, and an optional 20dma.


Fx220 EMAFx220 NATION! Welcome. Here's a script to add the 50 / 200 EMAs without altering any settings! Enjoy - Brian

Fx220 EMAFx220 NATION! Welcome. Here's a script to add the 50 / 200 EMAs without altering any settings! Enjoy - Brian

