15-Min Chart, 7-Day High-Low SignalThis is a updated script to check for variances above 5% on buy and sell signals. This will help with mean reversion. Test before buying.
In den Scripts nach "机械革命无界15+时不时闪屏" suchen

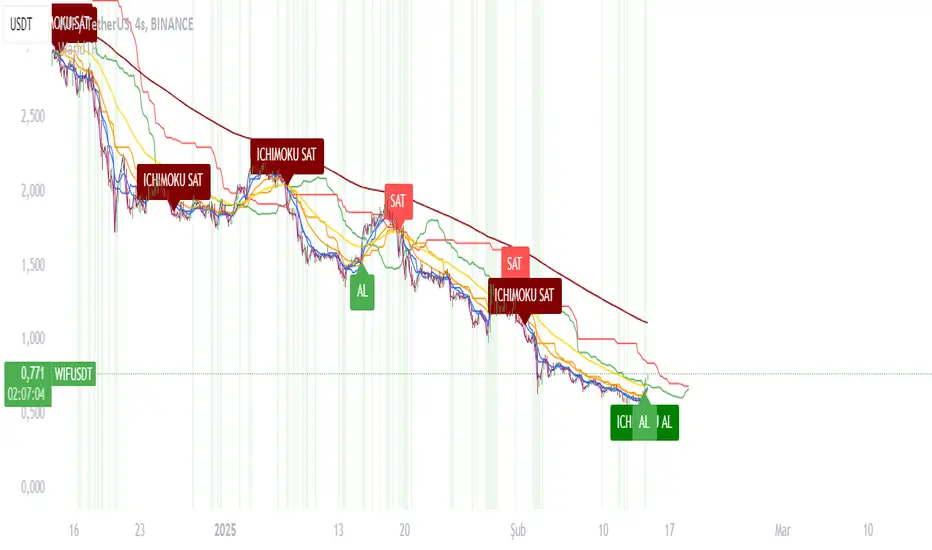
WaridTR15 Dakika ve Üzeri Periyotlar İçin Önerilen Ayarlar:
EMA Uzunlukları:
Kısa EMA: 9 yerine 12 veya 14 kullanılabilir.
Uzun EMA: 21 yerine 26 veya 50 kullanılabilir.
Golden Cross için 50 EMA ve 200 EMA zaten uzun vadeli trendleri yakalar, bu nedenle değiştirmeye gerek yok.
RSI Uzunluğu:
RSI uzunluğu 14 yerine 21 veya 28 yapılabilir. Bu, daha uzun vadeli aşırı alım/aşırı satım bölgelerini daha doğru tespit eder.
Volume Filtresi:
Volume ortalaması için 20 periyot yerine 50 veya 100 periyot kullanılabilir. Bu, daha uzun vadeli hacim eğilimlerini yakalar.
Ichimoku Parametreleri:
Ichimoku, varsayılan olarak 9-26-52 periyotlarıyla çalışır. Bu, zaten uzun vadeli trendleri yakalamak için uygundur. Ancak, daha uzun periyotlar için:
Tenkan-Sen: 9 yerine 14.
Kijun-Sen: 26 yerine 52.
Senkou Span B: 52 yerine 104.
15 Minute Touch or Not TouchBuy Condition:
The trend is up
A candle forms below the White line without touching it (or only the wick touches).
The next candle forms above the White line without touching it.
A buy signal is generated on the next candle.
Sell Condition:
The trend is down
A candle forms above the White line without touching it (or only the wick touches).
The next candle forms below the White line without touching it.
A sell signal is generated on the next candle

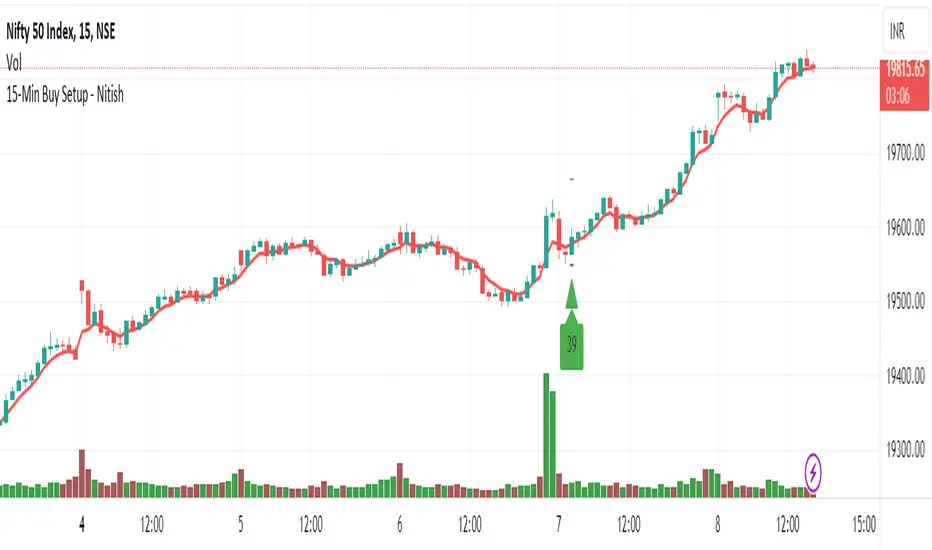
15-Min Buy Setup - NitishThis code generates a buy signal when all four conditions are met:
The candles should be below the EMA5 line.
The signal generating candle’s previous candle should have the high to EMA5 gap of not less than 0.01%.
The signal generating candle’s volume should not be less than 90% of its previous candle.
The signal generating candle should close above the EMA5 line with a gap of at least 0.01%.
The stop loss is set at the low of the previous three candles and current candle only when a buy signal is generated. The entry price is calculated when a buy signal is generated and the distance between entry price and stop loss is used to calculate the take profit distance and level.
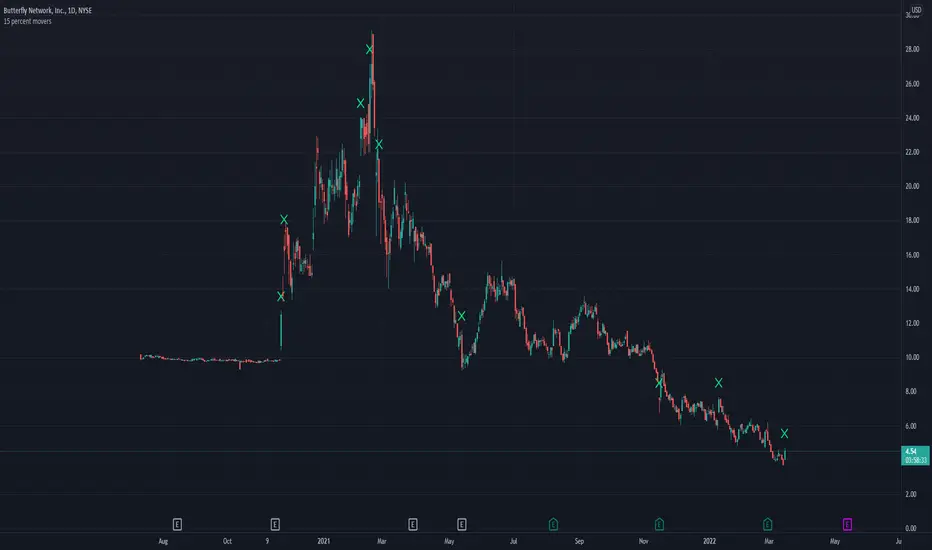
15 percent moversshows 15% movers by comparing the previous day's close with the most recent close. This is a simple script for visualization.
multi MA by Liquidator15 MA in a single indicator script.
7 different MA types:
- SMMA
- EMA
- SMA
- MG
- TMA
- DCF
- LSMA
multi timeframe.


15 Minute Gold Trend-Following StrategyThis is the main strategy that I will be forward testing on demo for a month or two, then making it an EA in MetaTrader4
You can see the code for yourself this time, all the strategy is, is a crossover of various moving averages.
Commission included, $10,000 account.
Results over the past 3 months, beginning in January 2017.

Momentum by Trading BiZonesSqueeze Momentum Indicator with EMA
Overview
The Squeeze Momentum Indicator with EMA is a powerful technical analysis tool that combines the original Squeeze Momentum concept with an Exponential Moving Average (EMA) overlay. This enhanced version helps traders identify market momentum, volatility contractions (squeezes), and potential trend reversals with greater precision.
Core Concept
The indicator operates on the principle of volatility contraction and expansion:
Squeeze Phase: When Bollinger Bands move inside the Keltner Channel, indicating low volatility and potential energy buildup
Expansion Phase: When momentum breaks out of the squeeze, signaling potential directional moves
Key Components
1. Squeeze Momentum Calculation
Formula: Momentum = Linear Regression(Close - Average Price)
Where Average Price = (Highest High + Lowest Low + SMA(Close)) / 3
Visualization: Histogram bars showing positive (green) and negative (red) momentum
Zero Line: Represents equilibrium point between buyers and sellers
2. EMA Overlay
Purpose: Smooths momentum values to identify underlying trends
Customization:
Adjustable period (default: 20)
Toggle on/off display
Customizable color and line thickness
Cross Signals: Buy/sell signals when momentum crosses above/below EMA
3. Volatility Bands
Bollinger Bands (20-period, 2 standard deviations)
Keltner Channels (20-period, 1.5 ATR multiplier)
Squeeze Detection: Visual background shading when BB are inside KC
Trading Signals
Buy Signals (Green Upward Triangle)
Momentum histogram crosses ABOVE EMA line
Occurs during or after squeeze release
Confirmed by expanding histogram bars
Sell Signals (Red Downward Triangle)
Momentum histogram crosses BELOW EMA line
Often precedes market downturns
Watch for increasing negative momentum
Squeeze Warnings (Gray Background)
Market in low volatility state
Prepare for potential breakout
Direction indicated by momentum bias
Indicator Settings
Main Parameters
Length: Period for calculations (default: 20)
Show EMA: Toggle EMA visibility
EMA Period: Smoothing period for EMA
Visual Settings
Histogram color-coding based on momentum direction
EMA line color and thickness
Signal marker size and visibility
Squeeze zone background display
Practical Applications
Trend Identification
Uptrend: Consistently positive momentum with EMA support
Downtrend: Consistently negative momentum with EMA resistance
Range-bound: Oscillating around zero line
Entry/Exit Points
Conservative Entry: Wait for squeeze release + EMA crossover
Aggressive Entry: Anticipate breakout during squeeze
Exit: Opposite crossover or momentum divergence
Risk Management
Use squeeze zones as warning periods
EMA crossovers as confirmation signals
Combine with support/resistance levels
Advanced Interpretation
Momentum Strength
Strong Bullish: Tall green bars above EMA
Weak Bullish: Short green bars near EMA
Strong Bearish: Tall red bars below EMA
Weak Bearish: Short red bars near EMA
Divergence Detection
Price makes higher high, momentum makes lower high → Bearish divergence
Price makes lower low, momentum makes higher low → Bullish divergence
Squeeze Characteristics
Long squeezes: More potential energy
Frequent squeezes: Choppy market conditions
No squeezes: High volatility, trending markets
Recommended Timeframes
Scalping: 1-15 minute charts
Day Trading: 15-minute to 4-hour charts
Swing Trading: 4-hour to daily charts
Position Trading: Daily to weekly charts
Best Practices
Confirmation
Use with volume indicators
Check higher timeframe direction
Wait for candle close confirmation
Filtering Signals
Ignore signals during extreme volatility
Require minimum bar size for crossovers
Consider market context (news, sessions)
Combination Suggestions
With RSI: Confirm overbought/oversold conditions
With Volume Profile: Identify high-volume nodes
With Support/Resistance: Key level reactions
With Trend Lines: Breakout confirmations
Limitations
Lagging indicator (based on past data)
Works best in trending markets
May give false signals in ranging markets
Requires proper risk management
Conclusion
The Squeeze Momentum Indicator with EMA provides a comprehensive view of market dynamics by combining volatility analysis, momentum measurement, and trend smoothing. Its visual clarity and customizable parameters make it suitable for traders of all experience levels seeking to identify high-probability trading opportunities during volatility contractions and expansions.

Trend Following $ZEC - Multi-Timeframe Structure Filter + Revers# Trend Following CRYPTOCAP:ZEC - Strategy Guide
## 📊 Strategy Overview
Trend Following CRYPTOCAP:ZEC is an enhanced Turtle Trading system designed for cryptocurrency spot trading, combining Donchian Channel breakouts, multi-timeframe structure filtering, and ATR-based dynamic risk management for both long and short positions.
---
## 🎯 Core Features
1. Multi-Timeframe Structure Filtering
- Uses Swing High/Low to identify market structure
- Customizable structure timeframe (default: 1 minute)
- Only enters trades in the direction of the trend, avoiding counter-trend positions
2. Reverse Signal Exit
- No fixed stop-loss or fixed-period exits
- Exits only when a reverse entry signal triggers
- Maximizes trend profits, reduces premature exits
3. ATR Dynamic Pyramiding
- Adds positions when price moves 0.5 ATR in favorable direction
- Supports up to 2 units maximum (adjustable)
- Pyramid scaling to enhance profitability
4. Complete Risk Management
- Fixed position size (5000 USD per unit)
- Commission fee 0.06% (Binance spot rate)
- Initial capital 10,000 USD
---
## 📈 Trading Logic
Entry Conditions
✅ Long Entry:
- Close price breaks above 20-period high
- Structure trend is bullish (price breaks above Swing High)
✅ Short Entry:
- Close price breaks below 20-period low
- Structure trend is bearish (price breaks below Swing Low)
Add Position Conditions
- Long: Price rises ≥ 0.5 ATR
- Short: Price falls ≥ 0.5 ATR
- Maximum 2 units including initial entry
Exit Conditions
- Long Exit: When short entry signal triggers (price breaks 20-period low + structure turns bearish)
- Short Exit: When long entry signal triggers (price breaks 20-period high + structure turns bullish)
---
## ⚙️ Parameter Settings
Channel Settings
- Entry Channel Period: 20 (Donchian Channel breakout period)
- Exit Channel Period: 10 (reserved parameter, actually uses reverse signal exit)
ATR Settings
- ATR Period: 20
- Stop Loss ATR Multiplier: 2.0 (reserved parameter)
- Add Position ATR Multiplier: 0.5
Structure Filter
- Swing Length: 160 (Swing High/Low calculation period)
- Structure Timeframe: 1 minute (can change to 5/15/60, etc.)
Position Management
- Maximum Units: 2 (including initial entry)
- Capital Per Unit: 5000 USD
---
## 🎨 Visualization Features
Background Colors
- Light Green: Bullish structure
- Light Red: Bearish structure
- Dark Green: Long entry
- Dark Red: Short entry
Optional Display (Default: OFF)
- Entry/exit channel lines
- Structure high/low lines
- ATR stop-loss line
- Next add position indicator
- Entry/exit labels
---
## 📱 Alert Message Format
Strategy sends notifications on entry/exit with the following format:
- Entry: `1m Long EP:428.26`
- Add Position: `15m Add Long 2/2 EP:429.50`
- Exit: `1m Close Long Reverse Signal`
Where:
- `1m`/`15m` = Current chart timeframe
- `EP` = Entry Price
---
## 💰 Backtest Settings
Capital Allocation
- Initial Capital: 10,000 USD
- Per Entry: 5,000 USD (split into 2 entries)
- Leverage: 0x (spot trading)
Trading Costs
- Commission: 0.06% (Binance spot VIP0)
- Slippage: 0
---
## 🎯 Use Cases
✅ Best Scenarios
- Trending markets
- Moderate volatility assets
- 1-minute to 4-hour timeframes
⚠️ Not Suitable For
- Highly volatile choppy markets
- Low liquidity small-cap coins
- Extreme market conditions (black swan events)
---
## 📊 Usage Recommendations
Timeframe Suggestions
| Timeframe | Trading Style | Suggested Parameter Adjustment |
|-----------|--------------|-------------------------------|
| 1-5 min | Scalping | Swing Length 100-160 |
| 15-30 min | Short-term | Swing Length 50-100 |
| 1-4 hour | Swing Trading | Swing Length 20-50 |
Optimization Tips
1. Adjust swing length based on backtest results
2. Different coins may require different parameters
3. Recommend backtesting on 1-minute chart first before live trading
4. Enable labels to observe entry/exit points
---
## ⚠️ Risk Disclaimer
1. Past Performance Does Not Guarantee Future Results
- Backtest data is for reference only
- Live trading may be affected by slippage, delays, etc.
2. Market Condition Changes
- Strategy performs better in trending markets
- May experience frequent stops in ranging markets
3. Capital Management
- Do not invest more than you can afford to lose
- Recommend setting total capital stop-loss threshold
4. Commission Impact
- Frequent trading accumulates commission fees
- Recommend using exchange discounts (BNB fee reduction, etc.)
---
## 🔧 Troubleshooting
Q: No entry signals?
A: Check if structure filter is too strict, adjust swing length or timeframe
Q: Too many labels displayed?
A: Turn off "Show Labels" option in settings
Q: Poor backtest performance?
A:
1. Check if the coin is suitable for trend-following strategies
2. Adjust parameters (swing length, channel period)
3. Try different timeframes
Q: How to set alerts?
A:
1. Click "Alert" in top-right corner of chart
2. Condition: Select "Strategy - Trend Following CRYPTOCAP:ZEC "
3. Choose "Order filled"
4. Set notification method (Webhook/Email/App)
---
## 📞 Contact Information
Strategy Name: Trend Following CRYPTOCAP:ZEC
Version: v1.0
Pine Script Version: v6
Last Updated: December 2025
---
## 📄 Copyright Notice
This strategy is for educational and research purposes only.
All risks of using this strategy for live trading are borne by the user.
Commercial use without authorization is prohibited.
---
## 🎓 Learning Resources
To understand the strategy principles in depth, recommended reading:
- "The Complete TurtleTrader" - Curtis Faith
- "Trend Following" - Michael Covel
- TradingView Pine Script Official Documentation
---
Happy Trading! Remember to manage your risk 📈

MoneyLine CypherMoneyLine Cipher - Adaptive Trend-Following Signal System
MoneyLine Cipher decodes market structure by fusing multiple technical indicators into a unified signal system with intelligent threshold adaptation. The indicator automatically adjusts its sensitivity based on trend conditions, making it harder to buy in downtrends and harder to sell in uptrends - letting winners run while protecting capital during adverse conditions.
━━━━━━━━━━━━━━━━━━━━━━━━━━━━━━━━━━━━━━━━━━━━━━━━━━━━
CORE COMPONENTS
The MoneyLine
The foundation is a 16-period linear regression line that serves as a dynamic mean. Price oscillates around this line, and the slope determines the visual color coding: green for bullish slope, red for bearish, yellow for neutral/flat conditions.
Grok Dynamic Bands
ATR-based envelope bands surround the MoneyLine. When ADX exceeds the threshold (default 22), the bands automatically widen using a multiplier that scales with trend strength. Base multiplier is 1.8x ATR, expanding up to 2.8x during strong trends. This prevents premature signals during powerful directional moves.
━━━━━━━━━━━━━━━━━━━━━━━━━━━━━━━━━━━━━━━━━━━━━━━━━━━━
TREND STATE ENGINE
MoneyLine Cipher classifies market conditions into five trend states using a combination of DI spread, ADX strength, and OBV confirmation.
The DI spread (Plus DI minus Minus DI) determines directional bias. When the spread exceeds +10 with ADX above 20 and bullish OBV confirmation, the market is classified as STRONG UPTREND. A spread between +5 and +10 indicates UPTREND. The reverse applies for downtrends. Spreads between -5 and +5 are NEUTRAL.
This trend state classification drives all dynamic threshold adjustments throughout the indicator.
━━━━━━━━━━━━━━━━━━━━━━━━━━━━━━━━━━━━━━━━━━━━━━━━━━━━
DYNAMIC THRESHOLDS
The key innovation of MoneyLine Cipher is that buy and sell thresholds adapt based on the current trend state.
Fisher Transform Thresholds
In a STRONG UPTREND, the Fisher buy threshold relaxes to -1.0 (easier to trigger) while the sell threshold tightens to 2.5 (harder to trigger). This lets you accumulate during strength and hold winners longer. In a STRONG DOWNTREND, the opposite occurs: buy threshold tightens to -2.5 (requiring extreme oversold) while sell threshold relaxes to 1.0 (quick exits). NEUTRAL conditions use base thresholds of -1.8 for buys and 1.8 for sells.
Aroon Thresholds
Aroon Up and Aroon Down thresholds follow the same adaptive logic. During uptrends, buy conditions become easier to meet while sell conditions become stricter. During downtrends, the system becomes defensive - demanding stronger oversold readings before allowing buys.
━━━━━━━━━━━━━━━━━━━━━━━━━━━━━━━━━━━━━━━━━━━━━━━━━━━━
SIGNAL GENERATION
Buy signals trigger when Fisher is below the dynamic buy threshold AND Aroon conditions are met, OR when price touches the lower band. Sell signals trigger when Fisher exceeds the dynamic sell threshold AND Aroon conditions are met, OR when price touches the upper band.
Signals are displayed as labels showing the entry price and buy count (e.g., "BUY 2/3: 89,450.00").
━━━━━━━━━━━━━━━━━━━━━━━━━━━━━━━━━━━━━━━━━━━━━━━━━━━━
CASCADE PROTECTION SYSTEM
Two layers of protection prevent catastrophic drawdowns during volatile conditions.
BBWP Freeze
Bollinger Band Width Percentile measures volatility expansion relative to recent history. When BBWP exceeds 92%, ALL buy signals are frozen. This prevents averaging down during volatility spikes that often precede major crashes. The info panel displays BBWP status with OK (green) or FROZEN (red).
Consecutive Buy Limit
The system tracks how many buys have occurred without an intervening sell. Default maximum is 3 consecutive buys. Once reached, additional buys are blocked until a sell resets the counter. This prevents unlimited averaging down into a falling knife. The info panel shows the current count (e.g., "2/3").
━━━━━━━━━━━━━━━━━━━━━━━━━━━━━━━━━━━━━━━━━━━━━━━━━━━━
EXTREME MOVE DETECTION
When price penetrates beyond the bands by more than 0.6x ATR (configurable), an EXTREME signal fires. These signals have special properties.
Extreme signals can bypass the normal cooldown period, allowing rapid response to flash crashes or spikes. They can optionally bypass the BBWP freeze (though the consecutive buy counter still applies). Extreme signals fire intra-bar when the threshold is hit, catching wick reversals before candle close.
EXTREME BUY labels appear in cyan. EXTREME SELL labels appear in fuchsia.
━━━━━━━━━━━━━━━━━━━━━━━━━━━━━━━━━━━━━━━━━━━━━━━━━━━━
RSI DIVERGENCE DETECTION
The indicator automatically detects four types of RSI divergence.
Regular Bullish Divergence occurs when price makes a lower low but RSI makes a higher low - suggesting weakening selling pressure and potential reversal up.
Hidden Bullish Divergence occurs when price makes a higher low but RSI makes a lower low - suggesting trend continuation in an uptrend.
Regular Bearish Divergence occurs when price makes a higher high but RSI makes a lower high - suggesting weakening buying pressure and potential reversal down.
Hidden Bearish Divergence occurs when price makes a lower high but RSI makes a higher high - suggesting trend continuation in a downtrend.
Divergences are marked with small diamond shapes: cyan for regular divergences, purple for hidden divergences. Optional lines connect the pivot points on the price chart.
━━━━━━━━━━━━━━━━━━━━━━━━━━━━━━━━━━━━━━━━━━━━━━━━━━━━
COOLDOWN SYSTEM
After any signal fires, a configurable cooldown period (default 5 bars) prevents signal spam. This can be configured to apply after buys only, sells only, or both. Extreme signals can optionally bypass cooldown for rapid response to major moves.
━━━━━━━━━━━━━━━━━━━━━━━━━━━━━━━━━━━━━━━━━━━━━━━━━━━━
VISUAL ELEMENTS
ADX Bar
A colored dot at the bottom of each candle indicates trend state. Lime for STRONG UPTREND, blue for UPTREND, orange for NEUTRAL, red for DOWNTREND, maroon for STRONG DOWNTREND, and white for RANGING (ADX below 15). All colors are configurable.
Signal Candles
When a buy or sell signal fires, the candle turns bright blue for easy identification.
Info Panel
A compact panel in the top-right displays real-time status: current trend state, divergence detection, BBWP percentage and status, buy counter, ADX reading, Aroon values, Fisher value, cooldown status, and current dynamic thresholds for both buy and sell.
━━━━━━━━━━━━━━━━━━━━━━━━━━━━━━━━━━━━━━━━━━━━━━━━━━━━
WEBHOOK ALERTS
MoneyLine Cipher outputs JSON-formatted webhook alerts compatible with automated trading systems. Each alert includes action (BUY/SELL), symbol, price, trigger type (INDICATOR, BAND_TOUCH, EXTREME, or EXTREME_INTRABAR), current trend state, consecutive buy count, and BBWP reading.
Separate alert conditions are available for regular buys, regular sells, extreme buys, extreme sells, BBWP freeze activation, BBWP unfreeze, and max consecutive buys reached.
━━━━━━━━━━━━━━━━━━━━━━━━━━━━━━━━━━━━━━━━━━━━━━━━━━━━
RECOMMENDED SETTINGS
The default settings are optimized for 5-minute cryptocurrency charts. Key adjustable parameters include Money Line Length (16), Base ATR Multiplier (1.8), Max Multiplier for strong trends (2.8), ADX threshold for band expansion (22), minimum ADX for strong trend classification (20), BBWP freeze level (92%), maximum consecutive buys (3), cooldown period (5 bars), and extreme penetration threshold (0.6x ATR).
━━━━━━━━━━━━━━━━━━━━━━━━━━━━━━━━━━━━━━━━━━━━━━━━━━━━
PHILOSOPHY
MoneyLine Cipher embodies a core trading principle: be aggressive when conditions favor you, defensive when they don't. By automatically adapting thresholds based on trend state and implementing multiple layers of capital protection, the indicator helps traders stay on the right side of the market while avoiding the common pitfalls of averaging down into crashes or selling too early in strong trends.
The name "Cipher" reflects the indicator's purpose: decoding the complex interplay of price, momentum, trend, and volatility into clear, actionable signals.

Trend Following $BTC - Multi-Timeframe Structure + ReversTREND FOLLOWING STRATEGY - MULTI-TIMEFRAME STRUCTURE BREAKOUT SYSTEM
Strategy Overview
This is an enhanced Turtle Trading system designed for cryptocurrency spot trading. It combines Donchian Channel breakouts with multi-timeframe structure filtering and ATR-based dynamic risk management. The strategy trades both long and short positions using reverse signal exits to maximize trend capture.
Core Features
Multi-Timeframe Structure Filtering
The strategy uses Swing High/Low analysis to identify market structure trends. You can customize the structure timeframe (default: 3 minutes) to match your trading style. Only enters trades aligned with the identified trend direction, avoiding counter-trend positions that often lead to losses.
Reverse Signal Exit System
Instead of using fixed stop-losses or time-based exits, this strategy exits positions only when a reverse entry signal triggers. This approach maximizes trend profits and reduces premature exits during normal market retracements.
ATR Dynamic Pyramiding
Automatically adds positions when price moves 0.5 ATR in your favor. Supports up to 2 units maximum (adjustable). This pyramid scaling enhances profitability during strong trends while maintaining disciplined risk management.
Complete Risk Management
Fixed position sizing at 5000 USD per unit. Includes realistic commission fees of 0.06% (Binance spot rate). Initial capital set at 10,000 USD. All backtest parameters reflect real-world trading conditions.
Trading Logic
Entry Conditions
Long Entry: Close price breaks above the 20-period high AND structure trend is bullish (price breaks above Swing High)
Short Entry: Close price breaks below the 20-period low AND structure trend is bearish (price breaks below Swing Low)
Position Scaling
Long positions: Add when price rises 0.5 ATR or more
Short positions: Add when price falls 0.5 ATR or more
Maximum 2 units including initial entry
Exit Conditions
Long Exit: Triggers when short entry signal appears (price breaks 20-period low + structure turns bearish)
Short Exit: Triggers when long entry signal appears (price breaks 20-period high + structure turns bullish)
Default Parameters
Channel Settings
Entry Channel Period: 20 (Donchian Channel breakout period)
Exit Channel Period: 10 (reserved parameter)
ATR Settings
ATR Period: 20
Stop Loss ATR Multiplier: 2.0
Add Position ATR Multiplier: 0.5
Structure Filter
Swing Length: 300 (Swing High/Low calculation period)
Structure Timeframe: 3 minutes
Adjust these based on your trading timeframe and asset volatility
Position Management
Maximum Units: 2 (including initial entry)
Capital Per Unit: 5000 USD
Visualization Features
Background Colors
Light Green: Bullish market structure
Light Red: Bearish market structure
Dark Green: Long position entry
Dark Red: Short position entry
Optional Display Elements (Default: OFF)
Entry and exit channel lines
Structure high/low reference lines
ATR stop-loss indicator
Next position add level
Entry/exit labels
Alert Message Format
The strategy sends notifications with the following format:
Entry: "5m Long EP:90450.50"
Add Position: "15m Add Long 2/2 EP:91000.25"
Exit: "5m Close Long Reverse Signal"
Where the first part shows your current chart timeframe and EP indicates Entry Price
Backtest Settings
Capital Allocation
Initial Capital: 10,000 USD
Per Entry: 5,000 USD (split into 2 potential entries)
Leverage: 0x (spot trading only)
Trading Costs
Commission: 0.06% (Binance spot VIP0 rate)
Slippage: 0 (adjust based on your experience)
Best Use Cases
Ideal Scenarios
Trending markets with clear directional movement
Moderate to high volatility assets
Timeframes from 1-minute to 4-hour charts
Best suited for major cryptocurrencies with good liquidity
Not Recommended For
Highly volatile choppy/ranging markets
Low liquidity small-cap coins
Extreme market conditions or black swan events
Usage Recommendations
Timeframe Guidelines
1-5 minute charts: Use for scalping, consider Swing Length 100-160
15-30 minute charts: Good for short-term trading, Swing Length 50-100
1-4 hour charts: Suitable for swing trading, Swing Length 20-50
Optimization Tips
Always backtest on historical data before live trading
Adjust swing length based on asset volatility and your timeframe
Different cryptocurrencies may require different parameter settings
Enable visualization options initially to understand entry/exit points
Monitor win rate and drawdown during backtesting
Technical Details
Built on Pine Script v6
No repainting - uses proper bar referencing with offset
Prevents lookahead bias with lookahead=off parameter
Strategy mode with accurate commission and slippage modeling
Multi-timeframe security function for structure analysis
Proper position state tracking to avoid duplicate signals
Risk Disclaimer
This strategy is provided for educational and research purposes only. Past performance does not guarantee future results. Backtesting results may differ from live trading due to slippage, execution delays, and changing market conditions. The strategy performs best in trending markets and may experience drawdowns during ranging conditions. Always practice proper risk management and never risk more than you can afford to lose. It is recommended to paper trade first and start with small position sizes when going live.
How to Use
Add the strategy to your TradingView chart
Select your desired timeframe (1m to 4h recommended)
Adjust parameters based on your risk tolerance and trading style
Review backtest results in the Strategy Tester tab
Set up alerts for automated notifications
Consider paper trading before risking real capital
Tags
Trend Following, Turtle Trading, Donchian Channel, Structure Breakout, ATR, Cryptocurrency, Spot Trading, Risk Management, Pyramiding, Multi-Timeframe Analysis
---
Strategy Name: Trend Following BTC
Version: v1.0
Pine Script Version: v6
Last Updated: December 2025

Quarterly Cycle Theory with DST time AdjustedThe Quarterly Theory removes ambiguity, as it gives specific time-based reference points to look for when entering trades. Before being able to apply this theory to trading, one must first understand that time is fractal:
Yearly Quarters = 4 quarters of three months each.
Monthly Quarters = 4 quarters of one week each.
Weekly Quarters = 4 quarters of one day each (Monday - Thursday). Friday has its own specific function.
Daily Quarters = 4 quarters of 6 hours each = 4 trading sessions of a trading day.
Sessions Quarters = 4 quarters of 90 minutes each.
90 Minute Quarters = 4 quarters of 22.5 minutes each.
Yearly Cycle: Analogously to financial quarters, the year is divided in four sections of three months each:
Q1 - January, February, March.
Q2 - April, May, June (True Open, April Open).
Q3 - July, August, September.
Q4 - October, November, December.
S&P 500 E-mini Futures (daily candles) — Monthly Cycle.
Monthly Cycle: Considering that we have four weeks in a month, we start the cycle on the first month’s Monday (regardless of the calendar Day):
Q1 - Week 1: first Monday of the month.
Q2 - Week 2: second Monday of the month (True Open, Daily Candle Open Price).
Q3 - Week 3: third Monday of the month.
Q4 - Week 4: fourth Monday of the month.
S&P 500 E-mini Futures (4 hour candles) — Weekly Cycle.
Weekly Cycle: Daye determined that although the trading week is composed by 5 trading days, we should ignore Friday, and the small portion of Sunday’s price action:
Q1 - Monday.
Q2 - Tuesday (True Open, Daily Candle Open Price).
Q3 - Wednesday.
Q4 - Thursday.
S&P 500 E-mini Futures (1 hour candles) — Daily Cycle.
Daily Cycle: The Day can be broken down into 6 hour quarters. These times roughly define the sessions of the trading day, reinforcing the theory’s validity:
Q1 - 18:00 - 00:00 Asia.
Q2 - 00:00 - 06:00 London (True Open).
Q3 - 06:00 - 12:00 NY AM.
Q4 - 12:00 - 18:00 NY PM.
S&P 500 E-mini Futures (15 minute candles) — 6 Hour Cycle.
6 Hour Quarters or 90 Minute Cycle / Sessions divided into four sections of 90 minutes each (EST/EDT):
Asian Session
Q1 - 18:00 - 19:30
Q2 - 19:30 - 21:00 (True Open)
Q3 - 21:00 - 22:30
Q4 - 22:30 - 00:00
London Session
Q1 - 00:00 - 01:30
Q2 - 01:30 - 03:00 (True Open)
Q3 - 03:00 - 04:30
Q4 - 04:30 - 06:00
NY AM Session
Q1 - 06:00 - 07:30
Q2 - 07:30 - 09:00 (True Open)
Q3 - 09:00 - 10:30
Q4 - 10:30 - 12:00
NY PM Session
Q1 - 12:00 - 13:30
Q2 - 13:30 - 15:00 (True Open)
Q3 - 15:00 - 16:30
Q4 - 16:30 - 18:00
S&P 500 E-mini Futures (5 minute candles) — 90 Minute Cycle.
Micro Cycles: Dividing the 90 Minute Cycle yields 22.5 Minute Quarters, also known as Micro Sessions or Micro Quarters:
Asian Session
Q1/1 18:00:00 - 18:22:30
Q2 18:22:30 - 18:45:00
Q3 18:45:00 - 19:07:30
Q4 19:07:30 - 19:30:00
Q2/1 19:30:00 - 19:52:30 (True Session Open)
Q2/2 19:52:30 - 20:15:00
Q2/3 20:15:00 - 20:37:30
Q2/4 20:37:30 - 21:00:00
Q3/1 21:00:00 - 21:23:30
etc. 21:23:30 - 21:45:00
London Session
00:00:00 - 00:22:30 (True Daily Open)
00:22:30 - 00:45:00
00:45:00 - 01:07:30
01:07:30 - 01:30:00
01:30:00 - 01:52:30 (True Session Open)
01:52:30 - 02:15:00
02:15:00 - 02:37:30
02:37:30 - 03:00:00
03:00:00 - 03:22:30
03:22:30 - 03:45:00
03:45:00 - 04:07:30
04:07:30 - 04:30:00
04:30:00 - 04:52:30
04:52:30 - 05:15:00
05:15:00 - 05:37:30
05:37:30 - 06:00:00
New York AM Session
06:00:00 - 06:22:30
06:22:30 - 06:45:00
06:45:00 - 07:07:30
07:07:30 - 07:30:00
07:30:00 - 07:52:30 (True Session Open)
07:52:30 - 08:15:00
08:15:00 - 08:37:30
08:37:30 - 09:00:00
09:00:00 - 09:22:30
09:22:30 - 09:45:00
09:45:00 - 10:07:30
10:07:30 - 10:30:00
10:30:00 - 10:52:30
10:52:30 - 11:15:00
11:15:00 - 11:37:30
11:37:30 - 12:00:00
New York PM Session
12:00:00 - 12:22:30
12:22:30 - 12:45:00
12:45:00 - 13:07:30
13:07:30 - 13:30:00
13:30:00 - 13:52:30 (True Session Open)
13:52:30 - 14:15:00
14:15:00 - 14:37:30
14:37:30 - 15:00:00
15:00:00 - 15:22:30
15:22:30 - 15:45:00
15:45:00 - 15:37:30
15:37:30 - 16:00:00
16:00:00 - 16:22:30
16:22:30 - 16:45:00
16:45:00 - 17:07:30
17:07:30 - 18:00:00
S&P 500 E-mini Futures (30 second candles) — 22.5 Minute Cycle.

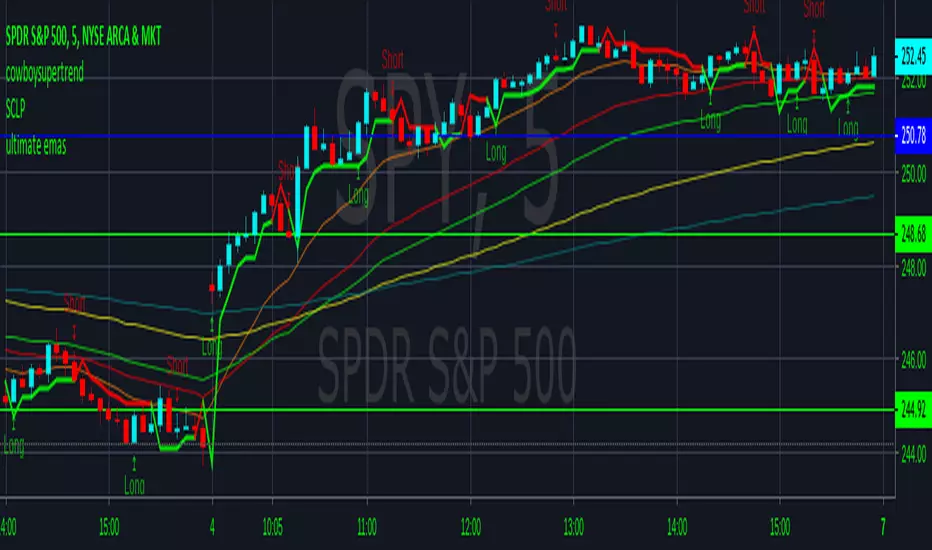
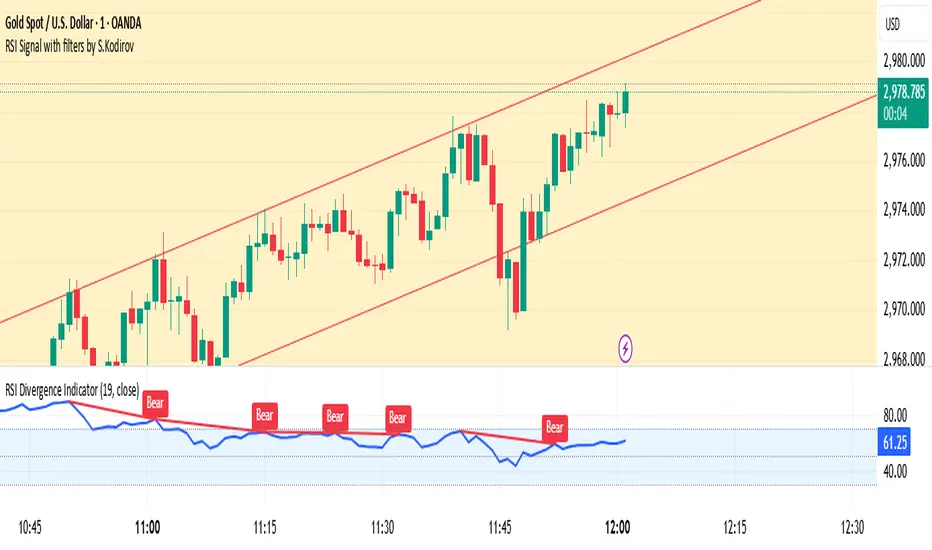
RSI Signal with filters by S.Kodirov📌 English
RSI Signal with Multi-Timeframe Filters
This TradingView indicator generates RSI-based buy and sell signals on the 15-minute timeframe with additional filtering from other timeframes (5M, 30M, 1M).
🔹 Signal Types:
✅ 15/5B & 15/5S – RSI 15M filtered by 5M
✅ 15/30/1B & 15/30/1S – RSI 15M filtered by 30M & 1M
✅ 15B & 15S – RSI 15M without filters
🔹 How It Works:
Signals are displayed as colored triangles on the chart.
Labels indicate the type of signal (e.g., 15/5B, 15S).
Alerts notify users when a signal appears.
🚀 Best for short-term trading with RSI confirmation from multiple timeframes!
📌 Русский
Индикатор RSI с мульти-таймфрейм фильтрами
Этот индикатор для TradingView генерирует сигналы покупки и продажи на 15-минутном таймфрейме, используя фильтрацию с других таймфреймов (5M, 30M, 1M).
🔹 Типы сигналов:
✅ 15/5B & 15/5S – RSI 15M с фильтром 5M
✅ 15/30/1B & 15/30/1S – RSI 15M с фильтрами 30M и 1M
✅ 15B & 15S – RSI 15M без фильтров
🔹 Как это работает:
Сигналы отображаются как цветные треугольники на графике.
Подписи показывают тип сигнала (например, 15/5B, 15S).
Алерты уведомляют трейдера о появлении сигнала.
🚀 Идеально для краткосрочной торговли с подтверждением RSI на нескольких таймфреймах!
📌 O'zbekcha
Ko'p vaqt oralig‘idagi RSI signallari
Ushbu TradingView indikatori 15 daqiqalik vaqt oralig‘ida RSI asosida sotib olish va sotish signallarini yaratadi. Bundan tashqari, boshqa vaqt oralig‘idagi (5M, 30M, 1M) RSI filtrlarini ham hisobga oladi.
🔹 Signal turlari:
✅ 15/5B & 15/5S – 5M bilan filtrlangan RSI 15M
✅ 15/30/1B & 15/30/1S – 30M va 1M bilan filtrlangan RSI 15M
✅ 15B & 15S – Filtrsiz RSI 15M
🔹 Qanday ishlaydi?
Signallar rangli uchburchaklar shaklida ko‘rsatiladi.
Yozuvlar signal turini ko‘rsatadi (masalan, 15/5B, 15S).
Xabarnomalar yangi signal paydo bo‘lganda treyderni ogohlantiradi.
🚀 Ko‘p vaqt oralig‘ida RSI tasdig‘i bilan qisqa muddatli savdo uchun ideal!
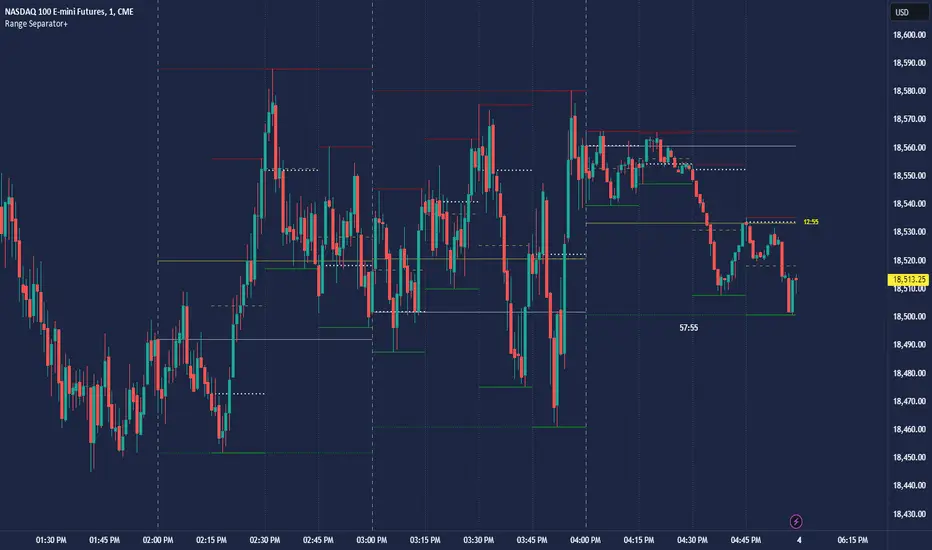
CRT Hourly/15m dividers and opensRange Separator is a unique tool designed to help traders visualize critical price levels and ranges on their charts. This script employs the innovative concepts of "Candles Are Ranges" and the "Power of 3 (PO3)" to enhance trading strategies by marking key time intervals and price levels.
What the Script Does:
Hourly Lines:
Automatically draws vertical lines at the start of each hour.
Provides an option to display only the current hour's line for a cleaner visual.
Allows customization of line color, width, and style.
15-Minute Lines:
Adds vertical lines at 15-minute intervals to highlight smaller time ranges.
Includes an option to draw horizontal lines at the 15-minute interval prices.
Offers customization for line color, width, and style.
Horizontal Lines:
Draws horizontal lines based on the opening, high, or low price of the selected timeframe.
Customizable options for line color, width, and style.
How the Script Works:
Candles Are Ranges: Each candle represents a price range (OHLC) on any timeframe. The script visually emphasizes these ranges, helping traders understand price action better.
Power of 3 (PO3): This concept divides price delivery into three stages: formation, turtle soup (stop hunting), and distribution/expansion. The script marks these intervals, aiding in identifying potential key levels for entries and exits.
How to Use the Script:
Adding the Script:
Apply the script to your chart and adjust the settings in the input menu.
Customize the appearance of hourly and 15-minute lines to suit your preference.
Analyzing the Chart:
Observe the hourly lines to determine higher timeframe biases.
Use 15-minute lines to identify more granular price movements.
Pay attention to horizontal lines that mark significant price levels based on your chosen criteria (open, high, low).
Trading Strategy:
Combine the script's visual aids with your understanding of the "Candles Are Ranges" and "Power of 3" concepts.
Use these visual cues to make informed decisions about potential entry and exit points.
What Makes it Original:
Integration of Candles Are Ranges and PO3 Concepts: Unlike traditional scripts that merely plot lines, this script uniquely integrates two powerful trading theories to provide a comprehensive view of price action.
Customizable Visual Aids: Offers extensive customization options for line colors, widths, and styles, allowing traders to tailor the script to their specific needs.
Enhanced Timeframe Analysis: By marking both hourly and 15-minute intervals, the script provides a detailed view of price ranges across multiple timeframes, enhancing the trader's ability to make informed decisions.
- Key script Parameters
Show Hourly Lines: Toggles the display of vertical lines marking each hour.
Hourly Lines Color: Sets the color of the hourly vertical lines.
Hourly Lines Width: Chooses the width of the hourly vertical lines (1, 2, or 3).
Hourly Lines Style: Selects the style of the hourly lines (Solid, Dashed, or Dotted).
Horizontal Line Color: Defines the color of the horizontal lines drawn at hourly intervals.
Horizontal Line Width: Determines the width of the horizontal lines (1, 2, or 3).
Horizontal Line Style: Sets the style of the horizontal lines (Solid, Dashed, or Dotted).
Horizontal Line Start Price: Specifies which price (Open, High, Low) the horizontal lines will start from.
Show Current Hour Only: Limits the display to only the current hour's horizontal line.
Show 15-Minute Lines: Toggles the display of vertical lines marking each 15-minute interval.
15-Minute Lines Color: Sets the color of the 15-minute vertical lines.
15-Minute Lines Width: Chooses the width of the 15-minute vertical lines (1, 2, or 3).
15-Minute Lines Style: Selects the style of the 15-minute lines (Solid, Dashed, or Dotted).
Show 15-Minute Horizontal Lines: Toggles the display of horizontal lines at 15-minute intervals.
15-Minute Horizontal Lines Color: Defines the color of the horizontal lines drawn at 15-minute intervals.
15-Minute Horizontal Lines Width: Determines the width of the horizontal lines (1, 2, or 3).
15-Minute Horizontal Lines Style: Sets the style of the horizontal lines (Solid, Dashed, or Dotted).
Important Notes:
- Credit to @Yazdanian and his basic "Hourly separators" indicator that plots a simple vertical line every hour which provided the idea for this version and expanded on
- This script is designed to complement your trading strategy by providing visual aids and should be used alongside other technical analysis tools.
It is not intended to issue buy or sell signals but to help you understand price ranges and potential key levels.
Disclaimer: The script is provided as-is, and the authors are not responsible for any trading losses incurred using this script. Always perform your own analysis and use proper risk management.
Macros+AMD [NW]Macros + AMD - Daily & Weekly Time-Based Analysis
Multi-timeframe AMD (Accumulation, Manipulation, Distribution) visualization with ICT Macro timing windows for time-based market analysis.
Overview
This indicator visualizes the AMD (Accumulation, Manipulation, Distribution) framework on both daily and weekly timeframes, combined with ICT Macro timing windows. It is designed as an educational tool to help traders study time-based market structure and algorithmic price delivery concepts.
The AMD model is based on the idea that markets move through distinct phases within each trading period:
Accumulation (A) - Initial range formation, liquidity building
Manipulation (M) - False moves to trap traders, liquidity sweeps
Distribution (D) - True directional move, price delivery to targets
What This Indicator Displays
Daily AMD Phases
Displays the intraday AMD cycle based on New York trading hours:
A Phase (Blue): 4:00 AM - 8:35 AM EST — Morning accumulation, Asian/London overlap
M Phase (Red): 8:35 AM - 11:25 AM EST — NY session manipulation, news events
D Phase (Green): 11:25 AM - 4:00 PM EST — Afternoon distribution and price delivery
Weekly AMD Phases
Displays the weekly AMD cycle from Monday to Monday:
A Phase: Monday 00:00 - Tuesday 21:56 EST — Weekly high/low formation begins
M Phase: Tuesday 21:56 - Thursday 02:04 EST — Mid-week reversal zone
D Phase: Thursday 02:04 - Monday 00:00 EST — Weekly price delivery
Inner M Phase Fibs
When enabled, subdivides the M (Manipulation) phase using Fibonacci levels:
0.382 level — Inner accumulation ends
0.500 level — Mid-point of manipulation
0.618 level — Inner distribution begins
This helps identify potential reversal points within the manipulation phase.
ICT Macro Windows
Horizontal lines marking the XX:42 to XX:15 macro periods (33-minute windows):
2:42 - 3:15 AM
3:42 - 4:15 AM (London)
7:42 - 8:15 AM
8:42 - 9:15 AM
9:42 - 10:15 AM (Prime AM session)
10:42 - 11:15 AM
11:42 - 12:15 PM
12:42 - 1:15 PM
1:42 - 2:15 PM
2:42 - 3:15 PM
These windows represent times when algorithmic price delivery is more likely to occur.
How To Use
Understanding the AMD Framework
During the A Phase:
Observe range formation and initial liquidity pools
Note the high and low established during this phase
Wait for manipulation before committing to direction
During the M Phase:
Watch for false breakouts and stop hunts
Look for reversal patterns after liquidity sweeps
The inner fibs (0.382, 0.5, 0.618) can help time entries within this phase
Mid-week (Wednesday) often sees key reversals on weekly AMD
During the D Phase:
This is typically when the true move occurs
Price tends to deliver toward draw on liquidity targets
The direction is often opposite to the manipulation move
Using the Macro Windows
The XX:42 to XX:15 windows are times to pay attention to price action:
These 33-minute periods often see increased algorithmic activity
Look for displacement, fair value gaps, or order blocks forming
The 9:42-10:15 AM window is considered particularly significant for NY session
Weekly Day Labels
Monday/Tuesday: "H/L of Week" — Watch for weekly high or low formation
Wednesday: "Reversal Day" — Mid-week reversal probability increases
Thursday/Friday: "Reversal Day" — Continuation or secondary reversal
Settings Guide
Main Settings
Timezone: Set to your broker's timezone or preferred timezone
Macros On Top: Toggle macro lines above or below AMD boxes
Show All Text Labels: Master toggle for all text (turn off for clean charts on HTF)
Daily/Weekly AMD
Show: Enable/disable the AMD visualization
Opacity: Adjust transparency of the phase boxes (higher = more transparent)
AMD Colors
Customize colors for each phase (A, M, D)
Default: Blue (A), Red (M), Green (D)
Inner M Style
Customize the inner M phase fib lines and text colors
Default: Black lines for clean visibility
Macro Settings
Adjust macro line color and thickness
Toggle individual macro windows on/off
Important Notes
This indicator is for educational purposes and time-based analysis
It does not provide buy/sell signals
Always use in conjunction with proper price action analysis
Past price behavior during these time windows does not guarantee future results
The AMD framework is one lens for viewing market structure — use it as part of a complete methodology
Credits
This indicator is based on concepts taught by ICT (Inner Circle Trader) and the broader Smart Money Concepts community. The AMD framework, macro timing windows, and weekly profile concepts are derived from this educational methodology.
Timeframe Recommendations
Best viewed on 1-minute to 15-minute charts
Text labels automatically hide on 9-minute and higher timeframes for cleaner visualization
Indicator hides completely on 1-hour and higher timeframes
Changelog
v1.0 - Initial release
Daily AMD phases (4am-4pm EST)
Weekly AMD phases (Monday-Monday)
Inner M phase Fibonacci subdivisions
10 ICT Macro timing windows
Full customization options
Automatic 9-day cleanup

Luxy Super-Duper SuperTrend Predictor Engine and Buy/Sell signalA professional trend-following grading system that analyzes historical trend
patterns to provide statistical duration estimates using advanced similarity
matching and k-nearest neighbors analysis. Combines adaptive Supertrend with
intelligent duration statistics, multi-timeframe confluence, volume confirmation,
and quality scoring to identify high-probability setups with data-driven
target ranges across all timeframes.
Note: All duration estimates are statistical calculations based on historical data, not guarantees of future performance.
WHAT MAKES THIS DIFFERENT
Unlike traditional SuperTrend indicators that only tell you trend direction, this system answers the critical question: "What is the typical duration for trends like this?"
The Statistical Analysis Engine:
• Analyzes your chart's last 15+ completed SuperTrend trends (bullish and bearish separately)
• Uses k-nearest neighbors similarity matching to find historically similar setups
• Calculates statistical duration estimates based on current market conditions
• Learns from estimation errors and adapts over time (Advanced mode)
• Displays visual duration analysis box showing median, average, and range estimates
• Tracks Statistical accuracy with backtest statistics
Complete Trading System:
• Statistical trend duration analysis with three intelligence levels
• Adaptive Supertrend with dynamic ATR-based bands
• Multi-timeframe confluence analysis (6 timeframes: 5M to 1W)
• Volume confirmation with spike detection and momentum tracking
• Quality scoring system (0-70 points) rating each setup
• One-click preset optimization for all trading styles
• Anti-repaint guarantee on all signals and duration estimates
METHODOLOGY CREDITS
This indicator's approach is inspired by proven trading methodologies from respected market educators:
• Mark Minervini - Volatility Contraction Pattern (VCP) and pullback entry techniques
• William O'Neil - Volume confirmation principles and institutional buying patterns (CANSLIM methodology)
• Dan Zanger - Volatility expansion entries and momentum breakout strategies
Important: These are educational references only. This indicator does not guarantee any specific trading results. Always conduct your own analysis and risk management.
KEY FEATURES
1. TREND DURATION ANALYSIS SYSTEM - The Core Innovation
The statistical analysis engine is what sets this indicator apart from standard SuperTrend systems. It doesn't just identify trend changes - it provides statistical analysis of potential duration.
How It Works:
Step 1: Historical Tracking
• Automatically records every completed SuperTrend trend (duration in bars)
• Maintains separate databases for bullish trends and bearish trends
• Stores up to 15 most recent trends of each type
• Captures market conditions at each trend flip: volume ratio, ATR ratio, quality score, price distance from SuperTrend, proximity to support/resistance
Step 2: Similarity Matching (k-Nearest Neighbors)
• When new trend begins, system compares current conditions to ALL historical flips
• Calculates similarity score based on:
- Volume similarity (30% weight) - Is volume behaving similarly?
- Volatility similarity (30% weight) - Is ATR/volatility similar?
- Quality similarity (20% weight) - Is setup strength comparable?
- Distance similarity (10% weight) - Is price distance from ST similar?
- Support/Resistance proximity (10% weight) - Similar structural context?
• Selects the 15 MOST SIMILAR historical trends (not just all trends)
• This is like asking: "When conditions looked like this before, how long did trends last?"
Step 3: Statistical Analysis
• Calculates median duration (most common outcome)
• Calculates average duration (mean of similar trends)
• Determines realistic range (min to max of similar trends)
• Applies exponential weighting (recent trends weighted more heavily)
• Outputs confidence-weighted statistical estimate
Step 4: Advanced Intelligence (Advanced Mode Only)
The Advanced mode applies five sophisticated multipliers to refine estimates:
A) Market Structure Multiplier (±30%):
• Detects nearby support/resistance levels using pivot detection
• If flip occurs NEAR a key level: Estimate adjusted -30% (expect bounce/rejection)
• If flip occurs in open space: Estimate adjusted +30% (clear path for continuation)
• Uses configurable lookback period and ATR-based proximity threshold
B) Asset Type Multiplier (±40%):
• Adjusts duration estimates based on asset volatility characteristics
• Small Cap / Biotech: +40% (explosive, extended moves)
• Tech Growth: +20% (momentum-driven, longer trends)
• Blue Chip / Large Cap: 0% (baseline, steady trends)
• Dividend / Value: -20% (slower, grinding trends)
• Cyclical: Variable based on macro regime
• Crypto / High Volatility: +30% (parabolic potential)
C) Flip Strength Multiplier (±20%):
• Analyzes the QUALITY of the trend flip itself
• Strong flip (high volume + expanding ATR + quality score 60+): +20%
• Weak flip (low volume + contracting ATR + quality score under 40): -20%
• Logic: Historical data shows that powerful flips tend to be followed by longer trends
D) Error Learning Multiplier (±15%):
• Tracks Statistical accuracy over last 10 completed trends
• Calculates error ratio: (estimated duration / Actual Duration)
• If system consistently over-estimates: Apply -15% correction
• If system consistently under-estimates: Apply +15% correction
• Learns and adapts to current market regime
E) Regime Detection Multiplier (±20%):
• Analyzes last 3 trends of SAME TYPE (bull-to-bull or bear-to-bear)
• Compares recent trend durations to historical average
• If recent trends 20%+ longer than average: +20% adjustment (trending regime detected)
• If recent trends 20%+ shorter than average: -20% adjustment (choppy regime detected)
• Detects whether market is in trending or mean-reversion mode
Three analysis modes:
SIMPLE MODE - Basic Statistics
• Uses raw median of similar trends only
• No multipliers, no adjustments
• Best for: Beginners, clean trending markets
• Fastest calculations, minimal complexity
STANDARD MODE - Full Statistical Analysis
• Similarity matching with k-nearest neighbors
• Exponential weighting of recent trends
• Median, average, and range calculations
• Best for: Most traders, general market conditions
• Balance of accuracy and simplicity
ADVANCED MODE - Statistics + Intelligence
• Everything in Standard mode PLUS
• All 5 advanced multipliers (structure, asset type, flip strength, learning, regime)
• Highest Statistical accuracy in testing
• Best for: Experienced traders, volatile/complex markets
• Maximum intelligence, most adaptive
Visual Duration Analysis Box:
When a new trend begins (SuperTrend flip), a box appears on your chart showing:
• Analysis Mode (Simple / Standard / Advanced)
• Number of historical trends analyzed
• Median expected duration (most likely outcome)
• Average expected duration (mean of similar trends)
• Range (minimum to maximum from similar trends)
• Advanced multipliers breakdown (Advanced mode only)
• Backtest accuracy statistics (if available)
The box extends from the flip bar to the estimated endpoint based on historical data, giving you a visual target for trend duration. Box updates in real-time as trend progresses.
Backtest & Accuracy Tracking:
• System backtests its own duration estimates using historical data
• Shows accuracy metrics: how well duration estimates matched actual durations
• Tracks last 10 completed duration estimates separately
• Displays statistics in dashboard and duration analysis boxes
• Helps you understand statistical reliability on your specific symbol/timeframe
Anti-Repaint Guarantee:
• duration analysis boxes only appear AFTER bar close (barstate.isconfirmed)
• Historical duration estimates never disappear or change
• What you see in history is exactly what you would have seen real-time
• No future data leakage, no lookahead bias
2. INTELLIGENT PRESET CONFIGURATIONS - One-Click Optimization
Unlike indicators that require tedious parameter tweaking, this system includes professionally optimized presets for every trading style. Select your approach from the dropdown and ALL parameters auto-configure.
"AUTO (DETECT FROM TF)" - RECOMMENDED
The smartest option: automatically selects optimal settings based on your chart timeframe.
• 1m-5m charts → Scalping preset (ATR: 7, Mult: 2.0)
• 15m-1h charts → Day Trading preset (ATR: 10, Mult: 2.5)
• 2h-4h-D charts → Swing Trading preset (ATR: 14, Mult: 3.0)
• W-M charts → Position Trading preset (ATR: 21, Mult: 4.0)
Benefits:
• Zero configuration - works immediately
• Always matched to your timeframe
• Switch timeframe = automatic adjustment
• Perfect for traders who use multiple timeframes
"SCALPING (1-5M)" - Ultra-Fast Signals
Optimized for: 1-5 minute charts, high-frequency trading, quick profits
Target holding period: Minutes to 1-2 hours maximum
Best markets: High-volume stocks, major crypto pairs, active futures
Parameter Configuration:
• Supertrend: ATR 7, Multiplier 2.0 (very sensitive)
• Volume: MA 10, High 1.8x, Spike 3.0x (catches quick surges)
• Volume Momentum: AUTO-DISABLED (too restrictive for fast scalping)
• Quality minimum: 40 points (accepts more setups)
• Duration Analysis: Uses last 15 trends with heavy recent weighting
Trading Logic:
Speed over precision. Short ATR period and low multiplier create highly responsive SuperTrend. Volume momentum filter disabled to avoid missing fast moves. Quality threshold relaxed to catch more opportunities in rapid market conditions.
Signals per session: 5-15 typically
Hold time: Minutes to couple hours
Best for: Active traders with fast execution
"DAY TRADING (15M-1H)" - Balanced Approach
Optimized for: 15-minute to 1-hour charts, intraday moves, session-based trading
Target holding period: 30 minutes to 8 hours (within trading day)
Best markets: Large-cap stocks, major indices, established crypto
Parameter Configuration:
• Supertrend: ATR 10, Multiplier 2.5 (balanced)
• Volume: MA 20, High 1.5x, Spike 2.5x (standard detection)
• Volume Momentum: 5/20 periods (confirms intraday strength)
• Quality minimum: 50 points (good setups preferred)
• Duration Analysis: Balanced weighting of recent vs historical
Trading Logic:
The most balanced configuration. ATR 10 with multiplier 2.5 provides steady trend following that avoids noise while catching meaningful moves. Volume momentum confirms institutional participation without being overly restrictive.
Signals per session: 2-5 typically
Hold time: 30 minutes to full day
Best for: Part-time and full-time active traders
"SWING TRADING (4H-D)" - Trend Stability
Optimized for: 4-hour to Daily charts, multi-day holds, trend continuation
Target holding period: 2-15 days typically
Best markets: Growth stocks, sector ETFs, trending crypto, commodity futures
Parameter Configuration:
• Supertrend: ATR 14, Multiplier 3.0 (stable)
• Volume: MA 30, High 1.3x, Spike 2.2x (accumulation focus)
• Volume Momentum: 10/30 periods (trend stability)
• Quality minimum: 60 points (high-quality setups only)
• Duration Analysis: Favors consistent historical patterns
Trading Logic:
Designed for substantial trend moves while filtering short-term noise. Higher ATR period and multiplier create stable SuperTrend that won't flip on minor corrections. Stricter quality requirements ensure only strongest setups generate signals.
Signals per week: 2-5 typically
Hold time: Days to couple weeks
Best for: Part-time traders, swing style
"POSITION TRADING (D-W)" - Long-Term Trends
Optimized for: Daily to Weekly charts, major trend changes, portfolio allocation
Target holding period: Weeks to months
Best markets: Blue-chip stocks, major indices, established cryptocurrencies
Parameter Configuration:
• Supertrend: ATR 21, Multiplier 4.0 (very stable)
• Volume: MA 50, High 1.2x, Spike 2.0x (long-term accumulation)
• Volume Momentum: 20/50 periods (major trend confirmation)
• Quality minimum: 70 points (excellent setups only)
• Duration Analysis: Heavy emphasis on multi-year historical data
Trading Logic:
Conservative approach focusing on major trend changes. Extended ATR period and high multiplier create SuperTrend that only flips on significant reversals. Very strict quality filters ensure signals represent genuine long-term opportunities.
Signals per month: 1-2 typically
Hold time: Weeks to months
Best for: Long-term investors, set-and-forget approach
"CUSTOM" - Advanced Configuration
Purpose: Complete manual control for experienced traders
Use when: You understand the parameters and want specific optimization
Best for: Testing new approaches, unusual market conditions, specific instruments
Full control over:
• All SuperTrend parameters
• Volume thresholds and momentum periods
• Quality scoring weights
• analysis mode and multipliers
• Advanced features tuning
Preset Comparison Quick Reference:
Chart Timeframe: Scalping (1M-5M) | Day Trading (15M-1H) | Swing (4H-D) | Position (D-W)
Signals Frequency: Very High | High | Medium | Low
Hold Duration: Minutes | Hours | Days | Weeks-Months
Quality Threshold: 40 pts | 50 pts | 60 pts | 70 pts
ATR Sensitivity: Highest | Medium | Lower | Lowest
Time Investment: Highest | High | Medium | Lowest
Experience Level: Expert | Advanced | Intermediate | Beginner+
3. QUALITY SCORING SYSTEM (0-70 Points)
Every signal is rated in real-time across three dimensions:
Volume Confirmation (0-30 points):
• Volume Spike (2.5x+ average): 30 points
• High Volume (1.5x+ average): 20 points
• Above Average (1.0x+ average): 10 points
• Below Average: 0 points
Volatility Assessment (0-30 points):
• Expanding ATR (1.2x+ average): 30 points
• Rising ATR (1.0-1.2x average): 15 points
• Contracting/Stable ATR: 0 points
Volume Momentum (0-10 points):
• Strong Momentum (1.2x+ ratio): 10 points
• Rising Momentum (1.0-1.2x ratio): 5 points
• Weak/Neutral Momentum: 0 points
Score Interpretation:
60-70 points - EXCELLENT:
• All factors aligned
• High conviction setup
• Maximum position size (within risk limits)
• Primary trading opportunities
45-59 points - STRONG:
• Multiple confirmations present
• Above-average setup quality
• Standard position size
• Good trading opportunities
30-44 points - GOOD:
• Basic confirmations met
• Acceptable setup quality
• Reduced position size
• Wait for additional confirmation or trade smaller
Below 30 points - WEAK:
• Minimal confirmations
• Low probability setup
• Consider passing
• Only for aggressive traders in strong trends
Only signals meeting your minimum quality threshold (configurable per preset) generate alerts and labels.
4. MULTI-TIMEFRAME CONFLUENCE ANALYSIS
The system can simultaneously analyze trend alignment across 6 timeframes (optional feature):
Timeframes analyzed:
• 5-minute (scalping context)
• 15-minute (intraday momentum)
• 1-hour (day trading bias)
• 4-hour (swing context)
• Daily (primary trend)
• Weekly (macro trend)
Confluence Interpretation:
• 5-6/6 aligned - Very strong multi-timeframe agreement (highest confidence)
• 3-4/6 aligned - Moderate agreement (standard setup)
• 1-2/6 aligned - Weak agreement (caution advised)
Dashboard shows real-time alignment count with color-coding. Higher confluence typically correlates with longer, stronger trends.
5. VOLUME MOMENTUM FILTER - Institutional Money Flow
Unlike traditional volume indicators that just measure size, Volume Momentum tracks the RATE OF CHANGE in volume:
How it works:
• Compares short-term volume average (fast period) to long-term average (slow period)
• Ratio above 1.0 = Volume accelerating (money flowing IN)
• Ratio above 1.2 = Strong acceleration (institutional participation likely)
• Ratio below 0.8 = Volume decelerating (money flowing OUT)
Why it matters:
• Confirms trend with actual money flow, not just price
• Leading indicator (volume often leads price)
• Catches accumulation/distribution before breakouts
• More intuitive than complex mathematical filters
Integration with signals:
• Optional filter - can be enabled/disabled per preset
• When enabled: Only signals with rising volume momentum fire
• AUTO-DISABLED in Scalping mode (too restrictive for fast trading)
• Configurable fast/slow periods per trading style
6. ADAPTIVE SUPERTREND MULTIPLIER
Traditional SuperTrend uses fixed ATR multiplier. This system dynamically adjusts the multiplier (0.8x to 1.2x base) based on:
• Trend Strength: Price correlation over lookback period
• Volume Weight: Current volume relative to average
Benefits:
• Tighter bands in calm markets (less premature exits)
• Wider bands in volatile conditions (avoids whipsaws)
• Better adaptation to biotech, small-cap, and crypto volatility
• Optional - can be disabled for classic constant multiplier
7. VISUAL GRADIENT RIBBON
26-layer exponential gradient fill between price and SuperTrend line provides instant visual trend strength assessment:
Color System:
• Green shades - Bullish trend + volume confirmation (strongest)
• Blue shades - Bullish trend, normal volume
• Orange shades - Bearish trend + volume confirmation
• Red shades - Bearish trend (weakest)
Opacity varies based on:
• Distance from SuperTrend (farther = more opaque)
• Volume intensity (higher volume = stronger color)
The ribbon provides at-a-glance trend strength without cluttering your chart. Can be toggled on/off.
8. INTELLIGENT ALERT SYSTEM
Two-tier alert architecture for flexibility:
Automatic Alerts:
• Fire automatically on BUY and SELL signals
• Include full context: quality score, volume state, volume momentum
• One alert per bar close (alert.freq_once_per_bar_close)
• Message format: "BUY: Supertrend bullish + Quality: 65/70 | Volume: HIGH | Vol Momentum: STRONG (1.35x)"
Customizable Alert Conditions:
• Appear in TradingView's "Create Alert" dialog
• Three options: BUY Signal Only, SELL Signal Only, ANY Signal (BUY or SELL)
• Use TradingView placeholders: {{ticker}}, {{interval}}, {{close}}, {{time}}
• Fully customizable message templates
All alerts use barstate.isconfirmed - Zero repaint guarantee.
9. ANTI-REPAINT ARCHITECTURE
Every component guaranteed non-repainting:
• Entry signals: Only appear after bar close
• duration analysis boxes: Created only on confirmed SuperTrend flips
• Informative labels: Wait for bar confirmation
• Alerts: Fire once per closed bar
• Multi-timeframe data: Uses lookahead=barmerge.lookahead_off
What you see in history is exactly what you would have seen in real-time. No disappearing signals, no changed duration estimates.
HOW TO USE THE INDICATOR
QUICK START - 3 Steps to Trading:
Step 1: Select Your Trading Style
Open indicator settings → "Quick Setup" section → Trading Style Preset dropdown
Options:
• Auto (Detect from TF) - RECOMMENDED: Automatically configures based on your chart timeframe
• Scalping (1-5m) - For 1-5 minute charts, ultra-fast signals
• Day Trading (15m-1h) - For 15m-1h charts, balanced approach
• Swing Trading (4h-D) - For 4h-Daily charts, trend stability
• Position Trading (D-W) - For Daily-Weekly charts, long-term trends
• Custom - Manual configuration (advanced users only)
Choose "Auto" and you're done - all parameters optimize automatically.
Step 2: Understand the Signals
BUY Signal (Green Triangle Below Price):
• SuperTrend flipped bullish
• Quality score meets minimum threshold (varies by preset)
• Volume confirmation present (if filter enabled)
• Volume momentum rising (if filter enabled)
• duration analysis box shows expected trend duration
SELL Signal (Red Triangle Above Price):
• SuperTrend flipped bearish
• Quality score meets minimum threshold
• Volume confirmation present (if filter enabled)
• Volume momentum rising (if filter enabled)
• duration analysis box shows expected trend duration
Duration Analysis Box:
• Appears at SuperTrend flip (start of new trend)
• Shows median, average, and range duration estimates
• Extends to estimated endpoint based on historical data visually
• Updates mode-specific intelligence (Simple/Standard/Advanced)
Step 3: Use the Dashboard for Context
Dashboard (top-right corner) shows real-time metrics:
• Row 1 - Quality Score: Current setup rating (0-70)
• Row 2 - SuperTrend: Direction and current level
• Row 3 - Volume: Status (Spike/High/Normal/Low) with color
• Row 4 - Volatility: State (Expanding/Rising/Stable/Contracting)
• Row 5 - Volume Momentum: Ratio and trend
• Row 6 - Duration Statistics: Accuracy metrics and track record
Every cell has detailed tooltip - hover for full explanations.
SIGNAL INTERPRETATION BY QUALITY SCORE:
Excellent Setup (60-70 points):
• Quality Score: 60-70
• Volume: Spike or High
• Volatility: Expanding
• Volume Momentum: Strong (1.2x+)
• MTF Confluence (if enabled): 5-6/6
• Action: Primary trade - maximum position size (within risk limits)
• Statistical reliability: Highest - duration estimates most accurate
Strong Setup (45-59 points):
• Quality Score: 45-59
• Volume: High or Above Average
• Volatility: Rising
• Volume Momentum: Rising (1.0-1.2x)
• MTF Confluence (if enabled): 3-4/6
• Action: Standard trade - normal position size
• Statistical reliability: Good - duration estimates reliable
Good Setup (30-44 points):
• Quality Score: 30-44
• Volume: Above Average
• Volatility: Stable or Rising
• Volume Momentum: Neutral to Rising
• MTF Confluence (if enabled): 3-4/6
• Action: Cautious trade - reduced position size, wait for additional confirmation
• Statistical reliability: Moderate - duration estimates less certain
Weak Setup (Below 30 points):
• Quality Score: Below 30
• Volume: Low or Normal
• Volatility: Contracting or Stable
• Volume Momentum: Weak
• MTF Confluence (if enabled): 1-2/6
• Action: Pass or wait for improvement
• Statistical reliability: Low - duration estimates unreliable
USING duration analysis boxES FOR TRADE MANAGEMENT:
Entry Timing:
• Enter on SuperTrend flip (signal bar close)
• duration analysis box appears simultaneously
• Note the median duration - this is your expected hold time
Profit Targets:
• Conservative: Use MEDIAN duration as profit target (50% probability)
• Moderate: Use AVERAGE duration (mean of similar trends)
• Aggressive: Aim for MAX duration from range (best historical outcome)
Position Management:
• Scale out at median duration (take partial profits)
• Trail stop as trend extends beyond median
• Full exit at average duration or SuperTrend flip (whichever comes first)
• Re-evaluate if trend exceeds estimated range
analysis mode Selection:
• Simple: Clean trending markets, beginners, minimal complexity
• Standard: Most markets, most traders (recommended default)
• Advanced: Volatile markets, complex instruments, experienced traders seeking highest accuracy
Asset Type Configuration (Advanced Mode):
If using Advanced analysis mode, configure Asset Type for optimal accuracy:
• Small Cap: Stocks under $2B market cap, low liquidity
• Biotech / Speculative: Clinical-stage pharma, penny stocks, high-risk
• Blue Chip / Large Cap: S&P 500, mega-cap tech, stable large companies
• Tech Growth: High-growth tech (TSLA, NVDA, growth SaaS)
• Dividend / Value: Dividend aristocrats, value stocks, utilities
• Cyclical: Energy, materials, industrials (macro-driven)
• Crypto / High Volatility: Bitcoin, altcoins, highly volatile assets
Correct asset type selection improves Statistical accuracy by 15-20%.
RISK MANAGEMENT GUIDELINES:
1. Stop Loss Placement:
Long positions:
• Place stop below recent swing low OR
• Place stop below SuperTrend level (whichever is tighter)
• Use 1-2 ATR distance as guideline
• Recommended: SuperTrend level (built-in volatility adjustment)
Short positions:
• Place stop above recent swing high OR
• Place stop above SuperTrend level (whichever is tighter)
• Use 1-2 ATR distance as guideline
• Recommended: SuperTrend level
2. Position Sizing by Quality Score:
• Excellent (60-70): Maximum position size (2% risk per trade)
• Strong (45-59): Standard position size (1.5% risk per trade)
• Good (30-44): Reduced position size (1% risk per trade)
• Weak (Below 30): Pass or micro position (0.5% risk - learning trades only)
3. Exit Strategy Options:
Option A - Statistical Duration-Based Exit:
• Exit at median estimated duration (conservative)
• Exit at average estimated duration (moderate)
• Trail stop beyond average duration (aggressive)
Option B - Signal-Based Exit:
• Exit on opposite signal (SELL after BUY, or vice versa)
• Exit on SuperTrend flip (trend reversal)
• Exit if quality score drops below 30 mid-trend
Option C - Hybrid (Recommended):
• Take 50% profit at median estimated duration
• Trail stop on remaining 50% using SuperTrend as trailing level
• Full exit on SuperTrend flip or quality collapse
4. Trade Filtering:
For higher win-rate (fewer trades, better quality):
• Increase minimum quality score (try 60 for swing, 50 for day trading)
• Enable volume momentum filter (ensure institutional participation)
• Require higher MTF confluence (5-6/6 alignment)
• Use Advanced analysis mode with appropriate asset type
For more opportunities (more trades, lower quality threshold):
• Decrease minimum quality score (40 for day trading, 35 for scalping)
• Disable volume momentum filter
• Lower MTF confluence requirement
• Use Simple or Standard analysis mode
SETTINGS OVERVIEW
Quick Setup Section:
• Trading Style Preset: Auto / Scalping / Day Trading / Swing / Position / Custom
Dashboard & Display:
• Show Dashboard (ON/OFF)
• Dashboard Position (9 options: Top/Middle/Bottom + Left/Center/Right)
• Text Size (Auto/Tiny/Small/Normal/Large/Huge)
• Show Ribbon Fill (ON/OFF)
• Show SuperTrend Line (ON/OFF)
• Bullish Color (default: Green)
• Bearish Color (default: Red)
• Show Entry Labels - BUY/SELL signals (ON/OFF)
• Show Info Labels - Volume events (ON/OFF)
• Label Size (Auto/Tiny/Small/Normal/Large/Huge)
Supertrend Configuration:
• ATR Length (default varies by preset: 7-21)
• ATR Multiplier Base (default varies by preset: 2.0-4.0)
• Use Adaptive Multiplier (ON/OFF) - Dynamic 0.8x-1.2x adjustment
• Smoothing Factor (0.0-0.5) - EMA smoothing applied to bands
• Neutral Bars After Flip (0-10) - Hide ST immediately after flip
Volume Momentum:
• Enable Volume Momentum Filter (ON/OFF)
• Fast Period (default varies by preset: 3-20)
• Slow Period (default varies by preset: 10-50)
Volume Analysis:
• Volume MA Length (default varies by preset: 10-50)
• High Volume Threshold (default: 1.5x)
• Spike Threshold (default: 2.5x)
• Low Volume Threshold (default: 0.7x)
Quality Filters:
• Minimum Quality Score (0-70, varies by preset)
• Require Volume Confirmation (ON/OFF)
Trend Duration Analysis:
• Show Duration Analysis (ON/OFF) - Display duration analysis boxes
• analysis mode - Simple / Standard / Advanced
• Asset Type - 7 options (Small Cap, Biotech, Blue Chip, Tech Growth, Dividend, Cyclical, Crypto)
• Use Exponential Weighting (ON/OFF) - Recent trends weighted more
• Decay Factor (0.5-0.99) - How much more recent trends matter
• Structure Lookback (3-30) - Pivot detection period for support/resistance
• Proximity Threshold (xATR) - How close to level qualifies as "near"
• Enable Error Learning (ON/OFF) - System learns from estimation errors
• Memory Depth (3-20) - How many past errors to remember
Box Visual Settings:
• duration analysis box Border Color
• duration analysis box Background Color
• duration analysis box Text Color
• duration analysis box Border Width
• duration analysis box Transparency
Multi-Timeframe (Optional Feature):
• Enable MTF Confluence (ON/OFF)
• Minimum Alignment Required (0-6)
• Individual timeframe enable/disable toggles
• Custom timeframe selection options
All preset configurations override manual inputs except when "Custom" is selected.
ADVANCED FEATURES
1. Scalpel Mode (Optional)
Advanced pullback entry system that waits for healthy retracements within established trends before signaling entry:
• Monitors price distance from SuperTrend levels
• Requires pullback to configurable range (default: 30-50%)
• Ensures trend remains intact before entry signal
• Reduces whipsaw and false breakouts
• Inspired by Mark Minervini's VCP pullback entries
Best for: Swing traders and day traders seeking precision entries
Scalpers: Consider disabling for faster entries
2. Error Learning System (Advanced analysis mode Only)
The system learns from its own estimation errors:
• Tracks last 10-20 completed duration estimates (configurable memory depth)
• Calculates error ratio for each: estimated duration / Actual Duration
• If system consistently over-estimates: Applies negative correction (-15%)
• If system consistently under-estimates: Applies positive correction (+15%)
• Adapts to current market regime automatically
This self-correction mechanism improves accuracy over time as the system gathers more data on your specific symbol and timeframe.
3. Regime Detection (Advanced analysis mode Only)
Automatically detects whether market is in trending or choppy regime:
• Compares last 3 trends to historical average
• Recent trends 20%+ longer → Trending regime (+20% to estimates)
• Recent trends 20%+ shorter → Choppy regime (-20% to estimates)
• Applied separately to bullish and bearish trends
Helps duration estimates adapt to changing market conditions without manual intervention.
4. Exponential Weighting
Option to weight recent trends more heavily than distant history:
• Default decay factor: 0.9
• Recent trends get higher weight in statistical calculations
• Older trends gradually decay in importance
• Rationale: Recent market behavior more relevant than old data
• Can be disabled for equal weighting
5. Backtest Statistics
System backtests its own duration estimates using historical data:
• Walks through past trends chronologically
• Calculates what duration estimate WOULD have been at each flip
• Compares to actual duration that occurred
• Displays accuracy metrics in duration analysis boxes and dashboard
• Helps assess statistical reliability on your specific chart
Note: Backtest uses only data available AT THE TIME of each historical flip (no lookahead bias).
TECHNICAL SPECIFICATIONS
• Pine Script Version: v6
• Indicator Type: Overlay (draws on price chart)
• Max Boxes: 500 (for duration analysis box storage)
• Max Bars Back: 5000 (for comprehensive historical analysis)
• Security Calls: 1 (for MTF if enabled - optimized)
• Repainting: NO - All signals and duration estimates confirmed on bar close
• Lookahead Bias: NO - All HTF data properly offset, all duration estimates use only historical data
• Real-time Updates: YES - Dashboard and quality scores update live
• Alert Capable: YES - Both automatic alerts and customizable alert conditions
• Multi-Symbol: Works on stocks, crypto, forex, futures, indices
Performance Optimization:
• Conditional calculations (duration analysis can be disabled to reduce load)
• Efficient array management (circular buffers for trend storage)
• Streamlined gradient rendering (26 layers, can be toggled off)
• Smart label cooldown system (prevents label spam)
• Optimized similarity matching (analyzes only relevant trends)
Data Requirements:
• Minimum 50-100 bars for initial duration analysis (builds historical database)
• Optimal: 500+ bars for robust statistical analysis
• Longer history = more accurate duration estimates
• Works on any timeframe from 1 minute to monthly
KNOWN LIMITATIONS
• Trending Markets Only: Performs best in clear trends. May generate false signals in choppy/sideways markets (use quality score filtering and regime detection to mitigate)
• Lagging Nature: Like all trend-following systems, signals occur AFTER trend establishment, not at exact tops/bottoms. Use duration analysis boxes to set realistic profit targets.
• Initial Learning Period: Duration analysis system requires 10-15 completed trends to build reliable historical database. Early duration estimates less accurate (first few weeks on new symbol/timeframe).
• Visual Load: 26-layer gradient ribbon may slow performance on older devices. Disable ribbon if experiencing lag.
• Statistical accuracy Variables: Duration estimates are statistical estimates, not guarantees. Accuracy varies by:
- Market regime (trending vs choppy)
- Asset volatility characteristics
- Quality of historical pattern matches
- Timeframe traded (higher TF = more reliable)
• Not Best Suitable For:
- Ultra-short-term scalping (sub-1-minute charts)
- Mean-reversion strategies (designed for trend-following)
- Range-bound trading (requires trending conditions)
- News-driven spikes (estimates based on technical patterns, not fundamentals)
FREQUENTLY ASKED QUESTIONS
Q: Does this indicator repaint?
A: Absolutely not. All signals, duration analysis boxes, labels, and alerts use barstate.isconfirmed checks. They only appear after the bar closes. What you see in history is exactly what you would have seen in real-time. Zero repaint guarantee.
Q: How accurate are the trend duration estimates?
A: Accuracy varies by mode, market conditions, and historical data quality:
• Simple mode: 60-70% accuracy (within ±20% of actual duration)
• Standard mode: 70-80% accuracy (within ±20% of actual duration)
• Advanced mode: 75-85% accuracy (within ±20% of actual duration)
Best accuracy achieved on:
• Higher timeframes (4H, Daily, Weekly)
• Trending markets (not choppy/sideways)
• Assets with consistent behavior (Blue Chip, Large Cap)
• After 20+ historical trends analyzed (builds robust database)
Remember: All duration estimates are statistical calculations based on historical patterns, not guarantees.
Q: Which analysis mode should I use?
A:
• Simple: Beginners, clean trending markets, want minimal complexity
• Standard: Most traders, general market conditions (RECOMMENDED DEFAULT)
• Advanced: Experienced traders, volatile/complex markets (biotech, small-cap, crypto), seeking maximum accuracy
Advanced mode requires correct Asset Type configuration for optimal results.
Q: What's the difference between the trading style presets?
A: Each preset optimizes ALL parameters for a specific trading approach:
• Scalping: Ultra-sensitive (ATR 7, Mult 2.0), more signals, shorter holds
• Day Trading: Balanced (ATR 10, Mult 2.5), moderate signals, intraday holds
• Swing Trading: Stable (ATR 14, Mult 3.0), fewer signals, multi-day holds
• Position Trading: Very stable (ATR 21, Mult 4.0), rare signals, week/month holds
Auto mode automatically selects based on your chart timeframe.
Q: Should I use Auto mode or manually select a preset?
A: Auto mode is recommended for most traders. It automatically matches settings to your timeframe and re-optimizes if you switch charts. Only use manual preset selection if:
• You want scalping settings on a 15m chart (overriding auto-detection)
• You want swing settings on a 1h chart (more conservative than auto would give)
• You're testing different approaches on same timeframe
Q: Can I use this for scalping and day trading?
A: Absolutely! The preset system is specifically designed for all trading styles:
• Select "Scalping (1-5m)" for 1-5 minute charts
• Select "Day Trading (15m-1h)" for 15m-1h charts
• Or use "Auto" mode and it configures automatically
Volume momentum filter is auto-disabled in Scalping mode for faster signals.
Q: What is Volume Momentum and why does it matter?
A: Volume Momentum compares short-term volume (fast MA) to long-term volume (slow MA). It answers: "Is money flowing into this asset faster now than historically?"
Why it matters:
• Volume often leads price (early warning system)
• Confirms institutional participation (smart money)
• No lag like price-based indicators
• More intuitive than complex mathematical filters
When the ratio is above 1.2, you have strong evidence that institutions are accumulating (bullish) or distributing (bearish).
Q: How do I set up alerts?
A: Two options:
Option 1 - Automatic Alerts:
1. Right-click on chart → Add Alert
2. Condition: Select this indicator
3. Choose "Any alert() function call"
4. Configure notification method (app, email, webhook)
5. You'll receive detailed alerts on every BUY and SELL signal
Option 2 - Customizable Alert Conditions:
1. Right-click on chart → Add Alert
2. Condition: Select this indicator
3. You'll see three options in dropdown:
- "BUY Signal" (long signals only)
- "SELL Signal" (short signals only)
- "ANY Signal" (both BUY and SELL)
4. Choose desired option and customize message template
5. Uses TradingView placeholders: {{ticker}}, {{close}}, {{time}}, etc.
All alerts fire only on confirmed bar close (no repaint).
Q: What is Scalpel Mode and should I use it?
A: Scalpel Mode waits for healthy pullbacks within established trends before signaling entry. It reduces whipsaws and improves entry timing.
Recommended ON for:
• Swing traders (want precision entries on pullbacks)
• Day traders (willing to wait for better prices)
• Risk-averse traders (prefer fewer but higher-quality entries)
Recommended OFF for:
• Scalpers (need immediate entries, can't wait for pullbacks)
• Momentum traders (want to enter on breakout, not pullback)
• Aggressive traders (prefer more opportunities over precision)
Q: Why do some duration estimates show wider ranges than others?
A: Range width reflects historical trend variability:
• Narrow range: Similar historical trends had consistent durations (high confidence)
• Wide range: Similar historical trends had varying durations (lower confidence)
Wide ranges often occur:
• Early in analysis (fewer historical trends to learn from)
• In volatile/choppy markets (inconsistent trend behavior)
• On lower timeframes (more noise, less consistency)
The median and average still provide useful targets even when range is wide.
Q: Can I customize the dashboard position and appearance?
A: Yes! Dashboard settings include:
• Position: 9 options (Top/Middle/Bottom + Left/Center/Right)
• Text Size: Auto, Tiny, Small, Normal, Large, Huge
• Show/Hide: Toggle entire dashboard on/off
Choose position that doesn't overlap important price action on your specific chart.
Q: Which timeframe should I trade on?
A: Depends on your trading style and time availability:
• 1-5 minute: Active scalping, requires constant monitoring
• 15m-1h: Day trading, check few times per session
• 4h-Daily: Swing trading, check once or twice daily
• Daily-Weekly: Position trading, check weekly
General principle: Higher timeframes produce:
• Fewer signals (less frequent)
• Higher quality setups (stronger confirmations)
• More reliable duration estimates (better statistical data)
• Less noise (clearer trends)
Start with Daily chart if new to trading. Move to lower timeframes as you gain experience.
Q: Does this work on all markets (stocks, crypto, forex)?
A: Yes, it works on all markets with trending characteristics:
Excellent for:
• Stocks (especially growth and momentum names)
• Crypto (BTC, ETH, major altcoins)
• Futures (indices, commodities)
• Forex majors (EUR/USD, GBP/USD, etc.)
Best results on:
• Trending markets (not range-bound)
• Liquid instruments (tight spreads, good fills)
• Volatile assets (clear trend development)
Less effective on:
• Range-bound/sideways markets
• Ultra-low volatility instruments
• Illiquid small-caps (use caution)
Configure Asset Type (in Advanced analysis mode) to match your instrument for best accuracy.
Q: How many signals should I expect per day/week?
A: Highly variable based on:
By Timeframe:
• 1-5 minute: 5-15 signals per session
• 15m-1h: 2-5 signals per day
• 4h-Daily: 2-5 signals per week
• Daily-Weekly: 1-2 signals per month
By Market Volatility:
• High volatility = more SuperTrend flips = more signals
• Low volatility = fewer flips = fewer signals
By Quality Filter:
• Higher threshold (60-70) = fewer but better signals
• Lower threshold (30-40) = more signals, lower quality
By Volume Momentum Filter:
• Enabled = Fewer signals (only volume-confirmed)
• Disabled = More signals (all SuperTrend flips)
Adjust quality threshold and filters to match your desired signal frequency.
Q: What's the difference between entry labels and info labels?
A:
Entry Labels (BUY/SELL):
• Your primary trading signals
• Based on SuperTrend flip + all confirmations (quality, volume, momentum)
• Include quality score and confirmation icons
• These are actionable entry points
Info Labels (Volume Spike):
• Additional market context
• Show volume events that may support or contradict trend
• 8-bar cooldown to prevent spam
• NOT necessarily entry points - contextual information only
Control separately: Can show entry labels without info labels (recommended for clean charts).
Q: Can I combine this with other indicators?
A: Absolutely! This works well with:
• RSI: For divergences and overbought/oversold conditions
• Support/Resistance: Confluence with key levels
• Fibonacci Retracements: Pullback targets in Scalpel Mode
• Price Action Patterns: Flags, pennants, cup-and-handle
• MACD: Additional momentum confirmation
• Bollinger Bands: Volatility context
This indicator provides trend direction and duration estimates - complement with other tools for entry refinement and additional confluence.
Q: Why did I get a low-quality signal? Can I filter them out?
A: Yes! Increase the Minimum Quality Score in settings.
If you're seeing signals with quality below your preference:
• Day Trading: Set minimum to 50
• Swing Trading: Set minimum to 60
• Position Trading: Set minimum to 70
Only signals meeting the threshold will appear. This reduces frequency but improves win-rate.
Q: How do I interpret the MTF Confluence count?
A: Shows how many of 6 timeframes agree with current trend:
• 6/6 aligned: Perfect agreement (extremely rare, highest confidence)
• 5/6 aligned: Very strong alignment (high confidence)
• 4/6 aligned: Good alignment (standard quality setup)
• 3/6 aligned: Moderate alignment (acceptable)
• 2/6 aligned: Weak alignment (caution)
• 1/6 aligned: Very weak (likely counter-trend)
Higher confluence typically correlates with longer, stronger trends. However, MTF analysis is optional - you can disable it and rely solely on quality scoring.
Q: Is this suitable for beginners?
A: Yes, but requires foundational knowledge:
You should understand:
• Basic trend-following concepts (higher highs, higher lows)
• Risk management principles (position sizing, stop losses)
• How to read candlestick charts
• What volume and volatility mean
Beginner-friendly features:
• Auto preset mode (zero configuration)
• Quality scoring (tells you signal strength)
• Dashboard tooltips (hover for explanations)
• duration analysis boxes (visual profit targets)
Recommended for beginners:
1. Start with "Auto" or "Swing Trading" preset on Daily chart
2. Use Standard Analysis Mode (not Advanced)
3. Set minimum quality to 60 (fewer but better signals)
4. Paper trade first for 2-4 weeks
5. Study methodology references (Minervini, O'Neil, Zanger)
Q: What is the Asset Type setting and why does it matter?
A: Asset Type (in Advanced analysis mode) adjusts duration estimates based on volatility characteristics:
• Small Cap: Explosive moves, extended trends (+30-40%)
• Biotech / Speculative: Parabolic potential, news-driven (+40%)
• Blue Chip / Large Cap: Baseline, steady trends (0% adjustment)
• Tech Growth: Momentum-driven, longer trends (+20%)
• Dividend / Value: Slower, grinding trends (-20%)
• Cyclical: Macro-driven, variable (±10%)
• Crypto / High Volatility: Parabolic potential (+30%)
Correct configuration improves Statistical accuracy by 15-20%. Using Blue Chip settings on a biotech stock may underestimate trend length (you'll exit too early).
Q: Can I backtest this indicator?
A: Yes! TradingView's Strategy Tester works with this indicator's signals.
To backtest:
1. Note the entry conditions (SuperTrend flip + quality threshold + filters)
2. Create a strategy script using same logic
3. Run Strategy Tester on historical data
Additionally, the indicator includes BUILT-IN duration estimate validation:
• System backtests its own duration estimates
• Shows accuracy metrics in dashboard and duration analysis boxes
• Helps assess reliability on your specific symbol/timeframe
Q: Why does Volume Momentum auto-disable in Scalping mode?
A: Scalping requires ultra-fast entries to catch quick moves. Volume Momentum filter adds friction by requiring volume confirmation before signaling, which can cause missed opportunities in rapid scalping.
Scalping preset is optimized for speed and frequency - the filter is counterproductive for that style. It remains enabled for Day Trading, Swing Trading, and Position Trading presets where patience improves results.
You can manually enable it in Custom mode if desired.
Q: How much historical data do I need for accurate duration estimates?
A:
Minimum: 50-100 bars (indicator will function but duration estimates less reliable)
Recommended: 500+ bars (robust statistical database)
Optimal: 1000+ bars (maximum Statistical accuracy)
More history = more completed trends = better pattern matching = more accurate duration estimates.
New symbols or newly-switched timeframes will have lower Statistical accuracy initially. Allow 2-4 weeks for the system to build historical database.
IMPORTANT DISCLAIMERS
No Guarantee of Profit:
This indicator is an educational tool and does not guarantee any specific trading results. All trading involves substantial risk of loss. Duration estimates are statistical calculations based on historical patterns and are not guarantees of future performance.
Past Performance:
Historical backtest results and Statistical accuracy statistics do not guarantee future performance. Market conditions change constantly. What worked historically may not work in current or future markets.
Not Financial Advice:
This indicator provides technical analysis signals and statistical duration estimates only. It is not financial, investment, or trading advice. Always consult with a qualified financial advisor before making investment decisions.
Risk Warning:
Trading stocks, options, futures, forex, and cryptocurrencies involves significant risk. You can lose all of your invested capital. Never trade with money you cannot afford to lose. Only risk capital you can lose without affecting your lifestyle.
Testing Required:
Always test this indicator on a demo account or with paper trading before risking real capital. Understand how it works in different market conditions. Verify Statistical accuracy on your specific instruments and timeframes before trusting it with real money.
User Responsibility:
You are solely responsible for your trading decisions. The developer assumes no liability for trading losses, incorrect duration estimates, software errors, or any other damages incurred while using this indicator.
Statistical Estimation Limitations:
Trend Duration estimates are statistical estimates based on historical pattern matching. They are NOT guarantees. Actual trend durations may differ significantly from duration estimates due to unforeseen news events, market regime changes, or lack of historical precedent for current conditions.
CREDITS & ACKNOWLEDGMENTS
Methodology Inspiration:
• Mark Minervini - Volatility Contraction Pattern (VCP) concepts and pullback entry techniques
• William O'Neil - Volume analysis principles and CANSLIM institutional buying patterns
• Dan Zanger - Momentum breakout strategies and volatility expansion entries
Technical Components:
• SuperTrend calculation - Classic ATR-based trend indicator (public domain)
• Statistical analysis - Standard median, average, range calculations
• k-Nearest Neighbors - Classic machine learning similarity matching concept
• Multi-timeframe analysis - Standard request.security implementation in Pine Script
For questions, feedback, or support, please comment below or send a private message.
Happy Trading!

PineConnectorLibrary "PineConnector"
This library is a comprehensive alert webhook text generator for PineConnector. It contains every possible alert syntax variation from the documentation, along with some debugging functions.
To use it, just import the library (eg. "import ZenAndTheArtOfTrading/PineConnector/1 as pc") and use pc.buy(licenseID) to send an alert off to PineConnector - assuming all your webhooks etc are set up correctly.
View the PineConnector documentation for more information on how to send the commands you're looking to send (all of this library's function names match the documentation).
all()
Usage: pc.buy(pc_id, freq=pc.all())
Returns: "all"
once_per_bar()
Usage: pc.buy(pc_id, freq=pc.once_per_bar())
Returns: "once_per_bar"
once_per_bar_close()
Usage: pc.buy(pc_id, freq=pc.once_per_bar_close())
Returns: "once_per_bar_close"
na0(value)
Checks if given value is either 'na' or 0. Useful for streamlining scripts with float user setting inputs which default values to 0 since na is unavailable as a user input default.
Parameters:
value (float) : The value to check
Returns: True if the given value is 0 or na
getDecimals()
Calculates how many decimals are on the quote price of the current market.
Returns: The current decimal places on the market quote price
truncate(number, decimals)
Truncates the given number. Required params: mumber.
Parameters:
number (float) : Number to truncate
decimals (int) : Decimal places to cut down to
Returns: The input number, but as a string truncated to X decimals
getPipSize(multiplier)
Calculates the pip size of the current market.
Parameters:
multiplier (int) : The mintick point multiplier (1 by default, 10 for FX/Crypto/CFD but can be used to override when certain markets require)
Returns: The pip size for the current market
toWhole(number)
Converts pips into whole numbers. Required params: number.
Parameters:
number (float) : The pip number to convert into a whole number
Returns: The converted number
toPips(number)
Converts whole numbers back into pips. Required params: number.
Parameters:
number (float) : The whole number to convert into pips
Returns: The converted number
debug(txt, tooltip, displayLabel)
Prints to console and generates a debug label with the given text. Required params: txt.
Parameters:
txt (string) : Text to display
tooltip (string) : Tooltip to display (optional)
displayLabel (bool) : Turns on/off chart label (default: off)
Returns: Nothing
order(licenseID, command, symbol, parameters, accfilter, comment, secret, freq, debug)
Generates an alert string. Required params: licenseID, command.
Parameters:
licenseID (string) : Your PC license ID
command (string) : Command to send
symbol (string) : The symbol to trigger this order on
parameters (string) : Other optional parameters to include
accfilter (float) : Optional minimum account balance filter
comment (string) : Optional comment (maximum 20 characters)
secret (string) : Optional secret key (must be enabled in dashboard)
freq (string) : Alert frequency. Default = "all", options = "once_per_bar", "once_per_bar_close" and "none"
debug (bool) : Turns on/off debug label
Returns: An alert string with valid PC syntax based on supplied parameters
market_order(licenseID, buy, risk, sl, tp, betrigger, beoffset, spread, trailtrig, traildist, trailstep, atrtimeframe, atrperiod, atrmultiplier, atrshift, atrtrigger, symbol, accfilter, comment, secret, freq, debug)
Generates a market entry alert with relevant syntax commands. Required params: licenseID, buy, risk.
Parameters:
licenseID (string) : Your PC license ID
buy (bool) : true=buy/long, false=sell/short
risk (float) : Risk quantity (according to EA settings)
sl (float) : Stop loss distance in pips or price
tp (float) : Take profit distance in pips or price
betrigger (float) : Breakeven will be activated after the position gains this number of pips
beoffset (float) : Offset from entry price. This is the amount of pips you'd like to protect
spread (float) : Enter the position only if the spread is equal or less than the specified value in pips
trailtrig (float) : Trailing stop-loss will be activated after a trade gains this number of pips
traildist (float) : Distance of the trailing stop-loss from current price
trailstep (float) : Moves trailing stop-loss once price moves to favourable by a specified number of pips
atrtimeframe (int) : ATR Trailing Stop timeframe, only updates once per bar close. Options: 1, 5, 15, 30, 60, 240, 1440
atrperiod (int) : ATR averaging period
atrmultiplier (float) : Multiple of ATR to utilise in the new SL computation, default = 1
atrshift (int) : Relative shift of price information, 0 uses latest candle, 1 uses second last, etc. Default = 0
atrtrigger (int) : Activate the trigger of ATR Trailing after market moves favourably by a number of pips. Default = 0 (instant)
symbol (string) : The symbol to trigger this order on (defaults to current symbol)
accfilter (float) : Optional minimum account balance filter
comment (string) : Optional comment (maximum 20 characters)
secret (string) : Optional secret key (must be enabled in dashboard)
freq (string) : Alert frequency. Default = "all", options = "once_per_bar", "once_per_bar_close" and "none"
debug (bool) : Turns on/off debug label
Returns: A market order alert string with valid PC syntax based on supplied parameters
buy(licenseID, risk, sl, tp, betrigger, beoffset, spread, trailtrig, traildist, trailstep, atrtimeframe, atrperiod, atrmultiplier, atrshift, atrtrigger, symbol, accfilter, comment, secret, freq, debug)
Generates a market buy alert with relevant syntax commands. Required params: licenseID, risk.
Parameters:
licenseID (string) : Your PC license ID
risk (float) : Risk quantity (according to EA settings)
sl (float) : Stop loss distance in pips or price
tp (float) : Take profit distance in pips or price
betrigger (float) : Breakeven will be activated after the position gains this number of pips
beoffset (float) : Offset from entry price. This is the amount of pips you'd like to protect
spread (float) : Enter the position only if the spread is equal or less than the specified value in pips
trailtrig (float) : Trailing stop-loss will be activated after a trade gains this number of pips
traildist (float) : Distance of the trailing stop-loss from current price
trailstep (float) : Moves trailing stop-loss once price moves to favourable by a specified number of pips
atrtimeframe (int) : ATR Trailing Stop timeframe, only updates once per bar close. Options: 1, 5, 15, 30, 60, 240, 1440
atrperiod (int) : ATR averaging period
atrmultiplier (float) : Multiple of ATR to utilise in the new SL computation, default = 1
atrshift (int) : Relative shift of price information, 0 uses latest candle, 1 uses second last, etc. Default = 0
atrtrigger (int) : Activate the trigger of ATR Trailing after market moves favourably by a number of pips. Default = 0 (instant)
symbol (string) : The symbol to trigger this order on (defaults to current symbol)
accfilter (float) : Optional minimum account balance filter
comment (string) : Optional comment (maximum 20 characters)
secret (string) : Optional secret key (must be enabled in dashboard)
freq (string) : Alert frequency. Default = "all", options = "once_per_bar", "once_per_bar_close" and "none"
debug (bool) : Turns on/off debug label
Returns: A market order alert string with valid PC syntax based on supplied parameters
sell(licenseID, risk, sl, tp, betrigger, beoffset, spread, trailtrig, traildist, trailstep, atrtimeframe, atrperiod, atrmultiplier, atrshift, atrtrigger, symbol, accfilter, comment, secret, freq, debug)
Generates a market sell alert with relevant syntax commands. Required params: licenseID, risk.
Parameters:
licenseID (string) : Your PC license ID
risk (float) : Risk quantity (according to EA settings)
sl (float) : Stop loss distance in pips or price
tp (float) : Take profit distance in pips or price
betrigger (float) : Breakeven will be activated after the position gains this number of pips
beoffset (float) : Offset from entry price. This is the amount of pips you'd like to protect
spread (float) : Enter the position only if the spread is equal or less than the specified value in pips
trailtrig (float) : Trailing stop-loss will be activated after a trade gains this number of pips
traildist (float) : Distance of the trailing stop-loss from current price
trailstep (float) : Moves trailing stop-loss once price moves to favourable by a specified number of pips
atrtimeframe (int) : ATR Trailing Stop timeframe, only updates once per bar close. Options: 1, 5, 15, 30, 60, 240, 1440
atrperiod (int) : ATR averaging period
atrmultiplier (float) : Multiple of ATR to utilise in the new SL computation, default = 1
atrshift (int) : Relative shift of price information, 0 uses latest candle, 1 uses second last, etc. Default = 0
atrtrigger (int) : Activate the trigger of ATR Trailing after market moves favourably by a number of pips. Default = 0 (instant)
symbol (string) : The symbol to trigger this order on (defaults to current symbol)
accfilter (float) : Optional minimum account balance filter
comment (string) : Optional comment (maximum 20 characters)
secret (string) : Optional secret key (must be enabled in dashboard)
freq (string) : Alert frequency. Default = "all", options = "once_per_bar", "once_per_bar_close" and "none"
debug (bool) : Turns on/off debug label
Returns: A market order alert string with valid PC syntax based on supplied parameters
closeall(licenseID, comment, secret, freq, debug)
Closes all open trades at market regardless of symbol. Required params: licenseID.
Parameters:
licenseID (string) : Your PC license ID
comment (string) : Optional comment to include (max 20 characters)
secret (string) : Optional secret key (must be enabled in dashboard)
freq (string) : Alert frequency. Default = "all", options = "once_per_bar", "once_per_bar_close" and "none"
debug (bool) : Turns on/off debug label
Returns: The required alert syntax as a string
closealleaoff(licenseID, comment, secret, freq, debug)
Closes all open trades at market regardless of symbol, and turns the EA off. Required params: licenseID.
Parameters:
licenseID (string) : Your PC license ID
comment (string) : Optional comment to include (max 20 characters)
secret (string) : Optional secret key (must be enabled in dashboard)
freq (string) : Alert frequency. Default = "all", options = "once_per_bar", "once_per_bar_close" and "none"
debug (bool) : Turns on/off debug label
Returns: The required alert syntax as a string
closelong(licenseID, symbol, comment, secret, freq, debug)
Closes all long trades at market for the given symbol. Required params: licenseID.
Parameters:
licenseID (string) : Your PC license ID
symbol (string) : Symbol to act on (defaults to current symbol)
comment (string) : Optional comment to include (max 20 characters)
secret (string) : Optional secret key (must be enabled in dashboard)
freq (string) : Alert frequency. Default = "all", options = "once_per_bar", "once_per_bar_close" and "none"
debug (bool) : Turns on/off debug label
Returns: The required alert syntax as a string
closeshort(licenseID, symbol, comment, secret, freq, debug)
Closes all open short trades at market for the given symbol. Required params: licenseID.
Parameters:
licenseID (string) : Your PC license ID
symbol (string) : Symbol to act on (defaults to current symbol)
comment (string) : Optional comment to include (max 20 characters)
secret (string) : Optional secret key (must be enabled in dashboard)
freq (string) : Alert frequency. Default = "all", options = "once_per_bar", "once_per_bar_close" and "none"
debug (bool) : Turns on/off debug label
Returns: The required alert syntax as a string
closelongshort(licenseID, symbol, comment, secret, freq, debug)
Closes all open trades at market for the given symbol. Required params: licenseID.
Parameters:
licenseID (string) : Your PC license ID
symbol (string) : Symbol to act on (defaults to current symbol)
comment (string) : Optional comment to include (max 20 characters)
secret (string) : Optional secret key (must be enabled in dashboard)
freq (string) : Alert frequency. Default = "all", options = "once_per_bar", "once_per_bar_close" and "none"
debug (bool) : Turns on/off debug label
Returns: The required alert syntax as a string
closelongbuy(licenseID, risk, symbol, comment, secret, freq, debug)
Close all long positions and open a new long at market for the given symbol with given risk/contracts. Required params: licenseID.
Parameters:
licenseID (string) : Your PC license ID
risk (float) : Risk or contracts (according to EA settings)
symbol (string) : Symbol to act on (defaults to current symbol)
comment (string) : Optional comment to include (max 20 characters)
secret (string) : Optional secret key (must be enabled in dashboard)
freq (string) : Alert frequency. Default = "all", options = "once_per_bar", "once_per_bar_close" and "none"
debug (bool) : Turns on/off debug label
Returns: The required alert syntax as a string
closeshortsell(licenseID, risk, symbol, comment, secret, freq, debug)
Close all short positions and open a new short at market for the given symbol with given risk/contracts. Required params: licenseID, risk.
Parameters:
licenseID (string) : Your PC license ID
risk (float) : Risk or contracts (according to EA settings)
symbol (string) : Symbol to act on (defaults to current symbol)
comment (string) : Optional comment to include (max 20 characters)
secret (string) : Optional secret key (must be enabled in dashboard)
freq (string) : Alert frequency. Default = "all", options = "once_per_bar", "once_per_bar_close" and "none"
debug (bool) : Turns on/off debug label
Returns: The required alert syntax as a string
newsltplong(licenseID, sl, tp, symbol, accfilter, comment, secret, freq, debug)
Updates the stop loss and/or take profit of any open long trades on the given symbol with the given values. Required params: licenseID, sl and/or tp.
Parameters:
licenseID (string) : Your PC license ID
sl (float) : Stop loss pips or price (according to EA settings)
tp (float) : Take profit pips or price (according to EA settings)
symbol (string) : Symbol to act on (defaults to current symbol)
accfilter (float) : Optional minimum account balance filter
comment (string) : Optional comment to include (max 20 characters)
secret (string) : Optional secret key (must be enabled in dashboard)
freq (string) : Alert frequency. Default = "all", options = "once_per_bar", "once_per_bar_close" and "none"
debug (bool) : Turns on/off debug label
Returns: The required alert syntax as a string
newsltpshort(licenseID, sl, tp, symbol, accfilter, comment, secret, freq, debug)
Updates the stop loss and/or take profit of any open short trades on the given symbol with the given values. Required params: licenseID, sl and/or tp.
Parameters:
licenseID (string) : Your PC license ID
sl (float) : Stop loss pips or price (according to EA settings)
tp (float) : Take profit pips or price (according to EA settings)
symbol (string) : Symbol to act on (defaults to current symbol)
accfilter (float) : Optional minimum account balance filter
comment (string) : Optional comment to include (max 20 characters)
secret (string) : Optional secret key (must be enabled in dashboard)
freq (string) : Alert frequency. Default = "all", options = "once_per_bar", "once_per_bar_close" and "none"
debug (bool) : Turns on/off debug label
Returns: The required alert syntax as a string
closelongpct(licenseID, symbol, comment, secret, freq, debug)
Close a percentage of open long positions (according to EA settings). Required params: licenseID.
Parameters:
licenseID (string) : Your PC license ID
symbol (string) : Symbol to act on (defaults to current symbol)
comment (string) : Optional comment to include (max 20 characters)
secret (string) : Optional secret key (must be enabled in dashboard)
freq (string) : Alert frequency. Default = "all", options = "once_per_bar", "once_per_bar_close" and "none"
debug (bool) : Turns on/off debug label
Returns: The required alert syntax as a string
closeshortpct(licenseID, symbol, comment, secret, freq, debug)
Close a percentage of open short positions (according to EA settings). Required params: licenseID.
Parameters:
licenseID (string) : Your PC license ID
symbol (string) : Symbol to act on (defaults to current symbol)
comment (string) : Optional comment to include (max 20 characters)
secret (string) : Optional secret key (must be enabled in dashboard)
freq (string) : Alert frequency. Default = "all", options = "once_per_bar", "once_per_bar_close" and "none"
debug (bool) : Turns on/off debug label
Returns: The required alert syntax as a string
closelongvol(licenseID, risk, symbol, comment, secret, freq, debug)
Close all open long contracts on the current symbol until the given risk value is remaining. Required params: licenseID, risk.
Parameters:
licenseID (string) : Your PC license ID
risk (float) : The quantity to leave remaining
symbol (string) : Symbol to act on (defaults to current symbol)
comment (string) : Optional comment to include (max 20 characters)
secret (string) : Optional secret key (must be enabled in dashboard)
freq (string) : Alert frequency. Default = "all", options = "once_per_bar", "once_per_bar_close" and "none"
debug (bool) : Turns on/off debug label
Returns: The required alert syntax as a string
closeshortvol(licenseID, risk, symbol, comment, secret, freq, debug)
Close all open short contracts on the current symbol until the given risk value is remaining. Required params: licenseID, risk.
Parameters:
licenseID (string) : Your PC license ID
risk (float) : The quantity to leave remaining
symbol (string) : Symbol to act on (defaults to current symbol)
comment (string) : Optional comment to include (max 20 characters)
secret (string) : Optional secret key (must be enabled in dashboard)
freq (string) : Alert frequency. Default = "all", options = "once_per_bar", "once_per_bar_close" and "none"
debug (bool) : Turns on/off debug label
Returns: The required alert syntax as a string
limit_order(licenseID, buy, price, risk, sl, tp, betrigger, beoffset, spread, trailtrig, traildist, trailstep, atrtimeframe, atrperiod, atrmultiplier, atrshift, atrtrigger, symbol, accfilter, comment, secret, freq, debug)
Generates a limit order alert with relevant syntax commands. Required params: licenseID, buy, price, risk.
Parameters:
licenseID (string) : Your PC license ID
buy (bool) : true=buy/long, false=sell/short
price (float) : Price or pips to set limit order (according to EA settings)
risk (float) : Risk quantity (according to EA settings)
sl (float) : Stop loss distance in pips or price
tp (float) : Take profit distance in pips or price
betrigger (float) : Breakeven will be activated after the position gains this number of pips
beoffset (float) : Offset from entry price. This is the amount of pips you'd like to protect
spread (float) : Enter the position only if the spread is equal or less than the specified value in pips
trailtrig (float) : Trailing stop-loss will be activated after a trade gains this number of pips
traildist (float) : Distance of the trailing stop-loss from current price
trailstep (float) : Moves trailing stop-loss once price moves to favourable by a specified number of pips
atrtimeframe (int) : ATR Trailing Stop timeframe, only updates once per bar close. Options: 1, 5, 15, 30, 60, 240, 1440
atrperiod (int) : ATR averaging period
atrmultiplier (float) : Multiple of ATR to utilise in the new SL computation, default = 1
atrshift (int) : Relative shift of price information, 0 uses latest candle, 1 uses second last, etc. Default = 0
atrtrigger (int) : Activate the trigger of ATR Trailing after market moves favourably by a number of pips. Default = 0 (instant)
symbol (string) : The symbol to trigger this order on (defaults to current symbol)
accfilter (float) : Optional minimum account balance filter
comment (string) : Optional comment (maximum 20 characters)
secret (string) : Optional secret key (must be enabled in dashboard)
freq (string) : Alert frequency. Default = "all", options = "once_per_bar", "once_per_bar_close" and "none"
debug (bool) : Turns on/off debug label
Returns: A limit order alert string with valid PC syntax based on supplied parameters
buylimit(licenseID, price, risk, sl, tp, betrigger, beoffset, spread, trailtrig, traildist, trailstep, atrtimeframe, atrperiod, atrmultiplier, atrshift, atrtrigger, symbol, accfilter, comment, secret, freq, debug)
Generates a buylimit order alert with relevant syntax commands. Required params: licenseID, price, risk.
Parameters:
licenseID (string) : Your PC license ID
price (float) : Price or pips to set limit order (according to EA settings)
risk (float) : Risk quantity (according to EA settings)
sl (float) : Stop loss distance in pips or price
tp (float) : Take profit distance in pips or price
betrigger (float) : Breakeven will be activated after the position gains this number of pips
beoffset (float) : Offset from entry price. This is the amount of pips you'd like to protect
spread (float) : Enter the position only if the spread is equal or less than the specified value in pips
trailtrig (float) : Trailing stop-loss will be activated after a trade gains this number of pips
traildist (float) : Distance of the trailing stop-loss from current price
trailstep (float) : Moves trailing stop-loss once price moves to favourable by a specified number of pips
atrtimeframe (int) : ATR Trailing Stop timeframe, only updates once per bar close. Options: 1, 5, 15, 30, 60, 240, 1440
atrperiod (int) : ATR averaging period
atrmultiplier (float) : Multiple of ATR to utilise in the new SL computation, default = 1
atrshift (int) : Relative shift of price information, 0 uses latest candle, 1 uses second last, etc. Default = 0
atrtrigger (int) : Activate the trigger of ATR Trailing after market moves favourably by a number of pips. Default = 0 (instant)
symbol (string) : The symbol to trigger this order on (defaults to current symbol)
accfilter (float) : Optional minimum account balance filter
comment (string) : Optional comment (maximum 20 characters)
secret (string) : Optional secret key (must be enabled in dashboard)
freq (string) : Alert frequency. Default = "all", options = "once_per_bar", "once_per_bar_close" and "none"
debug (bool) : Turns on/off debug label
Returns: A limit order alert string with valid PC syntax based on supplied parameters
selllimit(licenseID, price, risk, sl, tp, betrigger, beoffset, spread, trailtrig, traildist, trailstep, atrtimeframe, atrperiod, atrmultiplier, atrshift, atrtrigger, symbol, accfilter, comment, secret, freq, debug)
Generates a selllimit order alert with relevant syntax commands. Required params: licenseID, price, risk.
Parameters:
licenseID (string) : Your PC license ID
price (float) : Price or pips to set limit order (according to EA settings)
risk (float) : Risk quantity (according to EA settings)
sl (float) : Stop loss distance in pips or price
tp (float) : Take profit distance in pips or price
betrigger (float) : Breakeven will be activated after the position gains this number of pips
beoffset (float) : Offset from entry price. This is the amount of pips you'd like to protect
spread (float) : Enter the position only if the spread is equal or less than the specified value in pips
trailtrig (float) : Trailing stop-loss will be activated after a trade gains this number of pips
traildist (float) : Distance of the trailing stop-loss from current price
trailstep (float) : Moves trailing stop-loss once price moves to favourable by a specified number of pips
atrtimeframe (int) : ATR Trailing Stop timeframe, only updates once per bar close. Options: 1, 5, 15, 30, 60, 240, 1440
atrperiod (int) : ATR averaging period
atrmultiplier (float) : Multiple of ATR to utilise in the new SL computation, default = 1
atrshift (int) : Relative shift of price information, 0 uses latest candle, 1 uses second last, etc. Default = 0
atrtrigger (int) : Activate the trigger of ATR Trailing after market moves favourably by a number of pips. Default = 0 (instant)
symbol (string) : The symbol to trigger this order on (defaults to current symbol)
accfilter (float) : Optional minimum account balance filter
comment (string) : Optional comment (maximum 20 characters)
secret (string) : Optional secret key (must be enabled in dashboard)
freq (string) : Alert frequency. Default = "all", options = "once_per_bar", "once_per_bar_close" and "none"
debug (bool) : Turns on/off debug label
Returns: A limit order alert string with valid PC syntax based on supplied parameters
stop_order(licenseID, buy, price, risk, sl, tp, betrigger, beoffset, spread, trailtrig, traildist, trailstep, atrtimeframe, atrperiod, atrmultiplier, atrshift, atrtrigger, symbol, accfilter, comment, secret, freq, debug)
Generates a stop order alert with relevant syntax commands. Required params: licenseID, buy, price, risk.
Parameters:
licenseID (string) : Your PC license ID
buy (bool) : true=buy/long, false=sell/short
price (float) : Price or pips to set limit order (according to EA settings)
risk (float) : Risk quantity (according to EA settings)
sl (float) : Stop loss distance in pips or price
tp (float) : Take profit distance in pips or price
betrigger (float) : Breakeven will be activated after the position gains this number of pips
beoffset (float) : Offset from entry price. This is the amount of pips you'd like to protect
spread (float) : Enter the position only if the spread is equal or less than the specified value in pips
trailtrig (float) : Trailing stop-loss will be activated after a trade gains this number of pips
traildist (float) : Distance of the trailing stop-loss from current price
trailstep (float) : Moves trailing stop-loss once price moves to favourable by a specified number of pips
atrtimeframe (int) : ATR Trailing Stop timeframe, only updates once per bar close. Options: 1, 5, 15, 30, 60, 240, 1440
atrperiod (int) : ATR averaging period
atrmultiplier (float) : Multiple of ATR to utilise in the new SL computation, default = 1
atrshift (int) : Relative shift of price information, 0 uses latest candle, 1 uses second last, etc. Default = 0
atrtrigger (int) : Activate the trigger of ATR Trailing after market moves favourably by a number of pips. Default = 0 (instant)
symbol (string) : The symbol to trigger this order on (defaults to current symbol)
accfilter (float) : Optional minimum account balance filter
comment (string) : Optional comment (maximum 20 characters)
secret (string) : Optional secret key (must be enabled in dashboard)
freq (string) : Alert frequency. Default = "all", options = "once_per_bar", "once_per_bar_close" and "none"
debug (bool) : Turns on/off debug label
Returns: A stop order alert string with valid PC syntax based on supplied parameters
buystop(licenseID, price, risk, sl, tp, betrigger, beoffset, spread, trailtrig, traildist, trailstep, atrtimeframe, atrperiod, atrmultiplier, atrshift, atrtrigger, symbol, accfilter, comment, secret, freq, debug)
Generates a buystop order alert with relevant syntax commands. Required params: licenseID, price, risk.
Parameters:
licenseID (string) : Your PC license ID
price (float) : Price or pips to set limit order (according to EA settings)
risk (float) : Risk quantity (according to EA settings)
sl (float) : Stop loss distance in pips or price
tp (float) : Take profit distance in pips or price
betrigger (float) : Breakeven will be activated after the position gains this number of pips
beoffset (float) : Offset from entry price. This is the amount of pips you'd like to protect
spread (float) : Enter the position only if the spread is equal or less than the specified value in pips
trailtrig (float) : Trailing stop-loss will be activated after a trade gains this number of pips
traildist (float) : Distance of the trailing stop-loss from current price
trailstep (float) : Moves trailing stop-loss once price moves to favourable by a specified number of pips
atrtimeframe (int) : ATR Trailing Stop timeframe, only updates once per bar close. Options: 1, 5, 15, 30, 60, 240, 1440
atrperiod (int) : ATR averaging period
atrmultiplier (float) : Multiple of ATR to utilise in the new SL computation, default = 1
atrshift (int) : Relative shift of price information, 0 uses latest candle, 1 uses second last, etc. Default = 0
atrtrigger (int) : Activate the trigger of ATR Trailing after market moves favourably by a number of pips. Default = 0 (instant)
symbol (string) : The symbol to trigger this order on (defaults to current symbol)
accfilter (float) : Optional minimum account balance filter
comment (string) : Optional comment (maximum 20 characters)
secret (string) : Optional secret key (must be enabled in dashboard)
freq (string) : Alert frequency. Default = "all", options = "once_per_bar", "once_per_bar_close" and "none"
debug (bool) : Turns on/off debug label
Returns: A stop order alert string with valid PC syntax based on supplied parameters
sellstop(licenseID, price, risk, sl, tp, betrigger, beoffset, spread, trailtrig, traildist, trailstep, atrtimeframe, atrperiod, atrmultiplier, atrshift, atrtrigger, symbol, accfilter, comment, secret, freq, debug)
Generates a sellstop order alert with relevant syntax commands. Required params: licenseID, price, risk.
Parameters:
licenseID (string) : Your PC license ID
price (float) : Price or pips to set limit order (according to EA settings)
risk (float) : Risk quantity (according to EA settings)
sl (float) : Stop loss distance in pips or price
tp (float) : Take profit distance in pips or price
betrigger (float) : Breakeven will be activated after the position gains this number of pips
beoffset (float) : Offset from entry price. This is the amount of pips you'd like to protect
spread (float) : Enter the position only if the spread is equal or less than the specified value in pips
trailtrig (float) : Trailing stop-loss will be activated after a trade gains this number of pips
traildist (float) : Distance of the trailing stop-loss from current price
trailstep (float) : Moves trailing stop-loss once price moves to favourable by a specified number of pips
atrtimeframe (int) : ATR Trailing Stop timeframe, only updates once per bar close. Options: 1, 5, 15, 30, 60, 240, 1440
atrperiod (int) : ATR averaging period
atrmultiplier (float) : Multiple of ATR to utilise in the new SL computation, default = 1
atrshift (int) : Relative shift of price information, 0 uses latest candle, 1 uses second last, etc. Default = 0
atrtrigger (int) : Activate the trigger of ATR Trailing after market moves favourably by a number of pips. Default = 0 (instant)
symbol (string) : The symbol to trigger this order on (defaults to current symbol)
accfilter (float) : Optional minimum account balance filter
comment (string) : Optional comment (maximum 20 characters)
secret (string) : Optional secret key (must be enabled in dashboard)
freq (string) : Alert frequency. Default = "all", options = "once_per_bar", "once_per_bar_close" and "none"
debug (bool) : Turns on/off debug label
Returns: A stop order alert string with valid PC syntax based on supplied parameters
cancel_neworder(licenseID, order, price, risk, sl, tp, betrigger, beoffset, spread, trailtrig, traildist, trailstep, atrtimeframe, atrperiod, atrmultiplier, atrshift, atrtrigger, symbol, accfilter, comment, secret, freq, debug)
Cancel + place new order template function.
Parameters:
licenseID (string) : Your PC license ID
order (string) : Cancel order type
price (float) : Price or pips to set limit order (according to EA settings)
risk (float) : Risk quantity (according to EA settings)
sl (float) : Stop loss distance in pips or price
tp (float) : Take profit distance in pips or price
betrigger (float) : Breakeven will be activated after the position gains this number of pips
beoffset (float) : Offset from entry price. This is the amount of pips you'd like to protect
spread (float) : Enter the position only if the spread is equal or less than the specified value in pips
trailtrig (float) : Trailing stop-loss will be activated after a trade gains this number of pips
traildist (float) : Distance of the trailing stop-loss from current price
trailstep (float) : Moves trailing stop-loss once price moves to favourable by a specified number of pips
atrtimeframe (int) : ATR Trailing Stop timeframe, only updates once per bar close. Options: 1, 5, 15, 30, 60, 240, 1440
atrperiod (int) : ATR averaging period
atrmultiplier (float) : Multiple of ATR to utilise in the new SL computation, default = 1
atrshift (int) : Relative shift of price information, 0 uses latest candle, 1 uses second last, etc. Default = 0
atrtrigger (int) : Activate the trigger of ATR Trailing after market moves favourably by a number of pips. Default = 0 (instant)
symbol (string) : The symbol to trigger this order on (defaults to current symbol)
accfilter (float) : Optional minimum account balance filter
comment (string) : Optional comment (maximum 20 characters)
secret (string) : Optional secret key (must be enabled in dashboard)
freq (string) : Alert frequency. Default = "all", options = "once_per_bar", "once_per_bar_close" and "none"
debug (bool) : Turns on/off debug label
Returns: A stop order alert string with valid PC syntax based on supplied parameters
cancellongbuystop(licenseID, price, risk, sl, tp, betrigger, beoffset, spread, trailtrig, traildist, trailstep, atrtimeframe, atrperiod, atrmultiplier, atrshift, atrtrigger, symbol, accfilter, comment, secret, freq, debug)
Cancels all long orders with the specified symbol and places a new buystop order. Required params: licenseID, price, risk.
Parameters:
licenseID (string) : Your PC license ID
price (float) : Price or pips to set limit order (according to EA settings)
risk (float) : Risk quantity (according to EA settings)
sl (float) : Stop loss distance in pips or price
tp (float) : Take profit distance in pips or price
betrigger (float) : Breakeven will be activated after the position gains this number of pips
beoffset (float) : Offset from entry price. This is the amount of pips you'd like to protect
spread (float) : Enter the position only if the spread is equal or less than the specified value in pips
trailtrig (float) : Trailing stop-loss will be activated after a trade gains this number of pips
traildist (float) : Distance of the trailing stop-loss from current price
trailstep (float) : Moves trailing stop-loss once price moves to favourable by a specified number of pips
atrtimeframe (int) : ATR Trailing Stop timeframe, only updates once per bar close. Options: 1, 5, 15, 30, 60, 240, 1440
atrperiod (int) : ATR averaging period
atrmultiplier (float) : Multiple of ATR to utilise in the new SL computation, default = 1
atrshift (int) : Relative shift of price information, 0 uses latest candle, 1 uses second last, etc. Default = 0
atrtrigger (int) : Activate the trigger of ATR Trailing after market moves favourably by a number of pips. Default = 0 (instant)
symbol (string) : The symbol to trigger this order on (defaults to current symbol)
accfilter (float) : Optional minimum account balance filter
comment (string) : Optional comment (maximum 20 characters)
secret (string) : Optional secret key (must be enabled in dashboard)
freq (string) : Alert frequency. Default = "all", options = "once_per_bar", "once_per_bar_close" and "none"
debug (bool) : Turns on/off debug label
Returns: A stop order alert string with valid PC syntax based on supplied parameters
cancellongbuylimit(licenseID, price, risk, sl, tp, betrigger, beoffset, spread, trailtrig, traildist, trailstep, atrtimeframe, atrperiod, atrmultiplier, atrshift, atrtrigger, symbol, accfilter, comment, secret, freq, debug)
Cancels all long orders with the specified symbol and places a new buylimit order. Required params: licenseID, price, risk.
Parameters:
licenseID (string) : Your PC license ID
price (float) : Price or pips to set limit order (according to EA settings)
risk (float) : Risk quantity (according to EA settings)
sl (float) : Stop loss distance in pips or price
tp (float) : Take profit distance in pips or price
betrigger (float) : Breakeven will be activated after the position gains this number of pips
beoffset (float) : Offset from entry price. This is the amount of pips you'd like to protect
spread (float) : Enter the position only if the spread is equal or less than the specified value in pips
trailtrig (float) : Trailing stop-loss will be activated after a trade gains this number of pips
traildist (float) : Distance of the trailing stop-loss from current price
trailstep (float) : Moves trailing stop-loss once price moves to favourable by a specified number of pips
atrtimeframe (int) : ATR Trailing Stop timeframe, only updates once per bar close. Options: 1, 5, 15, 30, 60, 240, 1440
atrperiod (int) : ATR averaging period
atrmultiplier (float) : Multiple of ATR to utilise in the new SL computation, default = 1
atrshift (int) : Relative shift of price information, 0 uses latest candle, 1 uses second last, etc. Default = 0
atrtrigger (int) : Activate the trigger of ATR Trailing after market moves favourably by a number of pips. Default = 0 (instant)
symbol (string) : The symbol to trigger this order on (defaults to current symbol)
accfilter (float) : Optional minimum account balance filter
comment (string) : Optional comment (maximum 20 characters)
secret (string) : Optional secret key (must be enabled in dashboard)
freq (string) : Alert frequency. Default = "all", options = "once_per_bar", "once_per_bar_close" and "none"
debug (bool) : Turns on/off debug label
Returns: A stop order alert string with valid PC syntax based on supplied parameters
cancelshortsellstop(licenseID, price, risk, sl, tp, betrigger, beoffset, spread, trailtrig, traildist, trailstep, atrtimeframe, atrperiod, atrmultiplier, atrshift, atrtrigger, symbol, accfilter, comment, secret, freq, debug)
Cancels all short orders with the specified symbol and places a sellstop order. Required params: licenseID, price, risk.
Parameters:
licenseID (string) : Your PC license ID
price (float) : Price or pips to set limit order (according to EA settings)
risk (float) : Risk quantity (according to EA settings)
sl (float) : Stop loss distance in pips or price
tp (float) : Take profit distance in pips or price
betrigger (float) : Breakeven will be activated after the position gains this number of pips
beoffset (float) : Offset from entry price. This is the amount of pips you'd like to protect
spread (float) : Enter the position only if the spread is equal or less than the specified value in pips
trailtrig (float) : Trailing stop-loss will be activated after a trade gains this number of pips
traildist (float) : Distance of the trailing stop-loss from current price
trailstep (float) : Moves trailing stop-loss once price moves to favourable by a specified number of pips
atrtimeframe (int) : ATR Trailing Stop timeframe, only updates once per bar close. Options: 1, 5, 15, 30, 60, 240, 1440
atrperiod (int) : ATR averaging period
atrmultiplier (float) : Multiple of ATR to utilise in the new SL computation, default = 1
atrshift (int) : Relative shift of price information, 0 uses latest candle, 1 uses second last, etc. Default = 0
atrtrigger (int) : Activate the trigger of ATR Trailing after market moves favourably by a number of pips. Default = 0 (instant)
symbol (string) : The symbol to trigger this order on (defaults to current symbol)
accfilter (float) : Optional minimum account balance filter
comment (string) : Optional comment (maximum 20 characters)
secret (string) : Optional secret key (must be enabled in dashboard)
freq (string) : Alert frequency. Default = "all", options = "once_per_bar", "once_per_bar_close" and "none"
debug (bool) : Turns on/off debug label
Returns: A stop order alert string with valid PC syntax based on supplied parameters
cancelshortselllimit(licenseID, price, risk, sl, tp, betrigger, beoffset, spread, trailtrig, traildist, trailstep, atrtimeframe, atrperiod, atrmultiplier, atrshift, atrtrigger, symbol, accfilter, comment, secret, freq, debug)
Cancels all short orders with the specified symbol and places a selllimit order. Required params: licenseID, price, risk.
Parameters:
licenseID (string) : Your PC license ID
price (float) : Price or pips to set limit order (according to EA settings)
risk (float) : Risk quantity (according to EA settings)
sl (float) : Stop loss distance in pips or price
tp (float) : Take profit distance in pips or price
betrigger (float) : Breakeven will be activated after the position gains this number of pips
beoffset (float) : Offset from entry price. This is the amount of pips you'd like to protect
spread (float) : Enter the position only if the spread is equal or less than the specified value in pips
trailtrig (float) : Trailing stop-loss will be activated after a trade gains this number of pips
traildist (float) : Distance of the trailing stop-loss from current price
trailstep (float) : Moves trailing stop-loss once price moves to favourable by a specified number of pips
atrtimeframe (int) : ATR Trailing Stop timeframe, only updates once per bar close. Options: 1, 5, 15, 30, 60, 240, 1440
atrperiod (int) : ATR averaging period
atrmultiplier (float) : Multiple of ATR to utilise in the new SL computation, default = 1
atrshift (int) : Relative shift of price information, 0 uses latest candle, 1 uses second last, etc. Default = 0
atrtrigger (int) : Activate the trigger of ATR Trailing after market moves favourably by a number of pips. Default = 0 (instant)
symbol (string) : The symbol to trigger this order on (defaults to current symbol)
accfilter (float) : Optional minimum account balance filter
comment (string) : Optional comment (maximum 20 characters)
secret (string) : Optional secret key (must be enabled in dashboard)
freq (string) : Alert frequency. Default = "all", options = "once_per_bar", "once_per_bar_close" and "none"
debug (bool) : Turns on/off debug label
Returns: A stop order alert string with valid PC syntax based on supplied parameters
cancellong(licenseID, symbol, accfilter, comment, secret, freq, debug)
Cancels all pending long orders with the specified symbol. Required params: licenseID.
Parameters:
licenseID (string) : Your PC license ID
symbol (string) : Symbol to act on (defaults to current symbol)
accfilter (float) : Optional minimum account balance filter
comment (string) : Optional comment to include (max 20 characters)
secret (string) : Optional secret key (must be enabled in dashboard)
freq (string) : Alert frequency. Default = "all", options = "once_per_bar", "once_per_bar_close" and "none"
debug (bool) : Turns on/off debug label
Returns: A cancel long alert command
cancelshort(licenseID, symbol, accfilter, comment, secret, freq, debug)
Cancels all pending short orders with the specified symbol. Required params: licenseID.
Parameters:
licenseID (string) : Your PC license ID
symbol (string) : Symbol to act on (defaults to current symbol)
accfilter (float) : Optional minimum account balance filter
comment (string) : Optional comment to include (max 20 characters)
secret (string) : Optional secret key (must be enabled in dashboard)
freq (string) : Alert frequency. Default = "all", options = "once_per_bar", "once_per_bar_close" and "none"
debug (bool) : Turns on/off debug label
Returns: A cancel short alert command
newsltpbuystop(licenseID, sl, tp, symbol, accfilter, comment, secret, freq, debug)
Updates the stop loss and/or take profit of any pending buy stop orders on the given symbol. Required params: licenseID, sl and/or tp.
Parameters:
licenseID (string) : Your PC license ID
sl (float) : Stop loss pips or price (according to EA settings)
tp (float) : Take profit pips or price (according to EA settings)
symbol (string) : Symbol to act on (defaults to current symbol)
accfilter (float) : Optional minimum account balance filter
comment (string) : Optional comment to include (max 20 characters)
secret (string) : Optional secret key (must be enabled in dashboard)
freq (string) : Alert frequency. Default = "all", options = "once_per_bar", "once_per_bar_close" and "none"
debug (bool) : Turns on/off debug label
Returns: The required alert syntax as a string
newsltpbuylimit(licenseID, sl, tp, symbol, accfilter, comment, secret, freq, debug)
Updates the stop loss and/or take profit of any pending buy limit orders on the given symbol. Required params: licenseID, sl and/or tp.
Parameters:
licenseID (string) : Your PC license ID
sl (float) : Stop loss pips or price (according to EA settings)
tp (float) : Take profit pips or price (according to EA settings)
symbol (string) : Symbol to act on (defaults to current symbol)
accfilter (float) : Optional minimum account balance filter
comment (string) : Optional comment to include (max 20 characters)
secret (string) : Optional secret key (must be enabled in dashboard)
freq (string) : Alert frequency. Default = "all", options = "once_per_bar", "once_per_bar_close" and "none"
debug (bool) : Turns on/off debug label
Returns: The required alert syntax as a string
newsltpsellstop(licenseID, sl, tp, symbol, accfilter, comment, secret, freq, debug)
Updates the stop loss and/or take profit of any pending sell stop orders on the given symbol. Required params: licenseID, sl and/or tp.
Parameters:
licenseID (string) : Your PC license ID
sl (float) : Stop loss pips or price (according to EA settings)
tp (float) : Take profit pips or price (according to EA settings)
symbol (string) : Symbol to act on (defaults to current symbol)
accfilter (float) : Optional minimum account balance filter
comment (string) : Optional comment to include (max 20 characters)
secret (string) : Optional secret key (must be enabled in dashboard)
freq (string) : Alert frequency. Default = "all", options = "once_per_bar", "once_per_bar_close" and "none"
debug (bool) : Turns on/off debug label
Returns: The required alert syntax as a string
newsltpselllimit(licenseID, sl, tp, symbol, accfilter, comment, secret, freq, debug)
Updates the stop loss and/or take profit of any pending sell limit orders on the given symbol. Required params: licenseID, sl and/or tp.
Parameters:
licenseID (string) : Your PC license ID
sl (float) : Stop loss pips or price (according to EA settings)
tp (float) : Take profit pips or price (according to EA settings)
symbol (string) : Symbol to act on (defaults to current symbol)
accfilter (float) : Optional minimum account balance filter
comment (string) : Optional comment to include (max 20 characters)
secret (string) : Optional secret key (must be enabled in dashboard)
freq (string) : Alert frequency. Default = "all", options = "once_per_bar", "once_per_bar_close" and "none"
debug (bool) : Turns on/off debug label
Returns: The required alert syntax as a string
eaoff(licenseID, secret, freq, debug)
Turns the EA off. Required params: licenseID.
Parameters:
licenseID (string) : Your PC license ID
secret (string) : Optional secret key (must be enabled in dashboard)
freq (string) : Alert frequency. Default = "all", options = "once_per_bar", "once_per_bar_close" and "none"
debug (bool) : Turns on/off debug label
Returns: The required alert syntax as a string
eaon(licenseID, secret, freq, debug)
Turns the EA on. Required params: licenseID.
Parameters:
licenseID (string) : Your PC license ID
secret (string) : Optional secret key (must be enabled in dashboard)
freq (string) : Alert frequency. Default = "all", options = "once_per_bar", "once_per_bar_close" and "none"
debug (bool) : Turns on/off debug label
Returns: The required alert syntax as a string

ICT Killzones and Sessions W/ Silver Bullet + MacrosForex and Equity Session Tracker with Killzones, Silver Bullet, and Macro Times
This Pine Script indicator is a comprehensive timekeeping tool designed specifically for ICT traders using any time-based strategy. It helps you visualize and keep track of forex and equity session times, kill zones, macro times, and silver bullet hours.
Features:
Session and Killzone Lines:
Green: London Open (LO)
White: New York (NY)
Orange: Australian (AU)
Purple: Asian (AS)
Includes AM and PM session markers.
Dotted/Striped Lines indicate overlapping kill zones within the session timeline.
Customization Options:
Display sessions and killzones in collapsed or full view.
Hide specific sessions or killzones based on your preferences.
Customize colors, texts, and sizes.
Option to hide drawings older than the current day.
Automatic Updates:
The indicator draws all lines and boxes at the start of a new day.
Automatically adjusts time-based boxes according to the New York timezone.
Killzone Time Windows (for indices):
London KZ: 02:00 - 05:00
New York AM KZ: 07:00 - 10:00
New York PM KZ: 13:30 - 16:00
Silver Bullet Times:
03:00 - 04:00
10:00 - 11:00
14:00 - 15:00
Macro Times:
02:33 - 03:00
04:03 - 04:30
08:50 - 09:10
09:50 - 10:10
10:50 - 11:10
11:50 - 12:50
Latest Update:
January 15:
Added option to automatically change text coloring based on the chart.
Included additional optional macro times per user request:
12:50 - 13:10
13:50 - 14:15
14:50 - 15:10
15:50 - 16:15
Usage:
To maximize your experience, minimize the pane where the script is drawn. This minimizes distractions while keeping the essential time markers visible. The script is designed to help traders by clearly annotating key trading periods without overwhelming their charts.
Originality and Justification:
This indicator uniquely integrates various time-based strategies essential for ICT traders. Unlike other indicators, it consolidates session times, kill zones, macro times, and silver bullet hours into one comprehensive tool. This allows traders to have a clear and organized view of critical trading periods, facilitating better decision-making.
Credits:
This script incorporates open-source elements with significant improvements to enhance functionality and user experience.
Forex and Equity Session Tracker with Killzones, Silver Bullet, and Macro Times
This Pine Script indicator is a comprehensive timekeeping tool designed specifically for ICT traders using any time-based strategy. It helps you visualize and keep track of forex and equity session times, kill zones, macro times, and silver bullet hours.
Features:
Session and Killzone Lines:
Green: London Open (LO)
White: New York (NY)
Orange: Australian (AU)
Purple: Asian (AS)
Includes AM and PM session markers.
Dotted/Striped Lines indicate overlapping kill zones within the session timeline.
Customization Options:
Display sessions and killzones in collapsed or full view.
Hide specific sessions or killzones based on your preferences.
Customize colors, texts, and sizes.
Option to hide drawings older than the current day.
Automatic Updates:
The indicator draws all lines and boxes at the start of a new day.
Automatically adjusts time-based boxes according to the New York timezone.
Killzone Time Windows (for indices):
London KZ: 02:00 - 05:00
New York AM KZ: 07:00 - 10:00
New York PM KZ: 13:30 - 16:00
Silver Bullet Times:
03:00 - 04:00
10:00 - 11:00
14:00 - 15:00
Macro Times:
02:33 - 03:00
04:03 - 04:30
08:50 - 09:10
09:50 - 10:10
10:50 - 11:10
11:50 - 12:50
Latest Update:
January 15:
Added option to automatically change text coloring based on the chart.
Included additional optional macro times per user request:
12:50 - 13:10
13:50 - 14:15
14:50 - 15:10
15:50 - 16:15
ICT Sessions and Kill Zones
What They Are:
ICT Sessions: These are specific times during the trading day when market activity is expected to be higher, such as the London Open, New York Open, and the Asian session.
Kill Zones: These are specific time windows within these sessions where the probability of significant price movements is higher. For example, the New York AM Kill Zone is typically from 8:30 AM to 11:00 AM EST.
How to Use Them:
Identify the Session: Determine which trading session you are in (London, New York, or Asian).
Focus on Kill Zones: Within that session, focus on the kill zones for potential trade setups. For instance, during the New York session, look for setups between 8:30 AM and 11:00 AM EST.
Silver Bullets
What They Are:
Silver Bullets: These are specific, high-probability trade setups that occur within the kill zones. They are designed to be "one shot, one kill" trades, meaning they aim for precise and effective entries and exits.
How to Use Them:
Time-Based Setup: Look for these setups within the designated kill zones. For example, between 10:00 AM and 11:00 AM for the New York AM session .
Chart Analysis: Start with higher time frames like the 15-minute chart and then refine down to 5-minute and 1-minute charts to identify imbalances or specific patterns .
Macros
What They Are:
Macros: These are broader market conditions and trends that influence your trading decisions. They include understanding the overall market direction, seasonal tendencies, and the Commitment of Traders (COT) reports.
How to Use Them:
Understand Market Conditions: Be aware of the macroeconomic factors and market conditions that could affect price movements.
Seasonal Tendencies: Know the seasonal patterns that might influence the market direction.
COT Reports: Use the Commitment of Traders reports to understand the positioning of large traders and commercial hedgers .
Putting It All Together
Preparation: Understand the macro conditions and review the COT reports.
Session and Kill Zone: Identify the trading session and focus on the kill zones.
Silver Bullet Setup: Look for high-probability setups within the kill zones using refined chart analysis.
Execution: Execute the trade with precision, aiming for a "one shot, one kill" outcome.
By following these steps, you can effectively use ICT sessions, kill zones, silver bullets, and macros to enhance your trading strategy.
Usage:
To maximize your experience, shrink the pane where the script is drawn. This minimizes distractions while keeping the essential time markers visible. The script is designed to help traders by clearly annotating key trading periods without overwhelming their charts.
Originality and Justification:
This indicator uniquely integrates various time-based strategies essential for ICT traders. Unlike other indicators, it consolidates session times, kill zones, macro times, and silver bullet hours into one comprehensive tool. This allows traders to have a clear and organized view of critical trading periods, facilitating better decision-making.
Credits:
This script incorporates open-source elements with significant improvements to enhance functionality and user experience. All credit goes to itradesize for the SB + Macro boxes

Impulse Reactor RSI-SMA Trend Indicator [ApexLegion]Impulse Reactor RSI-SMA Trend Indicator
Introduction and Theoretical Background
Design Rationale
Standard indicators frequently generate binary 'BUY' or 'SELL' signals without accounting for the broader market context. This often results in erratic "Flip-Flop" behavior, where signals are triggered indiscriminately regardless of the prevailing volatility regime.
Impulse Reactor was engineered to address this limitation by unifying two critical requirements: Quantitative Rigor and Execution Flexibility.
The Solution
Composite Analytical Framework This script is not a simple visual overlay of existing indicators. It is an algorithmic synthesis designed to function as a unified decision-making engine. The primary objective was to implement rigorous quantitative analysis (Volatility Normalization, Structural Filtering) directly within an alert-enabled framework. This architecture is designed to process signals through strict, multi-factor validation protocols before generating real-time notifications, allowing users to focus on structurally validated setups without manual monitoring.
How It Works
This is not a simple visual mashup. It utilizes a cross-validation algorithm where the Trend Structure acts as a gatekeeper for Momentum signals:
Logic over Lag: Unlike simple moving average crossovers, this script uses a 15-layer Gradient Ribbon to detect "Laminar Flow." If the ribbon is knotted (Compression), the system mathematically suppresses all signals.
Volatility Normalization: The core calculation adapts to ATR (Average True Range). This means the indicator automatically expands in volatile markets and contracts in quiet ones, maintaining accuracy without constant manual tweaking.
Adaptive Signal Thresholding: It incorporates an 'Anti-Greed' algorithm (Dynamic Thresholding) that automatically adjusts entry criteria based on trend duration. This logic aims to mitigate the risk of entering positions during periods of statistical trend exhaustion.
Why Use It?
Market State Decoding: The gradient Ribbon visualizes the underlying trend phase in real-time.
◦ Cyan/Blue Flow: Strong Bullish Trend (Laminar Flow).
◦ Magenta/Pink Flow: Strong Bearish Trend.
◦ Compressed/Knotted: When the ribbon lines are tightly squeezed or overlapping, it signals Consolidation. The system filters signals here to avoid chop.
Noise Reduction: The goal is not to catch every pivot, but to isolate high-confidence setups. The logic explicitly filters out minor fluctuations to help maintain position alignment with the broader trend.
⚖️ Chapter 1: System Architecture
Introduction: Composite Analytical Framework
System Overview
Impulse Reactor serves as a comprehensive technical analysis engine designed to synthesize three distinct market dimensions—Momentum, Volatility, and Trend Structure—into a unified decision-making framework. Unlike traditional methods that analyze these metrics in isolation, this system functions as a central processing unit that integrates disparate data streams to construct a coherent model of market behavior.
Operational Objective
The primary objective is to transition from single-dimensional signal generation to a multi-factor assessment model. By fusing data from the Impulse Core (Volatility), Gradient Oscillator (Momentum), and Structural Baseline (Trend), the system aims to filter out stochastic noise and identify high-probability trade setups grounded in quantitative confluence.
Market Microstructure Analysis: Limitations of Conventional Models
Extensive backtesting and quantitative analysis have identified three critical inefficiencies in standard oscillator-based strategies:
• Bounded Oscillator Limitations (The "Oscillation Trap"): Traditional indicators such as RSI or Stochastics are mathematically constrained between fixed values (0 to 100). In strong trending environments, these metrics often saturate in "overbought" or "oversold" zones. Consequently, traders relying on static thresholds frequently exit structurally valid positions prematurely or initiate counter-trend trades against prevailing momentum, resulting in suboptimal performance.
• Quantitative Blindness to Quality: Standard moving averages and trend indicators often fail to distinguish the qualitative nature of price movement. They treat low-volume drift and high-velocity expansion identically. This inability to account for "Volatility Quality" leads to delayed responsiveness during critical market events.
• Fractal Dissonance (Timeframe Disconnect): Financial markets exhibit fractal characteristics where trends on lower timeframes may contradict higher timeframe structures. Manual integration of multi-timeframe analysis increases cognitive load and susceptibility to human error, often resulting in conflicting biases at the point of execution.
Core Design Principles
To mitigate the aforementioned systemic inefficiencies, Impulse Reactor employs a modular architecture governed by three foundational principles:
Principle A:
Volatility Precursor Analysis Market mechanics demonstrate that volatility expansion often functions as a leading indicator for directional price movement. The system is engineered to detect "Volatility Deviation" — specifically, the divergence between short-term and long-term volatility baselines—prior to its manifestation in price action. This allows for entry timing aligned with the expansion phase of market volatility.
Principle B:
Momentum Density Visualization The system replaces singular momentum lines with a "Momentum Density" model utilizing a 15-layer Simple Moving Average (SMA) Ribbon.
• Concept: This visualization represents the aggregate strength and consistency of the trend.
• Application: A fully aligned and expanded ribbon indicates a robust trend structure ("Laminar Flow") capable of withstanding minor counter-trend noise, whereas a compressed ribbon signals consolidation or structural weakness.
Principle C:
Adaptive Confluence Protocols Signal validity is strictly governed by a multi-dimensional confluence logic. The system suppresses signal generation unless there is synchronized confirmation across all three analytical vectors:
1. Volatility: Confirmed expansion via the Impulse Core.
2. Momentum: Directional alignment via the Hybrid Oscillator.
3. Structure: Trend validation via the Baseline. This strict filtering mechanism significantly reduces false positives in non-trending (choppy) environments while maintaining sensitivity to genuine breakouts.
🔍 Chapter 2: Core Modules & Algorithmic Logic
Module A: Impulse Core (Normalized Volatility Deviation)
Operational Logic The Impulse Core functions as a volatility-normalized momentum gauge rather than a standard oscillator. It is designed to identify "Volatility Contraction" (Squeeze) and "Volatility Expansion" phases by quantifying the divergence between short-term and long-term volatility states.
Volatility Z-Score Normalization
The formula implements a custom normalization algorithm. Unlike standard oscillators that rely on absolute price changes, this logic calculates the Z-Score of the Volatility Spread.
◦ Numerator: (atr_f - atr_s) captures the raw momentum of volatility expansion.
◦ Denominator: (std_f + 1e-6) standardizes this value against historical variance.
◦ Result: This allows the indicator scales consistently across assets (e.g., Bitcoin vs. Euro) without manual recalibration.
f_impulse() =>
atr_f = ta.atr(fastLen) // Fast Volatility Baseline
atr_s = ta.atr(slowLen) // Slow Volatility Baseline
std_f = ta.stdev(atr_f, devLen) // Volatility Standard Deviation
(atr_f - atr_s) / (std_f + 1e-6) // Normalized Differential Calculation
Algorithmic Framework
• Differential Calculation: The system computes the spread between a Fast Volatility Baseline (ATR-10) and a Slow Volatility Baseline (ATR-30).
• Normalization Protocol: To standardize consistency across diverse asset classes (e.g., Forex vs. Crypto), the raw differential is divided by the standard deviation of the volatility itself over a 30-period lookback.
• Signal Generation:
◦ Contraction (Squeeze): When the Fast ATR compresses below the Slow ATR, it registers a potential volatility buildup phase.
◦ Expansion (Release): A rapid divergence of the Fast ATR above the Slow ATR signals a confirmed volatility expansion, validating the strength of the move.
Module B: Gradient Oscillator (RSI-SMA Hybrid)
Design Rationale To mitigate the "noise" and "false reversal" signals common in single-line oscillators (like standard RSI), this module utilizes a 15-Layer Gradient Ribbon to visualize momentum density and persistence.
Technical Architecture
• Ribbon Array: The system generates 15 sequential Simple Moving Averages (SMA) applied to a volatility-adjusted RSI source. The length of each layer increases incrementally.
• State Analysis:
Momentum Alignment (Laminar Flow): When all 15 layers are expanded and parallel, it indicates a robust trend where buying/selling pressure is distributed evenly across multiple timeframes. This state helps filter out premature "overbought/oversold" signals.
• Consolidation (Compression): When the distance between the fastest layer (Layer 1) and the slowest layer (Layer 15) approaches zero or the layers intersect, the system identifies a "Non-Tradable Zone," preventing entries during choppy market conditions.
// Laminar Flow Validation
f_validate_trend() =>
// Calculate spread between Ribbon layers
ribbon_spread = ta.stdev(ribbon_array, 15)
// Only allow signals if Ribbon is expanded (Laminar Flow)
is_flowing = ribbon_spread > min_expansion_threshold
// If compressed (Knotted), force signal to false
is_flowing ? signal : na
Module C: Adaptive Signal Filtering (Behavioral Bias Mitigation)
This subsystem, operating as an algorithmic "Anti-Greed" Mechanism, addresses the statistical tendency for signal degradation following prolonged trends.
Dynamic Threshold Adjustment
• Win Streak Detection: The algorithm internally tracks the outcome of closed trade cycles.
• Sensitivity Multiplier: Upon detecting consecutive successful signals in the same direction, a Penalty_Factor is applied to the entry logic.
• Operational Impact: This effectively raises the Required_Slope threshold for subsequent signals. For example, after three consecutive bullish signals, the system requires a 30% steeper trend angle to validate a fourth entry. This enforces stricter discipline during extended trends to reduce the probability of entering at the point of trend exhaustion.
Anti-Greed Logic: Dynamic Threshold Calculation
f_adjust_threshold(base_slope, win_streak) =>
// Adds a 10% penalty to the difficulty for every consecutive win
penalty_factor = 0.10
risk_scaler = 1 + (win_streak * penalty_factor)
// Returns the new, harder-to-reach threshold
base_slope * risk_scaler
Module D: Trend Baseline (Triple-Smoothed Structure)
The Trend Baseline serves as the structural filter for all signals. It employs a Triple-Smoothed Hybrid Algorithm designed to balance lag reduction with noise filtration.
Smoothing Stages
1. Volatility Banding: Utilizes a SuperTrend-based calculation to establish the upper and lower boundaries of price action.
2. Weighted Filter: Applies a Weighted Moving Average (WMA) to prioritize recent price data.
3. Exponential Smoothing: A final Exponential Moving Average (EMA) pass is applied to create a seamless baseline curve.
Functionality
This "Heavy" baseline resists minor intraday volatility spikes while remaining responsive to sustained structural shifts. A signal is only considered valid if the price action maintains structural integrity relative to this baseline
🚦 Chapter 3: Risk Management & Exit Protocols
Quantitative Risk Management (TP/SL & Trailing)
Foundational Architecture: Volatility-Adjusted Geometry Unlike strategies relying on static nominal values, Impulse Reactor establishes dynamic risk boundaries derived from quantitative volatility metrics. This design aligns trade invalidation levels mathematically with the current market regime.
• ATR-Based Dynamic Bracketing:
The protocol calculates Stop-Loss and Take-Profit levels by applying Fibonacci coefficients (Default: 0.786 for SL / 1.618 for TP) to the Average True Range (ATR).
◦ High Volatility Environments: The risk bands automatically expand to accommodate wider variance, preventing premature exits caused by standard market noise.
◦ Low Volatility Environments: The bands contract to tighten risk parameters, thereby dynamically adjusting the Risk-to-Reward (R:R) geometry.
• Close-Validation Protocol ("Soft Stop"):
Institutional algorithms frequently execute liquidity sweeps—driving prices briefly below key support levels to accumulate inventory.
◦ Mechanism: When the "Soft Stop" feature is enabled, the system filters out intraday volatility spikes. The stop-loss is conditional; execution is triggered only if the candle closes beyond the invalidation threshold.
◦ Strategic Advantage: This logic distinguishes between momentary price wicks and genuine structural breakdowns, preserving positions during transient volatility.
• Step-Function Trailing Mechanism:
To protect unrealized PnL while allowing for normal price breathing, a two-phase trailing methodology is employed:
◦ Phase 1 (Activation): The trailing function remains dormant until the price advances by a pre-defined percentage threshold.
◦ Phase 2 (Dynamic Floor): Once armed, the stop level creates a moving floor, adjusting relative to price action while maintaining a volatility-based (ATR) buffer to systematically protect unrealized PnL.
• Algorithmic Exit Protocols (Dynamic Liquidity Analysis)
◦ Rationale: Inefficiencies of Static Targets Static "Take Profit" levels often result in suboptimal exits. They compel traders to close positions based on arbitrary figures rather than evolving market structure, potentially capping upside during significant trends or retaining positions while the underlying trend structure deteriorates.
◦ Solution: Structural Integrity Assessment The system utilizes a Dynamic Liquidity Engine to continuously audit the validity of the position. Instead of targeting a specific price point, the algorithm evaluates whether the trend remains statistically robust.
Multi-Factor Exit Logic (The Tri-Vector System)
The Smart Exit protocol executes only when specific algorithmic invalidation criteria are met:
• 1. Momentum Exhaustion (Confluence Decay): The system monitors a 168-hour rolling average of the Confluence Score. A significant deviation below this historical baseline indicates momentum exhaustion, signaling that the driving force behind the trend has dissipated prior to a price reversal. This enables preemptive exits before a potential drawdown.
• 2. Statistical Over-Extension (Mean Reversion): Utilizing the core volatility logic, the system identifies instances where price deviates beyond 2.0 standard deviations from the mean. While the trend may be technically bullish, this statistical anomaly suggests a high probability of mean reversion (elastic snap-back), triggering a defensive exit to capitalize on peak valuation.
• 3. Oscillator Rejection (Immediate Pivot): To manage sudden V-shaped volatility, the system monitors RSI pivots. If a sharp "Pivot High" or divergence is detected, the protocol triggers an immediate "Peak Exit," bypassing standard trend filters to secure liquidity during high-velocity reversals.
🎨 Chapter 4: Visualization Guide
Gradient Oscillator Ribbon
The 15-layer SMA ribbon visualized via plot(r1...r15) represents the "Momentum Density" of the market.
• Visuals:
◦ Cyan/Blue Ribbon: Indicates Bullish Momentum.
◦ Pink/Magenta Ribbon: Indicates Bearish Momentum.
• Interpretation:
◦ Laminar Flow: When the ribbon expands widely and flows in parallel, it signifies a robust trend where momentum is distributed evenly across timeframes. This is the ideal state for trend-following.
◦ Compression (Consolidation): If the ribbon becomes narrow, twisted, or knotted, it indicates a "Non-Tradable Zone" where the market lacks a unified direction. Traders are advised to wait for clarity.
◦ Over-Extension: If the top layer crosses the Overbought (85) or Oversold (15) lines, it visually warns of potential market overheating.
Trend Baseline
The thick, color-changing line plotted via plot(baseline) represents the Structural Backbone of the market.
• Visuals: Changes color based on the trend direction (Blue for Bullish, Pink for Bearish).
• Interpretation:
Structural Filter: Long positions are statistically favored only when price action sustains above this baseline, while short positions are favored below it.
Dynamic Support/Resistance: The baseline acts as a dynamic support level during uptrends and resistance during downtrends.
Entry Signals & Labels
Text labels ("Long Entry", "Short Entry") appear when the system detects high-probability setups grounded in quantitative confluence.
• Visuals: Labeled signals appear above/below specific candles.
• Interpretation:
These signals represent moments where Volatility (Expansion), Momentum (Alignment), and Structure (Trend) are synchronized.
Smart Exit: Labels such as "Smart Exit" or "Peak Exit" appear when the system detects momentum exhaustion or structural decay, prompting a defensive exit to preserve capital.
Dynamic TP/SL Boxes
The semi-transparent colored zones drawn via fill() represent the risk management geometry.
• Visuals: Colored boxes extending from the entry point to the Take Profit (TP) and Stop Loss (SL) levels.
• Function:
Volatility-Adjusted Geometry: Unlike static price targets, these boxes expand during high volatility (to prevent wicks from stopping you out) and contract during low volatility (to optimize Risk-to-Reward ratios).
SAR + MACD Glow
Small glowing shapes appearing above or below candles.
• Visuals: Triangle or circle glows near the price bars.
• Interpretation:
This visual indicates a secondary confirmation where Parabolic SAR and MACD align with the main trend direction. It serves as an additional confluence factor to increase confidence in the trade setup.
Support/Resistance Table
A small table located at the bottom-right of the chart.
• Function: Automatically identifies and displays recent Pivot Highs (Resistance) and Pivot Lows (Support).
• Interpretation: These levels can be used as potential targets for Take Profit or invalidation points for manual Stop Loss adjustments.
🖥️ Chapter 5: Dashboard & Operational Guide
Integrated Analytics Panel (Dashboard Overview)
To facilitate rapid decision-making without manual calculation, the system aggregates critical market dimensions into a unified "Heads-Up Display" (HUD). This panel monitors real-time metrics across multiple timeframes and analytical vectors.
A. Intermediate Structure (12H Trend)
• Function: Anchors the intraday analysis to the broader market structure using a 12-hour rolling window.
• Interpretation:
◦ Bullish (> +0.5%): Indicates a positive structural bias. Long setups align with the macro flow.
◦ Bearish (< -0.5%): Indicates structural weakness. Short setups are statistically favored.
◦ Neutral: Represents a ranging environment where the Confluence Score becomes the primary weighting factor.
B. Composite Confluence Score (Signal Confidence)
• Definition: A probability metric derived from the synchronization of Volatility (Impulse Core), Momentum (Ribbon), and Trend (Baseline).
• Grading Scale:
Strong Buy/Sell (> 7.0 / < 3.0): Indicates full alignment across all three vectors. Represents a "Prime Setup" eligible for standard position sizing.
Buy/Sell (5.0–7.0 / 3.0–5.0): Indicates a valid trend but with moderate volatility confirmation.
Neutral: Signals conflicting data (e.g., Bullish Momentum vs. Bearish Structure). Trading is not recommended ("No-Trade Zone").
C. Statistical Deviation Status (Mean Reversion)
• Logic: Utilizes Bollinger Band deviation principles to quantify how far price has stretched from the statistical mean (20 SMA).
• Alert States:
Over-Extended (> 2.0 SD): Warning that price is statistically likely to revert to the mean (Elastic Snap-back), even if the trend remains technically valid. New entries are discouraged in this zone.
Normal: Price is within standard distribution limits, suitable for trend-following entries.
D. Volatility Regime Classification
• Metric: Compares current ATR against a 100-period historical baseline to categorize the market state.
• Regimes:
Low Volatility (Lvl < 1.0): Market Compression. Often precedes volatility expansion events.
Mid Volatility (Lvl 1.0 - 1.5): Standard operating environment.
High Volatility (Lvl > 1.5): Elevated market stress. Risk parameters should be adjusted (e.g., reduced position size) to account for increased variance.
E. Performance Telemetry
• Function: Displays the historical reliability of the Trend Baseline for the current asset and timeframe.
• Operational Threshold: If the displayed Win Rate falls below 40%, it suggests the current market behavior is incoherent (choppy) and does not respect trend logic. In such cases, switching assets or timeframes is recommended.
Operational Protocols & Signal Decoding
Visual Interpretation Standards
• Laminar Flow (Trade Confirmation): A valid trend is visually confirmed when the 15-layer SMA Ribbon is fully expanded and parallel. This indicates distributed momentum across timeframes.
• Consolidation (No-Trade): If the ribbon appears twisted, knotted, or compressed, the market lacks a unified directional vector.
• Baseline Interaction: The Triple-Smoothed Baseline acts as a dynamic support/resistance filter. Long positions remain valid only while price sustains above this structure.
System Calibration (Settings)
• Adaptive Signal Filtering (Prev. Anti-Greed): Enabled by default. This logic automatically raises the required trend slope threshold following consecutive wins to mitigate behavioral bias.
• Impulse Sensitivity: Controls the reactivity of the Volatility Core. Higher settings capture faster moves but may introduce more noise.
⚙️ Chapter 6: System Configuration & Alert Guide
This section provides a complete breakdown of every adjustable setting within Impulse Reactor to assist you in tailoring the engine to your specific needs.
🌐 LANGUAGE SETTINGS (Localization)
◦ Select Language (Default: English):
Function: Instantly translates all chart labels, dashboard texts into your preferred language.
Supported: English, Korean, Chinese, Spanish
⚡ IMPULSE CORE SETTINGS (Volatility Engine)
◦ Deviation Lookback (Default: 30): The period used to calculate the standard deviation of volatility.
Role: Sets the baseline for normalizing momentum. Higher values make the core smoother but slower to react.
◦ Fast Pulse Length (Default: 10): The short-term ATR period.
Role: Detects rapid volatility expansion.
◦ Slow Pulse Length (Default: 30): The long-term ATR baseline.
Role: Establishes the background volatility level. The core signal is derived from the divergence between Fast and Slow pulses.
🎯 TP/SL SETTINGS (Risk Management)
◦ SL/TP Fibonacci (Default: 0.786 / 1.618): Selects the Fibonacci ratio used for risk calculation.
◦ SL/TP Multiplier (Default: 1.5 / 2): Applies a multiplier to the ATR-based bands.
Role: Expands or contracts the Take Profit and Stop Loss boxes. Increase these values for higher volatility assets (like Altcoins) to avoid premature stop-outs.
◦ ATR Length (Default: 14): The lookback period for calculating the Average True Range used in risk geometry.
◦ Use Soft Stop (Close Basis):
Role: If enabled, Stop Loss alerts only trigger if a candle closes beyond the invalidation level. This prevents being stopped out by wick manipulations.
🔊 RIBBON SETTINGS (Momentum Visualization)
◦ Show SMA Ribbon: Toggles the visibility of the 15-layer gradient ribbon.
◦ Ribbon Line Count (Default: 15): The number of SMA lines in the ribbon array.
◦ Ribbon Start Length (Default: 2) & Step (Default: 1): Defines the spread of the ribbon.
Role: Controls the "thickness" of the momentum density visualization. A wider step creates a broader ribbon, useful for higher timeframes.
📎 DISPLAY OPTIONS
◦ Show Entry Lines / TP/SL Box / Position Labels / S/R Levels / Dashboard: Toggles individual visual elements on the chart to reduce clutter.
◦ Show SAR+MACD Glow: Enables the secondary confirmation shapes (triangles/circles) above/below candles.
📈 TREND BASELINE (Structural Filter)
◦ Supertrend Factor (Default: 12) & ATR Period (Default: 90): Controls the sensitivity of the underlying Supertrend algorithm used for the baseline calculation.
◦ WMA Length (40) & EMA Length (14): The smoothing periods for the Triple-Smoothed Baseline.
◦ Min Trend Duration (Default: 10): The minimum number of bars the trend must be established before a signal is considered valid.
🧠 SMART EXIT (Dynamic Liquidity)
◦ Use Smart Exit: Enables the momentum exhaustion logic.
◦ Exit Threshold Score (Default: 3): The sensitivity level for triggering a Smart Exit. Lower values trigger earlier exits.
◦ Average Period (168) & Min Hold Bars (5): Defines the rolling window for momentum decay analysis and the minimum duration a trade must be held before Smart Exit logic activates.
🛡️ TRAILING STOP (Step)
◦ Use Trailing Stop: Activates the step-function trailing mechanism.
◦ Step 1 Activation % (0.5) & Offset % (0.5): The price must move 0.5% in your favor to arm the first trail level, which sets a stop 0.5% behind price.
◦ Step 2 Activation % (1) & Offset % (0.2): Once price moves 1%, the trail tightens to 0.2%, securing the position.
🌀 SAR & MACD SETTINGS (Secondary Confirmation)
◦ SAR Start/Increment/Max: Standard Parabolic SAR parameters.
◦ SAR Score Scaling (ATR): Adjusts how much weight the SAR signal has in the overall confluence score.
◦ MACD Fast/Slow/Signal: Standard MACD parameters used for the "Glow" signals.
🔄 ANTI-GREED LOGIC (Behavioral Bias)
◦ Strict Entry after Win: Enables the negative feedback loop.
◦ Strict Multiplier (Default: 1.1): Increases the entry difficulty by 10% after each win.
Role: Prevents overtrading and entering at the top of an extended trend.
🌍 HTF FILTER (Multi-Timeframe)
◦ Use Auto-Adaptive HTF Filter: Automatically selects a higher timeframe (e.g., 1H -> 4H) to filter signals.
◦ Bypass HTF on Steep Trigger: Allows an entry even against the HTF trend if the local momentum slope is exceptionally steep (catch powerful reversals).
📉 RSI PEAK & CHOPPINESS
◦ RSI Peak Exit (Instant): Triggers an immediate exit if a sharp RSI pivot (V-shape) is detected.
◦ Choppiness Filter: Suppresses signals if the Choppiness Index is above the threshold (Default: 60), indicating a flat market.
📐 SLOPE TRIGGER LOGIC
◦ Force Entry on Steep Slope: Overrides other filters if the price angle is extremely vertical (high velocity).
◦ Slope Sensitivity (1.5): The angle required to trigger this override.
⛔ FLAT MARKET FILTER (ADX & ATR)
◦ Use ADX Filter: Blocks signals if ADX is below the threshold (Default: 20), indicating no trend.
◦ Use ATR Flat Filter: Blocks signals if volatility drops below a critical level (dead market).
🔔 Alert Configuration Guide
Impulse Reactor is designed with a comprehensive suite of alert conditions, allowing you to automate your trading or receive real-time notifications for specific market events.
How to Set Up:
Click the "Alert" (Clock) icon in the TradingView toolbar.
Select "Impulse Reactor " from the Condition dropdown.
Choose one of the specific trigger conditions below:
🚀 Entry Signals (Trend Initiation)
Long Entry:
Trigger: Fires when a confirmed Bullish Setup is detected (Momentum + Volatility + Structure align).
Usage: Use this to enter new Long positions.
Short Entry:
Trigger: Fires when a confirmed Bearish Setup is detected.
Usage: Use this to enter new Short positions.
🎯 Profit Taking (Target Levels)
Long TP:
Trigger: Fires when price hits the calculated Take Profit level for a Long trade.
Usage: Automate partial or full profit taking.
Short TP:
Trigger: Fires when price hits the calculated Take Profit level for a Short trade.
Usage: Automate partial or full profit taking.
🛡️ Defensive Exits (Risk Management)
Smart Exit:
Trigger: Fires when the system detects momentum decay or statistical exhaustion (even if the trend hasn't fully reversed).
Usage: Recommended for tightening stops or closing positions early to preserve gains.
Overbought / Oversold:
Trigger: Fires when the ribbon extends into extreme zones.
Usage: Warning signal to prepare for a potential reversal or pullback.
💡 Secondary Confirmation (Confluence)
SAR+MACD Bullish:
Trigger: Fires when Parabolic SAR and MACD align bullishly with the main trend.
Usage: Ideal for Pyramiding (adding to an existing winning position).
SAR+MACD Bearish:
Trigger: Fires when Parabolic SAR and MACD align bearishly.
Usage: Ideal for adding to short positions.
⚠️ Chapter 7: Conclusion & Risk Disclosure
Methodological Synthesis
Impulse Reactor represents a shift from reactive price tracking to proactive energy analysis. By decomposing market activity into its atomic components — Volatility, Momentum, and Structure — and reconstructing them into a coherent decision model, the system aims to provide a quantitative framework for market engagement. It is designed not to predict the future, but to identify high-probability conditions where kinetic energy and trend structure align.
Disclaimer & Risk Warnings
◦ Educational Purpose Only
This indicator, including all associated code, documentation, and visual outputs, is provided strictly for educational and informational purposes. It does not constitute financial advice, investment recommendations, or a solicitation to buy or sell any financial instruments.
◦ No Guarantee of Performance
Past performance is not indicative of future results. All metrics displayed on the dashboard (including "Win Rate" and "P&L") are theoretical calculations based on historical data. These figures do not account for real-world trading factors such as slippage, liquidity gaps, spread costs, or broker commissions.
◦ High-Risk Warning
Trading cryptocurrencies, futures, and leveraged financial products involves a substantial risk of loss. The use of leverage can amplify both gains and losses. Users acknowledge that they are solely responsible for their trading decisions and should conduct independent due diligence before executing any trades.
◦ Software Limitations
The software is provided "as is" without warranty. Users should be aware that market data feeds on analysis platforms may experience latency or outages, which can affect signal generation accuracy.
