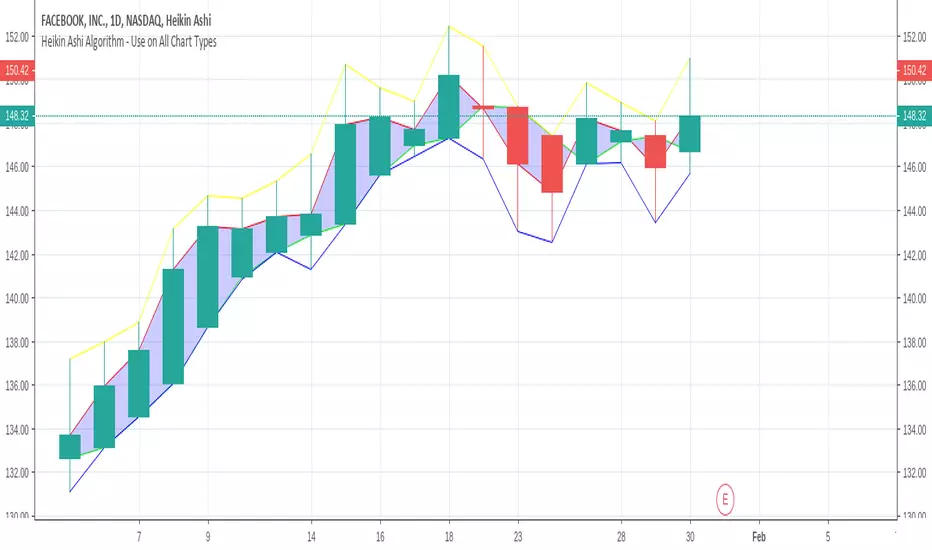
Heikin Ashi AlgorithmThis indicator can be added on any type of chart (including Heikin Ashi chart). There is a little trick with the tickerid, read details in comments.
In den Scripts nach "文华财经tick价格" suchen
Relative Estimated Price REP by KIVANÇ fr3762Relative Estimated Price (REP) Indicator shows the estimated price calculated if the tickerid made the same value changes (in %) during a certain period.
The default value of the lookback period is 50.
In the given XRPUSD chart you can see that XRPUSD has a value of 0.26480 and the RPC indicator shows the value of 0.38099.
This means that XRP would be 0.38099USD if it was fully made the same percentage moves with BTC , we can say that XRP is RELATIVELY cheap according to BTC price moves.
Conversely XRP would be RELATIVELY expensive if the last value of REP was lower then current XRP price.
users can choose the relative base price in calculation of REP between 1-5 which are:
1=BTCUSD, 2=ETHUSD, 3=EURTRY(Euro/Turkish Lira), 4=USDTRY (Dollar/Turkish Lira), 5=BIST100 (Istanbul Stock Exchange)
I personally advise you to use this indicator for daily charts in Tradingview to have more accurate estimated prices because of the website's calculation.
Developed by KIVANÇ

Mayer Multiple @ Current PriceThough this script is by me, the original idea comes from a podcast I heard where Trace Mayer talks about how he does crypto valuation. It is based on current price against the 200 day moving average. This indicator script will simply plot that value as a label overlayed on your trading view chart. Best long term results occur when acquiring BTC when the multiple is 2.4 or less. For more info, google "mayer multiple" This script/indicator is strictly for educational purposes. It is not exclusive to bitcoin.
To get the best look out of your charts I make the following changes.
1.Apply the indicator to your chart.
2. In the tools palette of trading view, when looking at a chart, click "Show Objects Tree" the icon displayed above the trash can.
In the objects tree panel, click the preferences icon for "Mayer Multiple @ Current Price"
Switch "scale" to "scale Left"
3. Then for your chart preferences (right click on chart background and select "Properties", and be sure the following are checked on the "Scales" tab
Left Axis
Right Axis
Indicator Last Value
Indicator Labels
Screenshots are not allowed in this view, so I can't post screenshots, but the view above is what it should look like when you are done.
For anyone who wants to see the code, here is the code of the script:
Use at will, and at your own risk.
//@version=3
// Created By Timothy Luce, inspired by Trace Mayer's 200 Day SMA cryptocurrency valuation method
study("Mayer Multiple @ Current Price", overlay=true)
currentPrice = close
currentDay = security(tickerid, "D", sma(close, 200))
mayerMultiple = currentPrice/currentDay
plot(mayerMultiple, color=#00ffaa, transp=100)
If you want to change the color, change this line: #00ffaa

Accumulation/Distribution Percentage (ADP) [Cyrus c|:D]Accumulation/Distribution Percentage ( ADP ) is used to measure money flow similar to Chaikin Money Flow ( CMF ) and Money Flow. It is the range-bound version of my previous indicator ADMF. This indicator can be used for analyzing momentum, buy/sell pressure, and overbought/oversold conditions. I believe that this indicator is more accurate than CMF and MFI (I will publish a TA about it one day!).
What to look for:
- When this indicator moves up, it means buy pressure is increasing and the other way around for sell pressure. Crossing 0 means that trend has changed in the given period (it is best to look for confirmation of buy/sell pressure in larger TFs)
- Overbought above 40 and oversold below -40 (these numbers vary depending on the security. Look for historical levels to determine overbought and oversold conditions of each security)
- Regular divergence shows that momentum of a trend is declining. Hidden divergence implies continuation of a trend. The non-bound mode should be more accurate for identifying divergence.
- Failure swings can detect potential reversals.
Please read Relative Strength Index and Money Flow for more information and similar disclaimers.
Recommendations:
- hlc3 (AKA typical price) as input source might be better than "close" as it captures more information. If you use hlc3 as a source, then change the chart type to line and set hlc3 as the source for identifying divergence.
- Use hybrid tickers e.g.(BITFINEX:BTCUSD+COINBASE:BTCUSD+BITSTAMP:BTCUSD)/3. Volume-based indicators are susceptible to wash trading/volume printing and hybrid tickers mitigate this issue.
- In non-bound mode, small TFs with longer length should be more accurate than larger TFs with standard length (same is true for many other indicators)
Background:
I have developed 4 indicators based on a simple but elegant concept of A/D ratio. A/D ratio is equal to (current close - previous close)/True Range (when there are no price gaps, True Range = High - Low)
1) What you see on ADV indicator as darker green and red is equal to A/D ratio x volume.
2) ADL indicator shows the summation of ADV
3) ADMF (or ADP in non-bound mode) shows Moving Average of ADV
4) ADP shows relative accumulation strength which is calculated as RMA (accumulations)/RMA(accumulation + distribution). ADP equation is based on RSI equation which is RMA(gains)/RMA(gains + losses). That is why these two indicators look quite similar.
PS: Please leave a like if you find these indicators useful. I am working on improvements on these and other indicators. I am trying my best to keep them as simple as possible. Please let me know in the comments if you want me to make future indicators even simpler.
--------
Complementary indicators based on the same concept:
ADL: a replacement for Chaikin's Accum/Dist, On Balance Volume, and Price Volume Trend
ADV: a replacement for regular volume indicator
ADP also has a scaled RSI and ADMF built in (ie ADMF is obsolete).

CMYK XIAM OPEN◊ Introduction
This is project XIAM, a work in progress.
Recently i came across the repainting problem.
Since then i haven't seen any bot-code that makes > 5% profit in two weeks with 0.25% fees/trade.
People who make good bots either bluff or don't share the code.
they let you rent it.
I aim to understand, learn it, write it myself. And share my findings with whoever shares with me.
◊ Origin
Based on RMI (RSI with momentum) and SMA, and values derived from those.
◊ Usage
Currently an investigative script.
◊ Theoretical Approaches
Philosophy α :: Cleansignal
:: Cleaning up the signal, from irregularities that cause unpredictable results.
Merging available tickers of a pair into one.
Merging available tickers of different coins into one in the correct proportion. (eg. Crypto market cap)
Removing Jitter, and smoothing signal without delay.
Philosophy β :: Rythmic
:: Syncing into the rythm's, to never miss the que, and trade on every theoretical low/high
Searching Amplitude, Period, Phase Shift, Frequency's of the carrier waves.
Marking Acrivity/inactivity of the carrier waves.
Partial Fractal repetition asses-able with above data?
Philosophy γ :: consequential
:: Seeking for Indicatory events and causal relations
Probability / reward.
Confirmation and culmination.
...
◊ Community
Wanna share your findings ? or need help resolving a problem ?
CMYK :: discord.gg
AUTOTVIEW :: discordapp.com

BTC CorrelationA simple script to display how correlated the current ticker is to Bitcoin.
Inputs are the number of bars to check correlation for (default 10) and the the ticker to use for BTC comparison (default is BITFINEX:BTCUSD)
Values of 1 are highly correlated (i.e. bitcoin moves up, so does your current ticker), values of -1 are inversely correlated (i.e. bitcoin moves up, your current ticker moves down).
See: www.babypips.com for some more details on correlation

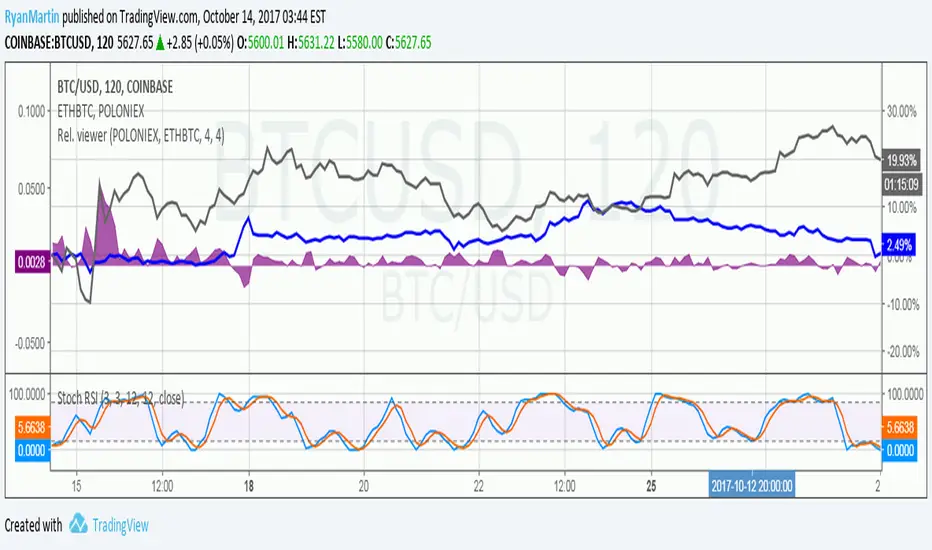
Price relation viewer - add percent change of two symbols (BETA)This script is very much beta!
This is a simple script to visualize how two symbols move in relation to each other. For example if the underlying symbol is a 2x Gold ETF (meaning the ticker moves at 2x the spot price of gold---if gold goes up 3% this ticker should go up 6%) and the comparison symbol is an 2x inverse gold ETF (at gold up 3% this should move down 6%). If these ETFs were 100% accurate at tracking the price of gold then this tool would report a value of zero at all times.
Day 1
Ticker - $10
Comparison - $10
Day 2
Ticker - $12
Comp - $11
This tool value - |20%| + -|10%| = 10%
It uses a short simple moving average to smooth things out a bit (see inputs). It is important to keep your axis scale in mind when using this! Two symbols that are always near zero mean they are offsetting each other very well but the value displayed might range from 0 to 0.005, but the graphed area can make it look extreme if autoscaled.
This is a tool with very specific uses : comparing how one digital currency moves in relation to bitcoin's price, comparing how gold moves in relation to silver, etc.
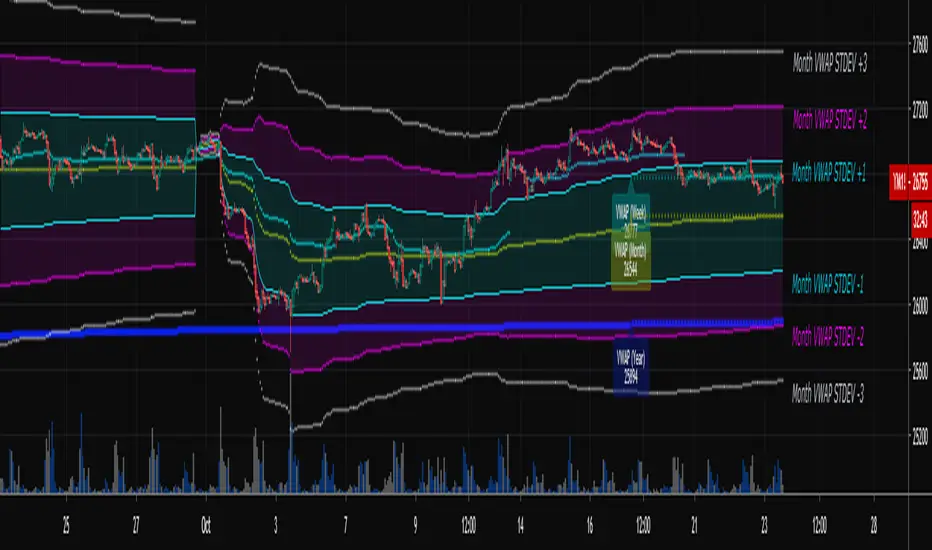
Multi-Timeframe VWAPShows the Daily, Weekly, Monthly, Quarterly, and Yearly VWAP.
Also shows the previous closing VWAP, which is usually very near the HLC3 standard pivot for the previous time frame. i.e. The previous daily VWAP closing price is usually near the current Daily Pivot. Tickers interact well with the previous Daily and Weekly closing VWAP.
Enabling the STDEV bands shows 3 separate standard deviation levels, defaulted at 1, 2, and 3. The lookback period for the bands is always changing with each new bar, since the standard deviation is calculated from the current bar to the beginning of the period. This is different from bollinger bands, as the lookback is constant (usually 20 periods is the textbook default).
The STDEV bands interval of interest can be changed from Day (D), Week (W), Month (M), Quarter (Q), Year (Y).
Tickers tend to bounce very well on Daily, Weekly, and Yearly VWAP (Yes... Year). Use this code and observe the Year VWAP on several major symbols through the past few years and eyes will be opened.
Free Strategy #08 (Combo of #01 and #02) (ES / SPY)This strategy was designed to be traded on daily data on the ES and SPY—the strategy was originally developed for NinjaTrader, which displays daily ES data based on RTH hours instead of 24 hours (1440 minute) like TradingView does, so we are presenting the results on the SPY until we figure out how to overcome this hurdle.
The strategy combines the two ideas from strategy #01 and strategy #02 .
Strategy #08
Quantity 100
Slippage: 2 ticks
Commission: 4.95 per order
Net Profit: 26,044.60
Max Drawdown: 3,947.60
Buy and Hold (Custom)
Quantity 100
Slippage: 2 ticks
Commission: 4.95 per order
Entry Long: 1993-02-01 @ 43.99
Exit Long: 2017-07-28 @ 246.34
Net Profit: 20,225.10
Max Drawdown: 9,042.00

Free Strategy #02 (ES / SPY)This strategy was designed to be traded on daily data on the ES and SPY—the strategy was originally developed for NinjaTrader, which displays daily ES data based on RTH hours instead of 24 hours (1440 minute) like TradingView does, so we are presenting the results on the SPY until we figure out how to overcome this hurdle.
Strategy #02
Quantity 100
Slippage: 2 ticks
Commission: 4.95 per order
Net Profit: 10,118.30
Max Drawdown: 4.037.60
Buy and Hold (Custom)
Quantity 100
Slippage: 2 ticks
Commission: 4.95 per order
Entry Long: 1993-02-01 @ 43.99
Exit Long: 2017-07-28 @ 246.34
Net Profit: 20,225.10
Max Drawdown: 9,042.00

True Strength Indicator MTFHere is an example of a script showing a multi-time frame of TSI.
Chart below compares FX EURUSD Daily TSI to 1H TSI
Here is an updated version
study("True Strength Indicator MTF", shorttitle="TSI MTF")
resCustom = input(title="Timeframe", type=resolution, defval="60" )
long = input(title="Long Length", type=integer, defval=25)
short = input(title="Short Length", type=integer, defval=13)
signal = input(title="Signal Length", type=integer, defval=13)
price = close
double_smooth(src, long, short) =>
fist_smooth = ema(src, long)
ema(fist_smooth, short)
pc = change(price)
double_smoothed_pc = double_smooth(pc, long, short)
double_smoothed_abs_pc = double_smooth(abs(pc), long, short)
tsi_value = 100 * (double_smoothed_pc / double_smoothed_abs_pc)
tsi = security(tickerid, resCustom,tsi_value)
plot(tsi, color=black)
plot(ema(tsi, signal), color=red)
hline(0, title="Zero")

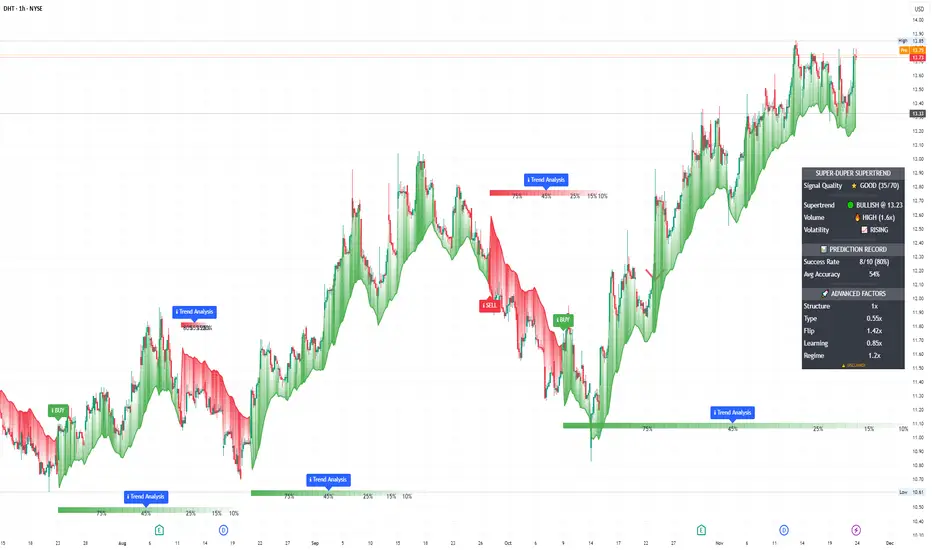
Luxy Super-Duper SuperTrend Predictor Engine and Buy/Sell signalA professional trend-following grading system that analyzes historical trend
patterns to provide statistical duration estimates using advanced similarity
matching and k-nearest neighbors analysis. Combines adaptive Supertrend with
intelligent duration statistics, multi-timeframe confluence, volume confirmation,
and quality scoring to identify high-probability setups with data-driven
target ranges across all timeframes.
Note: All duration estimates are statistical calculations based on historical data, not guarantees of future performance.
WHAT MAKES THIS DIFFERENT
Unlike traditional SuperTrend indicators that only tell you trend direction, this system answers the critical question: "What is the typical duration for trends like this?"
The Statistical Analysis Engine:
• Analyzes your chart's last 15+ completed SuperTrend trends (bullish and bearish separately)
• Uses k-nearest neighbors similarity matching to find historically similar setups
• Calculates statistical duration estimates based on current market conditions
• Learns from estimation errors and adapts over time (Advanced mode)
• Displays visual duration analysis box showing median, average, and range estimates
• Tracks Statistical accuracy with backtest statistics
Complete Trading System:
• Statistical trend duration analysis with three intelligence levels
• Adaptive Supertrend with dynamic ATR-based bands
• Multi-timeframe confluence analysis (6 timeframes: 5M to 1W)
• Volume confirmation with spike detection and momentum tracking
• Quality scoring system (0-70 points) rating each setup
• One-click preset optimization for all trading styles
• Anti-repaint guarantee on all signals and duration estimates
METHODOLOGY CREDITS
This indicator's approach is inspired by proven trading methodologies from respected market educators:
• Mark Minervini - Volatility Contraction Pattern (VCP) and pullback entry techniques
• William O'Neil - Volume confirmation principles and institutional buying patterns (CANSLIM methodology)
• Dan Zanger - Volatility expansion entries and momentum breakout strategies
Important: These are educational references only. This indicator does not guarantee any specific trading results. Always conduct your own analysis and risk management.
KEY FEATURES
1. TREND DURATION ANALYSIS SYSTEM - The Core Innovation
The statistical analysis engine is what sets this indicator apart from standard SuperTrend systems. It doesn't just identify trend changes - it provides statistical analysis of potential duration.
How It Works:
Step 1: Historical Tracking
• Automatically records every completed SuperTrend trend (duration in bars)
• Maintains separate databases for bullish trends and bearish trends
• Stores up to 15 most recent trends of each type
• Captures market conditions at each trend flip: volume ratio, ATR ratio, quality score, price distance from SuperTrend, proximity to support/resistance
Step 2: Similarity Matching (k-Nearest Neighbors)
• When new trend begins, system compares current conditions to ALL historical flips
• Calculates similarity score based on:
- Volume similarity (30% weight) - Is volume behaving similarly?
- Volatility similarity (30% weight) - Is ATR/volatility similar?
- Quality similarity (20% weight) - Is setup strength comparable?
- Distance similarity (10% weight) - Is price distance from ST similar?
- Support/Resistance proximity (10% weight) - Similar structural context?
• Selects the 15 MOST SIMILAR historical trends (not just all trends)
• This is like asking: "When conditions looked like this before, how long did trends last?"
Step 3: Statistical Analysis
• Calculates median duration (most common outcome)
• Calculates average duration (mean of similar trends)
• Determines realistic range (min to max of similar trends)
• Applies exponential weighting (recent trends weighted more heavily)
• Outputs confidence-weighted statistical estimate
Step 4: Advanced Intelligence (Advanced Mode Only)
The Advanced mode applies five sophisticated multipliers to refine estimates:
A) Market Structure Multiplier (±30%):
• Detects nearby support/resistance levels using pivot detection
• If flip occurs NEAR a key level: Estimate adjusted -30% (expect bounce/rejection)
• If flip occurs in open space: Estimate adjusted +30% (clear path for continuation)
• Uses configurable lookback period and ATR-based proximity threshold
B) Asset Type Multiplier (±40%):
• Adjusts duration estimates based on asset volatility characteristics
• Small Cap / Biotech: +40% (explosive, extended moves)
• Tech Growth: +20% (momentum-driven, longer trends)
• Blue Chip / Large Cap: 0% (baseline, steady trends)
• Dividend / Value: -20% (slower, grinding trends)
• Cyclical: Variable based on macro regime
• Crypto / High Volatility: +30% (parabolic potential)
C) Flip Strength Multiplier (±20%):
• Analyzes the QUALITY of the trend flip itself
• Strong flip (high volume + expanding ATR + quality score 60+): +20%
• Weak flip (low volume + contracting ATR + quality score under 40): -20%
• Logic: Historical data shows that powerful flips tend to be followed by longer trends
D) Error Learning Multiplier (±15%):
• Tracks Statistical accuracy over last 10 completed trends
• Calculates error ratio: (estimated duration / Actual Duration)
• If system consistently over-estimates: Apply -15% correction
• If system consistently under-estimates: Apply +15% correction
• Learns and adapts to current market regime
E) Regime Detection Multiplier (±20%):
• Analyzes last 3 trends of SAME TYPE (bull-to-bull or bear-to-bear)
• Compares recent trend durations to historical average
• If recent trends 20%+ longer than average: +20% adjustment (trending regime detected)
• If recent trends 20%+ shorter than average: -20% adjustment (choppy regime detected)
• Detects whether market is in trending or mean-reversion mode
Three analysis modes:
SIMPLE MODE - Basic Statistics
• Uses raw median of similar trends only
• No multipliers, no adjustments
• Best for: Beginners, clean trending markets
• Fastest calculations, minimal complexity
STANDARD MODE - Full Statistical Analysis
• Similarity matching with k-nearest neighbors
• Exponential weighting of recent trends
• Median, average, and range calculations
• Best for: Most traders, general market conditions
• Balance of accuracy and simplicity
ADVANCED MODE - Statistics + Intelligence
• Everything in Standard mode PLUS
• All 5 advanced multipliers (structure, asset type, flip strength, learning, regime)
• Highest Statistical accuracy in testing
• Best for: Experienced traders, volatile/complex markets
• Maximum intelligence, most adaptive
Visual Duration Analysis Box:
When a new trend begins (SuperTrend flip), a box appears on your chart showing:
• Analysis Mode (Simple / Standard / Advanced)
• Number of historical trends analyzed
• Median expected duration (most likely outcome)
• Average expected duration (mean of similar trends)
• Range (minimum to maximum from similar trends)
• Advanced multipliers breakdown (Advanced mode only)
• Backtest accuracy statistics (if available)
The box extends from the flip bar to the estimated endpoint based on historical data, giving you a visual target for trend duration. Box updates in real-time as trend progresses.
Backtest & Accuracy Tracking:
• System backtests its own duration estimates using historical data
• Shows accuracy metrics: how well duration estimates matched actual durations
• Tracks last 10 completed duration estimates separately
• Displays statistics in dashboard and duration analysis boxes
• Helps you understand statistical reliability on your specific symbol/timeframe
Anti-Repaint Guarantee:
• duration analysis boxes only appear AFTER bar close (barstate.isconfirmed)
• Historical duration estimates never disappear or change
• What you see in history is exactly what you would have seen real-time
• No future data leakage, no lookahead bias
2. INTELLIGENT PRESET CONFIGURATIONS - One-Click Optimization
Unlike indicators that require tedious parameter tweaking, this system includes professionally optimized presets for every trading style. Select your approach from the dropdown and ALL parameters auto-configure.
"AUTO (DETECT FROM TF)" - RECOMMENDED
The smartest option: automatically selects optimal settings based on your chart timeframe.
• 1m-5m charts → Scalping preset (ATR: 7, Mult: 2.0)
• 15m-1h charts → Day Trading preset (ATR: 10, Mult: 2.5)
• 2h-4h-D charts → Swing Trading preset (ATR: 14, Mult: 3.0)
• W-M charts → Position Trading preset (ATR: 21, Mult: 4.0)
Benefits:
• Zero configuration - works immediately
• Always matched to your timeframe
• Switch timeframe = automatic adjustment
• Perfect for traders who use multiple timeframes
"SCALPING (1-5M)" - Ultra-Fast Signals
Optimized for: 1-5 minute charts, high-frequency trading, quick profits
Target holding period: Minutes to 1-2 hours maximum
Best markets: High-volume stocks, major crypto pairs, active futures
Parameter Configuration:
• Supertrend: ATR 7, Multiplier 2.0 (very sensitive)
• Volume: MA 10, High 1.8x, Spike 3.0x (catches quick surges)
• Volume Momentum: AUTO-DISABLED (too restrictive for fast scalping)
• Quality minimum: 40 points (accepts more setups)
• Duration Analysis: Uses last 15 trends with heavy recent weighting
Trading Logic:
Speed over precision. Short ATR period and low multiplier create highly responsive SuperTrend. Volume momentum filter disabled to avoid missing fast moves. Quality threshold relaxed to catch more opportunities in rapid market conditions.
Signals per session: 5-15 typically
Hold time: Minutes to couple hours
Best for: Active traders with fast execution
"DAY TRADING (15M-1H)" - Balanced Approach
Optimized for: 15-minute to 1-hour charts, intraday moves, session-based trading
Target holding period: 30 minutes to 8 hours (within trading day)
Best markets: Large-cap stocks, major indices, established crypto
Parameter Configuration:
• Supertrend: ATR 10, Multiplier 2.5 (balanced)
• Volume: MA 20, High 1.5x, Spike 2.5x (standard detection)
• Volume Momentum: 5/20 periods (confirms intraday strength)
• Quality minimum: 50 points (good setups preferred)
• Duration Analysis: Balanced weighting of recent vs historical
Trading Logic:
The most balanced configuration. ATR 10 with multiplier 2.5 provides steady trend following that avoids noise while catching meaningful moves. Volume momentum confirms institutional participation without being overly restrictive.
Signals per session: 2-5 typically
Hold time: 30 minutes to full day
Best for: Part-time and full-time active traders
"SWING TRADING (4H-D)" - Trend Stability
Optimized for: 4-hour to Daily charts, multi-day holds, trend continuation
Target holding period: 2-15 days typically
Best markets: Growth stocks, sector ETFs, trending crypto, commodity futures
Parameter Configuration:
• Supertrend: ATR 14, Multiplier 3.0 (stable)
• Volume: MA 30, High 1.3x, Spike 2.2x (accumulation focus)
• Volume Momentum: 10/30 periods (trend stability)
• Quality minimum: 60 points (high-quality setups only)
• Duration Analysis: Favors consistent historical patterns
Trading Logic:
Designed for substantial trend moves while filtering short-term noise. Higher ATR period and multiplier create stable SuperTrend that won't flip on minor corrections. Stricter quality requirements ensure only strongest setups generate signals.
Signals per week: 2-5 typically
Hold time: Days to couple weeks
Best for: Part-time traders, swing style
"POSITION TRADING (D-W)" - Long-Term Trends
Optimized for: Daily to Weekly charts, major trend changes, portfolio allocation
Target holding period: Weeks to months
Best markets: Blue-chip stocks, major indices, established cryptocurrencies
Parameter Configuration:
• Supertrend: ATR 21, Multiplier 4.0 (very stable)
• Volume: MA 50, High 1.2x, Spike 2.0x (long-term accumulation)
• Volume Momentum: 20/50 periods (major trend confirmation)
• Quality minimum: 70 points (excellent setups only)
• Duration Analysis: Heavy emphasis on multi-year historical data
Trading Logic:
Conservative approach focusing on major trend changes. Extended ATR period and high multiplier create SuperTrend that only flips on significant reversals. Very strict quality filters ensure signals represent genuine long-term opportunities.
Signals per month: 1-2 typically
Hold time: Weeks to months
Best for: Long-term investors, set-and-forget approach
"CUSTOM" - Advanced Configuration
Purpose: Complete manual control for experienced traders
Use when: You understand the parameters and want specific optimization
Best for: Testing new approaches, unusual market conditions, specific instruments
Full control over:
• All SuperTrend parameters
• Volume thresholds and momentum periods
• Quality scoring weights
• analysis mode and multipliers
• Advanced features tuning
Preset Comparison Quick Reference:
Chart Timeframe: Scalping (1M-5M) | Day Trading (15M-1H) | Swing (4H-D) | Position (D-W)
Signals Frequency: Very High | High | Medium | Low
Hold Duration: Minutes | Hours | Days | Weeks-Months
Quality Threshold: 40 pts | 50 pts | 60 pts | 70 pts
ATR Sensitivity: Highest | Medium | Lower | Lowest
Time Investment: Highest | High | Medium | Lowest
Experience Level: Expert | Advanced | Intermediate | Beginner+
3. QUALITY SCORING SYSTEM (0-70 Points)
Every signal is rated in real-time across three dimensions:
Volume Confirmation (0-30 points):
• Volume Spike (2.5x+ average): 30 points
• High Volume (1.5x+ average): 20 points
• Above Average (1.0x+ average): 10 points
• Below Average: 0 points
Volatility Assessment (0-30 points):
• Expanding ATR (1.2x+ average): 30 points
• Rising ATR (1.0-1.2x average): 15 points
• Contracting/Stable ATR: 0 points
Volume Momentum (0-10 points):
• Strong Momentum (1.2x+ ratio): 10 points
• Rising Momentum (1.0-1.2x ratio): 5 points
• Weak/Neutral Momentum: 0 points
Score Interpretation:
60-70 points - EXCELLENT:
• All factors aligned
• High conviction setup
• Maximum position size (within risk limits)
• Primary trading opportunities
45-59 points - STRONG:
• Multiple confirmations present
• Above-average setup quality
• Standard position size
• Good trading opportunities
30-44 points - GOOD:
• Basic confirmations met
• Acceptable setup quality
• Reduced position size
• Wait for additional confirmation or trade smaller
Below 30 points - WEAK:
• Minimal confirmations
• Low probability setup
• Consider passing
• Only for aggressive traders in strong trends
Only signals meeting your minimum quality threshold (configurable per preset) generate alerts and labels.
4. MULTI-TIMEFRAME CONFLUENCE ANALYSIS
The system can simultaneously analyze trend alignment across 6 timeframes (optional feature):
Timeframes analyzed:
• 5-minute (scalping context)
• 15-minute (intraday momentum)
• 1-hour (day trading bias)
• 4-hour (swing context)
• Daily (primary trend)
• Weekly (macro trend)
Confluence Interpretation:
• 5-6/6 aligned - Very strong multi-timeframe agreement (highest confidence)
• 3-4/6 aligned - Moderate agreement (standard setup)
• 1-2/6 aligned - Weak agreement (caution advised)
Dashboard shows real-time alignment count with color-coding. Higher confluence typically correlates with longer, stronger trends.
5. VOLUME MOMENTUM FILTER - Institutional Money Flow
Unlike traditional volume indicators that just measure size, Volume Momentum tracks the RATE OF CHANGE in volume:
How it works:
• Compares short-term volume average (fast period) to long-term average (slow period)
• Ratio above 1.0 = Volume accelerating (money flowing IN)
• Ratio above 1.2 = Strong acceleration (institutional participation likely)
• Ratio below 0.8 = Volume decelerating (money flowing OUT)
Why it matters:
• Confirms trend with actual money flow, not just price
• Leading indicator (volume often leads price)
• Catches accumulation/distribution before breakouts
• More intuitive than complex mathematical filters
Integration with signals:
• Optional filter - can be enabled/disabled per preset
• When enabled: Only signals with rising volume momentum fire
• AUTO-DISABLED in Scalping mode (too restrictive for fast trading)
• Configurable fast/slow periods per trading style
6. ADAPTIVE SUPERTREND MULTIPLIER
Traditional SuperTrend uses fixed ATR multiplier. This system dynamically adjusts the multiplier (0.8x to 1.2x base) based on:
• Trend Strength: Price correlation over lookback period
• Volume Weight: Current volume relative to average
Benefits:
• Tighter bands in calm markets (less premature exits)
• Wider bands in volatile conditions (avoids whipsaws)
• Better adaptation to biotech, small-cap, and crypto volatility
• Optional - can be disabled for classic constant multiplier
7. VISUAL GRADIENT RIBBON
26-layer exponential gradient fill between price and SuperTrend line provides instant visual trend strength assessment:
Color System:
• Green shades - Bullish trend + volume confirmation (strongest)
• Blue shades - Bullish trend, normal volume
• Orange shades - Bearish trend + volume confirmation
• Red shades - Bearish trend (weakest)
Opacity varies based on:
• Distance from SuperTrend (farther = more opaque)
• Volume intensity (higher volume = stronger color)
The ribbon provides at-a-glance trend strength without cluttering your chart. Can be toggled on/off.
8. INTELLIGENT ALERT SYSTEM
Two-tier alert architecture for flexibility:
Automatic Alerts:
• Fire automatically on BUY and SELL signals
• Include full context: quality score, volume state, volume momentum
• One alert per bar close (alert.freq_once_per_bar_close)
• Message format: "BUY: Supertrend bullish + Quality: 65/70 | Volume: HIGH | Vol Momentum: STRONG (1.35x)"
Customizable Alert Conditions:
• Appear in TradingView's "Create Alert" dialog
• Three options: BUY Signal Only, SELL Signal Only, ANY Signal (BUY or SELL)
• Use TradingView placeholders: {{ticker}}, {{interval}}, {{close}}, {{time}}
• Fully customizable message templates
All alerts use barstate.isconfirmed - Zero repaint guarantee.
9. ANTI-REPAINT ARCHITECTURE
Every component guaranteed non-repainting:
• Entry signals: Only appear after bar close
• duration analysis boxes: Created only on confirmed SuperTrend flips
• Informative labels: Wait for bar confirmation
• Alerts: Fire once per closed bar
• Multi-timeframe data: Uses lookahead=barmerge.lookahead_off
What you see in history is exactly what you would have seen in real-time. No disappearing signals, no changed duration estimates.
HOW TO USE THE INDICATOR
QUICK START - 3 Steps to Trading:
Step 1: Select Your Trading Style
Open indicator settings → "Quick Setup" section → Trading Style Preset dropdown
Options:
• Auto (Detect from TF) - RECOMMENDED: Automatically configures based on your chart timeframe
• Scalping (1-5m) - For 1-5 minute charts, ultra-fast signals
• Day Trading (15m-1h) - For 15m-1h charts, balanced approach
• Swing Trading (4h-D) - For 4h-Daily charts, trend stability
• Position Trading (D-W) - For Daily-Weekly charts, long-term trends
• Custom - Manual configuration (advanced users only)
Choose "Auto" and you're done - all parameters optimize automatically.
Step 2: Understand the Signals
BUY Signal (Green Triangle Below Price):
• SuperTrend flipped bullish
• Quality score meets minimum threshold (varies by preset)
• Volume confirmation present (if filter enabled)
• Volume momentum rising (if filter enabled)
• duration analysis box shows expected trend duration
SELL Signal (Red Triangle Above Price):
• SuperTrend flipped bearish
• Quality score meets minimum threshold
• Volume confirmation present (if filter enabled)
• Volume momentum rising (if filter enabled)
• duration analysis box shows expected trend duration
Duration Analysis Box:
• Appears at SuperTrend flip (start of new trend)
• Shows median, average, and range duration estimates
• Extends to estimated endpoint based on historical data visually
• Updates mode-specific intelligence (Simple/Standard/Advanced)
Step 3: Use the Dashboard for Context
Dashboard (top-right corner) shows real-time metrics:
• Row 1 - Quality Score: Current setup rating (0-70)
• Row 2 - SuperTrend: Direction and current level
• Row 3 - Volume: Status (Spike/High/Normal/Low) with color
• Row 4 - Volatility: State (Expanding/Rising/Stable/Contracting)
• Row 5 - Volume Momentum: Ratio and trend
• Row 6 - Duration Statistics: Accuracy metrics and track record
Every cell has detailed tooltip - hover for full explanations.
SIGNAL INTERPRETATION BY QUALITY SCORE:
Excellent Setup (60-70 points):
• Quality Score: 60-70
• Volume: Spike or High
• Volatility: Expanding
• Volume Momentum: Strong (1.2x+)
• MTF Confluence (if enabled): 5-6/6
• Action: Primary trade - maximum position size (within risk limits)
• Statistical reliability: Highest - duration estimates most accurate
Strong Setup (45-59 points):
• Quality Score: 45-59
• Volume: High or Above Average
• Volatility: Rising
• Volume Momentum: Rising (1.0-1.2x)
• MTF Confluence (if enabled): 3-4/6
• Action: Standard trade - normal position size
• Statistical reliability: Good - duration estimates reliable
Good Setup (30-44 points):
• Quality Score: 30-44
• Volume: Above Average
• Volatility: Stable or Rising
• Volume Momentum: Neutral to Rising
• MTF Confluence (if enabled): 3-4/6
• Action: Cautious trade - reduced position size, wait for additional confirmation
• Statistical reliability: Moderate - duration estimates less certain
Weak Setup (Below 30 points):
• Quality Score: Below 30
• Volume: Low or Normal
• Volatility: Contracting or Stable
• Volume Momentum: Weak
• MTF Confluence (if enabled): 1-2/6
• Action: Pass or wait for improvement
• Statistical reliability: Low - duration estimates unreliable
USING duration analysis boxES FOR TRADE MANAGEMENT:
Entry Timing:
• Enter on SuperTrend flip (signal bar close)
• duration analysis box appears simultaneously
• Note the median duration - this is your expected hold time
Profit Targets:
• Conservative: Use MEDIAN duration as profit target (50% probability)
• Moderate: Use AVERAGE duration (mean of similar trends)
• Aggressive: Aim for MAX duration from range (best historical outcome)
Position Management:
• Scale out at median duration (take partial profits)
• Trail stop as trend extends beyond median
• Full exit at average duration or SuperTrend flip (whichever comes first)
• Re-evaluate if trend exceeds estimated range
analysis mode Selection:
• Simple: Clean trending markets, beginners, minimal complexity
• Standard: Most markets, most traders (recommended default)
• Advanced: Volatile markets, complex instruments, experienced traders seeking highest accuracy
Asset Type Configuration (Advanced Mode):
If using Advanced analysis mode, configure Asset Type for optimal accuracy:
• Small Cap: Stocks under $2B market cap, low liquidity
• Biotech / Speculative: Clinical-stage pharma, penny stocks, high-risk
• Blue Chip / Large Cap: S&P 500, mega-cap tech, stable large companies
• Tech Growth: High-growth tech (TSLA, NVDA, growth SaaS)
• Dividend / Value: Dividend aristocrats, value stocks, utilities
• Cyclical: Energy, materials, industrials (macro-driven)
• Crypto / High Volatility: Bitcoin, altcoins, highly volatile assets
Correct asset type selection improves Statistical accuracy by 15-20%.
RISK MANAGEMENT GUIDELINES:
1. Stop Loss Placement:
Long positions:
• Place stop below recent swing low OR
• Place stop below SuperTrend level (whichever is tighter)
• Use 1-2 ATR distance as guideline
• Recommended: SuperTrend level (built-in volatility adjustment)
Short positions:
• Place stop above recent swing high OR
• Place stop above SuperTrend level (whichever is tighter)
• Use 1-2 ATR distance as guideline
• Recommended: SuperTrend level
2. Position Sizing by Quality Score:
• Excellent (60-70): Maximum position size (2% risk per trade)
• Strong (45-59): Standard position size (1.5% risk per trade)
• Good (30-44): Reduced position size (1% risk per trade)
• Weak (Below 30): Pass or micro position (0.5% risk - learning trades only)
3. Exit Strategy Options:
Option A - Statistical Duration-Based Exit:
• Exit at median estimated duration (conservative)
• Exit at average estimated duration (moderate)
• Trail stop beyond average duration (aggressive)
Option B - Signal-Based Exit:
• Exit on opposite signal (SELL after BUY, or vice versa)
• Exit on SuperTrend flip (trend reversal)
• Exit if quality score drops below 30 mid-trend
Option C - Hybrid (Recommended):
• Take 50% profit at median estimated duration
• Trail stop on remaining 50% using SuperTrend as trailing level
• Full exit on SuperTrend flip or quality collapse
4. Trade Filtering:
For higher win-rate (fewer trades, better quality):
• Increase minimum quality score (try 60 for swing, 50 for day trading)
• Enable volume momentum filter (ensure institutional participation)
• Require higher MTF confluence (5-6/6 alignment)
• Use Advanced analysis mode with appropriate asset type
For more opportunities (more trades, lower quality threshold):
• Decrease minimum quality score (40 for day trading, 35 for scalping)
• Disable volume momentum filter
• Lower MTF confluence requirement
• Use Simple or Standard analysis mode
SETTINGS OVERVIEW
Quick Setup Section:
• Trading Style Preset: Auto / Scalping / Day Trading / Swing / Position / Custom
Dashboard & Display:
• Show Dashboard (ON/OFF)
• Dashboard Position (9 options: Top/Middle/Bottom + Left/Center/Right)
• Text Size (Auto/Tiny/Small/Normal/Large/Huge)
• Show Ribbon Fill (ON/OFF)
• Show SuperTrend Line (ON/OFF)
• Bullish Color (default: Green)
• Bearish Color (default: Red)
• Show Entry Labels - BUY/SELL signals (ON/OFF)
• Show Info Labels - Volume events (ON/OFF)
• Label Size (Auto/Tiny/Small/Normal/Large/Huge)
Supertrend Configuration:
• ATR Length (default varies by preset: 7-21)
• ATR Multiplier Base (default varies by preset: 2.0-4.0)
• Use Adaptive Multiplier (ON/OFF) - Dynamic 0.8x-1.2x adjustment
• Smoothing Factor (0.0-0.5) - EMA smoothing applied to bands
• Neutral Bars After Flip (0-10) - Hide ST immediately after flip
Volume Momentum:
• Enable Volume Momentum Filter (ON/OFF)
• Fast Period (default varies by preset: 3-20)
• Slow Period (default varies by preset: 10-50)
Volume Analysis:
• Volume MA Length (default varies by preset: 10-50)
• High Volume Threshold (default: 1.5x)
• Spike Threshold (default: 2.5x)
• Low Volume Threshold (default: 0.7x)
Quality Filters:
• Minimum Quality Score (0-70, varies by preset)
• Require Volume Confirmation (ON/OFF)
Trend Duration Analysis:
• Show Duration Analysis (ON/OFF) - Display duration analysis boxes
• analysis mode - Simple / Standard / Advanced
• Asset Type - 7 options (Small Cap, Biotech, Blue Chip, Tech Growth, Dividend, Cyclical, Crypto)
• Use Exponential Weighting (ON/OFF) - Recent trends weighted more
• Decay Factor (0.5-0.99) - How much more recent trends matter
• Structure Lookback (3-30) - Pivot detection period for support/resistance
• Proximity Threshold (xATR) - How close to level qualifies as "near"
• Enable Error Learning (ON/OFF) - System learns from estimation errors
• Memory Depth (3-20) - How many past errors to remember
Box Visual Settings:
• duration analysis box Border Color
• duration analysis box Background Color
• duration analysis box Text Color
• duration analysis box Border Width
• duration analysis box Transparency
Multi-Timeframe (Optional Feature):
• Enable MTF Confluence (ON/OFF)
• Minimum Alignment Required (0-6)
• Individual timeframe enable/disable toggles
• Custom timeframe selection options
All preset configurations override manual inputs except when "Custom" is selected.
ADVANCED FEATURES
1. Scalpel Mode (Optional)
Advanced pullback entry system that waits for healthy retracements within established trends before signaling entry:
• Monitors price distance from SuperTrend levels
• Requires pullback to configurable range (default: 30-50%)
• Ensures trend remains intact before entry signal
• Reduces whipsaw and false breakouts
• Inspired by Mark Minervini's VCP pullback entries
Best for: Swing traders and day traders seeking precision entries
Scalpers: Consider disabling for faster entries
2. Error Learning System (Advanced analysis mode Only)
The system learns from its own estimation errors:
• Tracks last 10-20 completed duration estimates (configurable memory depth)
• Calculates error ratio for each: estimated duration / Actual Duration
• If system consistently over-estimates: Applies negative correction (-15%)
• If system consistently under-estimates: Applies positive correction (+15%)
• Adapts to current market regime automatically
This self-correction mechanism improves accuracy over time as the system gathers more data on your specific symbol and timeframe.
3. Regime Detection (Advanced analysis mode Only)
Automatically detects whether market is in trending or choppy regime:
• Compares last 3 trends to historical average
• Recent trends 20%+ longer → Trending regime (+20% to estimates)
• Recent trends 20%+ shorter → Choppy regime (-20% to estimates)
• Applied separately to bullish and bearish trends
Helps duration estimates adapt to changing market conditions without manual intervention.
4. Exponential Weighting
Option to weight recent trends more heavily than distant history:
• Default decay factor: 0.9
• Recent trends get higher weight in statistical calculations
• Older trends gradually decay in importance
• Rationale: Recent market behavior more relevant than old data
• Can be disabled for equal weighting
5. Backtest Statistics
System backtests its own duration estimates using historical data:
• Walks through past trends chronologically
• Calculates what duration estimate WOULD have been at each flip
• Compares to actual duration that occurred
• Displays accuracy metrics in duration analysis boxes and dashboard
• Helps assess statistical reliability on your specific chart
Note: Backtest uses only data available AT THE TIME of each historical flip (no lookahead bias).
TECHNICAL SPECIFICATIONS
• Pine Script Version: v6
• Indicator Type: Overlay (draws on price chart)
• Max Boxes: 500 (for duration analysis box storage)
• Max Bars Back: 5000 (for comprehensive historical analysis)
• Security Calls: 1 (for MTF if enabled - optimized)
• Repainting: NO - All signals and duration estimates confirmed on bar close
• Lookahead Bias: NO - All HTF data properly offset, all duration estimates use only historical data
• Real-time Updates: YES - Dashboard and quality scores update live
• Alert Capable: YES - Both automatic alerts and customizable alert conditions
• Multi-Symbol: Works on stocks, crypto, forex, futures, indices
Performance Optimization:
• Conditional calculations (duration analysis can be disabled to reduce load)
• Efficient array management (circular buffers for trend storage)
• Streamlined gradient rendering (26 layers, can be toggled off)
• Smart label cooldown system (prevents label spam)
• Optimized similarity matching (analyzes only relevant trends)
Data Requirements:
• Minimum 50-100 bars for initial duration analysis (builds historical database)
• Optimal: 500+ bars for robust statistical analysis
• Longer history = more accurate duration estimates
• Works on any timeframe from 1 minute to monthly
KNOWN LIMITATIONS
• Trending Markets Only: Performs best in clear trends. May generate false signals in choppy/sideways markets (use quality score filtering and regime detection to mitigate)
• Lagging Nature: Like all trend-following systems, signals occur AFTER trend establishment, not at exact tops/bottoms. Use duration analysis boxes to set realistic profit targets.
• Initial Learning Period: Duration analysis system requires 10-15 completed trends to build reliable historical database. Early duration estimates less accurate (first few weeks on new symbol/timeframe).
• Visual Load: 26-layer gradient ribbon may slow performance on older devices. Disable ribbon if experiencing lag.
• Statistical accuracy Variables: Duration estimates are statistical estimates, not guarantees. Accuracy varies by:
- Market regime (trending vs choppy)
- Asset volatility characteristics
- Quality of historical pattern matches
- Timeframe traded (higher TF = more reliable)
• Not Best Suitable For:
- Ultra-short-term scalping (sub-1-minute charts)
- Mean-reversion strategies (designed for trend-following)
- Range-bound trading (requires trending conditions)
- News-driven spikes (estimates based on technical patterns, not fundamentals)
FREQUENTLY ASKED QUESTIONS
Q: Does this indicator repaint?
A: Absolutely not. All signals, duration analysis boxes, labels, and alerts use barstate.isconfirmed checks. They only appear after the bar closes. What you see in history is exactly what you would have seen in real-time. Zero repaint guarantee.
Q: How accurate are the trend duration estimates?
A: Accuracy varies by mode, market conditions, and historical data quality:
• Simple mode: 60-70% accuracy (within ±20% of actual duration)
• Standard mode: 70-80% accuracy (within ±20% of actual duration)
• Advanced mode: 75-85% accuracy (within ±20% of actual duration)
Best accuracy achieved on:
• Higher timeframes (4H, Daily, Weekly)
• Trending markets (not choppy/sideways)
• Assets with consistent behavior (Blue Chip, Large Cap)
• After 20+ historical trends analyzed (builds robust database)
Remember: All duration estimates are statistical calculations based on historical patterns, not guarantees.
Q: Which analysis mode should I use?
A:
• Simple: Beginners, clean trending markets, want minimal complexity
• Standard: Most traders, general market conditions (RECOMMENDED DEFAULT)
• Advanced: Experienced traders, volatile/complex markets (biotech, small-cap, crypto), seeking maximum accuracy
Advanced mode requires correct Asset Type configuration for optimal results.
Q: What's the difference between the trading style presets?
A: Each preset optimizes ALL parameters for a specific trading approach:
• Scalping: Ultra-sensitive (ATR 7, Mult 2.0), more signals, shorter holds
• Day Trading: Balanced (ATR 10, Mult 2.5), moderate signals, intraday holds
• Swing Trading: Stable (ATR 14, Mult 3.0), fewer signals, multi-day holds
• Position Trading: Very stable (ATR 21, Mult 4.0), rare signals, week/month holds
Auto mode automatically selects based on your chart timeframe.
Q: Should I use Auto mode or manually select a preset?
A: Auto mode is recommended for most traders. It automatically matches settings to your timeframe and re-optimizes if you switch charts. Only use manual preset selection if:
• You want scalping settings on a 15m chart (overriding auto-detection)
• You want swing settings on a 1h chart (more conservative than auto would give)
• You're testing different approaches on same timeframe
Q: Can I use this for scalping and day trading?
A: Absolutely! The preset system is specifically designed for all trading styles:
• Select "Scalping (1-5m)" for 1-5 minute charts
• Select "Day Trading (15m-1h)" for 15m-1h charts
• Or use "Auto" mode and it configures automatically
Volume momentum filter is auto-disabled in Scalping mode for faster signals.
Q: What is Volume Momentum and why does it matter?
A: Volume Momentum compares short-term volume (fast MA) to long-term volume (slow MA). It answers: "Is money flowing into this asset faster now than historically?"
Why it matters:
• Volume often leads price (early warning system)
• Confirms institutional participation (smart money)
• No lag like price-based indicators
• More intuitive than complex mathematical filters
When the ratio is above 1.2, you have strong evidence that institutions are accumulating (bullish) or distributing (bearish).
Q: How do I set up alerts?
A: Two options:
Option 1 - Automatic Alerts:
1. Right-click on chart → Add Alert
2. Condition: Select this indicator
3. Choose "Any alert() function call"
4. Configure notification method (app, email, webhook)
5. You'll receive detailed alerts on every BUY and SELL signal
Option 2 - Customizable Alert Conditions:
1. Right-click on chart → Add Alert
2. Condition: Select this indicator
3. You'll see three options in dropdown:
- "BUY Signal" (long signals only)
- "SELL Signal" (short signals only)
- "ANY Signal" (both BUY and SELL)
4. Choose desired option and customize message template
5. Uses TradingView placeholders: {{ticker}}, {{close}}, {{time}}, etc.
All alerts fire only on confirmed bar close (no repaint).
Q: What is Scalpel Mode and should I use it?
A: Scalpel Mode waits for healthy pullbacks within established trends before signaling entry. It reduces whipsaws and improves entry timing.
Recommended ON for:
• Swing traders (want precision entries on pullbacks)
• Day traders (willing to wait for better prices)
• Risk-averse traders (prefer fewer but higher-quality entries)
Recommended OFF for:
• Scalpers (need immediate entries, can't wait for pullbacks)
• Momentum traders (want to enter on breakout, not pullback)
• Aggressive traders (prefer more opportunities over precision)
Q: Why do some duration estimates show wider ranges than others?
A: Range width reflects historical trend variability:
• Narrow range: Similar historical trends had consistent durations (high confidence)
• Wide range: Similar historical trends had varying durations (lower confidence)
Wide ranges often occur:
• Early in analysis (fewer historical trends to learn from)
• In volatile/choppy markets (inconsistent trend behavior)
• On lower timeframes (more noise, less consistency)
The median and average still provide useful targets even when range is wide.
Q: Can I customize the dashboard position and appearance?
A: Yes! Dashboard settings include:
• Position: 9 options (Top/Middle/Bottom + Left/Center/Right)
• Text Size: Auto, Tiny, Small, Normal, Large, Huge
• Show/Hide: Toggle entire dashboard on/off
Choose position that doesn't overlap important price action on your specific chart.
Q: Which timeframe should I trade on?
A: Depends on your trading style and time availability:
• 1-5 minute: Active scalping, requires constant monitoring
• 15m-1h: Day trading, check few times per session
• 4h-Daily: Swing trading, check once or twice daily
• Daily-Weekly: Position trading, check weekly
General principle: Higher timeframes produce:
• Fewer signals (less frequent)
• Higher quality setups (stronger confirmations)
• More reliable duration estimates (better statistical data)
• Less noise (clearer trends)
Start with Daily chart if new to trading. Move to lower timeframes as you gain experience.
Q: Does this work on all markets (stocks, crypto, forex)?
A: Yes, it works on all markets with trending characteristics:
Excellent for:
• Stocks (especially growth and momentum names)
• Crypto (BTC, ETH, major altcoins)
• Futures (indices, commodities)
• Forex majors (EUR/USD, GBP/USD, etc.)
Best results on:
• Trending markets (not range-bound)
• Liquid instruments (tight spreads, good fills)
• Volatile assets (clear trend development)
Less effective on:
• Range-bound/sideways markets
• Ultra-low volatility instruments
• Illiquid small-caps (use caution)
Configure Asset Type (in Advanced analysis mode) to match your instrument for best accuracy.
Q: How many signals should I expect per day/week?
A: Highly variable based on:
By Timeframe:
• 1-5 minute: 5-15 signals per session
• 15m-1h: 2-5 signals per day
• 4h-Daily: 2-5 signals per week
• Daily-Weekly: 1-2 signals per month
By Market Volatility:
• High volatility = more SuperTrend flips = more signals
• Low volatility = fewer flips = fewer signals
By Quality Filter:
• Higher threshold (60-70) = fewer but better signals
• Lower threshold (30-40) = more signals, lower quality
By Volume Momentum Filter:
• Enabled = Fewer signals (only volume-confirmed)
• Disabled = More signals (all SuperTrend flips)
Adjust quality threshold and filters to match your desired signal frequency.
Q: What's the difference between entry labels and info labels?
A:
Entry Labels (BUY/SELL):
• Your primary trading signals
• Based on SuperTrend flip + all confirmations (quality, volume, momentum)
• Include quality score and confirmation icons
• These are actionable entry points
Info Labels (Volume Spike):
• Additional market context
• Show volume events that may support or contradict trend
• 8-bar cooldown to prevent spam
• NOT necessarily entry points - contextual information only
Control separately: Can show entry labels without info labels (recommended for clean charts).
Q: Can I combine this with other indicators?
A: Absolutely! This works well with:
• RSI: For divergences and overbought/oversold conditions
• Support/Resistance: Confluence with key levels
• Fibonacci Retracements: Pullback targets in Scalpel Mode
• Price Action Patterns: Flags, pennants, cup-and-handle
• MACD: Additional momentum confirmation
• Bollinger Bands: Volatility context
This indicator provides trend direction and duration estimates - complement with other tools for entry refinement and additional confluence.
Q: Why did I get a low-quality signal? Can I filter them out?
A: Yes! Increase the Minimum Quality Score in settings.
If you're seeing signals with quality below your preference:
• Day Trading: Set minimum to 50
• Swing Trading: Set minimum to 60
• Position Trading: Set minimum to 70
Only signals meeting the threshold will appear. This reduces frequency but improves win-rate.
Q: How do I interpret the MTF Confluence count?
A: Shows how many of 6 timeframes agree with current trend:
• 6/6 aligned: Perfect agreement (extremely rare, highest confidence)
• 5/6 aligned: Very strong alignment (high confidence)
• 4/6 aligned: Good alignment (standard quality setup)
• 3/6 aligned: Moderate alignment (acceptable)
• 2/6 aligned: Weak alignment (caution)
• 1/6 aligned: Very weak (likely counter-trend)
Higher confluence typically correlates with longer, stronger trends. However, MTF analysis is optional - you can disable it and rely solely on quality scoring.
Q: Is this suitable for beginners?
A: Yes, but requires foundational knowledge:
You should understand:
• Basic trend-following concepts (higher highs, higher lows)
• Risk management principles (position sizing, stop losses)
• How to read candlestick charts
• What volume and volatility mean
Beginner-friendly features:
• Auto preset mode (zero configuration)
• Quality scoring (tells you signal strength)
• Dashboard tooltips (hover for explanations)
• duration analysis boxes (visual profit targets)
Recommended for beginners:
1. Start with "Auto" or "Swing Trading" preset on Daily chart
2. Use Standard Analysis Mode (not Advanced)
3. Set minimum quality to 60 (fewer but better signals)
4. Paper trade first for 2-4 weeks
5. Study methodology references (Minervini, O'Neil, Zanger)
Q: What is the Asset Type setting and why does it matter?
A: Asset Type (in Advanced analysis mode) adjusts duration estimates based on volatility characteristics:
• Small Cap: Explosive moves, extended trends (+30-40%)
• Biotech / Speculative: Parabolic potential, news-driven (+40%)
• Blue Chip / Large Cap: Baseline, steady trends (0% adjustment)
• Tech Growth: Momentum-driven, longer trends (+20%)
• Dividend / Value: Slower, grinding trends (-20%)
• Cyclical: Macro-driven, variable (±10%)
• Crypto / High Volatility: Parabolic potential (+30%)
Correct configuration improves Statistical accuracy by 15-20%. Using Blue Chip settings on a biotech stock may underestimate trend length (you'll exit too early).
Q: Can I backtest this indicator?
A: Yes! TradingView's Strategy Tester works with this indicator's signals.
To backtest:
1. Note the entry conditions (SuperTrend flip + quality threshold + filters)
2. Create a strategy script using same logic
3. Run Strategy Tester on historical data
Additionally, the indicator includes BUILT-IN duration estimate validation:
• System backtests its own duration estimates
• Shows accuracy metrics in dashboard and duration analysis boxes
• Helps assess reliability on your specific symbol/timeframe
Q: Why does Volume Momentum auto-disable in Scalping mode?
A: Scalping requires ultra-fast entries to catch quick moves. Volume Momentum filter adds friction by requiring volume confirmation before signaling, which can cause missed opportunities in rapid scalping.
Scalping preset is optimized for speed and frequency - the filter is counterproductive for that style. It remains enabled for Day Trading, Swing Trading, and Position Trading presets where patience improves results.
You can manually enable it in Custom mode if desired.
Q: How much historical data do I need for accurate duration estimates?
A:
Minimum: 50-100 bars (indicator will function but duration estimates less reliable)
Recommended: 500+ bars (robust statistical database)
Optimal: 1000+ bars (maximum Statistical accuracy)
More history = more completed trends = better pattern matching = more accurate duration estimates.
New symbols or newly-switched timeframes will have lower Statistical accuracy initially. Allow 2-4 weeks for the system to build historical database.
IMPORTANT DISCLAIMERS
No Guarantee of Profit:
This indicator is an educational tool and does not guarantee any specific trading results. All trading involves substantial risk of loss. Duration estimates are statistical calculations based on historical patterns and are not guarantees of future performance.
Past Performance:
Historical backtest results and Statistical accuracy statistics do not guarantee future performance. Market conditions change constantly. What worked historically may not work in current or future markets.
Not Financial Advice:
This indicator provides technical analysis signals and statistical duration estimates only. It is not financial, investment, or trading advice. Always consult with a qualified financial advisor before making investment decisions.
Risk Warning:
Trading stocks, options, futures, forex, and cryptocurrencies involves significant risk. You can lose all of your invested capital. Never trade with money you cannot afford to lose. Only risk capital you can lose without affecting your lifestyle.
Testing Required:
Always test this indicator on a demo account or with paper trading before risking real capital. Understand how it works in different market conditions. Verify Statistical accuracy on your specific instruments and timeframes before trusting it with real money.
User Responsibility:
You are solely responsible for your trading decisions. The developer assumes no liability for trading losses, incorrect duration estimates, software errors, or any other damages incurred while using this indicator.
Statistical Estimation Limitations:
Trend Duration estimates are statistical estimates based on historical pattern matching. They are NOT guarantees. Actual trend durations may differ significantly from duration estimates due to unforeseen news events, market regime changes, or lack of historical precedent for current conditions.
CREDITS & ACKNOWLEDGMENTS
Methodology Inspiration:
• Mark Minervini - Volatility Contraction Pattern (VCP) concepts and pullback entry techniques
• William O'Neil - Volume analysis principles and CANSLIM institutional buying patterns
• Dan Zanger - Momentum breakout strategies and volatility expansion entries
Technical Components:
• SuperTrend calculation - Classic ATR-based trend indicator (public domain)
• Statistical analysis - Standard median, average, range calculations
• k-Nearest Neighbors - Classic machine learning similarity matching concept
• Multi-timeframe analysis - Standard request.security implementation in Pine Script
For questions, feedback, or support, please comment below or send a private message.
Happy Trading!
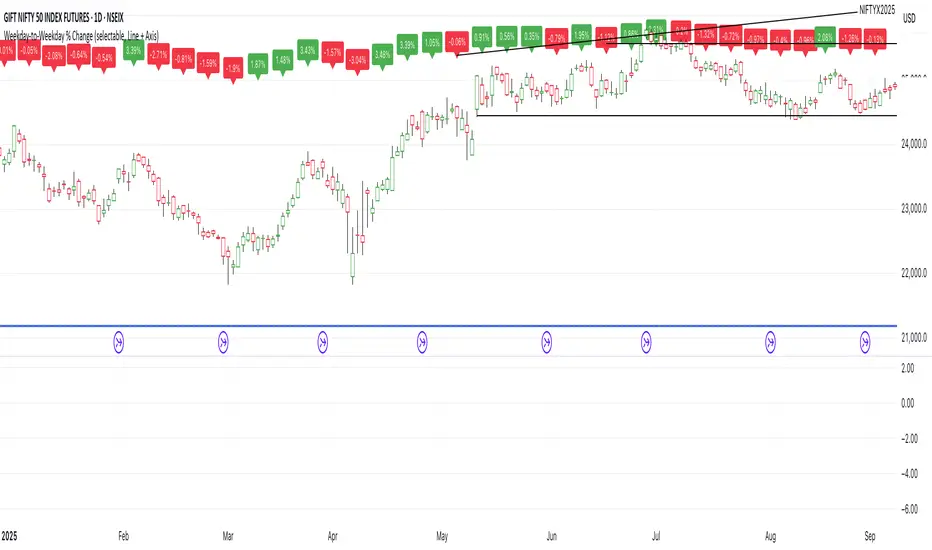
Weekday-to-Weekday % Change (selectable, Line + Axis)Weekday-to-Weekday % Change
Plots % change between the chosen weekday occurrences (week-over-week style) or intraday open→close if you select that comparison type.
Shows as a line in a separate pane (overlay=false).
Auto-scales the Y-axis in percent using invisible padded bounds so TradingView draws a readable axis and ticks.
Optional EMA smoothing and labels on the selected-day bars.
Cumulative Volume Delta (HA Option)# **📘 Ultimate Guide to Trading With CVD Heikin Ashi (CVD+)**
## **🔍 What This Indicator Shows**
This tool plots **Cumulative Volume Delta (CVD)** as candlesticks—optionally transformed into **Heikin Ashi CVD candles**.
Instead of price, each candle represents the *battle between buyers and sellers* within your chosen timeframe.
**Volume Delta = Buying Volume – Selling Volume**
CVD takes all deltas and stacks them cumulatively, showing who is controlling the auction *over time*.
With Heikin Ashi smoothing layered on top, trend detection becomes cleaner, letting you see the “true pressure” behind price moves.
---
# **💡 Why CVD Is a Game Changer**
Most traders only see price.
Serious traders watch **pressure**.
CVD exposes what price hides:
* Absorption
* Hidden accumulation
* Seller exhaustion
* Fake breakouts
* True reversals
* Momentum strength / weakness
* Smart money footprint
When combined with Heikin-Ashi smoothing, you get delta trends with way less noise and fewer fake flips.
---
# **📈 How to Actually Use It (The Edge)**
## **1. Spot True Trend vs. Fake Trend**
If **price goes up** but **CVD goes down**, that’s:
* Passive sellers absorbing
* A weak rally
* High probability of reversal
If **price pulls back** but **CVD keeps rising**, that’s:
* Secret accumulation
* A continuation setup
* Great dip-buy opportunity
**Rule of thumb:**
🔹 *Follow the CVD trend, not the price noise.*
---
## **2. Catch Reversals Early**
Watch for:
### **🔻 Bearish Reversal Signals**
* CVD makes a **lower high**
* Heikin Ashi CVD prints **red bodies with rising upper shadows**
* Price makes one final push up on low delta
This is classic distribution → the drop usually follows fast.
### **🔹 Bullish Reversal Signals**
* CVD forms a **higher low**
* HA CVD flips from red to green with full bodies
* Price still looks weak = bottom forming
This is exactly how pros catch bottoms early.
---
## **3. Identify Absorption Levels**
If price hits a level multiple times but CVD keeps climbing (or falling), that level is being defended.
Example:
* Price stalls at support
* CVD keeps rising
= **Buyers absorbing sells → high-probability bounce**
Opposite works for resistance.
---
## **4. Validate Breakouts**
A breakout with *weak or negative CVD* is usually a trap.
A breakout with **strong, rising HA CVD** is real.
If CVD diverges from the breakout direction → fade it.
If CVD confirms → ride it.
---
## **5. Use Heikin Ashi to Stay in Trends**
HA smoothing removes the nasty chop of raw delta data.
Look for:
* Consecutive **full-body teal candles = strong buying wave**
* Consecutive **full-body red candles = strong selling wave**
* Small-bodied candles after a trend = momentum dying
This keeps you in winners longer and cuts losers faster.
---
# **🎯 Practical Trading Playbook**
### **A) Long Setup**
1. Price pullback into support
2. CVD stays bullish or makes a higher low
3. HA CVD flips green or prints a strong body
4. Enter long
5. Stop under CVD structural low
### **B) Short Setup**
1. Price pushes into resistance
2. CVD forms bearish divergence
3. HA CVD prints red bodies
4. Enter short
5. Stop above CVD swing high
### **C) Chop Filter**
No clear HA CVD trend = avoid trading → stop donating money to the market.
---
# **🧠 Tips for Mastery**
* Use lower timeframe delta (1m–5m) for scalping entries
* Use a higher anchor timeframe (1D) to define direction
* When price trends but CVD is flat → expect a fakeout
* When CVD trends but price is flat → expect a breakout
* Trade WITH delta, fade AGAINST delta
---
# **⚠️ Important Notes**
* Crypto = full tick-by-tick volume → CVD is extremely accurate
* Stocks = depends on your broker/data vendor
* Futures = best signal-to-noise ratio
* If your symbol has no volume → indicator will warn you
---
# **📥 Recommended Settings**
* **Anchor timeframe**: 1D or 4H
* **Lower timeframe**: 1m, 3m, or 5m
* **Heikin Ashi**: ON for trend filtering, OFF for raw delta
---
# **🔥 Final Word**
Price can lie.
Delta usually doesn’t.
CVD + Heikin Ashi gives you the closest thing to reading the market’s heartbeat in real time.
Use it to confirm breakouts, detect reversals early, identify real trend strength, and avoid getting caught in manipulation.
If you learn to read CVD well…
you stop trading price, and start trading the **intent** behind the price.

calculator contracts MNQ PIPEGAVTRADESThis is a Risk Management indicator that calculates the exact contracts to trade based on your defined Max Risk ($) and Stop Loss Ticks.
It displays all key Position Sizing metrics (including Account Capital and Risk %) in a fixed table on the chart.

Stochastic Ensembling of OutputsStochastic Ensembling of Outputs
🙏🏻 This is a simple tool/method that would solve naturally many well known problems:
“Price reversed 1 tick before the actual level, not executing my limit order”
“I consider intraday trend change by checking whether price is above/below VWAP, but is 1 tick enough? What to do, price is now whipsawing around vwap...”.
“I want to gradually accumulate a position around a chosen anchor. But where exactly should I put my orders? And I want to automate it ofc.“
“All these DSP adepts are telling you about some kind of noise in the markets… But how can I actually see it?”
The easy fix is to make things more analog less digital, by synthesizing numerous noise instances & adding it to any price-applied metric of yours. The ones who fw techno & psytrance, and other music, probably don’t need any more explanations. Then by checking not just 2 lines or 1 process against another one, you will be checking cloud vs cloud of lines, even allowing you to introduce proxies of probabilities. More crosses -> more confirmation to act.
How-to use:
The tool has 2 inputs: source and target:
Sources should always be the underlying process. If you apply the tool to price based metric, leave it hlcc4 unless you have a better one point estimate for each bar;
Target is your target, e.g if you want to apply it to VWAP, pick VWAP as target. You can thee on the chart above how trading activity recently never exactly touched VWAP, however noised instances of VWAP 'were' touched
The code is clean and written in modular form, you can simply copy paste it to any script of yours if you don't want to have multiple study-on-study script pairs.
^^ applied to prev days highs and lows
^^ applied to MBAD extensions and basis
^^ applied to input series itself
Here’s how it works, no ML, no “AI”, no 1k lines of code, just stats:
The problem with metrics, even if they are time aware like WMA, is that they still do not directly gain information about “changes” between datapoints. If we pick noise characteristics to match these changes, we’d effectively introduce this info into our ops.
^^ this screenshot represents 2 very different processes: a sine wave and white noise, see how the noise instances learned from each process differ significantly.
Changes can be represented as AR1 process . It’s dead simple, no PHD needed, it’s just how the current datapoint is related (or not) to the previous datapoint, no more than 1, and how this relationship holds/evolves over time. Unlike the mainstream approach like MLE, I estimate this relationship (phi parameter) via MoM but giving more weights to more recent datapoints via exponential smoothing over all the data available on your charts (so I encode temporal information), algocomplexity is O(1), lighting fast, just one pass. <- that gives phi , we’d use it as color for our noise generator
Then we just need to estimate noise amplitude ( gamma ) via checking what AR1 model actually thought vs the reality, variance of these innovations. Same via exponential smoothing, time aware, O(1), one pass, it’s all it does.
Then we generate white gaussian noise, and apply 2 estimated parameters (phi and gamma), and that’s all.
Omg, I think I just made my first real DSP script xd
Just like Monte Carlo for risk management, this is so simple and natural I can’t believe so many “pros” hide it and never talk about it in open access. Sharing it here on TradingView would’ve not done anything critical for em, but many would’ve benefited.
∞

Slope Rank ReversalThis tool is designed to solve the fundamental problem of "buying low and selling high" by providing objective entry/exit signals based on momentum extremes and inflection points.
The System employs three core components:
Trend Detection (PSAR): The Parabolic SAR is used as a filter to confirm that a trend reversal or transition is currently underway, isolating actionable trade setups.
Dynamic Momentum Ranking: The indicator continuously measures the slope of the price action. This slope is then ranked against historical data to objectively identify when an asset is in an extreme state (overbought or oversold).
Signal Generation (Inflection Points):
Oversold/Buy: A 🟢 Green X is generated only when the slope ranking indicates the market is steeply negative (oversold), and the slope value begins to tick upwards (the inflection point), signaling potential mean reversion.
Overbought/Sell: A 🔴 Red X is generated only when the slope ranking indicates the market is steeply positive (overbought), and the slope value begins to tick downwards, signaling momentum exhaustion.
The core philosophy is simple: Enter only when the market is exhausted and has started to turn.

Session Breakout, Retest, Reversal + Large Move Alert## **Session Breakout, Retest, Reversal + Large Move Alert**
### Overview
A powerful multi-functional indicator designed for day traders and futures traders to identify session-based breakout opportunities, retest confirmations, and significant price movements across all futures contracts (Gold, E-mini S&P 500, Nasdaq, Crude Oil, and more).
### Key Features
**📊 Pre-Market Session Tracking**
- Automatically calculates pre-market/overnight session highs and lows
- Displays session ranges with customizable colors and styling
- Extends lines through the entire trading session for easy reference
- Supports overnight sessions (e.g., 4 PM – 7:30 AM for Gold futures)
**🚀 Breakout Detection**
- Identifies breakouts above/below pre-market highs and lows
- Uses close-price confirmation to filter false signals from wicks
- Displays "BO ↑" and "BO ↓" labels at breakout points
- Generates instant alerts when breakouts occur
**♻️ Retest Failed Tracking**
- Monitors price retests after breakouts
- Detects when retests fail to reach previous support/resistance
- Labels "RF" (Retest Failed) for high-probability trade setups
- Helps identify reversal opportunities
**📈 First 5-Minute Analysis**
- Captures first 5 minutes of market open (customizable timeframe)
- Tracks first 5-minute highs and lows separately
- Essential for mean-reversion and breakout confirmation strategies
- Blue lines extend through the trading session for easy tracking
**⚡ Large Move Alerts**
- Detects significant price movements based on point thresholds
- Individual thresholds for 5+ different symbols:
- GC (Gold): 15 points
- ES (E-mini S&P 500): 15 points
- NQ (E-mini Nasdaq): 50 points
- CL (Crude Oil): 1.5 points
- Custom: Fully adjustable
- Auto-detects symbol from chart ticker
- Labels show exact point movement and candle direction
### Customization Options
**Symbol Configuration**
- **Auto-Mode**: Automatically detects trading symbol from chart ticker
- **Manual-Mode**: Select specific symbol (GC, ES, NQ, CL, or Custom)
**Session Settings**
- Fully customizable pre-market session time (24-hour format)
- Adjustable market open time for first 5-minute window
- Market close hour and minute configuration
- Support for any timezone
**Point Move Thresholds by Symbol**
- Set independent thresholds for each of your trading symbols
- Quickly adjust settings when switching between different futures
- Includes helpful tooltips for recommended values
**Display & Styling**
- Toggle all visual elements on/off individually
- Customizable colors for all lines and labels:
- Pre-market high/low colors
- Breakout labels (up/down)
- Retest failed labels
- First 5-minute session lines
- Large move indicators
- Text size options: tiny, small, normal, large, huge
### How It Works
1. **Session Tracking**: The indicator identifies your pre-market session and marks the high and low with labeled lines (PH/PL)
2. **Breakout Signal**: Once the market opens, it monitors for close prices above/below the pre-market levels and alerts you with "BO ↑" or "BO ↓"
3. **Retest Confirmation**: After a breakout, it tracks retests and labels "RF" when the retest fails to reach the opposite extreme, confirming trade direction
4. **Large Move Detection**: Simultaneously monitors for significant point moves that exceed your symbol-specific thresholds
5. **Alert Triggers**: Get real-time alerts for:
- Breakout Up/Down
- Any Breakout
- Large Move events
### Alert Conditions
The indicator includes four alert conditions:
- **Breakout Up Alert**: Price closes above pre-market high
- **Breakout Down Alert**: Price closes below pre-market low
- **Any Breakout Alert**: Either breakout condition triggers
- **Large Move Alert**: Point movement exceeds threshold for current symbol
### Ideal For
- ✅ Day traders (breakout/retest strategies)
- ✅ Futures traders (Gold, Oil, Stock Index Contracts)
- ✅ Intraday scalpers (first 5-minute analysis)
- ✅ Swing traders (session-based levels)
- ✅ Multi-symbol traders (independent thresholds per symbol)
### Disclaimer
This indicator is designed for educational and informational purposes. Past performance does not guarantee future results. Always use proper risk management and position sizing. Test thoroughly on historical data before trading live.

EMA + RSI Autotrade Webhook - VarunOverview
The EMA + RSI Autotrade Webhook is a powerful trend-following indicator designed for automated crypto futures trading. This indicator combines the reliability of Exponential Moving Average (EMA) crossovers with RSI momentum filtering to generate high-probability buy and sell signals optimized for webhook integration with crypto exchanges like Delta Exchange, Binance Futures, and Bybit.Key Features
Simple & Effective: Uses proven EMA 9/21 crossover strategy
RSI Momentum Filter: Eliminates low-probability trades in ranging markets
Webhook Ready: Two clean alerts (LONG Entry, SHORT Entry) for seamless automation
Exchange Compatible: Works with Delta Exchange, 3Commas, Alertatron, and other webhook platforms
Zero Lag Signals: Real-time alerts on crossover confirmation
Visual Clarity: Clean chart markers for easy signal identification
How It Works
Entry Signals:
LONG Entry: Triggers when EMA 9 crosses above EMA 21 AND RSI is above 52 (bullish momentum confirmed)
SHORT Entry: Triggers when EMA 9 crosses under EMA 21 AND RSI is below 48 (bearish momentum confirmed)
Technical Components:
Fast EMA: 9-period (tracks short-term price action)
Slow EMA: 21-period (identifies primary trend)
RSI: 14-period (confirms momentum strength)
RSI Long Threshold: 52 (filters weak bullish signals)
RSI Short Threshold: 48 (filters weak bearish signals)
Best Use Cases
Crypto Futures Trading: Bitcoin, Ethereum, Altcoin perpetual contracts
Automated Trading Bots: Integration with Delta Exchange webhooks, TradingView alerts
Timeframes: Optimized for 15-minute charts (works on 5min-1H)
Markets: Trending crypto markets with clear directional moves
Risk Management: Best used with 1-2% stop loss per trade (managed externally)
Webhook Automation Setup
Add indicator to your TradingView chart
Create alerts for "LONG Entry" and "SHORT Entry"
Configure webhook URL from your exchange (Delta Exchange, Binance, etc.)
Use alert message: Entry LONG {{ticker}} @ {{close}} or Entry SHORT {{ticker}} @ {{close}}
Exchange automatically reverses positions on opposite signals
Advantages
✅ No manual trading required - fully automated
✅ Eliminates emotional trading decisions
✅ Catches trending moves early with EMA crossovers
✅ RSI filter reduces whipsaws in choppy markets
✅ Works 24/7 without monitoring
✅ Simple two-alert system (easy to manage)
✅ Compatible with multiple exchanges via webhooksStrategy Philosophy
This indicator follows a trend-following with momentum confirmation approach. By waiting for both EMA crossover AND RSI confirmation, it ensures you're entering trades with genuine momentum behind them, not just random price noise. The tight RSI thresholds (52/48) keep you aligned with the prevailing trend.Recommended Settings
Timeframe: 15-minute (primary), 5-minute (scalping), 1-hour (swing)
Markets: BTC/USDT, ETH/USDT, high-liquidity altcoin perpetuals
Position Sizing: 100% capital per signal (exchange manages reversals)
Stop Loss: 2% (managed via exchange or external bot)
Leverage: 1-2x for conservative approach, up to 5x for aggressive
Important Notes
⚠️ This indicator generates entry signals only - position reversals are handled automatically by your exchange
⚠️ Always backtest on historical data before live trading
⚠️ Use proper risk management and position sizing
⚠️ Best performance in trending markets; may generate false signals in tight ranges
⚠️ Requires TradingView Premium or higher for webhook functionalityTags
cryptocurrency futures automated-trading ema-crossover rsi webhook delta-exchange tradingview-alerts trend-following momentum bitcoin ethereum crypto-bot algo-trading 15-minute-strategy

BullTrader - ParabolicSARFlipSignals(NonRepainting)TP/SL🧠 Purpose & Concept
This indicator refines Wilder’s Parabolic SAR into a simple, non‑repainting alert and visualization system that marks each confirmed trend flip with a clear buy or sell signal.
It also auto‑generates dynamic, ATR‑based Take‑Profit (TP) and Stop‑Loss (SL) levels, keeps them updating with price in real time, and displays the current market bias in an on‑chart table.
The goal: clarity and automation without complexity — see exactly when a new bullish or bearish phase begins, what your current TP/SL targets are, and receive a single clean alert for every new flip.
⚙️ How It Works
1. The built‑in ta.sar() function tracks the Parabolic SAR dots.
2. When a candle closes across the SAR line, a trend‑change is confirmed:
• Price crossing above a SAR dot → Buy Flip (green triangle).
• Price crossing below a SAR dot → Sell Flip (red triangle).
3. On each flip, the indicator calculates dynamic ATR‑based TP / SL targets:
TP = entry ± (ATR × tpMult) and SL = entry ∓ (ATR × slMult)
These values move automatically as the trend develops.
4. A small floating label beside the latest bar shows live‑updated TP / SL numbers.
5. A color‑coded table in the upper‑right corner displays the current trend: Lime = Bullish, Red = Bearish, Yellow = Neutral.
6. Each new flip triggers an easy‑to‑use Buy / Sell alert after the bar closes—no repainting.
🔔 Alerts
Alert Name Triggers When Message
SAR Buy Flip Alert Green triangle (bullish reversal) “BUY Flip — Parabolic SAR on {{ticker}} ({{interval}})”
SAR Sell Flip Alert Red triangle (bearish reversal) “SELL Flip — Parabolic SAR on {{ticker}} ({{interval}})”
📈 Chart Elements
Element Meaning
🟠 Orange cross Standard Parabolic SAR trail.
🟢 / 🔴 Triangles Confirmed buy / sell flips (non‑repainting).
Bright lime/red TP‑SL box Live ATR targets that move with price.
Trend table (top‑right) Instant status of bullish/bearish bias.
✅ Features & Highlights
Non‑repainting — all signals confirm on closed bars.
Visual clarity — single pair of bright triangles for flips.
Dynamic ATR‑based TP / SL values that auto‑trail with trend.
Always‑visible trend summary table.
Two ready‑made alert types (Buy / Sell).
Lightweight and optimized for any timeframe or symbol.
💡 Best Use
Ideal for traders who prefer clean trend‑based entries and volatility‑adaptive exits without signal clutter:
Pair it with your existing strategy or use it standalone for reversal‑based swing and intraday trading.

Volume Based Ranges (VBR) [SS]Here is the Volume Based Ranges or VBR indicator.
How it works
The indicator works by:
Sorting volume into buying and selling volume, then
Calculating 2 independent Z-Scores for buying and selling data, then
Identifying the high buying and selling nodes through the use of the Z-score threshold.
Tracks the average target/move based on buying and selling nodes over a designated lookforward horizon (i.e. if you want to see the average move a high selling node happens over 20 candles, you can modify the lookforward horizon to 20).
Calculates the composition from each volume node, displaying the composition information on each line (the % of buying and selling each node contains).
How to Use it
To use this indicator:
Select the Z-Score length of assessment: By default, z-score is 75 and this is usually fine to leave.
Identify the threshold trigger: This will need to be adjusted based on your timeframe. If you are using 1 minute, the data is noiser and you want more profound signals. Thresholds generally in this range should be between 5 - 7. For larger timeframes, you want to relax this threshold, to about 2 to 3. You can toggle in increments of 0.5 to find what works the best. Generally you want to see very rigorous volume node signals instead of tons of them.
Determine what you want to see: You can turn of the support and resistance lines and just have the node identification signals and the return boxes. Or, you can just have the support and resistance lines and turn off the return boxes. You can customize the information the indicator displays in the settings menu to suit what you are most interested in.
Let's look at some examples '
DIS on the hourly. We can see that the average up move from the high buying nodes has a target of 115.42, and in between there we can see the high selling and buying nodes and their compositions.
High buying (100% of the high buying volume) is around the 112.61. This means, you would expect this to be an area of retracement.
We can also see that high selling is just below that at 111.66, which can be a resistance area.
Here is a closer look at the levels specifically:
EPAM on the daily:
You can see a successful retrace back to a high volume node.
Concluding remarks
That's the indicator!
Its one that is best to get a feel for, play around and decide on the settings you like for your individual ticker.
I have included tooltip descriptions for the settings within the indicator as well.
I hope you enjoy it and find it helpful!
Thanks for reading/checking it out and as always, safe trades!

nOI + Funding + CVD • strategynOI + Funding + CVD Strategy
Overview
This strategy is designed for cryptocurrency trading on platforms like TradingView, focusing on perpetual futures markets. It combines three key indicators—Normalized Open Interest (nOI), Funding Rate, and Cumulative Volume Delta (CVD)—to generate buy and sell signals for long and short positions. The strategy aims to capitalize on market imbalances, such as overextended open interest, funding rate extremes, and volume deltas, which often signal potential reversals or continuations in trending markets.
The script supports pyramiding (up to 10 positions), uses percentage-based position sizing (default 10% of equity per trade), and allows customization of trade directions (longs and shorts can be enabled/disabled independently). It includes multiple signal systems for entries, various exit mechanisms (including stop-loss, take-profit, time-based exits, and conditional closes based on indicators), a Martingale add-on system for averaging positions during drawdowns, and handling of opposite signals (ignore, close, or reverse).
This strategy is not financial advice; backtest thoroughly and use at your own risk. It requires data sources for Open Interest (OI) and Funding Rates, which are fetched via TradingView's security functions (e.g., from Binance for funding premiums).
Key Indicators
1. Normalized Open Interest (nOI)
Group: Open Interest
Purpose: Measures the relative level of open interest over a lookback window to identify overbought (high OI) or oversold (low OI) conditions, which can indicate potential exhaustion in trends.
Calculation:
Fetches OI data (close) from the symbol's standard ticker (e.g., "{symbol}_OI").
Normalizes OI within a user-defined window (default: 500 bars) using min-max scaling: (OI - min_OI) / (max_OI - min_OI) * 100.
Upper threshold (default: 70%): Signals potential short opportunities when crossed from above.
Lower threshold (default: 30%): Signals potential long opportunities when crossed from below.
Visualization: Plotted as a line (teal above upper, red below lower, gray in between). Horizontal lines at upper, mid (50%), lower, and a separator at 102%.
Notes: Handles non-crypto symbols by adjusting timeframe to daily if intraday. Errors if no OI data available.
2. Funding Rate
Group: Funding Rate
Purpose: Tracks the average funding rate (premium index) to detect market sentiment extremes. Positive funding suggests bull bias (longs pay shorts), negative suggests bear bias.
Calculation:
Fetches premium index data from Binance (e.g., "binance:{base}usdt_premium").
Supports lower timeframe aggregation (default: enabled, using 1-min TF) for smoother data.
Averages open and close premiums, clamps values, and scales/shifts for plotting (base: 150, scale: 1000x).
Upper threshold (default: 1.0%): Overheat for shorts.
Lower threshold (default: 1.0%): Overcool for longs.
Ultra level (default: 1.8%): Extreme for additional short signals.
Smoothing: Uses inverse weighted moving average (IWMA) or lower-TF aggregation to reduce noise.
Visualization: Shifted plot (green positive, red negative) with filled areas. Horizontal lines for overheat, overcool, base (0%), and ultra.
Notes: Custom ticker option for non-standard symbols.
3. Cumulative Volume Delta (CVD)
Group: CVD (Cumulative Volume Delta)
Purpose: Measures net buying/selling pressure via volume delta, normalized to identify divergences or confirmations with price.
Calculation:
Delta: +volume if close > open, -volume if close < open.
Cumulative: Rolling cumsum over a window (default: 500 bars), smoothed with EMA (default: 20).
Normalized: Scaled by absolute max in window (-1 to 1 range).
Scaled/shifted for plotting (base: 300 or 0 if anchored, scale: 120x).
Upper threshold (default: 1.0%): Over for shorts.
Lower threshold (default: 1.0%): Under for longs.
Visualization: Shifted plot (aqua positive, purple negative) with filled areas. Horizontal lines for over, under, and separator (default: 252).
Filter Options (for Signal A):
Enable filter (default: false).
Require sign match (Long ≥0, Short ≤0).
Require extreme zones.
Require momentum (rising/falling over N bars, default: 3).
Signal Logics for Entries
Entries are triggered by buy/sell signals from multiple systems (A, B, C, D), filtered by direction toggles and entry conditions.
Signal System A: OI + Funding (with optional CVD filter)
Enabled: Default true.
Sell (Short): nOI > upper threshold, falling over N bars (default: 3), delta ≥ threshold (default: 3%), funding > overheat, and CVD filter OK.
Buy (Long): nOI < lower threshold, rising over N bars (default: 3), delta ≥ threshold (default: 3%), funding < overcool, and CVD filter OK.
Signal System B: Short - Funding Crossunder + Filters
Enabled: Default true.
Sell (Short): Funding crosses under overheat level, optional: CVD > over, nOI < upper.
Signal System C: Short - Ultra Funding
Enabled: Default false.
Sell (Short): Funding crosses ultra level (up or down, both default true).
Signal System D: Long - Funding Crossover + Filters
Enabled: Default true.
Buy (Long): Funding crosses over overcool level, optional: CVD < under, nOI > lower.
Combined: Sell if A/B/C active; Buy if A/D active.
Entry Filters
Cooldown: Optional pause between entries (default: false, 3 bars).
Max Entries: Limit pyramiding (default: true, 6 max).
Entries only if both filters pass and direction allowed.
Opposite Signal Handling
Mode: Ignore (default), Reverse (close and enter opposite), or Close (exit only).
Processed before regular entries.
Position Management
Martingale (3 Steps):
Enabled per step (default: all true).
Triggers add-ons at loss levels (defaults: 5%, 8%, 11%) by adding % to position (default: 100% each).
Resets on position close.
Break Even:
Enabled (default: true).
Activates at profit threshold (default: 5%), sets SL better by offset (default: 0.1%).
Exit Systems
Multiple exits checked in sequence.
Exit 1: SL/TP
Enabled: Separate for long/short (default: true).
SL: % from avg price (defaults: 1% long/short).
TP: % from avg price (defaults: 2% long/short).
Exit 2: Funding
Enabled: Separate for long (up) / short (down) (default: true).
Long Exit: Funding > upper exit threshold (default: 0.8%).
Short Exit: Funding < lower exit threshold (default: 0.8%).
Exit 3: nOI
Enabled: Separate for long (up) / short (down) (default: true).
Long Exit: nOI > upper exit (default: 85%).
Short Exit: nOI < lower exit (default: 15%).
Exit 4: Global SL
Enabled: Default true.
Exit: If position loss ≥ % (default: 7%).
Exit 5: Break Even (integrated in position block)
Exit 6: Time Limit
Enabled: Separate for long/short (default: true).
Exit: After N bars in trade (defaults: 30 each).
Timer updates on add-ons if enabled (default: true).
Visual Elements
Buy/Sell Labels: Small labels ("BUY"/"SELL") on bars with signals, limited to last 30.
All indicators plotted on a separate pane (overlay=false).
Usage Notes
Backtesting: Adjust parameters based on asset/timeframe. Test on historical data.
Data Requirements: Works best on crypto perps with OI and funding data.
Risk Management: Incorporates SL/TP and global SL; monitor drawdowns with Martingale.
Customization: All thresholds, enables, and scales are inputs for fine-tuning.
Version: Pine Script v6.
For questions or improvements, contact the author. Happy trading!

NY VIX Channel Trend US Futures Day Trade StrategyNY VIX Channel Trend Strategy
Summary in one paragraph
Session anchored intraday strategy for index futures such as ES and NQ on one to fifteen minute charts. It acts only after the first configurable window of New York Regular Trading Hours and uses a VIX derived daily implied move to form a realistic channel from the session open. Originality comes from using a pure implied volatility yardstick as portable support and resistance, then committing in the direction of the first window close relative to the open. Add it to a clean chart and trade the simple visuals. For conservative alerts use on bar close.
Scope and intent
• Markets. Index futures ES and NQ
• Timeframes. One to thirty minutes
• Default demo. ES1 on five minutes
• Purpose. Provide a portable intraday yardstick for entries and exits without curve fitting
• Limits. This is a strategy. Orders are simulated on standard candles
Originality and usefulness
• Unique concept. A VIX only channel anchored at 09:30 New York plus a single window trend test
• Addresses. False urgency at session open and unrealistic bands from arbitrary multipliers
• Testability. Every input is visible and the channel is plotted so users can audit behavior
• Portable yardstick. Daily implied move equals VIX percent divided by square root of two hundred fifty two
• Protected status. None. Method and use are fully disclosed
Method overview in plain language
Take the daily VIX or VIX9D value, convert it to a daily fraction by dividing by square root of two hundred fifty two, then anchor a symmetric channel at the New York session open. Observe the first N minutes. If that window closes above the open the bias is long. If it closes below the open the bias is short. One trade per session. Exits occur at the channel boundary or at a bracket based on a user selected VIX factor. Positions are closed a set number of minutes before the session ends.
Base measures
Return basis. The daily implied move unit equals VIX percent divided by square root of two hundred fifty two and serves as the distance unit for targets and stops.
Components
• VIX Channel. Top, mid, bottom lines anchored at 09:30 New York. No extra multipliers
• Window Trend. Close of the first N minutes relative to the session open sets direction
• Risk Bracket. Take profit and stop loss equal to VIX unit times user factor
• Session Window. Uses the exchange time of the chart
Fusion rule
Minimum gates count equals one. The trade only arms after the window has elapsed and a direction exists. One entry per session.
Signal rule
• Long when the window close is above the session open and the window has completed
• Short when the window close is below the session open and the window has completed
• Exit on channel touch. Long exits at the top. Short exits at the bottom
• Flat thirty minutes before the session close or at the user setting
Inputs with guidance
Setup
• Use VIX9D. Width source. Typical true for fast tone or false for baseline
• Use daily OPEN. Toggle for sensitivity to overnight changes
Logic
• Window minutes. Five to one hundred twenty. Larger values delay entries and reduce whipsaw
• VIX factor for TP. Zero point five to two. Raising it widens the profit target
• VIX factor for SL. Zero point five to two. Raising it widens the stop
• Exit minutes before close. Fifteen to ninety. Raising it exits earlier
Properties visible in this publication
• Initial capital one hundred thousand USD
• Base currency USD
• request.security uses lookahead off
• Commission cash per contract two point five $ per each contract. Slippage one tick
• Default order size method FIXED with value one contract. Pyramiding zero. Process orders on close ON. Bar magnifier OFF. Recalculate after order is filled OFF. Calc on every tick ON
Realism and responsible publication
No performance claims. Past results never guarantee future outcomes. Fills and slippage vary by venue. Shapes can move while a bar forms and settle on close. Strategy uses standard candles.
Honest limitations and failure modes
Economic releases and thin liquidity can break the channel. Very quiet regimes can reduce signal contrast. Session windows follow the exchange time of the chart. If both stop and target can be hit within one bar, assume stop first for conservative reading without bar magnifier.
Works best in liquid hours of New York RTH. Very large gaps and surprise news may exceed the implied channel. Always validate on the symbols you trade.
Entries and exits
• Entry logic. After the first window, go long if the window close is above the session open, go short if below
• Exit logic. Long exits at the channel top or at the take profit or stop. Short exits at the channel bottom or at the take profit or stop. Flat before session close by the configured minutes
• Risk model. Initial stop and target based on the VIX unit times user factors. No trail and no break even. No cooldown
• Tie handling. Treat as stop first for conservative interpretation
Position sizing
Fixed size one contract per trade. Target risk per trade should generally remain near one percent of account equity. Risk is based on the daily volatility value, the max loss from the tests for one year duration with 5min chart was 4%, while the avg loss was below <1% of the total capital.
If you have any questions please let me know. Thank you for coming by !
