Fischy Bands (multiple periods)Just a quick way to have multiple periods. Coded at (14,50,100,200,400,600,800). Feel free to tweak it. Default is all on, obviously not as usable! Try just using 14, and 50.
This was generated with javascript for easy templating.
Source:
```
const periods = ;
const generate = (period) => {
const template = `
= bandFor(${period})
plot(b${period}, color=colorFor(${period}, b${period}), linewidth=${periods.indexOf(period)+1}, title="BB ${period} Basis", transp=show${period}TransparencyLine)
pb${period}Upper = plot(b${period}Upper, color=colorFor(${period}, b${period}), linewidth=${periods.indexOf(period)+1}, title="BB ${period} Upper", transp=show${period}TransparencyLine)
pb${period}Lower = plot(b${period}Lower, color=colorFor(${period}, b${period}), linewidth=${periods.indexOf(period)+1}, title="BB ${period} Lower", transp=show${period}TransparencyLine)
fill(pb${period}Upper, pb${period}Lower, color=colorFor(${period}, b${period}), transp=show${period}TransparencyFill)`
console.log(template);
}
console.log(`//@version=4
study(shorttitle="Fischy BB", title="Fischy Bands", overlay=true)
stdm = input(1.25, title="stdev")
bandFor(length) =>
src = hlc3
mult = stdm
basis = sma(src, length)
dev = mult * stdev(src, length)
upper = basis + dev
lower = basis - dev
`);
periods.forEach(e => console.log(`show${e} = input(title="Show ${e}?", type=input.bool, defval=true)`));
periods.forEach(e => console.log(`show${e}TransparencyLine = show${e} ? 20 : 100`));
periods.forEach(e => console.log(`show${e}TransparencyFill = show${e} ? 80 : 100`));
console.log('\n');
console.log(`colorFor(period, series) =>
c = period == 14 ? color.white :
period == 50 ? color.aqua :
period == 100 ? color.orange :
period == 200 ? color.purple :
period == 400 ? color.lime :
period == 600 ? color.yellow :
period == 800 ? color.orange :
color.black
c
`);
periods.forEach(e => generate(e))
```
In den Scripts nach "信达证券能涨到50元吗" suchen

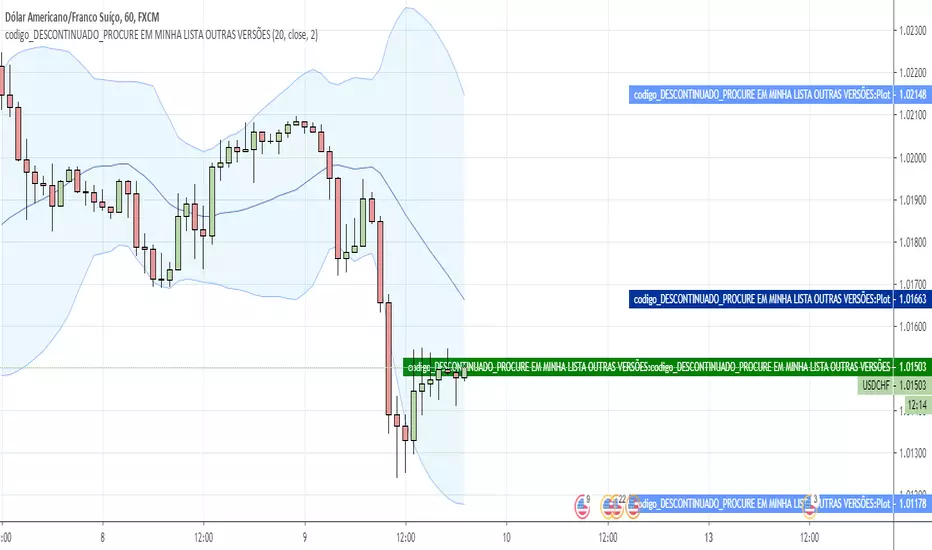
Principe de NY - Rodrigo CohenIndicador criado baseado nas informações de fechamento de bollinger, seguindo o Setup Principe de NY sugerido pelo Analista Rodrigo Cohen, ainda em fase de testes para aprimorar a eficácia do setup
*Considerado apenas Fechamento fora e nesta condição + 50 pontos para entrada sendo assim
Fechamentos com Candles em Vermelho soma 50 pontos e entra vendido
Fechamentos com Candles em Verde soma 50 pontos e entra comprado
O setup pelo que percebi é composto de mais detalhes, aos quais quando tiver acesso realizarei as atualizações devidas
Também estão disponíveis versões de indicadores para Forex
Em breve posto a lista completa com os resultados no MQL5
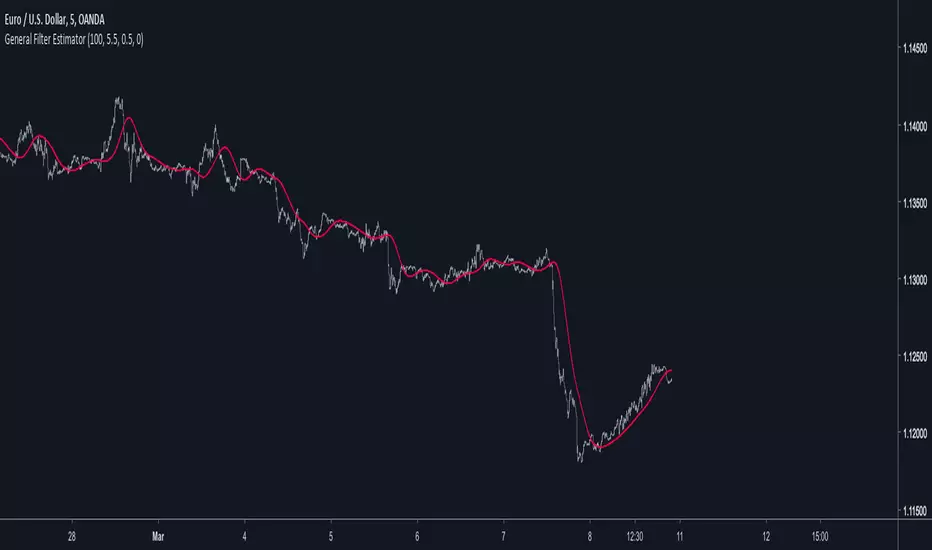
General Filter Estimator-An Experiment on Estimating EverythingIntroduction
The last indicators i posted where about estimating the least squares moving average, the task of estimating a filter is a funny one because its always a challenge and it require to be really creative. After the last publication of the 1LC-LSMA , who estimate the lsma with 1 line of code and only 3 functions i felt like i could maybe make something more flexible and less complex with the ability to approximate any filter output. Its possible, but the methods to do so are not something that pinescript can do, we have to use another base for our estimation using coefficients, so i inspired myself from the alpha-beta filter and i started writing the code.
Calculation and The Estimation Coefficients
Simplicity is the key word, its also my signature style, if i want something good it should be simple enough, so my code look like that :
p = length/beta
a = close - nz(b ,close)
b = nz(b ,close) + a/p*gamma
3 line, 2 function, its a good start, we could put everything in one line of code but its easier to see it this way. length control the smoothing amount of the filter, for any filter f(Period) Period should be equal to length and f(Period) = p , it would be inconvenient to have to use a different length period than the one used in the filter we want to estimate (imagine our estimation with length = 50 estimating an ema with period = 100) , this is where the first coefficients beta will be useful, it will allow us to leave length as it is. In general beta will be greater than 1, the greater it will be the less lag the filter will have, this coefficient will be useful to estimate low lagging filters, gamma however is the coefficient who will estimate lagging filters, in general it will range around .
We can get loose easily with those coefficients estimation but i will leave a coefficients table in the code for estimating popular filters, and some comparison below.
Estimating a Simple Moving Average
Of course, the boxcar filter, the running mean, the simple moving average, its an easy filter to use and calculate.
For an SMA use the following coefficients :
beta = 2
gamma = 0.5
Our filter is in red and the moving average in white with both length at 50 (This goes for every comparison we will do)
Its a bit imprecise but its a simple moving average, not the most interesting thing to estimate.
Estimating an Exponential Moving Average
The ema is a great filter because its length times more computing efficient than a simple moving average. For the EMA use the following coefficients :
beta = 3
gamma = 0.4
N.B : The EMA is rougher than the SMA, so it filter less, this is why its faster and closer to the price
Estimating The Hull Moving Average
Its a good filter for technical analysis with tons of use, lets try to estimate it ! For the HMA use the following coefficients :
beta = 4
gamma = 0.85
Looks ok, of course if you find better coefficients i will test them and actualize the coefficient table, i will also put a thank message.
Estimating a LSMA
Of course i was gonna estimate it, but this time this estimation does not have anything a lsma have, no moving average, no standard deviation, no correlation coefficient, lets do it.
For the LSMA use the following coefficients :
beta = 3.5
gamma = 0.9
Its far from being the best estimation, but its more efficient than any other i previously made.
Estimating the Quadratic Least Square Moving Average
I doubted about this one but it can be approximated as well. For the QLSMA use the following coefficients :
beta = 5.25
gamma = 1
Another ok estimate, the estimate filter a bit more than needed but its ok.
Jurik Moving Average
Its far from being a filter that i like and its a bit old. For the comparison i will use the JMA provided by @everget described in this article : c.mql5.com
For the JMA use the following coefficients :
for phase = 0
beta = pow*2 (pow is a parameter in the Jma)
gamma = 0.5
Here length = 50, phase = 0, pow = 5 so beta = 10
Looks pretty good considering the fact that the Jma use an adaptive architecture.
Discussion
I let you the task to judge if the estimation is good or not, my motivation was to estimate such filters using the less amount of calculations as possible, in itself i think that the code is quite elegant like all the codes of IIR filters (IIR Filters = Infinite Impulse Response : Filters using recursion) .
It could be possible to have a better estimate of the coefficients using optimization methods like the gradient descent. This is not feasible in pinescript but i could think about it using python or R.
Coefficients should be dependant of length but this would lead to a massive work, the variation of the estimation using fixed coefficients when using different length periods is just ok if we can allow some errors of precision.
I dont think it should be possible to estimate adaptive filter relying a lot on their adaptive parameter/smoothing constant except by making our coefficients adaptive (gamma could be)
So at the end ? What make a filter truly unique ? From my point of sight the architecture of a filter and the problem he is trying to solve is what make him unique rather than its output result. If you become a signal, hide yourself into noise, then look at the filters trying to find you, what a challenging game, this is why we need filters.
Conclusion
I wanted to give a simple filter estimator relying on two coefficients in order to estimate both lagging and low-lagging filters. I will try to give more precise estimate and update the indicator with new coefficients.
Thanks for reading !
BTC Volume Index [v2018-11-21] @ LekkerCryptisch.nlIndicates the volume trend:
~50 = short term volume is the same as long term volume
> 50 = short term volume is higher than long term volume (i.e. trend is rising volume)
< 50 = short term volume is lower than long term volume (i.e. trend is declining volume)

Reverse Engineered RSI - Key Levels + MTFThis indicator overlays 5 Reverse Engineered RSI (RERSI) levels on your main chart window.
The RERSI was first developed by Giorgos Siligardos in the June 2003 issue of Stocks and Commodities Magazine. HPotter provided the initial implementation - from which this script is derived - so all credit to them (see: ).
In simple terms, RERSI plots lines on the price chart that reflect levels of the RSI . E.g. if you set up a RERSI line at a level of 50, then price will touch that line when the standard RSI indicator reads 50. Hopefully that makes sense, but compare the two if it doesn't.
Why is the RERSI useful if it's just plotting RSI values? Well, it simplifies things, and enables you to get a clearer picture of trend direction, RSI support and resistance levels, RSI trading signals, and it keeps your chart window uncluttered.
I've set up 5 RERSI lines to be plotted: Overbought and Oversold Levels, a Middle Level (generally leave this at 50), and then Down/Up Trend Lines. The latter two are loosely based on the work of Constance Brown (and they in turn were influenced by Andrew Brown), who posited that RSI doesn't breach certain levels during trends (e.g. 40-50 is often a support level during an uptrend).
Play around with the levels, and the RSI Length, to see how your particular market reacts, and where key levels may lie. Remember, this isn't meant as a stand-alone system (although I think there's potential to use it as such, especially with price action trading - which I guess wouldn't make it stand-alone then!!), and works best with confirmation from other sources.
Oh, and there's MTF capability, because I think that's useful for all indicators.
Any queries, please let me know.
Cheers,
RJR

Better RSI with bullish / bearish market cycle indicator This script improves the default RSI. First. it identifies regions of the RSI which are oversold and overbought by changing the color of RSI from white to red. Second, it adds additional reference lines at 20,40,50,60, and 80 to better gauge the RSI value. Finally, the coolest feature, the middle 50 line is used to indicate which cycle the price is currently at. A green color at the 50 line indicates a bullish cycle, a red color indicators a bearish cycle, and a white color indicates a neutral cycle.
The cycles are determined using the RSI as follows:
if RSI is overbought, cycle switches to bullish until RSI falls below 40, at which point it becomes neutral
if RSI is oversold, cycle switches bearish until RSI rises above 60, at which point it becomes neutral
a neutral cycle is exited at either overbought or oversold conditions
Very useful, please give it a try and let me know what you think

ACM22 not repaintedДелал данный скрипт для FORTS.Идеально подойдет тем,кто использует трейлинг стопы.В основе стратегии лежит RSI.Как по мне,хорошая вещь для проверки стратегии и ее оптимизиации.На скрине 50 контрактов,так что не сильно радуйтесь,а просто делите на 50 и получите показатели на 1 контракт.
Script make for futures on MICEX.U can change paramets of RSI,traling stop and stop loss .On a ps 50 futures USDollar-russian ruble.Use for testing and optimisation.

Inertia Indicator The inertia indicator measures the market, stock or currency pair momentum and
trend by measuring the security smoothed RVI (Relative Volatility Index).
The RVI is a technical indicator that estimates the general direction of the
volatility of an asset.
The inertia indicator returns a value that is comprised between 0 and 100.
Positive inertia occurs when the indicator value is higher than 50. As long as
the inertia value is above 50, the long-term trend of the security is up. The inertia
is negative when its value is lower than 50, in this case the long-term trend is
down and should stay down if the inertia stays below 50

GC RSI Columns V2016This is a basic RSI indicator but in column format.I had been using this for a while and it gives a nice visual representation of trend change by changing color of the column.
Base line is 50 level. Anything above 50 is buy opportunity and below 50 is sell opportunity . Try it on higher time frames and see the results.
Example on chart above.
Note: i published it on demand. many folks were asking me for this ,since it(column rsi) was not available in public indicators

Golden Cross, SMA 200 Moving Average Strategy (by ChartArt)This famous moving average strategy is very easy to follow to decide when to buy (go long) and when to take profit.
The strategy goes long when the faster SMA 50 (the simple moving average of the last 50 bars) crosses above the slower SMA 200. Orders are closed when the SMA 50 crosses below the SMA 200. This simple strategy does not have any other stop loss or take profit money management logic. The strategy does not short and goes long only!
Here is an article explaining the "golden cross" strategy in more detail:
www.stockopedia.com
On the S&P 500 index (symbol "SPX") this strategy worked on the daily chart 81% since price data is available since 1982. And on the DOW Jones Industrial Average (symbol "DOWI") this strategy worked on the daily chart 55% since price data is available since 1916. The low number of trades is in both cases not statistically significant though.
All trading involves high risk; past performance is not necessarily indicative of future results. Hypothetical or simulated performance results have certain inherent limitations. Unlike an actual performance record, simulated results do not represent actual trading. Also, since the trades have not actually been executed, the results may have under- or over-compensated for the impact, if any, of certain market factors, such as lack of liquidity. Simulated trading programs in general are also subject to the fact that they are designed with the benefit of hindsight. No representation is being made that any account will or is likely to achieve profits or losses similar to those shown.

Forex Master v4.0 (EUR/USD Mean-Reversion Algorithm)DESCRIPTION
Forex Master v4.0 is a mean-reversion algorithm currently optimized for trading the EUR/USD pair on the 5M chart interval. All indicator inputs use the period's closing price and all trades are executed at the open of the period following the period where the trade signal was generated.
There are 3 main components that make up Forex Master v4.0:
I. Trend Filter
The algorithm uses a version of the ADX indicator as a trend filter to trade only in certain time periods where price is more likely to be range-bound (i.e., mean-reverting). This indicator is composed of a Fast ADX and a Slow ADX, both using the same look-back period of 50. However, the Fast ADX is smoothed with a 6-period EMA and the Slow ADX is smoothed with a 12-period EMA. When the Fast ADX is above the Slow ADX, the algorithm does not trade because this indicates that price is likelier to trend, which is bad for a mean-reversion system. Conversely, when the Fast ADX is below the Slow ADX, price is likelier to be ranging so this is the only time when the algorithm is allowed to trade.
II. Bollinger Bands
When allowed to trade by the Trend Filter, the algorithm uses the Bollinger Bands indicator to enter long and short positions. The Bolliger Bands indicator has a look-back period of 20 and a standard deviation of 1.5 for both upper and lower bands. When price crosses over the lower band, a Long Signal is generated and a long position is entered. When price crosses under the upper band, a Short Signal is generated and a short position is entered.
III. Money Management
Rule 1 - Each trade will use a limit order for a fixed quantity of 50,000 contracts (0.50 lot). The only exception is Rule
Rule 2 - Order pyramiding is enabled and up to 10 consecutive orders of the same signal can be executed (for example: 14 consecutive Long Signals are generated over 8 hours and the algorithm sends in 10 different buy orders at various prices for a total of 350,000 contracts).
Rule 3 - Every order will include a bracket with both TP and SL set at 50 pips (note: the algorithm only closes the current open position and does not enter the opposite trade once a TP or SL has been hit).
Rule 4 - When a new opposite trade signal is generated, the algorithm sends in a larger order to close the current open position as well as open a new one (for example: 14 consecutive Long Signals are generated over 8 hours and the algorithm sends in 10 different buy orders at various prices for a total of 350,000 contracts. A Short Signal is generated shortly after the 14th Long Signal. The algorithm then sends in a sell order for 400,000 contracts to close the 350,000 contracts long position and open a new short position of 50,000 contracts).

RSI-EMA IndicatorThis indicator calculates and plots 2 separate EMAs of the RSI. The default settings below work great on SPX/SPY daily chart. General rule is if an EMA is above 50, the stock's near term outlook is bullish. If an EMA is below 50, the near term outlook is bearish. Personally, I like to use a fast EMA as a buy signal and a slow EMA as a sell signal.
Default settings:
RSI = 50
EMA1 = 100
EMA2 = 200

High-Low Index [LazyBear]-- Fixed ---
Source: pastebin.com
Fixes an issue with "Combined" mode, using wrong symbols.
--- Original ---
The High-Low Index is a breadth indicator based on Record High Percent, which is based on new 52-week highs and new 52-week lows.
Readings below 50 indicate that there were more new lows than new highs. Readings above 50 indicate that there were more new highs than new lows. 0 indicates there were zero new highs (0% new highs). 100 indicates there was at least 1 new high and no new lows (100% new highs). 50 indicates that new highs and new lows were equal (50% new highs).
Readings consistently above 70 usually coincide with a strong uptrend. Readings consistently below 30 usually coincide with a strong downtrend.
More info:
stockcharts.com
List of my public indicators: bit.ly
List of my app-store indicators: blog.tradingview.com
Just noticed @Greeny has already published this -> Linking it here.

TimWest Long Short FiltersTimWest Long Short Filters
Indicator Has 3 Separate Filters that Create Green(Bullish) or Red(Bearish) BackGround Highlights
If Price is Above or Below a certain LookBack Period - Tim Defaults to 63 on Daily Chart to Quickly View if Price is Above or Below it’s Price 1 Quarter Ago.
A Simple Moving Average Filter - Tim Defaults to 50 SMA and 200 SMA also known as the “Golden Cross”.
A Exponential Moving Average Filter - For Those Who Want To View Shorter Term Market Swings. Defaults to 50 EMA and 100 EMA used By Chuck Hughes, 7 Time World Trading Champion. Chuck Claims the 50/100 EMA's Show the Earliest Change in Market Direction the Equal - Sustainable Moves
Inputs Tab has Checkboxes to Turn On/Off any of the 3 Filters Above.
Reference Chart Post www.tradingview.com

3 projection Indicators - PBands, PO & PBAll these indicators are by Mel Widner.
Projection Bands :
-------------------------------------------------------
These project market data along the trend with the maxima and minima of the projections defining the band. The method provides a way to signal potential direction changes relative to the trend. Usage is like any other trading band.
Projection Oscillator :
-------------------------------------------------------
This indicates the relative position of price with in the bands. It fluctuates between the values 0 to 100. You can configure the "basis" to make it oscillate around a specific value (for ex., basis=50 will make it oscillate between +50 and -50). EMA of PO (length configurable, default is 5) is plotted as a signal line. There is also an option to plot the difference (oscillator - signal), just like MACD histogram. When you see a divergence in this oscillator, remember that it just indicates a potential movement with in the band (for ex., a bullish divergence shown may cause the price to cross the median and move up to the top band).
Projection Bandwidth :
-------------------------------------------------------
This shows the % width of the projection bands. A trend reversal is signaled by a high value. Low value may indicate the start of a new trend. This is also a trend strength indicator.
More info: drive.google.com
Borrowed the color theme for this chart from @liw0. Thanks :)

ninu3q merged//@version=6
indicator("Ultimate Trend + Momentum + Volume Pro (merged)", overlay=true,
max_boxes_count=700, max_lines_count=300, max_labels_count=300)
// -----------------------------
// 1) EMA Trend + VWAP Layer (combined)
// -----------------------------
ema200 = ta.ema(close, 200)
ema50 = ta.ema(close, 50)
vwap = ta.vwap
ema200Plot = plot(ema200, "EMA 200", color=color.red, linewidth=2, style=plot.style_line)
ema50Plot = plot(ema50, "EMA 50", color=color.teal, linewidth=1, style=plot.style_line)
vwapPlot = plot(vwap, "VWAP", color=color.orange, linewidth=1, style=plot.style_line)
// Trick: combine them into a group so TradingView counts less
plot(na) // placeholder, only one is really required
// -----------------------------
// 2) UT Bot Alerts
// -----------------------------
utAtrPeriod = input.int(10, "UT ATR Period")
utAtrMultiplier = input.float(2.0, "UT ATR Multiplier")
utAtr = ta.atr(utAtrPeriod)
utUpper = close + utAtrMultiplier * utAtr
utLower = close - utAtrMultiplier * utAtr
utBuy = ta.crossover(close, utUpper)
utSell = ta.crossunder(close, utLower)
plotshape(utBuy, "UT Buy", location=location.belowbar, color=color.green, style=shape.labelup, text="BUY")
plotshape(utSell, "UT Sell", location=location.abovebar, color=color.red, style=shape.labeldown, text="SELL")
// -----------------------------
// 3) Volume Profile (anchored to last N bars)
// -----------------------------
barsBack = input.int(150, "Bars Back", minval=1, maxval=5000)
cols = input.int(35, "Columns", minval=5, maxval=200)
vaPct = input.float(70.0, "Value Area %", minval=40.0, maxval=99.0)
histWidth = input.int(24, "Histogram Width (bars)", minval=6, maxval=200)
direction = input.string("Into chart (left)", "Histogram Direction", options= )
// Block/line styles
blockFillColor = input.color(#B0B0B0, "Volume Block Fill Color")
blockFillOpacity = input.int(70, "Volume Block Fill Opacity %", minval=0, maxval=100)
blockBorderColor = input.color(#000000, "Volume Block Border Color")
blockBorderOpacity = input.int(0, "Volume Block Border Opacity %", minval=0, maxval=100)
showPOC = input.bool(true, "Show POC Line")
pocColor = input.color(#FF0000, "POC Color")
pocWidth = input.int(2, "POC Width", minval=1, maxval=6)
showVA = input.bool(false, "Show VAH/VAL Lines")
vaColor = input.color(#FFA500, "VA Color")
vaWidth = input.int(1, "VA Width", minval=1, maxval=6)
showVWAP = input.bool(false, "Show AVWAP Line")
vwapColor = input.color(#0000FF, "AVWAP Color")
vwapWidth = input.int(1, "AVWAP Width", minval=1, maxval=6)
showLabels = input.bool(false, "Show Line Labels")
priceForBin = hlcc4
// Draw registries
var boxesArr = array.new_box()
var linesArr = array.new_line()
var labelsArr = array.new_label()
f_wipe() =>
while array.size(boxesArr) > 0
box.delete(array.pop(boxesArr))
while array.size(linesArr) > 0
line.delete(array.pop(linesArr))
while array.size(labelsArr) > 0
label.delete(array.pop(labelsArr))
if barstate.islast
f_wipe()
eff = math.min(barsBack, bar_index + 1)
if eff > 1
float pMin = na
float pMax = na
float pvSum = 0.0
float vSum = 0.0
for look = 0 to eff - 1
lo = low
hi = high
pMin := na(pMin) ? lo : math.min(pMin, lo)
pMax := na(pMax) ? hi : math.max(pMax, hi)
pvSum += priceForBin * volume
vSum += volume
anchoredVWAP = vSum > 0 ? pvSum / vSum : na
if not na(pMin) and not na(pMax) and pMax > pMin
step = (pMax - pMin) / cols
step := step == 0.0 ? syminfo.mintick : step
var vols = array.new_float()
var lows = array.new_float()
var highs = array.new_float()
array.clear(vols), array.clear(lows), array.clear(highs)
for i = 0 to cols - 1
array.push(vols, 0.0)
lo = pMin + i * step
hi = lo + step
array.push(lows, lo)
array.push(highs, hi)
for look = 0 to eff - 1
pr = priceForBin
vol = volume
idx = int(math.floor((pr - pMin) / step))
idx := idx < 0 ? 0 : idx > cols - 1 ? cols - 1 : idx
array.set(vols, idx, array.get(vols, idx) + vol)
pocIdx = 0
pocVol = 0.0
totalVol = 0.0
for i = 0 to cols - 1
v = array.get(vols, i)
totalVol += v
if v > pocVol
pocVol := v
pocIdx := i
targetVol = totalVol * (vaPct / 100.0)
left = pocIdx
right = pocIdx
cumVA = array.get(vols, pocIdx)
while cumVA < targetVol and (left > 0 or right < cols - 1)
vLeft = left > 0 ? array.get(vols, left - 1) : -1.0
vRight = right < cols - 1 ? array.get(vols, right + 1) : -1.0
if vRight > vLeft
right += 1
cumVA += array.get(vols, right)
else if vLeft >= 0
left -= 1
cumVA += array.get(vols, left)
else
break
VAH = array.get(highs, right)
VAL = array.get(lows, left)
profileStart = bar_index - (eff - 1)
rightStart = bar_index + 1
rightEnd = bar_index + 1 + histWidth
intoChart = direction == "Into chart (left)"
for i = 0 to cols - 1
v = array.get(vols, i)
len = pocVol > 0 ? (v / pocVol) : 0.0
px = int(math.round(len * histWidth))
x1 = intoChart ? (rightEnd - px) : rightStart
x2 = intoChart ? rightEnd : (rightStart + px)
y1 = array.get(lows, i)
y2 = array.get(highs, i)
b = box.new(x1, y2, x2, y1, xloc=xloc.bar_index, border_color=color.new(blockBorderColor, blockBorderOpacity))
box.set_bgcolor(b, color.new(blockFillColor, 100 - blockFillOpacity))
array.push(boxesArr, b)
if showPOC
pocPrice = (array.get(lows, pocIdx) + array.get(highs, pocIdx)) / 2.0
lnPOC = line.new(profileStart, pocPrice, rightEnd, pocPrice, xloc=xloc.bar_index, extend=extend.right, color=pocColor, width=pocWidth)
array.push(linesArr, lnPOC)
if showLabels
lbPOC = label.new(rightEnd, pocPrice, "POC", xloc=xloc.bar_index, style=label.style_label_right, textcolor=color.white, color=pocColor)
array.push(labelsArr, lbPOC)
if showVA
lnVAL = line.new(profileStart, VAL, rightEnd, VAL, xloc=xloc.bar_index, extend=extend.right, color=vaColor, width=vaWidth)
lnVAH = line.new(profileStart, VAH, rightEnd, VAH, xloc=xloc.bar_index, extend=extend.right, color=vaColor, width=vaWidth)
array.push(linesArr, lnVAL)
array.push(linesArr, lnVAH)
if showLabels
lbVAH = label.new(rightEnd, VAH, "VAH", xloc=xloc.bar_index, style=label.style_label_right, textcolor=color.white, color=vaColor)
lbVAL = label.new(rightEnd, VAL, "VAL", xloc=xloc.bar_index, style=label.style_label_right, textcolor=color.white, color=vaColor)
array.push(labelsArr, lbVAH)
array.push(labelsArr, lbVAL)
if showVWAP and not na(anchoredVWAP)
lnVW = line.new(profileStart, anchoredVWAP, rightEnd, anchoredVWAP, xloc=xloc.bar_index, extend=extend.right, color=vwapColor, width=vwapWidth)
array.push(linesArr, lnVW)
if showLabels
lbVW = label.new(rightEnd, anchoredVWAP, "AVWAP", xloc=xloc.bar_index, style=label.style_label_right, textcolor=color.white, color=vwapColor)
array.push(labelsArr, lbVW)
// placeholder plot
plot(na)

EvoTrend-X Indicator — Evolutionary Trend Learner ExperimentalEvoTrend-X Indicator — Evolutionary Trend Learner
NOTE: This is an experimental Pine Script v6 port of a Python prototype. Pine wasn’t the original research language, so there may be small quirks—your feedback and bug reports are very welcome. The model is non-repainting, MTF-safe (lookahead_off + gaps_on), and features an adaptive (fitness-based) candidate selector, confidence gating, and a volatility filter.
⸻
What it is
EvoTrend-X is adaptive trend indicator that learns which moving-average length best fits the current market. It maintains a small “population” of fast EMA candidates, rewards those that align with price momentum, and continuously selects the best performer. Signals are gated by a multi-factor Confidence score (fitness, strength vs. ATR, MTF agreement) and a volatility filter (ATR%). You get a clean Fast/Slow pair (for the currently best candidate), optional HTF filter, a fitness ribbon for transparency, and a themed info panel with a one-glance STATUS readout.
Core outputs
• Selected Fast/Slow EMAs (auto-chosen from candidates via fitness learning)
• Spread cross (Fast – Slow) → visual BUY/SELL markers + alert hooks
• Confidence % (0–100): Fitness ⊕ Distance vs. ATR ⊕ MTF agreement
• Gates: Trend regime (Kaufman ER), Volatility (ATR%), MTF filter (optional)
• Candidate Fitness Ribbon: shows which lengths the learner currently prefers
• Export plot: hidden series “EvoTrend-X Export (spread)” for downstream use
⸻
Why it’s different
• Evolutionary learning (on-chart): Each candidate EMA length gets rewarded if its slope matches price change and penalized otherwise, with a gentle decay so the model forgets stale regimes. The best fitness wins the right to define the displayed Fast/Slow pair.
• Confidence gate: Signals don’t light up unless multiple conditions concur: learned fitness, spread strength vs. volatility, and (optionally) higher-timeframe trend.
• Volatility awareness: ATR% filter blocks low-energy environments that cause death-by-a-thousand-whipsaws. Your “why no signal?” answer is always visible in the STATUS.
• Preset discipline, Custom freedom: Presets set reasonable baselines for FX, equities, and crypto; Custom exposes all knobs and honors your inputs one-to-one.
• Non-repainting rigor: All MTF calls use lookahead_off + gaps_on. Decisions use confirmed bars. No forward refs. No conditional ta.* pitfalls.
⸻
Presets (and what they do)
• FX 1H (Conservative): Medium candidates, slightly higher MinConf, modest ATR% floor. Good for macro sessions and cleaner swings.
• FX 15m (Active): Shorter candidates, looser MinConf, higher ATR% floor. Designed for intraday velocity and decisive sessions.
• Equities 1D: Longer candidates, gentler volatility floor. Suits index/large-cap trend waves.
• Crypto 1H: Mid-short candidates, higher ATR% floor for 24/7 chop, stronger MinConf to avoid noise.
• Custom: Your inputs are used directly (no override). Ideal for systematic tuning or bespoke assets.
⸻
How the learning works (at a glance)
1. Candidates: A small set of fast EMA lengths (e.g., 8/12/16/20/26/34). Slow = Fast × multiplier (default ×2.0).
2. Reward/decay: If price change and the candidate’s Fast slope agree (both up or both down), its fitness increases; otherwise decreases. A decay constant slowly forgets the distant past.
3. Selection: The candidate with highest fitness defines the displayed Fast/Slow pair.
4. Signal engine: Crosses of the spread (Fast − Slow) across zero mark potential regime shifts. A Confidence score and gates decide whether to surface them.
⸻
Controls & what they mean
Learning / Regime
• Slow length = Fast ×: scales the Slow EMA relative to each Fast candidate. Larger multiplier = smoother regime detection, fewer whipsaws.
• ER length / threshold: Kaufman Efficiency Ratio; above threshold = “Trending” background.
• Learning step, Decay: Larger step reacts faster to new behavior; decay sets how quickly the past is forgotten.
Confidence / Volatility gate
• Min Confidence (%): Minimum score to show signals (and fire alerts). Raising it filters noise; lowering it increases frequency.
• ATR length: The ATR window for both the ATR% filter and strength normalization. Shorter = faster, but choppier.
• Min ATR% (percent): ATR as a percentage of price. If ATR% < Min ATR% → status shows BLOCK: low vola.
MTF Trend Filter
• Use HTF filter / Timeframe / Fast & Slow: HTF Fast>Slow for longs, Fast threshold; exit when spread flips or Confidence decays below your comfort zone.
2) FX index/majors, 15m (active intraday)
• Preset: FX 15m (Active).
• Gate: MinConf 60–70; Min ATR% 0.15–0.30.
• Flow: Focus on session opens (LDN/NY). The ribbon should heat up on shorter candidates before valid crosses appear—good early warning.
3) SPY / Index futures, 1D (positioning)
• Preset: Equities 1D.
• Gate: MinConf 55–65; Min ATR% 0.05–0.12.
• Flow: Use spread crosses as regime flags; add timing from price structure. For adds, wait for ER to remain trending across several bars.
4) BTCUSD, 1H (24/7)
• Preset: Crypto 1H.
• Gate: MinConf 70–80; Min ATR% 0.20–0.35.
• Flow: Crypto chops—volatility filter is your friend. When ribbon and HTF OK agree, favor continuation entries; otherwise stand down.
⸻
Reading the Info Panel (and fixing “no signals”)
The panel is your self-diagnostic:
• HTF OK? False means the higher-timeframe EMAs disagree with your intended side.
• Regime: If “Chop”, ER < threshold. Consider raising the threshold or waiting.
• Confidence: Heat-colored; if below MinConf, the gate blocks signals.
• ATR% vs. Min ATR%: If ATR% < Min ATR%, status shows BLOCK: low vola.
• STATUS (composite):
• BLOCK: low vola → increase Min ATR% down (i.e., allow lower vol) or wait for expansion.
• BLOCK: HTF filter → disable HTF or align with the HTF tide.
• BLOCK: confidence → lower MinConf slightly or wait for stronger alignment.
• OK → you’ll see markers on valid crosses.
⸻
Alerts
Two static alert hooks:
• BUY cross — spread crosses up and all gates (ER, Vol, MTF, Confidence) are open.
• SELL cross — mirror of the above.
Create them once from “Add Alert” → choose the condition by name.
⸻
Exporting to other scripts
In your other Pine indicators/strategies, add an input.source and select EvoTrend-X → “EvoTrend-X Export (spread)”. Common uses:
• Build a rule: only trade when exported spread > 0 (trend filter).
• Combine with your oscillator: oscillator oversold and spread > 0 → buy bias.
⸻
Best practices
• Let it learn: Keep Learning step moderate (0.4–0.6) and Decay close to 1.0 (e.g., 0.99–0.997) for smooth regime memory.
• Respect volatility: Tune Min ATR% by asset and timeframe. FX 1H ≈ 0.10–0.20; crypto 1H ≈ 0.20–0.35; equities 1D ≈ 0.05–0.12.
• MTF discipline: HTF filter removes lots of “almost” trades. If you prefer aggressive entries, turn it off and rely more on Confidence.
• Confidence as throttle:
• 40–60%: exploratory; expect more signals.
• 60–75%: balanced; good daily driver.
• 75–90%: selective; catch the clean stuff.
• 90–100%: only A-setups; patient mode.
• Watch the ribbon: When shorter candidates heat up before a cross, momentum is forming. If long candidates dominate, you’re in a slower trend cycle.
⸻
Non-repainting & safety notes
• All request.security() calls use lookahead=barmerge.lookahead_off, gaps=barmerge.gaps_on.
• No forward references; decisions rely on confirmed bar data.
• EMA lengths are simple ints (no series-length errors).
• Confidence components are computed every bar (no conditional ta.* traps).
⸻
Limitations & tips
• Chop happens: ER helps, but sideways microstructure can still flicker—use Confidence + Vol filter as brakes.
• Presets ≠ oracle: They’re sensible baselines; always tune MinConf and Min ATR% to your venue and session.
• Theme “Auto”: Pine cannot read chart theme; “Auto” defaults to a Dark-friendly palette.
⸻
Publisher’s Screenshots Checklist
1) FX swing — EURUSD 1H
• Preset: FX 1H (Conservative)
• Params: MinConf=70, ATR Len=14, Min ATR%=0.12, MTF ON (TF=4H, 20/50)
• Show: Clear BUY cross, STATUS=OK, green regime background; Fitness Ribbon visible.
2) FX intraday — GBPUSD 15m
• Preset: FX 15m (Active)
• Params: MinConf=60, ATR Len=14, Min ATR%=0.20, MTF ON (TF=60m)
• Show: SELL cross near London session open. HTF lines enabled (translucent).
• Caption: “GBPUSD 15m • Active session sell with MTF alignment.”
3) Indices — SPY 1D
• Preset: Equities 1D
• Params: MinConf=60, ATR Len=14, Min ATR%=0.08, MTF ON (TF=1W, 20/50)
• Show: Longer trend run after BUY cross; regime shading shows persistence.
• Caption: “SPY 1D • Trend run after BUY cross; weekly filter aligned.”
4) Crypto — BINANCE:BTCUSDT 1H
• Preset: Crypto 1H
• Params: MinConf=75, ATR Len=14, Min ATR%=0.25, MTF ON (TF=4H)
• Show: BUY cross + quick follow-through; Ribbon warming (reds/yellows → greens).
• Caption: “BTCUSDT 1H • Momentum break with high confidence and ribbon turning.”

Z-Score Mean Reversion StrategyBased on Indicator "Rolling Z- Score trend" by QuantAlgo
The Z-Score Mean Reversion Strategy is a statistical trading approach that exploits price extremes and their tendency to return to average levels. It uses the Z-Score indicator to identify when an asset has deviated significantly from its statistical mean, creating high-probability reversal opportunities.
Core Concept:
Z-Score measures how many standard deviations price is from its moving average
When Z-Score reaches extreme levels (±1.5 or more), price is statistically "stretched"
The strategy trades the expected "snap back" to the mean
Works best in ranging or mean-reverting markets
How It Works:
LONG Entry: When price becomes oversold (Z-Score < -1.5), expect upward reversion
SHORT Entry: When price becomes overbought (Z-Score > +1.5), expect downward reversion
Exit: When price returns closer to the mean or reaches opposite extreme
Risk Management: Stop loss at -3% and take profit at +5% by default
🎯 Best Settings by Market & Timeframe
Cryptocurrency (High Volatility)
Preset: Scalping
Timeframe: 15m - 1H
Lookback: 10-15 periods
Entry Threshold: 1.0 - 1.5
Stop Loss: 2-3%
Take Profit: 3-5%
Notes: Crypto moves fast; use tighter parameters for quicker signals
Forex (Medium Volatility)
Preset: Default or Swing Trading
Timeframe: 1H - 4H
Lookback: 20-25 periods
Entry Threshold: 1.5 - 2.0
Stop Loss: 1-2%
Take Profit: 2-4%
Notes: Works well on major pairs during normal market conditions
Stocks (Lower Volatility)
Preset: Swing Trading
Timeframe: 4H - Daily
Lookback: 25-30 periods
Entry Threshold: 1.5 - 1.8
Stop Loss: 2-4%
Take Profit: 4-8%
Notes: Best on liquid stocks; avoid during earnings or major news
Indices (Trend + Ranging)
Preset: Trend Following
Timeframe: Daily - Weekly
Lookback: 35-50 periods
Entry Threshold: 2.0 - 2.5
Stop Loss: 3-5%
Take Profit: 5-10%
Notes: Higher threshold reduces false signals; captures major reversals
⚙️ Optimal Configuration Guide
Conservative (Lower Risk, Fewer Trades)
Lookback Period: 30-40
Entry Threshold: 2.0-2.5
Exit Threshold: 0.8-1.0
Stop Loss: 3-4%
Take Profit: 6-10%
Momentum Filter: ON
Balanced (Recommended Starting Point)
Lookback Period: 20-25
Entry Threshold: 1.5-1.8
Exit Threshold: 0.5-0.6
Stop Loss: 2-3%
Take Profit: 4-6%
Momentum Filter: OFF
Aggressive (Higher Risk, More Trades)
Lookback Period: 10-15
Entry Threshold: 1.0-1.2
Exit Threshold: 0.3-0.4
Stop Loss: 1-2%
Take Profit: 2-4%
Momentum Filter: OFF
💡 Pro Tips for Best Results
When the Strategy Works Best:
✅ Ranging markets with clear support/resistance
✅ High liquidity assets (major pairs, large-cap stocks)
✅ Normal market conditions (avoid during crashes or parabolic runs)
✅ Mean-reverting assets (avoid strong trending stocks)
When to Avoid:
❌ Strong trending markets (price won't revert)
❌ Low liquidity / low volume periods
❌ Major news events (earnings, FOMC, NFP)
❌ Market crashes or euphoria phases
Optimization Process:
Start with "Default" preset on your chosen timeframe
Backtest 6-12 months to see performance
Adjust Entry Threshold first (lower = more trades, higher = fewer but stronger signals)
Fine-tune Stop Loss/Take Profit based on average trade duration
Consider Momentum Filter if getting too many false signals
Key Metrics to Monitor:
Win Rate: Target 50-60% (mean reversion typically has moderate win rate)
Profit Factor: Aim for >1.5
Average Trade Duration: Should match your timeframe (scalping: minutes/hours, swing: days)
Max Drawdown: Keep under 20% of capital
📈 Quick Start Recommendation
For most traders, start here:
Timeframe: 1H or 4H
Preset: Default (Lookback 20, Threshold 1.5)
Stop Loss: 3%
Take Profit: 5%
Momentum Filter: OFF (turn ON if too many false entries)
Test on BTCUSD, EURUSD, or SPY first, then adapt to your preferred instruments!

VWAP + Multi-Timeframe RSI StrategyThis strategy combines VWAP trend direction with confirmation from RSI on a higher timeframe. The idea is to only take trades when both intraday momentum and higher-timeframe trend are aligned, increasing accuracy.
LONG Entry:
Price above VWAP (bullish environment).
RSI on the current timeframe is below overbought (room to rise).
RSI on the higher timeframe (default H1) is above 50 (bullish confirmation).
SHORT Entry:
Price below VWAP (bearish environment).
RSI on the current timeframe is above oversold (room to fall).
RSI on the higher timeframe is below 50 (bearish confirmation).
Exit Rule:
Stop-loss near VWAP.
Take-profit at ~2x risk or when major levels are reached.
Best Timeframes:
Use 15m or 30m chart with H1 RSI for intraday trading.
Use 1H chart with Daily RSI for swing trading.
⚡ The higher-timeframe RSI filter reduces false signals and aligns trades with institutional flow.

ORB + Session VWAP Pro (London & NY) — fixedORB + Session VWAP Pro (London & NY) — Listing copy (EN)
What it is
A clean, non-repainting intraday tool that fuses the classic Opening Range Breakout (ORB) with a session-anchored VWAP filter for London and New York. It highlights only the higher-quality breakouts (above/below session VWAP), adds an optional retest confirmation, and scores each signal with an intuitive Confidence metric (0–100).
Why it works
• ORB provides the day’s first actionable structure (range high/low).
• Session VWAP filters “cheap” breaks and favors flows aligned with session value.
• Optional retest reduces first-tick whipsaws.
• Confidence blends breakout depth (vs ATR), VWAP slope and band distance.
Key visuals
• LDN/NY OR High/Low (line break style) + optional OR boxes.
• Active Session VWAP (resets per signal window; falls back to daily VWAP outside).
• Optional VWAP bands (stdev or %).
• Session shading (London/NY windows).
• Signal markers (LDN BUY/SELL, NY BUY/SELL) fired with cooldown.
Signals
• London Long / Short: Break of LDN OR High/Low ± ATR buffer, aligned with VWAP side.
• NY Long / Short: Same logic during NY window.
• Retest (optional): Requires a tag back to the OR level ± tolerance before confirmation.
• Confidence: 0–100; gate via Min Confidence (default 55).
Inputs that matter
• Open Range Length (min): Default 15.
• London/NY times & timezones.
• ATR buffer & retest tolerance.
• Bands mode: Stdev (with lookback) or % (e.g., 1%).
• Signal cooldown: Avoids clutter on fast moves.
Non-repaint policy
• OR lines build within fixed time windows using the current bar’s timestamp.
• VWAP is cumulative within the session window; no lookahead.
• All ta.crossover/ta.crossunder are precomputed every bar (no conditional execution).
• Signals are based on live bar values, not future bars.
⸻
Quick start (examples)
1) EURUSD, London momentum
• Chart: 5m or 15m.
• OR: 15 min starting 08:00 Europe/London.
• Signals: Use defaults; keep ATR buffer = 0.2 and Retest = ON, Min Confidence ≥ 55.
• Play:
• BUY when price breaks LDN OR High + buffer and stays above VWAP; retest confirms.
• Trail behind VWAP or band #1; partials into band #2.
2) NAS100, New York breakout & run
• Chart: 5m.
• NY window: 09:30 America/New_York, OR = 15 min.
• Retest OFF on high momentum days; Min Confidence ≥ 60.
• Use band mode Stdev, bandLen=50, show ±1/±2.
• Momentum continuation: add on pullbacks that hold above VWAP after the breakout.
3) XAUUSD, London fake & VWAP fade
• Chart: 5m.
• Keep Retest ON; accept only shorts that break OR Low but retest fails back under VWAP.
• Confidence gate ≥ 50 to allow more mean-reversion setups.
⸻
Pro tips
• Adjust ATR buffer to the instrument: FX 0.15–0.25, indices 0.20–0.35, metals 0.20–0.30.
• Retest ON for choppy conditions; OFF for news momentum.
• Use VWAP bands: take partials at ±1; stretch targets at ±2/±3.
• Session timezones are explicit (London/New York). Ensure they match your instrument’s behavior.
• Pair with a higher-TF bias (e.g., 1H/4H trend) for directional filtering.
⸻
Alerts (ready to use)
• ORB+SVWAP — LDN Long, LDN Short, NY Long, NY Short
(Respect your cooldown; alerts fire only after confirmation and confidence gate.)
⸻
Known limits & notes
• Designed for intraday. On 1D+ charts, session windows compress.
• If your broker session differs from London/NY clocks on a holiday, adjust input times.
• Session-anchored VWAP uses the script’s signal window, not exchange sessions, by design.

DynamoSent DynamoSent Pro+ — Professional Listing (Preview)
— Adaptive Macro Sentiment (v6)
— Export, Adaptive Lookback, Confidence, Boxes, Heatmap + Dynamic OB/OS
Preview / Experimental build. I’m actively refining this tool—your feedback is gold.
If you spot edge cases, want new presets, or have market-specific ideas, please comment or DM me on TradingView.
⸻
What it is
DynamoSent Pro+ is an adaptive, non-repainting macro sentiment engine that compresses VIX, DXY and a price-based activity proxy (e.g., SPX/sector ETF/your symbol) into a 0–100 sentiment line. It scales context by volatility (ATR%) and can self-calibrate with rolling quantile OB/OS. On top of that, it adds confidence scoring, a plain-English Context Coach, MTF agreement, exportable sentiment for other indicators, and a clean Light/Dark UI.
Why it’s different
• Adaptive lookback tracks regime changes: when volatility rises, we lengthen context; when it falls, we shorten—less whipsaw, more relevance.
• Dynamic OB/OS (quantiles) self-calibrates to each instrument’s distribution—no arbitrary 30/70 lines.
• MTF agreement + Confidence gate reduce false positives by highlighting alignment across timeframes.
• Exportable output: hidden plot “DynamoSent Export” can be selected as input.source in your other Pine scripts.
• Non-repainting rigor: all request.security() calls use lookahead_off + gaps_on; signals wait for bar close.
Key visuals
• Sentiment line (0–100), OB/OS zones (static or dynamic), optional TF1/TF2 overlays.
• Regime boxes (Overbought / Oversold / Neutral) that update live without repaint.
• Info Panel with confidence heat, regime, trend arrow, MTF readout, and Coach sentence.
• Session heat (Asia/EU/US) to match intraday behavior.
• Light/Dark theme switch in Inputs (auto-contrasted labels & headers).
⸻
How to use (examples & recipes)
1) EURUSD (swing / intraday blend)
• Preset: EURUSD 1H Swing
• Chart: 1H; TF1=1H, TF2=4H (default).
• Proxies: Defaults work (VIX=D, DXY=60, Proxy=D).
• Dynamic OB/OS: ON at 20/80; Confidence ≥ 55–60.
• Playbook:
• When sentiment crosses above 50 + margin with Δ ≥ signalK and MTF agreement ≥ 0.5, treat as trend breakout.
• In Oversold with rising Coach & TF agreement, take fade longs back toward mid-range.
• Alerts: Enable Breakout Long/Short and Fade; keep cooldown 8–12 bars.
2) SPY (daytrading)
• Preset: SPY 15m Daytrade; Chart: 15m.
• VIX (D) matters more; preset weights already favor it.
• Start with static 30/70; later try dynamic 25/75 for adaptive thresholds.
• Use Coach: in US session, when it says “Overbought + MTF agree → sell rallies / chase breakouts”, lean momentum-continuation after pullbacks.
3) BTCUSD (crypto, 24/7)
• Preset: BTCUSD 1H; Chart: 1H.
• DXY and BTC.D inform macro tone; keep Carry-forward ON to bridge sparse ticks.
• Prefer Dynamic OB/OS (15/85) for wider swings.
• Fade signals on weekend chop; Breakout when Confidence > 60 and MTF ≥ 1.0.
4) XAUUSD (gold, macro blend)
• Preset: XAUUSD 4H; Chart: 4H.
• Weights tilt to DXY and US10Y (handled by preset).
• Coach + MTF helps separate trend legs from news pops.
⸻
Best practices
• Theme: Switch Light/Dark in Inputs; the panel adapts contrast automatically.
• Export: In another script → Source → DynamoSent Pro+ → DynamoSent Export. Build your own filters/strategies atop the same sentiment.
• Dynamic vs Static OB/OS:
• Static 30/70: fast, universal baseline.
• Dynamic (quantiles): instrument-aware; use 20/80 (default) or 15/85 for choppy markets.
• Confidence gate: Start at 50–60% to filter noise; raise when you want only A-grade setups.
• Adaptive Lookback: Keep ON. For ultra-liquid indices, you can switch it OFF and set a fixed lookback.
⸻
Non-repainting & safety notes
• All request.security() calls use lookahead=barmerge.lookahead_off and gaps=barmerge.gaps_on.
• No forward references; signals & regime flips are confirmed on bar close.
• History-dependent funcs (ta.change, ta.percentile_linear_interpolation, etc.) are computed each bar (not conditionally).
• Adaptive lookback is clamped ≥ 1 to avoid lowest/highest errors.
• Missing-data warning triggers only when all proxies are NA for a streak; carry-forward can bridge small gaps without repaint.
⸻
Known limits & tips
• If a proxy symbol isn’t available on your plan/exchange, you’ll see the NA warning: choose a different symbol via Symbol Search, or keep Carry-forward ON (it defaults to neutral where needed).
• Intraday VIX is sparse—using Daily is intentional.
• Dynamic OB/OS needs enough history (see dynLenFloor). On short histories it gracefully falls back to static levels.
Thanks for trying the preview. Your comments drive the roadmap—presets, new proxies, extra alerts, and integrations.

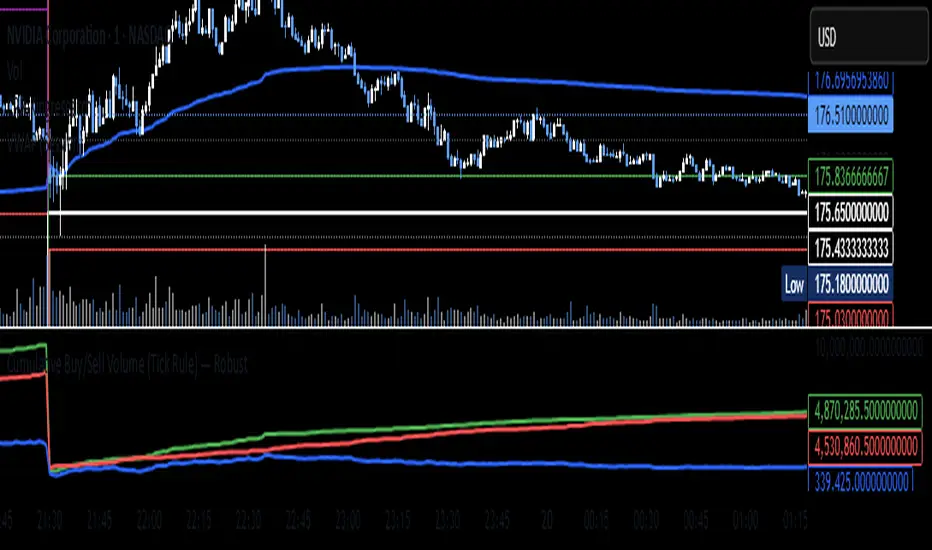
Cumulative Buy/Sell Volume (Tick Rule) — Robust//@version=5
indicator("Cumulative Buy/Sell Volume (Tick Rule) — Robust", overlay=false)
// ------- User inputs -------
resetDaily = input.bool(true, "Reset cumulative at new day/session")
showBarHist = input.bool(false, "Show per-bar buy/sell histogram")
useHalfOnEqual = input.bool(true, "Split volume 50/50 when price unchanged")
// ------- Safe previous close and volume -------
prevClose = nz(close , close) // avoid na on first bar
vol = float(volume)
// ------- Classification (Tick Rule approximation) -------
buyVol = close > prevClose ? vol : (close < prevClose ? 0.0 : (useHalfOnEqual ? vol * 0.5 : 0.0))
sellVol = close < prevClose ? vol : (close > prevClose ? 0.0 : (useHalfOnEqual ? vol * 0.5 : 0.0))
// ------- Cumulative totals (with optional daily reset) -------
var float cumBuy = 0.0
var float cumSell = 0.0
newDay = time("D") != time("D")
if resetDaily and newDay
cumBuy := 0.0
cumSell := 0.0
cumBuy := cumBuy + buyVol
cumSell := cumSell + sellVol
cumDelta = cumBuy - cumSell
// ------- Plots -------
plot(cumBuy, title="Cumulative Buy Volume", color=color.green, linewidth=2)
plot(cumSell, title="Cumulative Sell Volume", color=color.red, linewidth=2)
plot(cumDelta, title="Cumulative Delta (Buy - Sell)", color=color.blue, linewidth=2)
// optional: per-bar histograms
plot(showBarHist ? buyVol : na, style=plot.style_columns, title="Bar Buy Vol", color=color.new(color.green, 60))
plot(showBarHist ? sellVol : na, style=plot.style_columns, title="Bar Sell Vol", color=color.new(color.red, 60))
Supertrend DashboardOverview
This dashboard is a multi-timeframe technical indicator dashboard based on Supertrend. It combines:
Trend detection via Supertrend
Momentum via RSI and OBV (volume)
Volatility via a basic candle-based metric (bs)
Trend strength via ADX
Multi-timeframe analysis to see whether the trend is bullish across different timeframes
It then displays this info in a table on the chart with colors for quick visual interpretation.
2️⃣ Inputs
Dashboard settings:
enableDashboard: Toggle the dashboard on/off
locationDashboard: Where the table appears (Top right, Bottom left, etc.)
sizeDashboard: Text size in the table
strategyName: Custom name for the strategy
Indicator settings:
factor (Supertrend factor): Controls how far the Supertrend lines are from price
atrLength: ATR period for Supertrend calculation
rsiLength: Period for RSI calculation
Visual settings:
colorBackground, colorFrame, colorBorder: Control dashboard style
3️⃣ Core Calculations
a) Supertrend
Supertrend is a trend-following indicator that generates bullish or bearish signals.
Logic:
Compute ATR (atr = ta.atr(atrLength))
Compute preliminary bands:
upperBand = src + factor * atr
lowerBand = src - factor * atr
Smooth bands to avoid false flips:
lowerBand := lowerBand > prevLower or close < prevLower ? lowerBand : prevLower
upperBand := upperBand < prevUpper or close > prevUpper ? upperBand : prevUpper
Determine direction (bullish / bearish):
dir = 1 → bullish
dir = -1 → bearish
Supertrend line = lowerBand if bullish, upperBand if bearish
Output:
st → line to plot
bull → boolean (true = bullish)
b) Buy / Sell Trigger
Logic:
bull = ta.crossover(close, supertrend) → close crosses above Supertrend → buy signal
bear = ta.crossunder(close, supertrend) → close crosses below Supertrend → sell signal
trigger → checks which signal was most recent:
trigger = ta.barssince(bull) < ta.barssince(bear) ? 1 : 0
1 → Buy
0 → Sell
c) RSI (Momentum)
rsi = ta.rsi(close, rsiLength)
Logic:
RSI > 50 → bullish
RSI < 50 → bearish
d) OBV / Volume Trend (vosc)
OBV tracks whether volume is pushing price up or down.
Manual calculation (safe for all Pine versions):
obv = ta.cum( math.sign( nz(ta.change(close), 0) ) * volume )
vosc = obv - ta.ema(obv, 20)
Logic:
vosc > 0 → bullish
vosc < 0 → bearish
e) Volatility (bs)
Measures how “volatile” the current candle is:
bs = ta.ema(math.abs((open - close) / math.max(high - low, syminfo.mintick) * 100), 3)
Higher % → stronger candle moves
Displayed on dashboard as a number
f) ADX (Trend Strength)
= ta.dmi(14, 14)
Logic:
adx > 20 → Trending
adx < 20 → Ranging
g) Multi-Timeframe Supertrend
Timeframes: 1m, 3m, 5m, 10m, 15m, 30m, 1H, 2H, 4H, 12H, 1D
Logic:
for tf in timeframes
= request.security(syminfo.tickerid, tf, f_supertrend(ohlc4, factor, atrLength))
array.push(tf_bulls, bull_tf ? 1.0 : 0.0)
bull_tf ? 1.0 : 0.0 → converts boolean to number
Then we calculate user rating:
userRating = (sum of bullish timeframes / total timeframes) * 10
0 → Strong Sell, 10 → Strong Buy
4️⃣ Dashboard Table Layout
Row Column 0 (Label) Column 1 (Value)
0 Strategy strategyName
1 Technical Rating textFromRating(userRating) (color-coded)
2 Current Signal Buy / Sell (based on last Supertrend crossover)
3 Current Trend Bullish / Bearish (based on Supertrend)
4 Trend Strength bs %
5 Volume vosc → Bullish/Bearish
6 Volatility adx → Trending/Ranging
7 Momentum RSI → Bullish/Bearish
8 Timeframe Trends 📶 Merged cell
9-19 1m → Daily Bullish/Bearish for each timeframe (green/red)
5️⃣ Color Logic
Green shades → bullish / trending / buy
Red / orange → bearish / weak / sell
Yellow → neutral / ranging
Example:
dashboard_cell_bg(1, 1, colorFromRating(userRating))
dashboard_cell_bg(1, 2, trigger ? color.green : color.red)
dashboard_cell_bg(1, 3, superBull ? color.green : color.red)
Makes the dashboard visually intuitive
6️⃣ Key Logic Flow
Calculate Supertrend on current timeframe
Detect buy/sell triggers based on crossover
Calculate RSI, OBV, Volatility, ADX
Request Supertrend on multiple timeframes → convert to 1/0
Compute user rating (percentage of bullish timeframes)
Populate dashboard table with colors and values
✅ The result: You get a compact, fast, multi-timeframe trend dashboard that shows:
Current signal (Buy/Sell)
Current trend (Bullish/Bearish)
Momentum, volatility, and volume cues
Trend across multiple timeframes
Overall technical rating
It’s essentially a full trend-strength scanner directly on your chart.
