Machine Learning: Optimal RSI [YinYangAlgorithms]This Indicator, will rate multiple different lengths of RSIs to determine which RSI to RSI MA cross produced the highest profit within the lookback span. This ‘Optimal RSI’ is then passed back, and if toggled will then be thrown into a Machine Learning calculation. You have the option to Filter RSI and RSI MA’s within the Machine Learning calculation. What this does is, only other Optimal RSI’s which are in the same bullish or bearish direction (is the RSI above or below the RSI MA) will be added to the calculation.
You can either (by default) use a Simple Average; which is essentially just a Mean of all the Optimal RSI’s with a length of Machine Learning. Or, you can opt to use a k-Nearest Neighbour (KNN) calculation which takes a Fast and Slow Speed. We essentially turn the Optimal RSI into a MA with different lengths and then compare the distance between the two within our KNN Function.
RSI may very well be one of the most used Indicators for identifying crucial Overbought and Oversold locations. Not only that but when it crosses its Moving Average (MA) line it may also indicate good locations to Buy and Sell. Many traders simply use the RSI with the standard length (14), however, does that mean this is the best length?
By using the length of the top performing RSI and then applying some Machine Learning logic to it, we hope to create what may be a more accurate, smooth, optimal, RSI.
Tutorial:
This is a pretty zoomed out Perspective of what the Indicator looks like with its default settings (except with Bollinger Bands and Signals disabled). If you look at the Tables above, you’ll notice, currently the Top Performing RSI Length is 13 with an Optimal Profit % of: 1.00054973. On its default settings, what it does is Scan X amount of RSI Lengths and checks for when the RSI and RSI MA cross each other. It then records the profitability of each cross to identify which length produced the overall highest crossing profitability. Whichever length produces the highest profit is then the RSI length that is used in the plots, until another length takes its place. This may result in what we deem to be the ‘Optimal RSI’ as it is an adaptive RSI which changes based on performance.
In our next example, we changed the ‘Optimal RSI Type’ from ‘All Crossings’ to ‘Extremity Crossings’. If you compare the last two examples to each other, you’ll notice some similarities, but overall they’re quite different. The reason why is, the Optimal RSI is calculated differently. When using ‘All Crossings’ everytime the RSI and RSI MA cross, we evaluate it for profit (short and long). However, with ‘Extremity Crossings’, we only evaluate it when the RSI crosses over the RSI MA and RSI <= 40 or RSI crosses under the RSI MA and RSI >= 60. We conclude the crossing when it crosses back on its opposite of the extremity, and that is how it finds its Optimal RSI.
The way we determine the Optimal RSI is crucial to calculating which length is currently optimal.
In this next example we have zoomed in a bit, and have the full default settings on. Now we have signals (which you can set alerts for), for when the RSI and RSI MA cross (green is bullish and red is bearish). We also have our Optimal RSI Bollinger Bands enabled here too. These bands allow you to see where there may be Support and Resistance within the RSI at levels that aren’t static; such as 30 and 70. The length the RSI Bollinger Bands use is the Optimal RSI Length, allowing it to likewise change in correlation to the Optimal RSI.
In the example above, we’ve zoomed out as far as the Optimal RSI Bollinger Bands go. You’ll notice, the Bollinger Bands may act as Support and Resistance locations within and outside of the RSI Mid zone (30-70). In the next example we will highlight these areas so they may be easier to see.
Circled above, you may see how many times the Optimal RSI faced Support and Resistance locations on the Bollinger Bands. These Bollinger Bands may give a second location for Support and Resistance. The key Support and Resistance may still be the 30/50/70, however the Bollinger Bands allows us to have a more adaptive, moving form of Support and Resistance. This helps to show where it may ‘bounce’ if it surpasses any of the static levels (30/50/70).
Due to the fact that this Indicator may take a long time to execute and it can throw errors for such, we have added a Setting called: Adjust Optimal RSI Lookback and RSI Count. This settings will automatically modify the Optimal RSI Lookback Length and the RSI Count based on the Time Frame you are on and the Bar Indexes that are within. For instance, if we switch to the 1 Hour Time Frame, it will adjust the length from 200->90 and RSI Count from 30->20. If this wasn’t adjusted, the Indicator would Timeout.
You may however, change the Setting ‘Adjust Optimal RSI Lookback and RSI Count’ to ‘Manual’ from ‘Auto’. This will give you control over the ‘Optimal RSI Lookback Length’ and ‘RSI Count’ within the Settings. Please note, it will likely take some “fine tuning” to find working settings without the Indicator timing out, but there are definitely times you can find better settings than our ‘Auto’ will create; especially on higher Time Frames. The Minimum our ‘Auto’ will create is:
Optimal RSI Lookback Length: 90
RSI Count: 20
The Maximum it will create is:
Optimal RSI Lookback Length: 200
RSI Count: 30
If there isn’t much bar index history, for instance, if you’re on the 1 Day and the pair is BTC/USDT you’ll get < 4000 Bar Indexes worth of data. For this reason it is possible to manually increase the settings to say:
Optimal RSI Lookback Length: 500
RSI Count: 50
But, please note, if you make it too high, it may also lead to inaccuracies.
We will conclude our Tutorial here, hopefully this has given you some insight as to how calculating our Optimal RSI and then using it within Machine Learning may create a more adaptive RSI.
Settings:
Optimal RSI:
Show Crossing Signals: Display signals where the RSI and RSI Cross.
Show Tables: Display Information Tables to show information like, Optimal RSI Length, Best Profit, New Optimal RSI Lookback Length and New RSI Count.
Show Bollinger Bands: Show RSI Bollinger Bands. These bands work like the TDI Indicator, except its length changes as it uses the current RSI Optimal Length.
Optimal RSI Type: This is how we calculate our Optimal RSI. Do we use all RSI and RSI MA Crossings or just when it crosses within the Extremities.
Adjust Optimal RSI Lookback and RSI Count: Auto means the script will automatically adjust the Optimal RSI Lookback Length and RSI Count based on the current Time Frame and Bar Index's on chart. This will attempt to stop the script from 'Taking too long to Execute'. Manual means you have full control of the Optimal RSI Lookback Length and RSI Count.
Optimal RSI Lookback Length: How far back are we looking to see which RSI length is optimal? Please note the more bars the lower this needs to be. For instance with BTC/USDT you can use 500 here on 1D but only 200 for 15 Minutes; otherwise it will timeout.
RSI Count: How many lengths are we checking? For instance, if our 'RSI Minimum Length' is 4 and this is 30, the valid RSI lengths we check is 4-34.
RSI Minimum Length: What is the RSI length we start our scans at? We are capped with RSI Count otherwise it will cause the Indicator to timeout, so we don't want to waste any processing power on irrelevant lengths.
RSI MA Length: What length are we using to calculate the optimal RSI cross' and likewise plot our RSI MA with?
Extremity Crossings RSI Backup Length: When there is no Optimal RSI (if using Extremity Crossings), which RSI should we use instead?
Machine Learning:
Use Rational Quadratics: Rationalizing our Close may be beneficial for usage within ML calculations.
Filter RSI and RSI MA: Should we filter the RSI's before usage in ML calculations? Essentially should we only use RSI data that are of the same type as our Optimal RSI? For instance if our Optimal RSI is Bullish (RSI > RSI MA), should we only use ML RSI's that are likewise bullish?
Machine Learning Type: Are we using a Simple ML Average, KNN Mean Average, KNN Exponential Average or None?
KNN Distance Type: We need to check if distance is within the KNN Min/Max distance, which distance checks are we using.
Machine Learning Length: How far back is our Machine Learning going to keep data for.
k-Nearest Neighbour (KNN) Length: How many k-Nearest Neighbours will we account for?
Fast ML Data Length: What is our Fast ML Length? This is used with our Slow Length to create our KNN Distance.
Slow ML Data Length: What is our Slow ML Length? This is used with our Fast Length to create our KNN Distance.
If you have any questions, comments, ideas or concerns please don't hesitate to contact us.
HAPPY TRADING!
In den Scripts nach "信达股份40周年" suchen

Scoopy StacksWaffle Around Multiple
(Open, High, Low, Close) Stacks On
Pre/Post Market & (Daily, Weekly,
Monthly, Yearly) Sessions With
Meticulous Columns, Rows, Tooltips,
Colors, Custom Ideas, and Alerts.
Sessions Use Two Step Incremental Values
Default Value: (1) Shows Two Previous
(O, H, L, C); Increasing Value Swaps
Sessions With Next Two Stacks.
⬛️ KEY WORDS:
🟢 Crossover | 🔴 Crossunder
📗 High | 📕 Low
📔 Open | 📓 Close
🥇 First Idea | 🥈 Second Idea
🥉 Third Idea | 🎖️ Fourth Idea
🟥 ALERTS:
Default Option: (Per Bar)
Alerts Once Conditions Are Met
(Bar Close) Alerts When Bar Closes
Default Option: (Reg)
Alerts During Regular Market
Trading Hours, (0930-1600)
(Ext) Alerts During Extended
Market Hours, (1600-0930)
(24/7) Alerts All Day
Optional Preferences:
Regular Alerts - Stocks
Extended Alerts - Futures
24/7 Alerts - Crypto
🟧 STACKS:
Default Value: (1)
Incremental Stack Value, Increasing Value
Swaps Sessions With the Next Two Stacks
(✓) Swap Stacks?
Pre/Post Market High/Lows,
1-2 Day High/Lows, 1-2 Week High/Lows,
1-2 Month High/Lows, 1-2 Year High/Lows
( ) Swap Stacks?
Pre/Post Market Open/Close,
1-2 Day Open/Close, 1-2 Week Open/Close,
1-2 Month Open/Close, 1-2 Year Open/Close
🟨 EXAMPLES:
Default Stack:
🟢 | 📗 Pre Market High (PRE) | 4600.00
🔴 | 📕 Post Market Low (POST) | 420.00
Optional: (Open)
🟢 | 📔 Post Market Open (POST) | 4400.00
Optional: (Close)
🔴 | 📓 Pre Market Close (PRE) | 430.00
Default Stack Value: (1)
🔴 | 📗 1 Day High (1DH) | 460.00
Next Stack Value: (3)
🟢 | 📕 4 Day Low (4DL) | 420.00
Optional: (Open)
🔴 | 📔 2 Day Open (2DO) | 440.00
Optional: (Close)
🟢 | 📓 3 Day Close (3DC) | 430.00
Default Stack Value: (5)
🟢 | 📗 5 Week High (5WH) | 460.00
Next Stack Value: (7)
🔴 | 📕 8 Week Low (8WL) | 420.00
Optional: (Open)
🔴 | 📔 7 Week Open (7WO) | 4400.00
Optional: (Close)
🟢 | 📓 6 Week Close (6WC) | 430.00
Default Stack Value: (9)
🔴 | 📗 9 Month High (9MH) | 460.00
Next Stack Value: (11)
🟢 | 📕 12 Month Low (12ML) | 420.00
Optional: (Open)
🟢 | 📔 11 Month Open (11MO) | 4400.00
Optional: (Close)
🔴 | 📓 10 Month Close (10MC) | 430.00
Default Stack Value: (13)
🟢 | 📗 13 Year High (13YH) | 460.00
Next Stack Value: (15)
🟢 | 📕 16 Year Low (16YL) | 420.00
Optional: (Open)
🔴 | 📔 15 Year Open (15YO) | 4400.00
Optional: (Close)
🔴 | 📓 14 Year Close (14YC) | 430.00
🟩 TABLES:
Default Value: (1)
Moves Table Up, Down, Left, or Right
Based on Second Default Value
First Default Value: (Top Right)
Sets Table Placement, Middle Center
Allows Table To Move In All Directions
Second Default Value: (Default)
Fixed Table Position, Switching Values
Moves Direction of the Table
🟦 IDEAS:
(✓) Show Ideas?
Shows Four Ideas With Custom Texts
and Values; Ideas Are Based Around
Post-It Note Reminders with Alerts
Suggestions For Text Ideas:
Take Profit, Stop Loss, Trim, Hold,
Long, Short, Bounce Spot, Retest,
Chop, Support, Resistance, Buy, Sell
🟪 EXAMPLES:
Default Value: (5)
Shows the Custom Table Value For
Sorted Table Positions and Alerts
Default Text: (🥇)
Shown On First Table Cell and
Message Appearing On Alerts
Alert Shows: 🟢 | 🥇 | 5.00
Default Value: (10)
Shows the Custom Table Value For
Sorted Table Positions and Alerts
Default Text: (🥈)
Shown On Second Table Cell and
Message Appearing On Alerts
Alert Shows: 🔴 | 🥈 | 10.00
Default Value: (50)
Shows the Custom Table Value For
Sorted Table Positions and Alerts
Default Text: (🥉)
Shown On Third Table Cell and
Message Appearing On Alerts
Alert Shows: 🟢 | 🥉 | 50.00
Default Value: (100)
Shows the Custom Table Value For
Sorted Table Positions and Alerts
Default Text: (🎖️)
Shown On Fourth Table Cell and
Message Appearing On Alerts
Alert Shows: 🔴 | 🎖️ | 100.00
⬛️ REFERENCES:
Pre-market Highs & Lows on regular
trading hours (RTH) chart
By Twingall
Previous Day Week Highs & Lows
By Sbtnc
Screener for 40+ instruments
By QuantNomad
Daily Weekly Monthly Yearly Opens
By Meliksah55

Ribbit RangesBounce Around Multiple
(Open, High, Low, Close) Ranges
On Pre/Post Market & (Daily, Weekly,
Monthly, Yearly) Sessions With
Meticulous Lines, Labels, Tooltips,
Colors, Custom Ideas, and Alerts.
Sessions Use Two Step Incremental Values
Default Value: (1) Shows Two Previous
(O, H, L, C); Increasing Value Swaps
Sessions With Next Two Ranges.
⬛️ KEY WORDS:
🟢 Crossover | 🔴 Crossunder
📗 High | 📕 Low
📔 Open | 📓 Close
🥇 First Idea | 🥈 Second Idea
🥉 Third Idea | 🎖️ Fourth Idea
🟥 ALERTS:
Default Option: (Per Bar)
Alerts Once Conditions Are Met
(Bar Close) Alerts When Bar Closes
Default Option: (Reg)
Alerts During Regular Market
Trading Hours, (0930-1600)
(Ext) Alerts During Extended
Market Hours, (1600-0930)
(24/7) Alerts All Day
Optional Preferences:
Regular Alerts - Stocks
Extended Alerts - Futures
24/7 Alerts - Crypto
🟧 RANGES:
Default Value: (1)
Incremental Range Value, Increasing Value
Swaps Sessions With the Next Two Ranges
(✓) Swap Ranges?
Pre/Post Market High/Lows,
1-2 Day High/Lows, 1-2 Week High/Lows,
1-2 Month High/Lows, 1-2 Year High/Lows
( ) Swap Ranges?
Pre/Post Market Open/Close,
1-2 Day Open/Close, 1-2 Week Open/Close,
1-2 Month Open/Close, 1-2 Year Open/Close
🟨 EXAMPLES:
Default Range:
🟢 | 📗 Pre Market High (PRE) | 4600.00
🔴 | 📕 Post Market Low (POST) | 420.00
Optional: (Open)
🟢 | 📔 Post Market Open (POST) | 4400.00
Optional: (Close)
🔴 | 📓 Pre Market Close (PRE) | 430.00
Default Range Value: (1)
🔴 | 📗 1 Day High (1DH) | 460.00
Next Range Value: (3)
🟢 | 📕 4 Day Low (4DL) | 420.00
Optional: (Open)
🔴 | 📔 2 Day Open (2DO) | 440.00
Optional: (Close)
🟢 | 📓 3 Day Close (3DC) | 430.00
Default Range Value: (5)
🟢 | 📗 5 Week High (5WH) | 460.00
Next Range Value: (7)
🔴 | 📕 8 Week Low (8WL) | 420.00
Optional: (Open)
🔴 | 📔 7 Week Open (7WO) | 4400.00
Optional: (Close)
🟢 | 📓 6 Week Close (6WC) | 430.00
Default Range Value: (9)
🔴 | 📗 9 Month High (9MH) | 460.00
Next Range Value: (11)
🟢 | 📕 12 Month Low (12ML) | 420.00
Optional: (Open)
🟢 | 📔 11 Month Open (11MO) | 4400.00
Optional: (Close)
🔴 | 📓 10 Month Close (10MC) | 430.00
Default Range Value: (13)
🟢 | 📗 13 Year High (13YH) | 460.00
Next Range Value: (15)
🟢 | 📕 16 Year Low (16YL) | 420.00
Optional: (Open)
🔴 | 📔 15 Year Open (15YO) | 4400.00
Optional: (Close)
🔴 | 📓 14 Year Close (14YC) | 430.00
🟩 COLORS:
(✓) Swap Colors?
Text Color Is Shown Using
Background Color
( ) Swap Colors?
Background Color Is Shown
Using Text Color
🟦 IDEAS:
(✓) Show Ideas?
Plots Four Ideas With Custom Lines
and Labels; Ideas Are Based Around
Post-It Note Reminders with Alerts
Suggestions For Text Ideas:
Take Profit, Stop Loss, Trim, Hold,
Long, Short, Bounce Spot, Retest,
Chop, Support, Resistance, Buy, Sell
🟪 EXAMPLES:
Default Value: (5)
Shows the Custom Value For
Lines, Labels, and Alerts
Default Text: (🥇)
Shown On First Label and
Message Appearing On Alerts
Alert Shows: 🟢 | 🥇 | 5.00
Default Value: (10)
Shows the Custom Value For
Lines, Labels, and Alerts
Default Text: (🥈)
Shown On Second Label and
Message Appearing On Alerts
Alert Shows: 🔴 | 🥈 | 10.00
Default Value: (50)
Shows the Custom Value For
Lines, Labels, and Alerts
Default Text: (🥉)
Shown On Third Label and
Message Appearing On Alerts
Alert Shows: 🟢 | 🥉 | 50.00
Default Value: (100)
Shows the Custom Value For
Lines, Labels, and Alerts
Default Text: (🎖️)
Shown On Fourth Label and
Message Appearing On Alerts
Alert Shows: 🔴 | 🎖️ | 100.00
⬛️ REFERENCES:
Pre-market Highs & Lows on regular
trading hours (RTH) chart
By Twingall
Previous Day Week Highs & Lows
By Sbtnc
Screener for 40+ instruments
By QuantNomad
Daily Weekly Monthly Yearly Opens
By Meliksah55

Market Internals (TICK, ADD, VOLD, TRIN, VIX)OVERVIEW
This script allows you to perform data transformations on Market Internals, across exchanges, and specify signal parameters, to more easily identify sentiment extremes.
Notable transformations include:
1. Cumulative session values
2. Directional bull-bear Ratios and Percent Differences
3. Data Normalization
4. Noise Reduction
This kind of data interaction is very useful for understanding the relationship between two mutually exclusive metrics, which is the essence of Market Internals: Up vs. Down. Even so, they are not possible with symbol expressions alone. And the kind of symbol expression needed to produce baseline data that can be reliably transformed is opaque to most traders, made worse by the fact that prerequisite symbol expressions themselves are not uniform across symbols. It's very nuanced, and if this last bit was confusing … exactly.
All this to say, rather than forcing that burden onto you, I've baked the baseline symbol expressions into the indicator so: 1) the transform functions consistently ingest the baseline data in the correct format and 2) you don't have to spend time trying to figure it all out. Trading is hard. There's no need to make it harder.
INPUTS
Indicator
Allows you to specify the base Market Internal and Exchange data to use. The list of Market Internals is simplified to their fundamental representation (TICK, ADD, VOLD, TRIN, VIX, ABVD, TKCD), and the list of Exchange data is limited to the most common (NYSE, NASDAQ, All US Stocks). There are also options for basic exchange combinations (Sum or Average of NYSE & NASDAQ).
Mode
Short for "Plot Mode", this is where you specify the bars style (Candles, Bars, Line, Circles, Columns) and the source value (used for single value plots and plot color changes).
Scale
This is the first and second data transformation grouped together. The default is to show the origin data as it might appear on a chart. You can then specify if each bar should retain it's unique value (Bar Value) or be added to a running total (Cumulative). You can also specify if you would like the data to remain unaltered (Raw) or converted to a directional ratio (Ratio) or a percentage (Percent Diff). These options determine the scale of the plot.
Both Ratio and Percent Diff. convert a given symbol into a positive or negative number, where positive numbers are bullish and negative numbers are bearish.
Ratio will divide Bull values by Bear values, then further divide -1 by the quotient if it is less than 1. For example, if "0.5" was the quotient, the Ratio would be "-2".
Percent Diff. subtracts Bear values from Bull values, then divides that difference by the sum of Bull and Bear values multiplied by 100. If a Bull value was "3" and Bear value was "7", the difference would be "-4", the sum would be "10", and the Percent Diff. would be "-40", as the difference is both bearish and 40% of total.
Ratio Norm. Threshold
This is the third data transformation . While quotients can be less than 1, directional ratios are never less than 1. This can lead to barcode-like artifacts as plots transition between positive and negative values, visually suggesting the change is much larger than it actually is. Normalizing the data can resolve this artifact, but undermines the utility of ratios. If, however, only some of the data is normalized, the artifact can be resolved without jeopardizing its contextual usefulness.
The utility of ratios is how quickly they communicate proportional differences. For example, if one side is twice as big as the other, "2" communicates this efficiently. This necessarily means the numerical value of ratios is worth preserving. Also, below a certain threshold, the utility of ratios is diminished. For example, an equal distribution being represented as 0, 1, 1:1, 50/50, etc. are all equally useful. Thus, there is a threshold, above which we want values to be exact, and below which the utility of linear visual continuity is more important. This setting accounts for that threshold.
When this setting is enabled, a ratio will be normalized to 0 when 1:1, scaled linearly toward the specified threshold when greater than 1:1, and then retain its exact value when the threshold is crossed. For example, with a threshold of "2", 1:1 = 0, 1.5:1 = 1, 2:1 = 2, 3:1 = 3, etc.
With all this in mind, most traders will want to set the ratios threshold at a level where accuracy becomes more important than visual continuity. If this level is unknown, "2" is a good baseline.
Reset cumulative total with each new session
Cumulative totals can be retained indefinitely or be reset each session. When enabled, each session has its own cumulative total. When disabled, the cumulative total is maintained indefinitely.
Show Signal Ranges
Because everything in this script is designed to make identifying sentiment extremes easier, an obvious inclusion would be to not only display ranges that are considered extreme for each Market Internal, but to also change the color of the plot when it is within, or beyond, that range. That is exactly what this setting does.
Override Max & Min
While the min-max signal levels have reasonable defaults for each symbol and transformation type, the Override Max and Override Min options allow you to … (wait for it) … override the max … and min … signal levels. This may be useful should you find a different level to be more suitable for your exact configuration.
Reduce Noise
This is the fourth data transformation . While the previous Ratio Norm. Threshold linearly stretches values between a threshold and 0, this setting will exponentially squash values closer to 0 if below the lower signal level.
The purpose of this is to compress data below the signal range, then amplify it as it approaches the signal level. If we are trying to identify extremes (the signal), minimizing values that are not extreme (the noise) can help us visually focus on what matters.
Always keep both signal zones visible
Some traders like to zoom in close to the bars. Others prefer to keep a wider focus. For those that like to zoom in, if both signals were always visible, the bar values can appear squashed and difficult to discern. For those that keep a wider focus, if both signals were not always visible, it's possible to lose context if a signal zone is vertically beyond the pane. This setting allows you to decide which scenario is best for you.
Plot Colors
These define the default color, within signal color, and beyond signal color for Bullish and Bearish directions.
Plot colors should be relative to zero
When enabled, the plot will inherit Bullish colors when above zero and Bearish colors when below zero. When disabled and Directional Colors are enabled (below), the plot will inherit the default Bullish color when rising, and the default Bearish color when falling. Otherwise, the plot will use the default Bullish color for all directions.
Directional colors
When the plot colors should be relative to zero (above), this changes the opacity of a bars color if moving toward zero, where "100" percent is the full value of the original color and "0" is transparent. When the plot colors are NOT relative to zero, the plot will inherit Bullish colors when rising and Bearish colors when falling.
Differentiate RTH from ETH
Market Internal data is typically only available during regular trading hours. When this setting is enabled, the background color of the indicator will change as a reminder that data is not available outside regular trading hours (RTH), if the chart is showing electronic trading hours (ETH).
Show zero line
Similar to always keeping signal zones visible (further up), some traders prefer zooming in while others prefer a wider context. This setting allows you to specify the visibility of the zero line to best suit your trading style.
Linear Regression
Polynomial regressions are great for capturing non-linear patterns in data. TradingView offers a "linear regression curve", which this script is using as a substitute. If you're unfamiliar with either term, think of this like a better moving average.
Symbol
While the Market Internal symbol will display in the status line of the indicator, the status line can be small and require more than a quick glance to read properly. Enabling this setting allows you to specify if / where / how the symbol should display on the indicator to make distinguishing between Market Internals more efficient.
Speaking of symbols, this indicator is designed for, and limited to, the following …
TICK - The TICK subtracts the total number of stocks making a downtick from the total number of stocks making an uptick.
ADD - The Advance Decline Difference subtracts the total number of stocks below yesterdays close from the total number of stocks above yesterdays close.
VOLD - The Volume Difference subtracts the total declining volume from the total advancing volume.
TRIN - The Arms Index (aka. Trading Index) divides the ratio of Advancing Stocks / Volume by the ratio of Declining Stocks / Volume. Given the inverse correlation of this index to market movement, when transforming it to a Ratio or Percent Diff., its values are inverted to preserve the bull-bear sentiment of the transformations.
VIX - The CBOE Volatility Index is derived from SPX index option prices, generating a 30-day forward projection of volatility. Given the inverse correlation of this index to market movement, when transforming it to a Ratio or Percent Diff., its values are inverted and normalized to the sessions first bar to preserve the bull-bear sentiment of the transformations. Note: If you do not have a Cboe CGIF subscription , VIX data will be delayed and plot unexpectedly.
ABVD - The Above VWAP Difference is an unofficial index measuring all stocks above VWAP as a percent difference. For the purposes of this indicator (and brevity), TradingViews PCTABOVEVWAP has has been shortened to simply be ABVD.
TKCD - The Tick Cumulative Difference is an unofficial index that subtracts the total number of market downticks from the total number of market upticks. Where "the TICK" (further up) is a measurement of stocks ticking up and down, TKCD is a measurement of the ticks themselves. For the purposes of this indicator (and brevity), TradingViews UPTKS and DNTKS symbols have been shorted to simply be TKCD.
INSPIRATION
I recently made an indicator automatically identifying / drawing daily percentage levels , based on 4 assumptions. One of these assumptions is about trend days. While trend days do not represent the majority of days, they can have big moves worth understanding, for both capitalization and risk mitigation.
To this end, I discovered:
• Article by Linda Bradford Raschke about Capturing Trend Days.
• Video of Garrett Drinon about Trend Day Trading.
• Videos of Ryan Trost about How To Use ADD and TICK.
• Article by Jason Ruchel about Overview of Key Market Internals.
• Including links to resources outside of TradingView violates the House Rules, but they're not hard to find, if interested.
These discoveries inspired me adopt the underlying symbols in my own trading. I also found myself wanting to make using them easier, the net result being this script.
While coding everything, I also discovered a few symbols I believe warrant serious consideration. Specifically the Percent Above VWAP symbols and the Up Ticks / Down Ticks symbols (referenced as ABVD and TKCD in this indicator, for brevity). I found transforming ABVD or TKCD into a Ratio or Percent Diff. to be an incredibly useful and worthy inclusion.
ABVD is a Market Breadth cousin to Brian Shannon's work, and TKCD is like the 3rd dimension of the TICKs geometry. Enjoy.

NSDT Average 6This is a pretty simple concept that we were asked to put together. It uses 6 Moving Averages, and takes the average of each one, then averages them all together.
If you don't want to use 6, and only 3 for example, then just enter the same length in two of the input fields as pairs.
Example:
For 6, you could use 10, 20, 30, 40, 50, 60
For 3, you could use 10, 10, 50, 50, 100, 100
It doesn't ploy 6 MA's, it only plots one - the result of the average of an average of an average, etc..
Publishing open source so other can modify as needed.
RSI Trend Detector PSAR BasedRSI Trend Detector is based on the Direction of PSAR. This indicator helps the easy detection of Trend Direction and Sideways Movement of Price. It was difficult to determine the RSI Trend Direction in a basic RSI indicator. one cannot decide the exact entry point where to enter.
RSI Trend Detector helps with the direction of trend using PSAR direction which is almost instant direction changing indicator with Zero Lag. The color of the RSI changes immediately based on PSAR direction. One can determine the trend whether its in UP / Down or Sideways.
One can easily detect Pullback and entry points using this indicator.
The basic working can be interpreted with a normal default RSI, The only additional feature is the direction of trend using a SAR signal.
Oversold Zone is below 30
Overbought Zone is above 70
how ever RSI above 50 is treated a UP trend and Below 50 as Down Trend.
when RSI is between 40 and 60 price must be considered as Sideways. One can easily interpret the TREND.
Yellow Line = RSI Moving Average
RED and Green Line= RSI
Grey Zone = Sideways
Horizontal line = RSI level 50
Settings can be changed as required.
RSI Line:
RSI Above 50 up trend and Entry when color is green
RSI Below 50 down trend and Entry when color is Red
RSI in Grey Zone is sideways, wait for a breakout
RSI above 50 and color is red then its a pullback in uptrend
RSI below 50 and color is green then its a pullback in downtrend
ALERTS:
Up signal and Down Signal are provided when ever RSI crosses RSIMA
Up Signal: RSI crosses RSI Moving Average upwards
Down Signal: RSI crosses RSI Moving Average Downwards
Hope the Tradingview community likes this.

YinYang RSI Volume Trend StrategyThere are many strategies that use RSI or Volume but very few that take advantage of how useful and important the two of them combined are. This strategy uses the Highs and Lows with Volume and RSI weighted calculations on top of them. You may be wondering how much of an impact Volume and RSI can have on the prices; the answer is a lot and we will discuss those with plenty of examples below, but first…
How does this strategy work?
It’s simple really, when the purchase source crosses above the inner low band (red) it creates a Buy or Long. This long has a Trailing Stop Loss band (the outer low band that's also red) that can be adjusted in the Settings. The Stop Loss is based on a % of the inner low band’s price and by default it is 0.1% lower than the inner band’s price. This Stop Loss is not only a stop loss but it can also act as a Purchase Available location.
You can get back into a trade after a stop loss / take profit has been hit when your Reset Purchase Availability After condition has been met. This can either be at Stop Loss, Entry or None.
It is advised to allow it to reset in case the stop loss was a fake out but the call was right. Sometimes it may trigger stop loss multiple times in a row, but you don’t lose much on stop loss and you gain lots when the call is right.
The Take Profit location is the basis line (white). Take Profit occurs when the Exit Source (close, open, high, low or other) crosses the basis line and then on a different bar the Exit Source crosses back over the basis line. For example, if it was a Long and the bar’s Exit Source closed above the basis line, and then 2 bars later its Exit Source closed below the basis line, Take Profit would occur. You can disable Take Profit in Settings, but it is very useful as many times the price will cross the Basis and then correct back rather than making it all the way to the opposing zone.
Longs:
If for instance your Long doesn’t need to Take Profit and instead reaches the top zone, it will close the position when it crosses above the inner top line (green).
Please note you can change the Exit Source too which is what source (close, open, high, low) it uses to end the trades.
The Shorts work the same way as the Long but just opposite, they start when the purchase source crosses under the inner upper band (green).
Shorts:
Shorts take profit when it crosses under the basis line and then crosses back.
Shorts will Stop loss when their outer upper band (green) is crossed with the Exit Source.
Short trades are completed and closed when its Exit Source crosses under the inner low red band.
So, now that you understand how the strategy works, let’s discuss why this strategy works and how it is profitable.
First we will discuss Volume as we deem it plays a much bigger role overall and in our strategy:
As I’m sure many of you know, Volume plays a huge factor in how much something moves, but it also plays a role in the strength of the movement. For instance, let’s look at two scenarios:
Bitcoin’s price goes up $1000 in 1 Day but the Volume was only 10 million
Bitcoin’s price goes up $200 in 1 Day but the Volume was 40 million
If you were to only look at the price, you’d say #1 was more important because the price moved x5 the amount as #2, but once you factor in the volume, you know this is not true. The reason why Volume plays such a huge role in Price movement is because it shows there is a large Limit Order battle going on. It means that both Bears and Bulls believe that price is a good time to Buy and Sell. This creates a strong Support and Resistance price point in this location. If we look at scenario #2, when there is high volume, especially if it is drastically larger than the average volume Bitcoin was displaying recently, what can we decipher from this? Well, the biggest take away is that the Bull’s won the battle, and that likely when that happens we will see bullish movement continuing to happen as most of the Bears Limit Orders have been fulfilled. Whereas with #2, when large price movement happens and Bitcoin goes up $1000 with low volume what can we deduce? The main takeaway is that Bull’s pressured the price up with Market Orders where they purchased the best available price, also what this means is there were very few people who were wanting to sell. This generally dictates that Whale Limit orders for Sells/Shorts are much higher up and theres room for movement, but it also means there is likely a whale that is ready to dump and crash it back down.
You may be wondering, what did this example have to do with YinYang RSI Volume Trend Strategy? Well the reason we’ve discussed this is because we use Volume multiple times to apply multiplications in our calculations to add large weight to the price when there is lots of volume (this is applied both positively and negatively). For instance, if the price drops a little and there is high volume, our strategy will move its bounds MUCH lower than the price actually dropped, and if there was low volume but the price dropped A LOT, our strategy will only move its bounds a little. We believe this reflects higher levels of price accuracy than just price alone based on the examples described above.
Don’t believe us?
Here is with Volume NOT factored in (VWMA = SMA and we remove our Volume Filter calculation):
Which produced -$2880 Profit
Here is with our Volume factored in:
Which produced $553,000 (55.3%)
As you can see, we wen’t from $-2800 profit with volume not factored to $553,000 with volume factored. That's quite a big difference! (Please note previous success does not predict future success we are simply displaying the $ amounts as example).
Now how about RSI and why does it matter in this strategy?
As I’m sure most of you are aware, RSI is one of the leading indicators used in trading. For this reason we figured it would only make sense to incorporate it into our calculations. We fiddled with RSI for quite awhile and sometimes what logically seems to be the right way to use it isn’t. Now, because of this, our RSI calculation is a little odd, but basically what we’re doing is we calculate the RSI, then turn it into a percentage (between 0-1) that can easily be multiplied to the price point we need. The price point we use is the difference between our high purchase zone and our low purchase zone. This allows us to see how much price movement there is between zones. We multiply our zone size with our RSI multiplication and we get the amount we will add +/- to our basis line (white line). This officially creates the NEW high and low purchase zones that we are actually using and displaying in our trades.
If you found that confusing, here are some examples to why it is an important calculation for this strategy:
Before RSI factored in:
Which produced 27.8% Profit
After RSI factored in:
Which produced 553% Profit
As you can see, the RSI makes not only the purchase zones more accurate, but it also greatly increases the profit the strategy is able to make. It also helps ensure an relatively linear profit slope so you know it is reliable with its trades.
This strategy can work on pretty much anything, but you should tweak the values a bit for each pair you are trading it with for best results.
We hope you can find some use out of this simple but effective strategy, if you have any questions, comments or concerns please let us know.
HAPPY TRADING!

Median of Means Estimator Median of Means (MoM) is a measure of central tendency like mean (average) and median. However, it could be a better and robust estimator of central tendency when the data is not normal, asymmetric, have fat tails (like stock price data) and have outliers. The MoM can be used as a robust trend following tool and in other derived indicators.
Median of means (MoM) is calculated as follows, the MoM estimator shuffles the "n" data points and then splits them into k groups of m data points (n= k*m). It then computes the Arithmetic Mean of each group (k). Finally, it calculate the median over the resulting k Arithmetic Means. This technique diminishes the effect that outliers have on the final estimation by splitting the data and only considering the median of the resulting sub-estimations. This preserves the overall trend despite the data shuffle.
Below is an example to illustrate the advantages of MoM
Set A Set B Set C
3 4 4
3 4 4
3 5 5
3 5 5
4 5 5
4 5 5
5 5 5
5 5 5
6 6 8
6 6 8
7 7 10
7 7 15
8 8 40
9 9 50
10 100 100
Median 5 5 5
Mean 5.5 12.1 17.9
MoM 5.7 6.0 17.3
For all three sets the median is the same, though set A and B are the same except for one outlier in set B (100) it skews the mean but the median is resilient. However, in set C the group has several high values despite that the median is not responsive and still give 5 as the central tendency of the group, but the median of means is a value of 17.3 which is very close to the group mean 17.9. In all three cases (set A, B and C) the MoM provides a better snapshot of the central tendency of the group. Note: The MoM is dependent on the way we split the data initially and the value might slightly vary when the randomization is done sevral time and the resulting value can give the confidence interval of the MoM estimator.
Cycles: 4x dual inputs: Swing / Time Cycles projected forward//Purpose/Premise:
To project forward vertical 'cycle' lines based on user-input anchor points, and to search for confluence.
The idea being that if several well-anchored cycles agree (i.e. we see multiple bunched vertical line confluence in the future), then this may add support to an already existing trade idea, or may indicate an increased likelihood of a shift in direction.
//Usage & notes:
~In the above chart I've anchored to obvious swing lows and swing highs in Btc/Usd from 2020-2022. You could also use fixed time-based cycles from a favored start anchor point. Bars per cycle are printed at the top of each cycle box if your're interested in time cycles. I.e. for 1, 2, 3 month cycles: for BTC you could use 30, 60, 90 bars on daily; for S&P you could use 20, 40, 60 bars on daily.
~On first loading the indicator you will be asked select 'start date', and 'end date' for each of 4 sessions (8x clicks on chart). After this you can easily reset points by clicking the indicator display line three dots>> reset points. Or you can simply drag the vertical box edges (purple lines) to change your cycle anchor points.
~Be sure the start anchor point is before the end anchor point or box/lines won't appear.
~When you drop down to low timeframes you might get bar_index error due to history available: you need then to click the three dots on indicator display line >> reset points >> 8x clicks on the chart.
~Vertical projected lines will match the color of the cycle box they origninate from.
~Lines will project into the future as far as is allowed by tradingview (500 bars max)
//Inputs:
~Time start and end dates for each cycle (change these as described above, or input manually)
~Show/hide each cycle (default is show all 4)
~Formatting options: color of forward projected lines, line width, line style, line / box / text color.
~Box transparancy: Set to 100 to make boxes invisible & declutter the chart. Set to 0 for maximum opacity. Default is 80.
thanks to @Sathyamurthie for his ideas on cycle confluence which caused me to write this.

W and M Pattern Indicator- SwaGThis is a TradingView indicator script that identifies potential buy and sell signals based on ‘W’ and ‘M’ patterns in the Relative Strength Index (RSI). It provides visual alerts and draws horizontal lines to indicate potential trade entry points.
User Manual:
Inputs: The script takes two inputs - an upper limit and a lower limit. The default values are 70 and 40, respectively.
RSI Calculation: The script calculates the RSI based on the closing prices of the last 14 periods.
Pattern Identification: It identifies ‘W’ patterns when the RSI makes a higher low within the lower limit, and ‘M’ patterns when the RSI makes a lower high within the upper limit.
Visual Alerts: The script plots these patterns on the chart. ‘W’ patterns are marked with small green triangles below the bars, and ‘M’ patterns are marked with small red triangles above the bars.
Trade Entry Points: A horizontal line is drawn at the high or low of the candle to represent potential trade entry points. The line starts from one bar to the left and extends 10 bars to the right.
Trading Strategy:
For investing, use a weekly timeframe.
For swing trading, use a daily timeframe.
For intraday trading, use a 5 or 15-minute timeframe. Only consider sell-side signals for intraday trading.
Take a buy position if the high breaks above the green line or sell if the low breaks below the red line.
Use recent signals only and avoid signals that are too old.
Swing highs or lows will be your stop-loss level.
Always think about your stop-loss before entering a trade, not your target.
Avoid trades with a large stop-loss.
Remember, this script is a tool to aid in your trading decisions. Always test your strategies thoroughly before live trading. Happy trading! 😊

How To Input CSV List Of Symbol Data Used For ScreenerExample of how to input multiple symbols at once using a CSV list of ticker IDs. The input list is extracted into individual ticker IDs which are then each used within an example screener function that calculates their rate of change. The results for each of the rate of changes are then plotted.
For code brevity this example only demonstrates using up to 4 symbols, but the logic is annotated to show how it can easily be expanded for use with up to 40 ticker IDs.
The CSV list used for input may contain spaces or no spaces after each comma separator, but whichever format (space or no space) is used must be used consistently throughout the list. If the list contains any invalid symbols the script will display a red exclamation mark that when clicked will display those invalid symbols.
If more than 4 ticker IDs are input then only the first 4 are used. If less than 4 ticker IDs are used then the unused screener calls will return `float(na)`. In the published chart the input list is using only 3 ticker IDs so there are only 3 plots shown instead of 4.
NOTICE: This is an example script and not meant to be used as an actual strategy. By using this script or any portion thereof, you acknowledge that you have read and understood that this is for research purposes only and I am not responsible for any financial losses you may incur by using this script!

RSI Screener Multi Timeframe [5ema]This indicator is the simple version of my indicator: RSI Screener and Divergence .
Only show table with values, signals at 5 custom timeframes.
-----
I reused some functions, made by (i believe that):
©paaax: The table position function.
@kingthies: The RSI divergence function.
@QuantNomad: The function calculated value and array screener for 40+ instruments.
I have commented in my code. Thanks so much!
-----
How it works:
1. Input :
Length of RSI => calculate RSI.
Upper/lower => checking RSI overbought/oversold.
Right bars / left bars => returns price of the pivot low & high point => checking divergence.
Range upper / lower bars => compare the low & high point => checking divergence.
Timeframe => request.security another time frame.
Table position => display screener table.
2. Input bool:
Regular Bearish divergence.
Hidden Bullish divergence .
Hidden Bearish divergence.
3. Basic calculated:
Make function for RSI , pivot low & high point of RSI and price.
Request.security that function for earch time frame.
Result RSI, Divergence.
4. Condition of signal:
Buy condition:
RSI oversold (1)
Bullish divergence (2).
=> Buy if (1) and (2), review buy (1) or (2).
Sell condition:
RSI overbought (3).
Bearish divergence (4).
=> Sell if (3) and (4), review sell (3) or (4).
-----
Table screener:
Time frame.
RSI (green - oversold, red - overbought)
Divergence (>> - regular bullish , << regular bearish , > - hidden bullish , < - hidden bearish ).
Signal (green ⦿ - Buy, red ⦿ - Sell, green 〇 - review buy, red 〇 - review sell).
- Regular Bearish divergence:
- Regular Bullish divergence:
- Regular Bullish divergence + RSI overSold
- Regular Bearish divergence + RSI overBought
-----
This indicator is for reference only, you need your own method and strategy.
If you have any questions, please let me know in the comments.

External Indicator Analysis Overlay | Buy/Sell | HTF Heikin-AshiThis chart overlay offers multiple candlestick display options. The Regular (Japanese) and the Heikin-Ashi candles are well known. The Mari-Ashi (or Renko) option is something special as it should be timeframe independent, so that sideways action should be represented in one candle. That is difficult to realize as an overlay on the normal candlestick structure, but perhaps the chosen implementation is useful nonetheless. The Velocity option is experimental and is designed to show if the price has accelerated too much in a trend direction. In this case, the highs and lows do not reflect the actual highs and lows, but indicate the overshooting velocity. The opening of the candle also depends on the inherent velocity, but the close of the candle is always the actual close. Anyway, it doesn't look very useful, but the option is there.
All options can be applied to higher timeframes. A usable setting is obtained by disabling only the body of the TradingView candles in regular mode and enabling this overlay.
A large part of this overlay consists of buy/sell indication settings. For activation it is necessary to select an external source. For example the “Relative Bi-Directional Volatility Range”, specifically the Trend Shift Signal (TSS). This signal switches from 0 to 1, if the trend becomes bullish or from 0 to -1, if the trend becomes bearish. It will be automatically detected without specifying the Indication Type. Alternatively, the Volatility Moving Average (VMA) would meet the requirements for the Indication Type “Buy = positive | Sell = negative”. The Moving Average Convergence Divergence (MACD) also fulfills these conditions. Another example is to use any Moving Average with the Indication Type “Buy = rising | Sell = falling”. In the chart above the Hull Moving Average (HMA) is used. In addition, it is possible to reverse the signal, so that positive signals become negative and vice versa. The signals will be labeled as Buy or Sell on the chart.
The user can analyze whether the provided signals are good or bad indications for going long or short or simply for rebalancing a portfolio. Therefore, it is possible to set a starting point for the analysis and choose a weighting for the investments from 0% to 100% of the portfolio. To avoid sleepless nights, a very reliable (and conservative) setting seems to be Rebalancing with 50% (very similar to the well-known 60/40 portfolio). The calculation results are shown in a table.
As a small addition there is the possibility to label the peaks by setting the distance between the highs/lows. This will make the quality of the buy and sell signals even more clear.

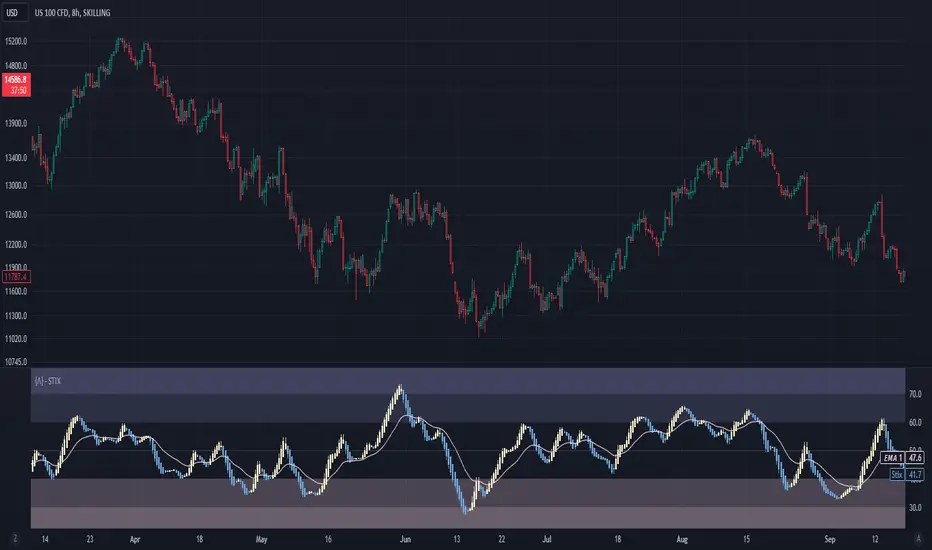
Short Term IndeXThe Short-Term Index (STIX) is a simple market indicator designed to assess short-term overbought or oversold conditions in the stock market. Leveraging a combination of advancing and declining issues, STIX provides valuable insights into market sentiment and potential reversals. To enhance its interpretability and reveal the underlying trend with greater clarity, STIX has been refined through a Heiken-Ashi transformation, ensuring a smoother representation of market dynamics.
Calculation and Methodology:
stix = ta.ema(adv / (adv + dec) * 100, len)
STIX is calculated by dividing the difference between the sum of advancing issues (ADV) by the total number of issues traded (ADV + DEC). This quotient is multiplied by 100 to express the result as a percentage. The STIX index ranges from 0 to 100, where extreme values indicate potential overbought (mainly above 60) or oversold (mainly below 40) market conditions.
Heiken-Ashi Transformation:
By applying a Heiken-Ashi transformation to STIX, the indicator gains improved visual clarity and noise reduction. This transformation enhances the ability to identify trend shifts and potential reversal points, making it an even more valuable tool for traders and investors.
Utility and Use Cases:
-The Short-Term Index (STIX) offers a range of practical applications-
1. Overbought/Oversold Conditions: STIX provides a clear indication of short-term overbought or oversold conditions, helping traders anticipate potential market reversals.
2. Reversal Points: STIX can help pinpoint potential reversal points in short-term market trends, providing traders with opportunities to enter or exit positions.
3. Trend Analysis: By observing STIX values over time, traders can assess the strength and sustainability of short-term trends, aiding in trend-following strategies.
The Short-Term Index (STIX), enhanced by its Heiken-Ashi transformation, equips traders and investors with a tool for assessing short-term market conditions, confirming price movements, and identifying potential reversal points. Its robust methodology and refined presentation contribute to a more comprehensive understanding of short-term market dynamics, enabling traders to make well-informed trading decisions.
See Also:
- Other Market Breadth Indicators-
Bull and Bear Market '20% IndicatorThis indicator uses the somewhat crude method of calculating bear/bull markets using the following popular ' 20% rule ':
A bear market begins when an asset trades 20% below its recent high for more than two months, a bear market ends when an asset trades 20% above its recent low for one month or more.
The 1d time-frame should be used, here's why:
"A bear market begins when an asset trades 20% below its recent high for more than two months."
If we take the standard trading month to be around 20-22 days (excluding weekends), then two months would be approximately 40-44 days. This is why we set the `bearDuration` to 60 days in the script to capture the "more than two months" criteria. Using a daily timeframe, 60 bars represent roughly 3 months (since markets are not open every day due to weekends and holidays).
"...a bear market ends when an asset trades 20% above its recent low for one month or more."
This is why the `bullDuration` is set to 20 days in the script, which represents roughly one trading month on a daily timeframe.
So, to capture the mentioned bear and bull market definitions, you'd want to apply the script on a daily (1d/1D) chart.

Indicator Based Market Exposure (IBME)The Indicator Based Market Exposure (IBME) system was created by Big Wave Chartist as a way to navigate the markets using a confluence of three different signals to determine when the "internals" of the market are in your favor and how heavily invested to be at any point. The idea of the system is also to flash warning signs when the market internals are beginning to deteriorate so as to take a defensive stance. Of course this system can be strictly adhered to, or it can be incorporated into a more discretionary style of trading, and be combined with progressive exposure into (and out of) the market as positions gain (or lose) traction.
The IBME displays a straightforward action signal based on the combination of the 3 separate signals:
Green 🟢 Full size-longs permitted
Yellow 🟡 Pilot positions permitted
Red 🔴 No longs allowed
So let's get into the signals used:
McClellan Summation Index
Net New Highs/Lows
Net New Highs Crossover
McClellan Summation Index (MSI)
The McClellan Summation Index is a long-term version of the McClellan Oscillator, which is a market breadth indicator based on stock advances and declines. Interpretation is similar to that of the McClellan Oscillator, except that it is more suited to intermediate to major trends and related reversals. The McClellan Summation Index can be calculated as the sum of all the daily values of the McClellan Oscillator. This is used along with the 10-sma to watch for a crossover indicating an uptrend or downtrend beginning.
Net New Highs/Lows
This is the net number of stocks making 52-week highs or lows. For instance, if there are 60 new 52-week highs and 20 new 52-week lows, the net number will be 40 net new 52 week highs. This signal is particularly useful in gauging breadth.
Net New Highs Crossover
This is the description of NNHC from the original separate version of this indicator created by HikoStory: "Net New Highs can guide you to increase or decrease your exposure based on the current market health. They are calculated by subtracting the new highs from the new lows, based on all stocks of the...NASDAQ. A positive value shows that the market is doing good, since more stocks are making new highs compared to new lows. A negative value shows that the market is doing bad, since more stocks are making new lows compared to new highs. Combined with a moving average you can see crossovers that can warn you early when there is a change in the current market health."
The default index for the IBME is the Nasdaq.
The IBME is meant to be used on a daily time frame chart, therefore the signal will only show on a daily time frame chart.
Display options include:
Show/hide individual signals
Table background/font color
Table size/placement

All Candlestick Patterns Screener [By MUQWISHI]▋ INTRODUCTION :
The Candlestick Patterns Screener has been designed to offer an advanced monitoring solution for up to 40 symbols. Utilizing a log screener style, it efficiently gathers information on confirmed candlestick pattern occurrences and presents it in an organized table. This table includes essential details such as the symbol name, signal price, and the corresponding candlestick pattern name.
_______________________
▋ OVERVIEW:
_______________________
▋ CREDIT:
Credit to public technical “*All Candlestick Patterns*” indicator.
_______________________
▋ USAGE:
_______________________
▋ Final Comments:
For best performance, add the Candlestick Patterns Screener on active symbol chart like QQQ, SPY, AAPL, BTCUSDT, ES, EURUSD or …etc.
Candlestick patterns are not a major concept to build a trading decision.
Personally, I see candlestick patterns as a means to comprehend the psychology of the market, and help to follow the price action.
Please let me know if you have any questions.
Thank you.

RSI Momentum Trend ScreenerIntroducing The RSI Momentum Trend Screener, to have the ability to scan 40 symbols at once
The screener is based on RSI Momentum Trend Indicator
It will show Positive Or Negative based on the symbol condition.
You can change the values on the screener, symbols, activate/disable symbols and change table position and color

Fair Value Gap (FVG) UnderlayBy analyzing the size and characteristics of candlestick patterns, the Fair Value Gap indicator helps traders spot potential opportunities where the price of a currency or financial asset deviates from its fair value. The FVG is represented as a percentage and displayed as columns in an underlay on the chart.
Calculation and Interpretation:
The calculation of the FVG involves evaluating the body-to-wick ratio of a candlestick. This ratio compares the size of the body (the difference between the open and close prices) to the length of the wicks (the high and low prices). A high body-to-wick ratio indicates a significant price move within the candlestick, potentially signaling a strong market sentiment. The FVG indicator compares the size of the current candlestick with the previous candlesticks over a specified lookback period, typically the last 20 to 40 candlesticks. If the current candlestick meets the criteria for a fair value gap, it is classified as either a Bearish FVG or Bullish FVG, depending on the direction of the price movement.
Interpreting the FVG is relatively straightforward. When a Bearish FVG is detected, it suggests that the price is currently lower than its fair value, indicating a potential upward price movement in the future. This could be an opportunity to consider long positions or buying opportunities. On the other hand, when a Bullish FVG is identified, it implies that the price is higher than its fair value, signaling a possible downward price correction. Traders may consider short-selling or taking profits on long positions in such scenarios.
Coloration:
The coloration of the Fair Value Gap (FVG) indicator plays a crucial role in enhancing its visual representation and aiding interpretation. When a Bearish FVG is identified, the indicator utilizes the color scheme of lime green. This color signifies the potential for an upward price movement as the current price is considered lower than its fair value. On the other hand, a Bullish FVG is represented by the vibrant color of fuchsia, indicating a potential downward price correction as the price exceeds its fair value. The coloration serves as a visual cue, making it easier for traders to quickly identify and differentiate between different types of fair value gaps on the chart. Additionally, the barcolor is aligned with the respective FVG color, providing a comprehensive view of price inefficiencies and aiding traders in their decision-making process.
Potential Applications/Strategies:
The FVG indicator can be applied in various trading strategies and situations. One possible application is in price reversion strategies. Traders can use the FVG to identify overbought or oversold conditions in the market. When a Bullish FVG occurs, it may indicate an opportunity to consider short-selling or taking profits on long positions. Similarly, a Bearish FVG can suggest a potential buying opportunity, expecting the price to revert back to its fair value.
Another application is in confirming existing trends. The FVG can act as a confirmation tool for trends identified by other indicators or analysis techniques. When a Bullish FVG aligns with an uptrend, it may strengthen the bullish bias and provide more confidence in the upward momentum. Conversely, a Bearish FVG in conjunction with a downtrend may reinforce the bearish sentiment and support the idea of further downside potential.
Parameters:
Adjusting the parameters of the FVG indicator can be beneficial based on the trader's trading style and time frame. The body-to-wick ratio threshold and lookback period can be modified to capture different types of fair value gaps and adapt to different market conditions. Shorter lookback periods may help identify more recent FVGs, which could be suitable for short-term traders, while longer periods may capture larger price inefficiencies and cater to longer-term traders.
Limitations:
However, it's important to note that the FVG indicator, like any technical analysis tool, has its limitations. It relies on historical price patterns and may not always accurately predict future price movements. The interpretation of FVGs requires careful analysis and should be used in conjunction with other indicators, technical analysis tools, and fundamental factors to make well-informed trading decisions. Traders should also exercise proper risk management and consider the overall market context when using the FVG indicator.
In conclusion, the Fair Value Gap (FVG) indicator provides traders with valuable insights into price inefficiencies and deviations from fair value. By identifying Bearish and Bullish FVGs, traders can potentially uncover trading opportunities and make more informed decisions. However, it is crucial to combine the FVG indicator with other analysis tools, conduct thorough analysis, and exercise proper risk management to achieve consistent trading success.

ICT Silver Bullet [LuxAlgo]The ICT Silver Bullet indicator is inspired from the lectures of "The Inner Circle Trader" (ICT) and highlights the Silver Bullet (SB) window which is a specific 1-hour interval where a Fair Value Gap (FVG) pattern can be formed.
When a FVG is formed during the Silver Bullet window, Support & Resistance lines will be drawn at the end of the SB session.
There are 3 different Silver Bullet windows (New York local time):
The London Open Silver Bullet (3 AM — 4 AM ~ 03:00 — 04:00)
The AM Session Silver Bullet (10 AM — 11 AM ~ 10:00 — 11:00)
The PM Session Silver Bullet (2 PM — 3 PM ~ 14:00 — 15:00)
🔶 USAGE
The ICT Silver Bullet indicator aims to provide users a comprehensive display as similar as possible to how anyone would manually draw the concept on their charts.
It's important to use anything below the 15-minute timeframe to ensure proper setups can display. In this section, we are purely using the 3-minute timeframe.
In the image below, we can see a bullish setup whereas a FVG was successfully retested during the Silver Bullet session. This was then followed by a move upwards to liquidity as our target.
Alternatively, you can also see below a bearish setup utilizing the ICT Silver Bullet indicator outlined.
At this moment, the indicator has removed all other FVGs within the Silver Bullet session & has confirmed this FVG as the retested one.
There is also a support level marked below to be used as a liquidity target as per the ICT Silver Bullet concept suggests.
In the below chart we can see 4 separate consecutive examples of bullish & bearish setups on the 3-minute chart.
🔶 CONCEPTS
This technique can visualize potential support/resistance lines, which can be used as targets.
The script contains 2 main components:
• forming of a Fair Value Gap (FVG)
• drawing support/resistance (S/R) lines
🔹 Forming of FVG
1 basic principle: when a FVG at the end of the SB session is not retraced, it will be made invisible.
Dependable on the settings, different FVG's will be shown.
• 'All FVG': all FVG's are shown, regardless the trend
• 'Only FVG's in the same direction of trend': Only FVG's are shown that are similar to the trend at that moment (trend can be visualized by enabling ' Show ' -> ' Trend ')
-> only bearish FVG when the trend is bearish vs. bullish FVG when trend is bullish
• 'strict': Besides being similar to the trend, only FVG's are shown when the closing price at the end of the SB session is:
– below the top of the FVG box (bearish FVG)
– above bottom of the FVG box (bullish FVG)
• 'super-strict': Besides being similar to the trend, only FVG's are shown when the FVG box is NOT broken
in the opposite direction AND the closing price at the end of the SB session is:
– below bottom of the FVG box (bearish FVG)
– above the top of the FVG box (bullish FVG)
' Super-Strict ' mode resembles ICT lectures the most.
🔹 Drawing support/resistance lines
When the SB session has ended, the script draws potential support/resistance lines, again, dependable on the settings.
• Previous session (any): S/R lines are fetched between current and previous session.
For example, when current session is ' AM SB Session (10 AM — 11 AM) ', then previous session is
' London Open SB (3 AM — 4 AM) ', S/R lines between these 2 sessions alone will be included.
• Previous session (similar): S/R lines are fetched between current and previous - similar - session.
For example, when current session is ' London Open SB (3 AM — 4 AM)' , only S/R lines between
current session and previous ' London Open SB (3 AM — 4 AM) ' session are included.
When a new session starts, S/R lines will be removed, except when enabling ' Keep lines (only in strict mode) '
This is not possible in ' All FVG ' or ' Only FVG's in the same direction of trend ' mode, since the chart would be cluttered.
Note that in ' All FVG ' or ' Only FVG's in the same direction of trend ' mode, both, Support/Resistance lines will be shown,
while in Strict/Super-Strict mode:
• only Support lines will be shown if a bearish FVG appears
• only Resistance lines if a bullish FVG is shown
The lines will still be drawn the the end of the SB session, when a valid FVG appears,
but the S/R lines will remain visible and keep being updated until price reaches that line.
This publication contains a "Minimum Trade Framework (mTFW)", which represents the best-case expected price delivery, this is not your actual trade entry - exit range.
• 40 ticks for index futures or indices
• 15 pips for Forex pairs.
When on ' Strict/Super-Strict ' mode, only S/R lines will be shown which are:
• higher than the lowest FVG bottom + mTFW, in a bullish scenario
• lower than the highest FVG bottom - mTFW, in a bearish scenario
When on ' All FVG/Only FVG's in the same direction of trend ' mode, or on non-Forex/Futures/Indices symbols, S/R needs to be higher/lower than SB session high/low.
🔶 SETTINGS
(Check CONCEPTS for deeper insights and explanation)
🔹 Swing settings (left): Sets the length, which will set the lookback period/sensitivity of the Zigzag patterns (which directs the trend)
🔹 Silver Bullet Session; Show SB session: show lines and labels of SB session
Labels can be disabled separately in the ' Style ' section, color is set at the ' Inputs ' section.
🔹 FVG
– Mode
• All FVG
• Only FVG's in the same direction of trend
• Strict
• Super-Strict
– Colors
– Extend: extend till last bar of SB session
🔹 Targets – support/resistance lines
– Previous session (any): S/R lines fetched between current and previous SB session
– Previous session (similar): S/R lines fetched between current and previous similar SB session
– Colors
– Keep lines (only in strict mode)
🔹 Show
– MSS ~ Session: Show Market Structure Shift , only when this happens during a SB session
– Trend: Show trend (Zigzag, colored ~ trend)

Price Exhaustion IndicatorThe Price Exhaustion Indicator (PE) is a powerful tool designed to identify trends weakening and strengthening in the financial markets. It combines the concepts of Average True Range (ATR), Moving Average Convergence Divergence (MACD), and Stochastic Oscillator to provide a comprehensive assessment of trend exhaustion levels. By analyzing these multiple indicators together, traders and investors can gain valuable insights into potential price reversals and long-term market highs and lows.
The aim of combining the ATR, MACD, and Stochastic Oscillator, is to provide a comprehensive analysis of trend exhaustion. The ATR component helps assess the volatility and range of price movements, while the MACD offers insights into the convergence and divergence of moving averages. The Stochastic Oscillator measures the current price in relation to its range, providing further confirmation of trend exhaustion. The exhaustion value is derived by combining the MACD, ATR, and Stochastic Oscillator. The MACD value is divided by the ATR value, and then multiplied by the Stochastic Oscillator value. This calculation results in a single exhaustion value that reflects the combined influence of these three indicators.
Application
The Price Exhaustion Indicator utilizes a unique visual representation by incorporating a gradient color scheme. The exhaustion line dynamically changes color, ranging from white when close to the midline (40) to shades of purple as it approaches points of exhaustion (overbought at 100 and oversold at -20). As the exhaustion line approaches the color purple, this represents extreme market conditions and zones of weakened trends where reversals may occur. This color gradient serves as a visual cue, allowing users to quickly gauge the strength or weakness of the prevailing trend.
To further enhance its usability, the Price Exhaustion Indicator also includes circle plots that signify potential points of trend reversion. These plots appear when the exhaustion lines cross or enter the overbought and oversold zones. Red circle plots indicate potential short entry points, suggesting a weakening trend and the possibility of a downward price reversal. Conversely, green circle plots represent potential long entry points, indicating a strengthening trend and the potential for an upward price reversal.
Traders and investors can leverage the Price Exhaustion Indicator in various ways. It can be utilized as a trend-following tool, or a mean reversion tool. When the exhaustion line approaches the overbought or oversold zones, it suggests a weakening trend and the possibility of a price reversal, helping identify potential market tops and bottoms. This can guide traders in timing their entries or exits in anticipation of a trend shift.
Utility
The Price Exhaustion Indicator is particularly useful for long-term market analysis, as it focuses on identifying long-term market highs and lows. By capturing the gradual weakening or strengthening of a trend, it assists investors in making informed decisions about portfolio allocation, trend continuation, or potential reversals.
In summary, the Price Exhaustion Indicator is a comprehensive and visually intuitive tool that combines ATR, MACD, and Stochastic Oscillator to identify trend exhaustion levels. By utilizing a gradient color scheme and circle plots, it offers traders and investors valuable insights into potential trend reversals and long-term market highs and lows. Its unique features make it a valuable addition to any trader's toolkit, providing a deeper understanding of market dynamics and assisting in decision-making processes. Please note that future performance of any trading strategy is fundamentally unknowable, and past results do not guarantee future performance.

Divergence Screener [Mr_Zed]Divergence Screener
This script allows you to scan multiple assets and timeframes for bullish and bearish divergences based on the RSI (Relative Strength Index) indicator.
Features
Supports up to 40 different assets and timeframes for simultaneous scanning.
Customizable settings for RSI period and source.
Adjustable lookback periods for identifying pivot highs and pivot lows.
Flexible range limits for filtering divergences based on the number of bars since the last pivot point.
Alerts for bullish and bearish divergences on confirmed bars.

QFL Screener [ ZCrypto ]The QFL Screener is a robust tool inspired by Quickfingersluc's trading strategy.
Known as the Base Strategy or Mean Reversals, QFL focuses on identifying moments of panic selling and buying , presenting opportunities to enter trades at deeply discounted prices.
The QFL Screener is designed to enhance your trading efficiency by simultaneously scanning 40 symbols.
You have the flexibility to enable or disable specific symbols from the screening process, allowing you to tailor the screener to your preferred markets and instruments.
The Screener has a built-in alerts system . As soon as the QFL conditions align for any of the scanned symbols, you'll receive instant notifications, empowering you to take prompt action and seize potential trading opportunities.
In addition, I've incorporated a visual element to complement the alerts. Once the conditions are true, a green arrow shape will appear directly on the chart, providing a clear and intuitive signal of the QFL opportunity.
To provide a clear overview, our screener presents a comprehensive table that highlights when the QFL condition becomes true for each symbol. This table acts as a visual guide, enabling you to monitor the status of multiple symbols at a glance, streamlining your trading decision-making process.
With the QFL Screener, you gain an edge in identifying profitable trade setups based on Quickfingersluc's renowned approach. Experience the convenience of simultaneous screening, real-time alerts, and an intuitive table display, all in one user-friendly tool.
