RSI NarrativesDescription:
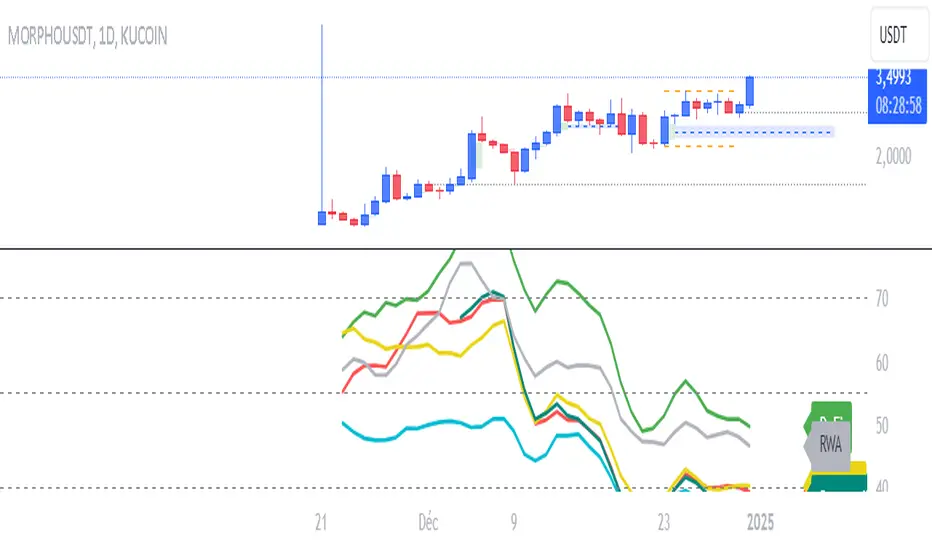
The RSI Narratives script aggregates Relative Strength Index (RSI) values across multiple cryptocurrency narratives or sectors, providing an easy-to-read visual and alert system for trend reversals and overbought/oversold conditions. This tool is designed for traders looking to track sector-specific trends and compare performance across AI, DeFi, Level 1 blockchains, and more.
Key Features:
RSI Aggregation by Sector: Calculates average RSI for key narratives, including AI, DeFi, Level 1 blockchains, new memes, and more.
Customizable RSI Settings: Adjust RSI period, line width, and label offsets for personalized analysis.
Dynamic Alerts: Receive alerts when a narrative enters overbought or oversold territory, helping you act quickly on market movements.
Clean Visualization: Overlay sector-specific SMA lines with distinct colors and optional labels for quick interpretation.
Multi-Narrative Comparison: Analyze trends across diverse narratives to identify emerging opportunities.
Parameters for Customization:
RSI Period: Set the lookback period for RSI calculations (default: 14).
Line Width: Adjust the thickness of plotted lines (default: 2).
Label Offset: Control label placement for better chart readability.
Overbought/Oversold Thresholds: Configure the RSI levels for alerts (default: 70/40).
How to Use:
Add the script to your TradingView chart.
Customize the RSI parameters to suit your trading strategy.
Monitor the plotted SMA lines to identify narrative-specific trends.
Set alerts for overbought and oversold conditions to stay informed in real time.
Alerts System:
Alerts trigger when a narrative crosses predefined overbought or oversold levels.
Text notifications suggest potential trading actions, such as selling on overbought or buying on oversold.
Intended Users:
This script is ideal for crypto traders, sector analysts, and market enthusiasts who want to track performance across narratives and gain actionable insights into sector rotations.
Disclaimer:
This script is for educational and informational purposes only. It does not constitute financial advice. Please test on historical data and practice caution when trading.
In den Scripts nach "东方财富的AI短线宝坑爹" suchen
Crypto Sectors Performance [Daveatt]IMPORTANT
⚠️ This script must be used on the Daily timeframe only.
OVERVIEW
This indicator brings the powerful sector analysis capabilities from velo.xyz/market's
Sector Performance chart to TradingView.
It enables traders to track and compare performance across the crypto market's major sectors, providing essential insights for sector rotation strategies and market analysis.
CALCULATION METHOD
The indicator calculates performance across six key crypto sectors: DeFi, Gaming, Layer 1s, Layer 2s, AI, and Memecoins.
For each sector, it computes a rolling percentage performance by averaging the performance of multiple representative tokens.
All sector performances are rebased to 0% at the start of each period, making relative comparisons clear and intuitive.
VISUALIZATION MODES
The script features two distinct visualization methods:
Plots Mode:
Displays continuous performance lines for each sector over time, ideal for tracking relative strength trends and sector momentum. Each sector has its own color-coded line with performance values clearly marked.
Bars Mode:
Presents current sector performance as vertical bars, offering an immediate visual comparison of sector gains and losses.
The bars are color-coded and labeled with exact percentage values for precise analysis.
For the "Bars Mode", I used the box.new() function
SECTOR COMPOSITION
Each sector comprises carefully selected representative tokens:
- DeFi: AAVE, 1INCH, JUP, MKR, UNI
- Gaming: GALA, AXS, RONIN, SAND
- Layer 1: BTC, ETH, AVAX, APT, SOL, BNB, SUI
- Layer 2: ARB, OP, ZK, POL, STRK, MNT
- AI: FET, NEAR, RENDER, TAO
- Memecoins: PEPE, BONK, SHIB, DOGE, WIFU, POPCAT
PERFORMANCE TRACKING
The indicator implements a rolling window approach for performance calculations.
Starting from 0% at the beginning of each period, it tracks relative performance with positive values indicating outperformance and negative values showing underperformance.
Multiple timeframe options (1W, 1M, 3M, 6M, and 1Y) allow for both short-term and long-term analysis.
APPLICATIONS
This tool proves invaluable for:
- Sector rotation analysis
- Identifying trending sectors
- Comparing relative strength
- Gauging market sentiment
- Understanding market structure through sector performance
Thanks for reading and for the support
Daveatt

Altcoin ManagerThe Altcoin Manager is a comprehensive script for identifying the current altcoin narrative by tracking and analyzing of a wide array of altcoins across various blockchain layers and categories, such as DeFi, GameFi, AI, and Meme coins. Ideal for traders looking to get a broad yet detailed view of the altcoin market, covering various sectors and chains.
The Key Features:
Versatile Asset Tracking:
Tracks 40 different cryptocurrencies (as of publishing) across different categories, allowing for a diversified and detailed analysis of the altcoin market.
Customizable Assets and Category Analysis:
Select 20 of your own coins across 4 different categories such as DeFi, GameFi, AI, and Meme coins as well as specifying their individual chains.
Dynamic Layer and Chain Analysis:
Includes options to plot and analyze specific blockchain layers and chains such as Ethereum Chain, Solana Chain, BNB Smart Chain, Arbitrum Chain, and Polygon Chain. The script associates various assets with specific blockchains, providing a clearer picture of how different segments of the altcoin market are performing.
Cumulative and Per-Candle Change:
Switch between viewing the total cumulative change since a set start date or the per-candle change, offering flexibility in analyzing price movements over different timeframes.
Denomination Adjustment:
Includes a functionality to denominate asset prices in other currencies or crypto such as BTC, allowing for a more tailored financial analysis according to your preference.
Moving Averages for Categories and Chains:
Calculates and plots moving averages for each category and chain, aiding in the identification of trends over the selected moving average length.
How do I use it?
This script is not used with any particular chart. Instead, assign it it's own tab and layout.
For a clearer analysis, use multiple different panels to track Categories and Chains separately, both Cumulative for a longer term analysis and Per-Candle to find ongoing breakouts and changes in trend.
You can either use the pre-selected altcoins to represent the market, or you can select your own.
The Layer 1 and Layer 2 are not customizable but consists of 15 popular Layer 1 incl Bitcoin, Ethereum, Solana etc. Layer 2 consists of 5 popular Layer 2.

DojiCandle body size RSI-SMMA filter MTF
DojiCandle body size RSI-SMMA filter MTF
Hi. I was inspired by a public script written by @ahmedirshad419, .
I thank him for his idea and hard work.
His script is the combination of RSI and Engulfing Pattern.
//------------------------------------------------------------
I decided to tweak it a bit with Open IA.
I have changed:
1) candle pattern to DojiCandle Pattern;
2) I added the ability for the user to change the size of the candlestick body;
3) Added SMMA 200;
4) Changed the colour of SMMA 200 depending on price direction;
5) Added a change in the colour of candlesticks, depending on the colour of the SMMA 200;
6) Added buy and sell signals with indicator name, ticker and close price;
7) Added ability to use indicator on multi time frame.
How it works
1. when RSI > 70 > SMMA 200 and form the bullish DojiCandle Pattern. It gives sell signal
2. when RSI < 30 < SMMA 200 and form the bearish DojiCandle Pattern. It gives buy signal
settings:
basic setting for RSI, SMMA 200 has been enabled in the script to set the levels accordingly to your trades
Enjoy

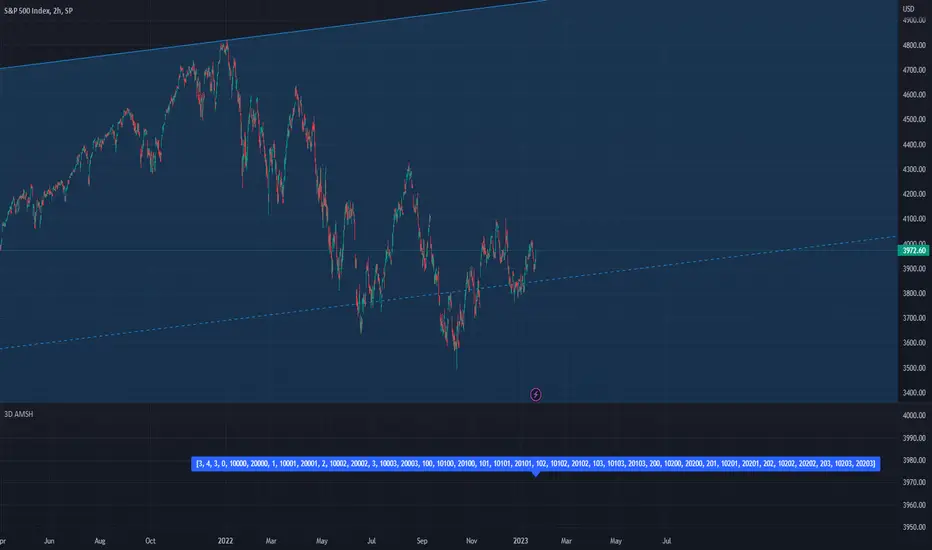
PSv5 3D Array/Matrix Super Hack"In a world of ever pervasive and universal deceit, telling a simple truth is considered a revolutionary act."
INTRO:
First, how about a little bit of philosophic poetry with another dimension applied to it?
The "matrix of control" is everywhere...
It is all around us, even now in the very place you reside. You can see it when you look at your digitized window outwards into the world, or when you turn on regularly scheduled television "programs" to watch news narratives and movies that subliminally influence your thoughts, feelings, and emotions. You have felt it every time you have clocked into dead end job workplaces... when you unknowingly worshiped on the conformancy alter to cultish ideologies... and when you pay your taxes to a godvernment that is poisoning you softly and quietly by injecting your mind and body with (psyOps + toxicCompounds). It is a fictitiously generated world view that has been pulled over your eyes to blindfold, censor, and mentally prostrate you from spiritually hearing the real truth.
What TRUTH you must wonder? That you are cognitively enslaved, like everyone else. You were born into mental bondage, born into an illusory societal prison complex that you are entirely incapable of smelling, tasting, or touching. Its a contrived monetary prison enterprise for your mind and eternal soul, built by pretending politicians, corporate CONartists, and NonGoverning parasitic Organizations deploying any means of infiltration and deception by using every tactic unimaginable. You are slowly being convinced into becoming a genetically altered cyborg by acclimation, socially engineered and chipped to eventually no longer be 100% human.
Unfortunately no one can be told eloquently enough in words what the matrix of control truly is. You have to experience it and witness it for yourself. This is your chance to program a future paradigm that doesn't yet exist. After visiting here, there is absolutely no turning back. You can continually take the blue pill BIGpharmacide wants you to repeatedly intake. The story ends if you continually sleep walk through a 2D hologram life, believing whatever you wish to believe until you cease to exist. OR, you can take the red pill challenge, explore "question every single thing" wonderland, program your arse off with 3D capabilities, ultimately ascertaining a new mathematical empyrean. Only then can you fully awaken to discover how deep the rabbit hole state of affairs transpire worldwide with a genuine open mind.
Remember, all I'm offering is a mathematical truth, nothing more...
PURPOSE:
With that being said above, it is now time for advanced developers to start creating their own matrix constructs in 3D, in Pine, just as the universe is created spatially. For those of you who instantly know what this script's potential is easily capable of, you already know what you have to do with it. While this is simplistically just a 3D array for either integers or floats, additional companion functions can in the future be constructed by other members to provide a more complete matrix/array library for millions of folks on TV. I do encourage the most courageous of mathemagicians on TV to do so. I have been employing very large 2D/3D array structures for quite some time, and their utility seems to be of great benefit. Discovering that for myself, I fully realized that Pine is incomplete and must be provided with this agility to process complex datasets that traders WILL use in the future. Mark my words!
CONCEPTION:
While I have long realized and theorized this code for a great duration of time, I was finally able to turn it into a Pine reality with the assistance and training of an "artificially intuitive" program while probing its aptitude. Even though it knows virtually nothing about Pine Script 4.0 or 5.0 syntax, functions, and behavior, I was able to conjure code into an identity similar to what you see now within a few minutes. Close enough for me! Many manual edits later for pine compliance, and I had it in chart, presto!
While most people consider the service to be an "AI", it didn't pass my Pine Turing test. I did have to repeatedly correct it, suffered through numerous apologies from it, was forced to use specifically tailored words, and also rationally debate AND argued with it. It is a handy helper but beware of generating Pine code from it, trust me on this one. However... this artificially intuitive service is currently available in its infancy as version 3. Version 4 most likely will have more diversity to enhance my algorithmic expertise of Pine wizardry. I do have to thank E.M. and his developers for an eye opening experience, or NONE of this code below would be available as you now witness it today.
LIMITATIONS:
As of this initial release, Pine only supports 100,000 array elements maximum. For example, when using this code, a 50x50x40 element configuration will exceed this limit, but 50x50x39 will work. You will always have to keep that in mind during development. Running that size of an array structure on every single bar will most likely time out within 20-40 seconds. This is not the most efficient method compared to a real native 3D array in action. Ehlers adepts, this might not be 100% of what you require to "move forward". You can try, but head room with a low ceiling currently will be challenging to walk in for now, even with extremely optimized Pine code.
A few common functions are provided, but this can be extended extensively later if you choose to undertake that endeavor. Use the code as is and/or however you deem necessary. Any TV member is granted absolute freedom to do what they wish as they please. I ultimately wish to eventually see a fully equipped library version for both matrix3D AND array3D created by collaborative efforts that will probably require many Pine poets testing collectively. This is just a bare bones prototype until that day arrives. Considerably more computational server power will be required also. Anyways, I hope you shall find this code somewhat useful.
Notice: Unfortunately, I will not provide any integration support into members projects at all. I have my own projects that require too much of my time already.
POTENTIAL APPLICATIONS:
The creation of very large coefficient 3D caches/buffers specifically at bar_index==0 can dramatically increase runtime agility for thousands of bars onwards. Generating 1000s of values once and just accessing those generated values is much faster. Also, when running dozens of algorithms simultaneously, a record of performance statistics can be kept, self-analyzed, and visually presented to the developer/user. And, everything else under the sun can be created beyond a developers wildest dreams...
EPILOGUE:
Free your mind!!! And unleash weapons of mass financial creation upon the earth for all to utilize via the "Power of Pine". Flying monkeys and minions are waging economic sabotage upon humanity, decimating markets and exchanges. You can always see it your market charts when things go horribly wrong. This is going to be an astronomical technical challenge to continually navigate very choppy financial markets that are increasingly becoming more and more unstable and volatile. Ordinary one plot algorithms simply are not enough anymore. Statistics and analysis sits above everything imagined. This includes banking, godvernment, corporations, REAL science, technology, health, medicine, transportation, energy, food, etc... We have a unique perspective of the world that most people will never get to see, depending on where you look. With an ever increasingly complex world in constant dynamic flux, novel ways to process data intricately MUST emerge into existence in order to tackle phenomenal tasks required in the future. Achieving data analysis in 3D forms is just one lonely step of many more to come.
At this time the WesternEconomicFraudsters and the WorldHealthOrders are attempting to destroy/reset the world's financial status in order to rain in chaos upon most nations, causing asset devaluation and hyper-inflation. Every form of deception, infiltration, and theft is occurring with a result of destroyed wealth in preparation to consolidate it. Open discussions, available to the public, by world leaders/moguls are fantasizing about new dystopian system as a one size fits all nations solution of digitalID combined with programmableDemonicCurrencies to usher in a new form of obedient servitude to a unipolar digitized hegemony of monetary vampires. If they do succeed with economic conquest, as they have publicly stated, people will be converted into human cattle, herded within smart cities, you will own nothing, eat bugs for breakfast/lunch/dinner, live without heat during severe winter conditions, and be happy. They clearly haven't done the math, as they are far outnumbered by a ratio of 1 to millions. Sith Lords do not own planet Earth! The new world disorder of human exploitation will FAIL. History, my "greatest teacher" for decades reminds us over, and over, and over again, and what are time series for anyways? They are for an intense mathematical analysis of prior historical values/conditions in relation to today's values/conditions... I imagine one day we will be able to ask an all-seeing AI, "WHO IS TO BLAME AND WHY AND WHEN?" comprised of 300 pages in great detail with images, charts, and statistics.
What are the true costs of malignant lies? I will tell you... 64bit numbers are NOT even capable of calculating the extreme cost of pernicious lies and deceit. That's how gigantic this monstrous globalization problem has become and how awful the "matrix of control" truly is now. ALL nations need a monumental revision of its CODE OF ETHICS, and that's definitely a multi-dimensional problem that needs solved sooner than later. If it was up to me, economies and technology would be developed so extensively to eliminate scarcity and increase the standard of living so high, that the notion of war and conflict would be considered irrelevant and extremely appalling to the future generations of humanity, our grandchildren born and unborn. The future will not be owned and operated by geriatric robber barons destined to expire quickly. The future will most likely be intensely "guided" by intelligent open source algorithms that youthful generations will inherit as their birth right.
P.S. Don't give me that politco-my-diction crap speech below in comments. If they weren't meddling with economics mucking up 100% of our chart results in 100% of tickers, I wouldn't have any cause to analyze any effects generated by them, nor provide this script's code. I am performing my analytical homework, but have you? Do you you know WHY international affairs are in dire jeopardy? Without why, the "Power of Pine" would have never existed as it specifically does today. I'm giving away much of my mental power generously to TV members so you are specifically empowered beyond most mathematical agilities commonly existing. I'm just a messenger of profound ideas. Loving and loathing of words is ALWAYS in the eye of beholders, and that's why the freedom of speech is enshrined as #1 in the constitutional code of the USA. Without it, this entire site might not have been allowed to exist from its founder's inceptions.
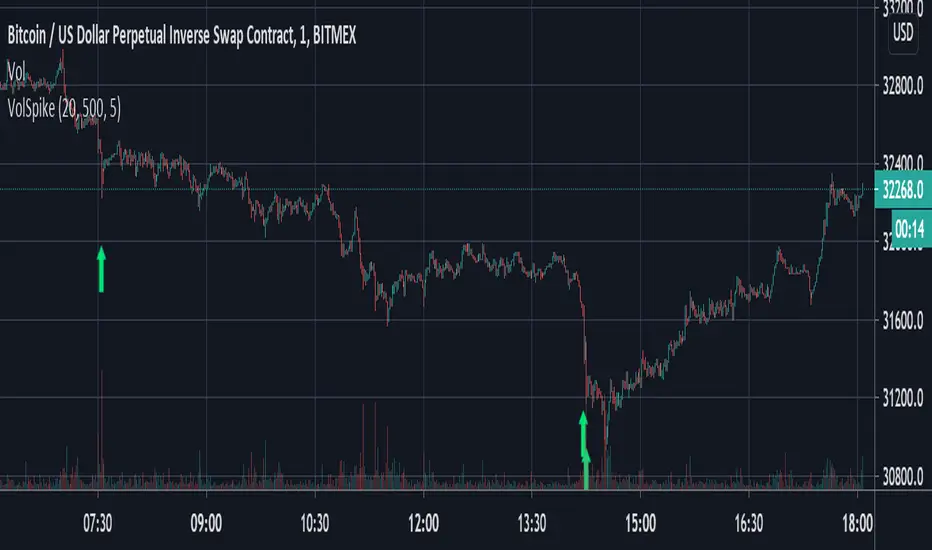
Volume Spike Strategy This is a Pine Script implementation of “Capitalize AI: Volume Spike Strategy" by Bitcoin Trading Challenge (copied with permission).
Original Capital AI formula :
If BTC/USD 1 minute volume > BTC/USD average volume in 20-1m bar by at least 500% and if BTC/USD is below the MA (5,1m,close) of BTC/USD then buy 10,000 USD WORTH of BTC/USD
Tested on XBTUSD 1 minute.
Original strategy is buy-only. Option for sells was added (enable in settings).
First published script -- comments/feedback appreciated
Well Rounded Moving AverageIntroduction
There are tons of filters, way to many, and some of them are redundant in the sense they produce the same results as others. The task to find an optimal filter is still a big challenge among technical analysis and engineering, a good filter is the Kalman filter who is one of the more precise filters out there. The optimal filter theorem state that : The optimal estimator has the form of a linear observer , this in short mean that an optimal filter must use measurements of the inputs and outputs, and this is what does the Kalman filter. I have tried myself to Kalman filters with more or less success as well as understanding optimality by studying Linear–quadratic–Gaussian control, i failed to get a complete understanding of those subjects but today i present a moving average filter (WRMA) constructed with all the knowledge i have in control theory and who aim to provide a very well response to market price, this mean low lag for fast decision timing and low overshoots for better precision.
Construction
An good filter must use information about its output, this is what exponential smoothing is about, simple exponential smoothing (EMA) is close to a simple moving average and can be defined as :
output = output(1) + α(input - output(1))
where α (alpha) is a smoothing constant, typically equal to 2/(Period+1) for the EMA.
This approach can be further developed by introducing more smoothing constants and output control (See double/triple exponential smoothing - alpha-beta filter) .
The moving average i propose will use only one smoothing constant, and is described as follow :
a = nz(a ) + alpha*nz(A )
b = nz(b ) + alpha*nz(B )
y = ema(a + b,p1)
A = src - y
B = src - ema(y,p2)
The filter is divided into two components a and b (more terms can add more control/effects if chosen well) , a adjust itself to the output error and is responsive while b is independent of the output and is mainly smoother, adding those components together create an output y , A is the output error and B is the error of an exponential moving average.
Comparison
There are a lot of low-lag filters out there, but the overshoots they induce in order to reduce lag is not a great effect. The first comparison is with a least square moving average, a moving average who fit a line in a price window of period length .
Lsma in blue and WRMA in red with both length = 100 . The lsma is a bit smoother but induce terrible overshoots
ZLMA in blue and WRMA in red with both length = 100 . The lag difference between each moving average is really low while VWRMA is way more precise.
Hull MA in blue and WRMA in red with both length = 100 . The Hull MA have similar overshoots than the LSMA.
Reduced overshoots moving average (ROMA) in blue and WRMA in red with both length = 100 . ROMA is an indicator i have made to reduce the overshoots of a LSMA, but at the end WRMA still reduce way more the overshoots while being smoother and having similar lag.
I have added a smoother version, just activate the extra smooth option in the indicator settings window. Here the result with length = 200 :
This result is a little bit similar to a 2 order Butterworth filter. Our filter have more overshoots which in this case could be useful to reduce the error with edges since other low pass filters tend to smooth their amplitude thus reducing edge estimation precision.
Conclusions
I have presented a well rounded filter in term of smoothness/stability and reactivity. Try to add more terms to have different results, you could maybe end up with interesting results, if its the case share them with the community :)
As for control theory i have seen neural networks integrated to Kalman flters which leaded to great accuracy, AI is everywhere and promise to be a game a changer in real time data smoothing. So i asked myself if it was possible for a neural networks to develop pinescript indicators, if yes then i could be replaced by AI ? Brrr how frightening.
Thanks for reading :)

Analog Flow [KedArc Quant]🧭Overview
AnalogFlow is an advanced analogue-based market projection engine that reconstructs future price tendencies by matching current price behavior to historical analogues in the same instrument. Instead of using traditional indicators (moving averages, RSI, or regression), AnalogFlow applies pattern vector similarity analysis — a data-driven technique that identifies historically similar sequences and aggregates their subsequent movements into a smooth, forward-looking curve.
Think of it as a market memory system:
If the current pattern looks like one we’ve seen before, how did price move afterward?
💡 Why AnalogFlow Is Unique
- Pattern-centric — it doesn’t rely on any standard indicator formula; it directly analyzes price movement vectors.
- Adaptive — it learns from the same instrument’s past behavior, making it self-calibrating to volatility and regime shifts.
- Non-repainting — the projection is generated on the latest completed bar and remains fixed until new data is available.
- Noise-resistant — the EMA-Blend engine smooths the projected trajectory, reducing random variance between analogues.
This isn’t a combination of existing tools — it’s an original implementation of analogue-based projection theory
⚙️ Inputs & Configuration
Pattern Bars
Number of bars in the reference pattern window 40
Projection Bars
Number of bars forward to project 30
Search Depth
Number of bars back to look for matching analogues 600
Distance Metric
Comparison method: `Euclidean`, `Manhattan`, or `Cosine` Euclidean
Matches
Number of top analogues to blend (1–5) Top-3
Build Mode
Projection type: `Cumulative`, `MeanStep`, or `EMA-Blend` EMA-Blend
EMA Blend Length
Smoothness of the projected path 15
Normalize Pattern
Enable Z-score normalization for shape matching true
Dissimilarity Mode
If true, finds inverse analogues (mean-reversion analysis) false
Line Color / Width
Style settings for projection curve Blue / 2
📈 How It Works with Past Data
- The system builds a memory bank of patterns from the last N bars
- It compares the latest Pattern Bars segment to each historical segment.
- It selects the Top-K most similar (or dissimilar) analogues.
- For each analogue, it retrieves what happened after that pattern historically.
- It averages or smooths those forward moves into a single composite forecast curve.
- The forecast (blue line) is drawn ahead of the current candle.
🔍 Output Explained
Blue Path:
The weighted mean future trajectory based on historical analogues.
Smoother when EMA-Blend mode is on.
Flat Section:
Indicates low directional consensus or equilibrium across analogues.
Upward / Downward Slope:
Historical tendency toward continuation or reversal following similar conditions.
📆 Recommended Timeframes
Scalping / Short-term
1m–5m --> Short `winLen` (20–30), small `ahead` (10–15)
Swing Trading
15m–1h --> Balanced settings (winLen=40–60, ahead=20–30)
Positional / Multi-Day
4h–1D --> Large windows (winLen=80–120, ahead=30–50)
🌍 Instrument Compatibility
✅ Works seamlessly on:
- Stocks / ETFs
- Indices
- Cryptocurrency
- Commodities (Gold, Crude, etc.)
- Futures & F&O (both intraday and positional)
- Forex
No symbol-specific calibration needed — it self-adapts to volatility.
🧭 How Traders Can Use It
Use Case
Forecast Context
- Identify likely short-term price path or drift direction.
Reversal Detection
- Flip `seekOpp` to true for mean-reversion pattern analysis.
Scenario Comparison
- Observe whether current regime tends to continue or stall.
Momentum Confirmation
- Combine with trend tools (e.g., EMA or MACD) for direction bias.
Backtesting Support
- Compare projected path vs. realized price to evaluate reliability.
❓ FAQ
Q1. Does AnalogFlow repaint?
→ No. It calculates only once per completed bar and projects forward. Future path remains static until a new bar closes.
Q2. Is it a neural network or AI model?
→ Not in the ML sense — it’s a deterministic analogue-matching engine using statistical distance metrics.
Q3. Why does the projection sometimes flatten?
→ That means similar historical setups had no clear consensus in direction (neutral expectation).
Q4. Can I use it for live trading signals?
→ AnalogFlow is not a signal generator. It provides *probabilistic context* for upcoming movement.
Q5. Does higher `scanDepth` improve accuracy?
→ Up to a point. More depth gives more analogues, but too much can dilute recency. Try 400–800.
📘 Glossary
Analogue
A past pattern similar to the current price behavior.
Distance Metric
Mathematical formula for pattern similarity.
Step Vector
Difference between consecutive closing prices.
EMA-Blend
Exponential smoothing of projected path.
Cumulative Mode
Adds sequential historical deltas directly.
Z-Score Normalization
Rescaling to mean 0, variance 1 for shape comparison.
🧩 Summary
AnalogFlow converts the market’s historical echoes into a structured, statistically weighted forward projection. It gives traders a contextual roadmap — not a signal — showing how similar past setups evolved, allowing better-informed entries, exits, and scenario planning across all asset classes.
⚠️ Disclaimer
This script is provided for educational purposes only.
Past performance does not guarantee future results.
Trading involves risk, and users should exercise caution and use proper risk management when applying this strategy.

Fusion Indicator FI-1 • All-in-OneAgain I asked to my dear AI friend to create 1 indicator rules them all.

Crypto Breadth Engine [alex975]
A normalized crypto market breadth indicator with a customizable 40 coin input panel — revealing whether rallies are broad and healthy across major coins and altcoins or led by only a few.
📊 Overview
The Crypto Breadth Engine measures the real participation strength of the crypto market by analyzing the direction of the 40 largest cryptocurrencies by market capitalization.
⚙️ How It Works
Unlike standard breadth tools that only count assets above a moving average, this indicator measures actual price direction:
+1 if a coin closes higher, –1 if lower, 0 if unchanged.
The total forms a Breadth Line, statistically normalized using standard deviation to maintain consistent readings across timeframes and volatility conditions.
🧩 Dynamic Input Mask
All 40 cryptocurrencies are fully editable via the input panel, allowing users to easily replace or customize the basket (Top 40, Layer-1s, DeFi, Meme Coins, AI Tokens, etc.) without touching the code.
This flexibility keeps the indicator aligned with the evolving crypto market.
🧭 Trend Bias
The indicator classifies market structure as Bullish, Neutral, or Bearish, based on how the Breadth Line aligns with its moving averages (10, 20, 50).
💡 Dashboard
A compact on-chart table displays in real time:
• Positive and negative coins
• Participation percentage
• Current trend bias
🔍 Interpretation
• Rising breadth → broad, healthy market expansion
• Falling breadth → narrowing participation and structural weakness
Ideal for TOTAL, TOTAL3, or custom crypto baskets on 1D,1W.
Developed by alex975 – Version 1.0 (2025).
-------------------------------------------------------------------------------------
🇮🇹 Versione Italiana
📊 Panoramica
Il Crypto Breadth Engine misura la partecipazione reale del mercato crypto, analizzando la direzione delle 40 principali criptovalute per capitalizzazione.
Non si limita a contare quante coin sono sopra una media mobile, ma calcola la variazione effettiva del prezzo:
+1 se sale, –1 se scende, 0 se invariato.
La somma genera una Breadth Line normalizzata statisticamente, garantendo letture coerenti su diversi timeframe e fasi di volatilità.
🧩 Mascherina dinamica
L’indicatore include una mascherina d’input interattiva che consente di modificare o sostituire liberamente i 40 ticker analizzati (Top 40, Layer-1, DeFi, Meme Coin, ecc.) senza intervenire nel codice.
Questo lo rende sempre aggiornato e adattabile all’evoluzione del mercato crypto.
⚙️ Funzionamento e Trend Bias
Classifica automaticamente il mercato come Bullish, Neutral o Bearish in base alla relazione tra la breadth e le medie mobili (10, 20, 50 periodi).
💡 Dashboard
Una tabella compatta mostra in tempo reale:
• Numero di coin positive e negative
• Percentuale di partecipazione
• Stato attuale del trend
🔍 Interpretazione
• Breadth in crescita → mercato ampio e trend sano
• Breadth in calo → partecipazione ridotta e concentrazione su pochi asset
Ideale per analizzare TOTAL, TOTAL3 o panieri personalizzati di crypto.
Funziona su timeframe 1D, 4H, 1W.
Sviluppato da alex975 – Versione 1.0 (2025).

Reliable Trend-Momentum Confluence [GPT-5] (BIGAL)I am tired of fake buy and sell alert charts ,I asked to my fellow AI friend for %99 accuracy not 100%


Luxy BIG beautiful Dynamic ORBThis is an advanced Opening Range Breakout (ORB) indicator that tracks price breakouts from the first 5, 15, 30, and 60 minutes of the trading session. It provides complete trade management including entry signals, stop-loss placement, take-profit targets, and position sizing calculations.
The ORB strategy is based on the concept that the opening range of a trading session often acts as support/resistance, and breakouts from this range tend to lead to significant moves.
What Makes This Different?
Most ORB indicators simply draw horizontal lines and leave you to figure out the rest. This indicator goes several steps further:
Multi-Stage Tracking
Instead of just one ORB timeframe, this tracks FOUR simultaneously (5min, 15min, 30min, 60min). Each stage builds on the previous one, giving you multiple trading opportunities throughout the session.
Active Trade Management
When a breakout occurs, the indicator automatically calculates and displays entry price, stop-loss, and multiple take-profit targets. These lines extend forward and update in real-time until the trade completes.
Cycle Detection
Unlike indicators that only show the first breakout, this tracks the complete cycle: Breakout → Retest → Re-breakout. You can see when price returns to test the ORB level after breaking out (potential re-entry).
Failed Breakout Warning
If price breaks out but quickly returns inside the range (within a few bars), the label changes to "FAILED BREAK" - warning you to exit or avoid the trade.
Position Sizing Calculator
Built-in risk management that tells you exactly how many shares to buy based on your account size and risk tolerance. No more guessing or manual calculations.
Advanced Filtering
Optional filters for volume confirmation, trend alignment, and Fair Value Gaps (FVG) to reduce false signals and improve win rate.
Core Features Explained
### 1. Multi-Stage ORB Levels
The indicator builds four separate Opening Range levels:
ORB 5 - First 5 minutes (fastest signals, most volatile)
ORB 15 - First 15 minutes (balanced, most popular)
ORB 30 - First 30 minutes (slower, more reliable)
ORB 60 - First 60 minutes (slowest, most confirmed)
Each level is drawn as a horizontal range on your chart. As time progresses, the ranges expand to include more price action. You can enable or disable any stage and assign custom colors to each.
How it works: During the opening minutes, the indicator tracks the highest high and lowest low. Once the time period completes, those levels become your ORB high and low for that stage.
### 2. Breakout Detection
When price closes outside the ORB range, a label appears:
BREAK UP (green label above price) - Price closed above ORB High
BREAK DOWN (red label below price) - Price closed below ORB Low
The label shows which ORB stage triggered (ORB5, ORB15, etc.) and the cycle number if tracking multiple breakouts.
Important: Signals appear on bar close only - no repainting. What you see is what you get.
### 3. Retest Detection
After price breaks out and moves away, if it returns to test the ORB level, a "RETEST" label appears (orange). This indicates:
The original breakout level is now acting as support/resistance
Potential re-entry opportunity if you missed the first breakout
Confirmation that the level is significant
The indicator requires price to move a minimum distance away before considering it a valid retest (configurable in settings).
### 4. Failed Breakout Detection
If price breaks out but returns inside the ORB range within a few bars (before the breakout is "committed"), the original label changes to "FAILED BREAK" in orange.
This warns you:
The breakout lacked conviction
Consider exiting if already in the trade
Wait for better setup
Committed Breakout: The indicator tracks how many bars price stays outside the range. Only after staying outside for the minimum number of bars does it become a committed breakout that can be retested.
### 5. TP/SL Lines (Trade Management)
When a breakout occurs, colored horizontal lines appear showing:
Entry Line (cyan for long, orange for short) - Your entry price (the ORB level)
Stop Loss Line (red) - Where to exit if trade goes against you
TP1, TP2, TP3 Lines (same color as entry) - Profit targets at 1R, 2R, 3R
These lines extend forward as new bars form, making it easy to track your trade. When a target is hit, the line turns green and the label shows a checkmark.
Lines freeze (stop updating) when:
Stop loss is hit
The final enabled take-profit is hit
End of trading session (optional setting)
### 6. Position Sizing Dashboard
The dashboard (bottom-left corner by default) shows real-time information:
Current ORB stage and range size
Breakout status (Inside Range / Break Up / Break Down)
Volume confirmation (if filter enabled)
Trend alignment (if filter enabled)
Entry and Stop Loss prices
All enabled Take Profit levels with percentages
Risk/Reward ratio
Position sizing: Max shares to buy and total risk amount
Position Sizing Example:
If your account is $25,000 and you risk 1% per trade ($250), and the distance from entry to stop loss is $0.50, the calculator shows you can buy 500 shares (250 / 0.50 = 500).
### 7. FVG Filter (Fair Value Gap)
Fair Value Gaps are price inefficiencies - gaps left by strong momentum where one candle's high doesn't overlap with a previous candle's low (or vice versa).
When enabled, this filter:
Detects bullish and bearish FVGs
Draws semi-transparent boxes around these gaps
Only allows breakout signals if there's an FVG near the breakout level
Why this helps: FVGs indicate institutional activity. Breakouts through FVGs tend to be stronger and more reliable.
Proximity setting: Controls how close the FVG must be to the ORB level. 2.0x means the breakout can be within 2 times the FVG size - a reasonable default.
### 8. Volume & Trend Filters
Volume Filter:
Requires current volume to be above average (customizable multiplier). High volume breakouts are more likely to sustain.
Set minimum multiplier (e.g., 1.5x = 50% above average)
Set "strong volume" multiplier (e.g., 2.5x) that bypasses other filters
Dashboard shows current volume ratio
Trend Filter:
Only shows breakouts aligned with a higher timeframe trend. Choose from:
VWAP - Price above/below volume-weighted average
EMA - Price above/below exponential moving average
SuperTrend - ATR-based trend indicator
Combined modes (VWAP+EMA, VWAP+SuperTrend) for stricter filtering
### 9. Pullback Filter (Advanced)
Purpose:
Waits for price to pull back slightly after initial breakout before confirming the signal.
This reduces false breakouts from immediate reversals.
How it works:
- After breakout is detected, indicator waits for a small pullback (default 2%)
- Once pullback occurs AND price breaks out again, signal is confirmed
- If no pullback within timeout period (5 bars), signal is issued anyway
Settings:
Enable Pullback Filter: Turn this filter on/off
Pullback %: How much price must pull back (2% is balanced)
Timeout (bars): Max bars to wait for pullback (5 is standard)
When to use:
- Choppy markets with many fake breakouts
- When you want higher quality signals
- Combine with Volume filter for maximum confirmation
Trade-off:
- Better signal quality
- May miss some valid fast moves
- Slight entry delay
How to Use This Indicator
### For Beginners - Simple Setup
Add the indicator to your chart (5-minute or 15-minute timeframe recommended)
Leave all default settings - they work well for most stocks
Watch for BREAK UP or BREAK DOWN labels to appear
Check the dashboard for entry, stop loss, and targets
Use the position sizing to determine how many shares to buy
Basic Trading Plan:
Wait for a clear breakout label
Enter at the ORB level (or next candle open if you're late)
Place stop loss where the red line indicates
Take profit at TP1 (50% of position) and TP2 (remaining 50%)
### For Advanced Traders - Customized Setup
Choose which ORB stages to track (you might only want ORB15 and ORB30)
Enable filters: Volume (stocks) or Trend (trending markets)
Enable FVG filter for institutional confirmation
Set "Track Cycles" mode to catch retests and re-breakouts
Customize stop loss method (ATR for volatile stocks, ORB% for stable ones)
Adjust risk per trade and account size for accurate position sizing
Advanced Strategy Example:
Enable ORB15 only (disable others for cleaner chart)
Turn on Volume filter at 1.5x with Strong at 2.5x
Enable Trend filter using VWAP
Set Signal Mode to "Track Cycles" with Max 3 cycles
Wait for aligned breakouts (Volume + Trend + Direction)
Enter on retest if you missed the initial break
### Timeframe Recommendations
5-minute chart: Scalping, very active trading, crypto
15-minute chart: Day trading, balanced approach (most popular)
30-minute chart: Swing entries, less screen time
60-minute chart: Position trading, longer holds
The indicator works on any intraday timeframe, but ORB is fundamentally a day trading strategy. Daily charts don't make sense for ORB.
DEFAULT CONFIGURATION
ON by Default:
• All 4 ORB stages (5/15/30/60)
• Breakout Detection
• Retest Labels
• All TP levels (1/1.5/2/3)
• TP/SL Lines (Detailed mode)
• Dashboard (Bottom Left, Dark theme)
• Position Size Calculator
OFF by Default (Optional Filters):
• FVG Filter
• Pullback Filter
• Volume Filter
• Trend Filter
• HTF Bias Check
• Alerts
Recommended for Beginners:
• Leave all defaults
• Session Mode: Auto-Detect
• Signal Mode: Track Cycles
• Stop Method: ATR
• Add Volume Filter if trading stocks
Recommended for Advanced:
• Enable ORB15 + ORB30 only (disable 5 & 60)
• Enable: Volume + Trend + FVG
• Signal Mode: Track Cycles, Max 3
• Stop Method: ATR or Safer
• Enable HTF Daily bias check
## Settings Guide
The settings are organized into logical groups. Here's what each section controls:
### ORB COLORS Section
Show Edge Labels: Display "ORB 5", "ORB 15" labels at the right edge of the levels
Background: Fill the area between ORB high/low with color
Transparency: How see-through the background is (95% is nearly invisible)
Enable ORB 5/15/30/60: Turn each stage on or off individually
Colors: Assign colors to each ORB stage for easy identification
### SESSION SETTINGS Section
Session Mode: Choose trading session (Auto-Detect works for most instruments)
Custom Session Hours: Define your own hours if needed (format: HHMM-HHMM)
Auto-Detect uses the instrument's natural hours (stocks use exchange hours, crypto uses 24/7).
### BREAKOUT DETECTION Section
Enable Breakout Detection: Master switch for signals
Show Retest Labels: Display retest signals
Label Size: Visual size for all labels (Small recommended)
Enable FVG Filter: Require Fair Value Gap confirmation
Show FVG Boxes: Display the gap boxes on chart
Signal Mode: "First Only" = one signal per direction per day, "Track Cycles" = multiple signals
Max Cycles: How many breakout-retest cycles to track (6 is balanced)
Breakout Buffer: Extra distance required beyond ORB level (0.1-0.2% recommended)
Min Distance for Retest: How far price must move away before retest is valid (2% recommended)
Min Bars Outside ORB: Bars price must stay outside for committed breakout (2 is balanced)
### TARGETS & RISK Section
Enable Targets & Stop-Loss: Calculate and show trade management
TP1/TP2/TP3 checkboxes: Select which profit targets to display
Stop Method: How to calculate stop loss placement
- ATR: Based on volatility (best for most cases)
- ORB %: Fixed % of ORB range
- Swing: Recent swing high/low
- Safer: Widest of all methods
ATR Length & Multiplier: Controls ATR stop distance (14 period, 1.5x is standard)
ORB Stop %: Percentage beyond ORB for stop (20% is balanced)
Swing Bars: Lookback period for swing high/low (3 is recent)
### TP/SL LINES Section
Show TP/SL Lines: Display horizontal lines on chart
Label Format: "Short" = minimal text, "Detailed" = shows prices
Freeze Lines at EOD: Stop extending lines at session close
### DASHBOARD Section
Show Info Panel: Display the metrics dashboard
Theme: Dark or Light colors
Position: Where to place dashboard on chart
Toggle rows: Show/hide specific information rows
Calculate Position Size: Enable the position sizing calculator
Risk Mode: Risk fixed $ amount or % of account
Account Size: Your total trading capital
Risk %: Percentage to risk per trade (0.5-1% recommended)
### VOLUME FILTER Section
Enable Volume Filter: Require volume confirmation
MA Length: Average period (20 is standard)
Min Volume: Required multiplier (1.5x = 50% above average)
Strong Volume: Multiplier that bypasses other filters (2.5x)
### TREND FILTER Section
Enable Trend Filter: Require trend alignment
Trend Mode: Method to determine trend (VWAP is simple and effective)
Custom EMA Length: If using EMA mode (50 for swing, 20 for day trading)
SuperTrend settings: Period and Multiplier if using SuperTrend mode
### HIGHER TIMEFRAME Section
Check Daily Trend: Display higher timeframe bias in dashboard
Timeframe: What TF to check (D = daily, recommended)
Method: Price vs MA (stable) or Candle Direction (reactive)
MA Period: EMA length for Price vs MA method (20 is balanced)
Min Strength %: Minimum strength threshold for HTF bias to be considered
- For "Price vs MA": Minimum distance (%) from moving average
- For "Candle Direction": Minimum candle body size (%)
- 0.5% is balanced - increase for stricter filtering
- Lower values = more signals, higher values = only strong trends
### ALERTS Section
Enable Alerts: Master switch (must be ON to use any alerts)
Breakout Alerts: Notify on ORB breakouts
Retest Alerts: Notify when price retests after breakout
Failed Break Alerts: Notify on failed breakouts
Stage Complete Alerts: Notify when each ORB stage finishes forming
After enabling desired alert types, click "Create Alert" button, select this indicator, choose "Any alert() function call".
## Tips & Best Practices
### General Trading Tips
ORB works best on liquid instruments (stocks with good volume, major crypto pairs)
First hour of the session is most important - that's when ORB is forming
Breakouts WITH the trend have higher success rates - use the trend filter
Failed breakouts are common - use the "Min Bars Outside" setting to filter weak moves
Not every day produces good ORB setups - be patient and selective
### Position Sizing Best Practices
Never risk more than 1-2% of your account on a single trade
Use the built-in calculator - don't guess your position size
Update your account size monthly as it grows
Smaller accounts: use $ Amount mode for simplicity
Larger accounts: use % of Account mode for scaling
### Take Profit Strategy
Most traders use: 50% at TP1, 50% at TP2
Aggressive: Hold through TP1 for TP2 or TP3
Conservative: Full exit at TP1 (1:1 risk/reward)
After TP1 hits, consider moving stop to breakeven
TP3 rarely hits - only on strong trending days
### Filter Combinations
Maximum Quality: Volume + Trend + FVG (fewest signals, highest quality)
Balanced: Volume + Trend (good quality, reasonable frequency)
Active Trading: No filters or Volume only (many signals, lower quality)
Trending Markets: Trend filter essential (indices, crypto)
Range-Bound: Volume + FVG (avoid trend filter)
### Common Mistakes to Avoid
Chasing breakouts - wait for the bar to close, don't FOMO into wicks
Ignoring the stop loss - always use it, move it manually if needed
Over-leveraging - the calculator shows MAX shares, you can buy less
Trading every signal - quality > quantity, use filters
Not tracking results - keep a journal to see what works for YOU
## Pros and Cons
### Advantages
Complete all-in-one solution - from signal to position sizing
Multiple timeframes tracked simultaneously
Visual clarity - easy to see what's happening
Cycle tracking catches opportunities others miss
Built-in risk management eliminates guesswork
Customizable filters for different trading styles
No repainting - what you see is locked in
Works across multiple markets (stocks, forex, crypto)
### Limitations
Intraday strategy only - doesn't work on daily charts
Requires active monitoring during first 1-2 hours of session
Not suitable for after-hours or extended sessions by default
Can produce many signals in choppy markets (use filters)
Dashboard can be overwhelming for complete beginners
Performance depends on market conditions (trends vs ranges)
Requires understanding of risk management concepts
### Best For
Day traders who can watch the first 1-2 hours of market open
Traders who want systematic entry/exit rules
Those learning proper position sizing and risk management
Active traders comfortable with multiple signals per day
Anyone trading liquid instruments with clear sessions
### Not Ideal For
Swing traders holding multi-day positions
Set-and-forget / passive investors
Traders who can't watch market open
Complete beginners unfamiliar with trading concepts
Low volume / illiquid instruments
## Frequently Asked Questions
Q: Why are no signals appearing?
A: Check that you're on an intraday timeframe (5min, 15min, etc.) and that the current time is within your session hours. Also verify that "Enable Breakout Detection" is ON and at least one ORB stage is enabled. If using filters, they might be blocking signals - try disabling them temporarily.
Q: What's the best ORB stage to use?
A: ORB15 (15 minutes) is most popular and balanced. ORB5 gives faster signals but more noise. ORB30 and ORB60 are slower but more reliable. Many traders use ORB15 + ORB30 together.
Q: Should I enable all the filters?
A: Start with no filters to see all signals. If too many false signals, add Volume filter first (stocks) or Trend filter (trending markets). FVG filter is most restrictive - use for maximum quality but fewer signals.
Q: How do I know which stop loss method to use?
A: ATR works for most cases - it adapts to volatility. Use ORB% if you want predictable stop placement. Swing is for respecting chart structure. Safer gives you the most room but largest risk.
Q: Can I use this for swing trading?
A: Not really - ORB is fundamentally an intraday strategy. The ranges reset each day. For swing trading, look at weekly support/resistance or moving averages instead.
Q: Why do TP/SL lines disappear sometimes?
A: Lines freeze (stop extending) when: stop loss is hit, the last enabled take-profit is hit, or end of session arrives (if "Freeze at EOD" is enabled). This is intentional - the trade is complete.
Q: What's the difference between "First Only" and "Track Cycles"?
A: "First Only" shows one breakout UP and one DOWN per day maximum - clean but might miss opportunities. "Track Cycles" shows breakout-retest-rebreak sequences - more signals but busier chart.
Q: Is position sizing accurate for options/forex?
A: The calculator is designed for shares (stocks). For options, ignore the share count and use the risk amount. For forex, you'll need to adapt the lot size calculation manually.
Q: How much capital do I need to use this?
A: The indicator works for any account size, but practical day trading typically requires $25,000 in the US due to Pattern Day Trader rules. Adjust the "Account Size" setting to match your capital.
Q: Can I backtest this strategy?
A: This is an indicator, not a strategy script, so it doesn't have built-in backtesting. You can visually review historical signals or code a strategy script using similar logic.
Q: Why does the dashboard show different entry price than the breakout label?
A: If you're looking at an old breakout, the ORB levels may have changed when the next stage completed. The dashboard always shows the CURRENT active range and trade setup.
Q: What's a good win rate to expect?
A: ORB strategies typically see 40-60% win rate depending on market conditions and filters used. The strategy relies on positive risk/reward ratios (2:1 or better) to be profitable even with moderate win rates.
Q: Does this work on crypto?
A: Yes, but crypto trades 24/7 so you need to define what "session start" means. Use Session Mode = Custom and set your preferred daily reset time (e.g., 0000-2359 UTC).
## Credits & Transparency
### Development
This indicator was developed with the assistance of AI technology to implement complex ORB trading logic.
The strategy concept, feature specifications, and trading logic were designed by the publisher. The implementation leverages modern development tools to ensure:
Clean, efficient, and maintainable code
Comprehensive error handling and input validation
Detailed documentation and user guidance
Performance optimization
### Trading Concepts
This indicator implements several public domain trading concepts:
Opening Range Breakout (ORB): Trading strategy popularized by Toby Crabel, Mark Fisher and many more talanted traders.
Fair Value Gap (FVG): Price imbalance concept from ICT methodology
SuperTrend: ATR-based trend indicator using public formula
Risk/Reward Ratio: Standard risk management principle
All mathematical formulas and technical concepts used are in the public domain.
### Pine Script
Uses standard TradingView built-in functions:
ta.ema(), ta.atr(), ta.vwap(), ta.highest(), ta.lowest(), request.security()
No external libraries or proprietary code from other authors.
## Disclaimer
This indicator is provided for educational and informational purposes only. It is not financial advice.
Trading involves substantial risk of loss and is not suitable for every investor. Past performance shown in examples is not indicative of future results.
The indicator provides signals and calculations, but trading decisions are solely your responsibility. Always:
Test strategies on paper before using real money
Never risk more than you can afford to lose
Understand that all trading involves risk
Consider seeking advice from a licensed financial advisor
The publisher makes no guarantees regarding accuracy, profitability, or performance. Use at your own risk.
---
Version: 3.0
Pine Script Version: v6
Last Updated: October 2024
For support, questions, or suggestions, please comment below or send a private message.
---
Happy trading, and remember: consistent risk management beats perfect entry timing every time.

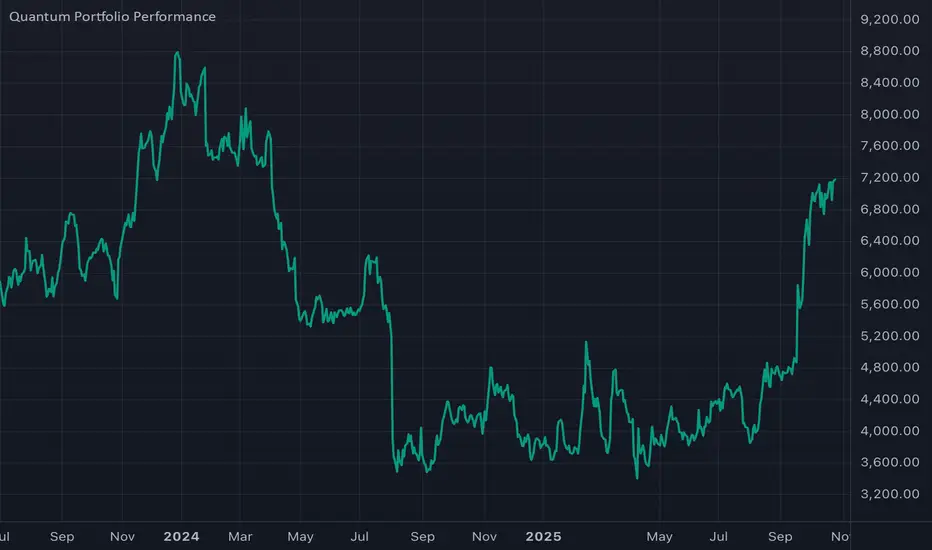
Thematic Portfolio: Quantum Computing & Core TechThis indicator tracks the aggregated performance of a curated thematic portfolio representing the Quantum Computing & Core Technology sector.
It combines leading equities and ETFs with predefined weights to reflect a diversified exposure across quantum hardware, AI infrastructure, and semiconductor backbones.
Composition:
Stocks: Rigetti (RGTI), IonQ (IONQ), D-Wave (QBTS), Palantir (PLTR), Intel (INTC), Arqit (ARQQ)
ETFs: BUG, QTUM, SOXX, IHAK
Methodology:
Each component’s normalized performance is weighted according to its strategic importance within the theme (R&D intensity, infrastructure leverage, and hardware dependence). The indicator dynamically aggregates the weighted series to visualize the cumulative return of the quantum computing ecosystem versus traditional benchmarks.
Intended use:
Compare thematic returns vs. S&P 500 or NASDAQ
Identify macro inflection points in the quantum tech narrative
Backtest thematic exposure strategies or structure twin-win / delta-one certificates
Note: This script is for analytical and educational purposes only and does not constitute financial advice.
Trading Toolkit - Comprehensive AnalysisTrading Toolkit – Comprehensive Analysis
A unified trading analysis toolkit with four sections:
📊 Company Info
Fundamentals, market cap, sector, and earnings countdown.
📅 Performance
Date‑range analysis with key metrics.
🎯 Market Sentiment
CNN‑style Fear & Greed Index (7 components) + 150‑SMA positioning.
🛡️ Risk Levels
ATR/MAD‑based stop‑loss and take‑profit calculations.
Key Features
CNN‑style Fear & Greed approximation using:
Momentum: S&P 500 vs 125‑DMA
Price Strength: NYSE 52‑week highs vs lows
Market Breadth: McClellan Volume Summation (Up/Down volume)
Put/Call Ratio: 5‑day average (inverted)
Volatility: VIX vs 50‑DMA (inverted)
Safe‑Haven Demand: 20‑day SPY–IEF return spread
Junk‑Bond Demand: HY vs IG credit spread (inverted)
Normalization: z‑score → percentile (0–100) with ±3 clipping.
CNN‑aligned thresholds:
Extreme Fear: 0–24 | Fear: 25–44 | Neutral: 45–54 | Greed: 55–74 | Extreme Greed: 75+.
Risk tools: ATR & MAD volatility measures with configurable multipliers.
Flexible layout: vertical or side‑by‑side columns.
Data Sources
S&P 500: CBOE:SPX or AMEX:SPY
NYSE: INDEX:HIGN, INDEX:LOWN, USI:UVOL, USI:DVOL
Options: USI:PCC (Total PCR), fallback INDEX:CPCS (Equity PCR)
Volatility: CBOE:VIX
Treasuries: NASDAQ:IEF
Credit Spreads: FRED:BAMLH0A0HYM2, FRED:BAMLC0A0CM
Risk Management
ATR risk bands: 🟢 ≤3%, 🟡 3–6%, ⚪ 6–10%, 🟠 10–15%, 🔴 >15%
MAD‑based stop‑loss and take‑profit calculations.
Author: Daniel Dahan
(AI Generated, Merged & enhanced version with CNN‑style Fear & Greed)

BTC Confluence Score + Confirmed Signals (12m/1h)This script combines 7 different signals across multiple timeframes (12 min + 1 hour + BTC dominance), then only gives you a BUY or SELL when everything aligns.
It’s designed to filter out fake-outs and help you catch momentum reversals that stick.
WHAT IT’S DOING UNDER THE HOOD
Timeframes
12 min (fast) → short-term trigger (RSI, Stoch RSI, volatility)
1 hour (slow) → trend confirmation (EMA structure, RSI, MACD)
BTC Dominance (1 h) → strength/flow confirmation (is capital rotating into BTC or alts?)
This gives you a multi-timeframe confluence, which is what professional traders look for before entering a trade.
2. The 7 “Score” Ingredients
Each bar gets a “score” from –7 (super bearish) to +7 (super bullish) based on:
# Condition Bullish signal (+1) Bearish signal (–1)
1 RSI (12m) RSI > 50 RSI < 50
2 RSI (1h) RSI > 50 RSI < 50
3 MACD Histogram > 0 Histogram < 0
4 BTC Dominance level > 59.8 % < 59.8 %
5 BTC Dominance trend 3 EMA > 8 EMA 3 EMA < 8 EMA
6 1h EMAs trend 50 EMA > 200 EMA and price > 50 EMA 50 EMA < 200 EMA and price < 50 EMA
7 Volatility (ATR) Current ATR > average (momentum increasing) —
The Confluence Score bar at the bottom shows this numerically:
💚 +5 to +7 → Strong bullish conditions
❤️ –5 to –7 → Strong bearish conditions
🩶 Between –2 and +2 → Choppy / neutral
3️⃣ Confirmed Entry Logic (the clear triangles you see now)
You’ll now see only two real actionable markers:
✅ BUY (Green Triangle Up)
Triggered when:
Stoch RSI crosses upward on 12 min
RSI > 50 (momentum confirmation)
MACD histogram > 0 (trend shift)
Confluence score ≥ 4 (default threshold)
This means momentum + trend + structure + volume all agree on an upward move.
→ Ideal for going long or closing shorts.
🚨 SELL (Red Triangle Down)
Triggered when:
Stoch RSI crosses downward
RSI < 50
MACD histogram < 0
Confluence score ≥ 4 bearish
That’s your exit / short confirmation.
4️⃣ Color Bars (Score Strength)
At the bottom of the chart:
💚 Green Bars = full bullish confluence (+5 or more)
💛 Lime/Orange Bars = moderate bullish or early reversal
❤️ Red Bars = strong bearish confluence (–5 or less)
🩶 Gray Bars = chop/no edge
If you prefer visual simplicity, just use:
BUY = Green Triangle appears on green bars
SELL = Red Triangle appears on red bars
That’s your “double confirmation.”
🎯 HOW TO TRADE IT
⏱ Timeframes
Use 12 min for entries (fast scalps or 1–2 hr setups).
Confirm direction with the 1 hour timeframe — only trade in that direction.
💰 Entry Playbook
Signal What to Do
✅ Green Triangle appears Enter long or scale in. Set stop below recent swing low.
🚨 Red Triangle appears Exit long / enter short / scale out.
Bars gray or alternating Stay out — market is undecided.
🧮 Min Score Setting
Default = 4 (balanced).
Raise to 5 for cleaner, fewer signals.
Lower to 3 for more aggressive, frequent trades.
📲 Alerts
You can now create TradingView alerts using:
BUY Confirmed
SELL Confirmed
Set alert type:
“Once per bar close” — so you only get notified after confirmation, not mid-bar noise.
Y ou now have your own BTC AI Confluence System:
Filters all noise from RSI, MACD, EMAs, volatility, and BTC dominance
Waits for perfect alignment across multiple timeframes
Gives you one simple green (BUY) or red (SELL) signal
Lets you scalp 1–2 % moves safely or swing trade confirmations

DAMMU AUTOMATICAL AI ENRTY AND TARGET AND EXITMain Components
Supertrend System –
Detects market trend direction (Buy/Sell zones).
→ Green = Uptrend (Buy)
→ Red = Downtrend (Sell)
SMA Filter –
Uses 50 & 200 moving averages to confirm overall trend.
→ Price above both → Bullish
→ Price below both → Bearish
Buy/Sell Signals –
Generated when Supertrend flips direction and SMA confirms.
→ Triangle up = Buy
→ Triangle down = Sell
Take Profit / Stop Loss Levels –
Automatically calculated after Buy/Sell entry.
→ TP1, TP2, SL shown on chart
ADX (Sideways Zone Filter) –
If ADX < 25 → Market sideways → Avoid trades
Shows “No Trade Zone” area
Smart Money Concepts (SMC) Tools –
🔹 Market structure (HH, HL, LH, LL)
🔹 Order blocks (OB)
🔹 Equal highs/lows
🔹 Fair Value Gaps (FVG)
🔹 Premium & Discount zones
Helps find institutional entry points
Visual Display –
Color-coded background (trend zones)
Labels for buy/sell/structure
Optional FVG and order block boxes
Risk Management –
Input-based position sizing, SL & TP management
(to calculate profit levels and minimize loss)

MACD AI Flux Pro Dashboard V. 2Acknowledgment
This indicator is built upon the MACD-V (Volatility-Normalized MACD) methodology originally created by Alex Spiroglou, CMT, whose research (2015–2022) introduced the principle of normalizing MACD momentum by volatility (MACD/ATR). Full acknowledgment and credit are hereby given to Mr. Spiroglou as the original author of the MACD-V concept and framework.
Indicator Overview — MACD-V Flux Pro Dashboard V.2
The MACD-V Flux Pro Dashboard advances Spiroglou’s volatility-normalized foundation into a comprehensive multi-system architecture that unifies momentum, trend, volatility, and compression analytics in one visual framework. It is engineered for precision decision-making in both intraday and swing-trading environments.
Key Dashboard Features:
Dynamic Probability Engine: Calculates real-time long and short probabilities by weighting momentum, slope, compression, and volume pressure components into a composite score.
Multi-Timeframe Confirmation (HTF Tiles): Displays live directional agreement across fast, mid, and slow timeframes for confidence filtering and signal validation.
Regime Detection System: Automatically classifies the market as Trend Up, Trend Down, Compression, or Transition, applying background color cues for instant context.
Risk and News Filters: Integrates ATR-based risk gating and customizable “mute windows” to block trade signals during high-volatility or scheduled news events.
VWAP and Adaptive Bands: Plots VWAP with configurable ATR or standard-deviation bands to highlight over-extension and pullback zones.
Trend-Day and Opening-Range Logic: Monitors RTH (Regular Trading Hours) price behavior to identify potential trend-day conditions.
Smart Entry Arrows: Generates visual long/short signals only when multiple subsystems confirm direction, slope strength, and proximity to VWAP within defined thresholds.
On-Chart Dashboard Panel: Presents live metrics including probability bias, regime state, ATR level, risk status, and news filters with adaptive color-coding and optional emoji cues for intuitive interpretation.
Chart Display Summary:
All elements are presented directly on the main chart, combining price structure, VWAP bands, EMAs, and regime background shading with the real-time dashboard panel. The design eliminates the need for a secondary pane, offering a consolidated and context-rich view of market dynamics
Dammu AI ADVANCED PRO1. Indicator Overview
Name: Dammu
Type: Overlay indicator (draws on price chart)
Purpose: Combines SuperTrend, SMA/EMA trends, Swing/Structure analysis, Order Blocks, Fair Value Gaps, High/Low levels, TP/SL labels, and alerts.
Pine Script Version: v5
2. SuperTrend Module
Computes SuperTrend line using ATR and sensitivity.
Signals:
Bullish: Price crosses above SuperTrend.
Bearish: Price crosses below SuperTrend.
Plots buy/sell labels 🚀🐻 based on SMA comparison and SuperTrend cross.
3. SMA/EMA Trend Components
SMA8 & SMA9: Used for additional trend confirmation.
EMA lines: Multiple EMAs with different multipliers for trend detection.
Trend Cloud: Uses Hull MA for trend smoothing.
4. Risk Management
TP/SL Levels: Automatic calculation of stop-loss and take-profit (TP1, TP2, TP3).
Configurable ATR-based risk percentage.
Lines and labels drawn for visual TP/SL.
5. Chart Features
Smooth Range Filter: Filters noise for trend detection.
Colored Trend Cloud: Upward trend = cyan, downward = red.
Sideways Market: ADX filter to color bars purple if trend is weak/sideways.
Bar Colors: Green/red based on SuperTrend signals.
6. Swing & Structure Analysis
Detects Swing Highs/Lows, labels as HH, LH, LL, HL.
Detects CHoCH (Change of Character) or BOS (Break of Structure).
Can show internal or swing structures with configurable label size and color.
7. Order Blocks (Smart Money Concepts)
Detects Internal Order Blocks (iOB) and Swing Order Blocks (OB).
Stores top/bottom/left/time/type in arrays.
Colors and shows boxes based on bullish/bearish type.
Automatically deletes OB if price breaks the block.
8. Fair Value Gaps (FVG)
Identifies gaps between candles as potential trading zones.
Configurable bullish/bearish colors and extension bars.
9. EQH/EQL (Equal Highs/Lows)
Detects equal highs/lows using a threshold.
Plots dotted lines and labels EQH/EQL.
10. High/Low Levels MTF
Optional plotting of previous daily, weekly, monthly highs/lows.
11. Premium/Discount Zones
Plots Premium, Discount, and Equilibrium Zones.
Colors: Premium = red, Discount = green, Equilibrium = gray.
12. Alerts
Buy/Sell alerts for:
SuperTrend crossover
BOS/CHoCH (swing/internal)
EQH/EQL triggers
13. Miscellaneous
Configurable visuals: line style, label size, transparency.
Adjustable volatility filters, ATR lengths, smoothing constants.
Integrated risk & reward visualization.
✅ In short:
This is an all-in-one Smart Money + Trend indicator with SuperTrend signals, swing/structure detection, order blocks, FVGs, EQH/EQL, TP/SL visualization, and optional alerts. It’s designed for both trend-following and order-block-based trading.
If you want, I can make a super-short 1-paragraph version that summarizes it even faster for quick reference.

Dammu AI PROType & Purpose
Multi-functional trend, swing, and smart money concept indicator.
Combines SuperTrend, SMA, ATR-based risk management, swing structures, order blocks, EQH/EQL, and Fair Value Gaps (FVG).
Designed for identifying trends, entries/exits, and support/resistance zones.
2. Trend Detection
SuperTrend with ATR smoothing (nsensitivity*7 factor) for buy/sell signals.
SMA filter (8 & 9 periods) confirms trend strength.
Bar color changes:
Green if close > supertrend.
Red if close < supertrend.
Cirrus Cloud highlights trend zones with semi-transparent colors.
3. Swing & Structure
Detects pivot highs/lows and labels them as HH/LH (Highs), HL/LL (Lows).
Generates BOS (Break of Structure) and CHoCH (Change of Character) signals.
Internal swing structures and order blocks for short-term intraday moves.
4. Order Blocks
Internal Order Blocks (iOBs) and Swing Order Blocks (OBs).
Boxes drawn for bullish/bearish zones.
Auto-delete when broken.
Option to filter blocks by ATR or Cumulative Mean Range.
5. Risk Management
TP/SL levels based on ATR and user-defined % risk.
Shows lines and labels for:
Entry
Stop Loss
TP1, TP2, TP3
Adjustable line style (solid/dashed/dotted).
6. Fair Value Gaps (FVG)
Highlights bullish and bearish gaps.
Option for auto-threshold filtering.
Extendable FVG boxes.
7. EQH/EQL
Detects Equal Highs (EQH) and Equal Lows (EQL) for potential reversals.
Dotted lines with labels.
8. Smart Money Concepts (SMC) Features
Shows:
Swings (internal & swing structure)
Internal order blocks
Premium/Discount zones
Fair Value Gaps
Highs/Lows from previous day/week/month
Configurable for historical vs present display.
9. Alerts
Buy/Sell triggers:
bull = crossover of close above SuperTrend.
bear = crossunder of close below SuperTrend.
Alerts for BOS/CHoCH, EQH/EQL, and OB breaks.
10. Visualization
Trend clouds, colored bars, SMA markers, SuperTrend labels.
Multi-layered info displayed without cluttering the chart.
Customizable colors, line styles, and transparency.
✅ Summary:
This indicator is a comprehensive trading tool for trend detection, swing structure, order block analysis, and risk management. It’s built for smart money and SMC-based trading, offering visual cues and alerts for key trading decisions.

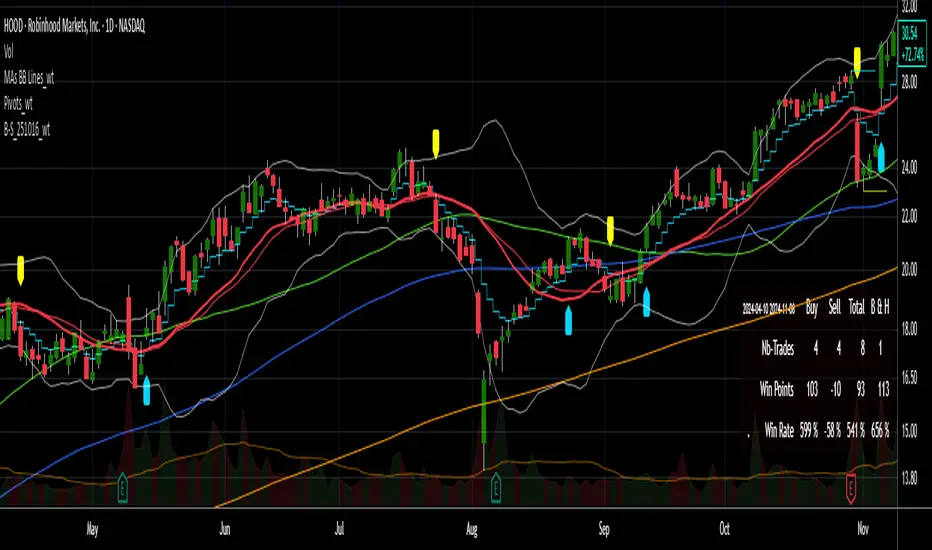
Buy/Sell Signals [WynTrader]My name is WynTrader. I cumulate 24 years of experience.
This Indicator produces Buy/Sell Signals using these features:
- Fast and Slow Moving averages (modifiable) optimized at EMA-8 and SMA-35
- Bollinger Bands (modifiable) optimized at Basis-18 and Multiplier-1
Also, the Buy/Sell Signals are conditioned by three Filters (optionable, modifiable) :
. Bollinger-Bands Lookback
. High-Low vs Candle Range %
. Distance from Fast and Slow Moving averages %
The Results Calculation presented in a Table are based :
- on the Current Chart Visible Range (optionable)
or
- on the specified TIme Frame Start and End Dates (modifiable)
The Table shows Calculation Results of the Buy and Sell Signals that are activated on the chart, with the Number of Trades (Signals), the Winning Points and the Win Rate %. The Buy&Hold starts calculation at the first Buy encountered.
So be surprised by my Buy/Sell Indicator. But always remember that the world is not perfect. The Graal Indicator, even with AI, doesn't already exist, maybe one day (all of us richier...), but not now. , depending on the chart product (stocks...), volatility, probabilities, unpredictable behaviour. , the moves, etc.
Enjoy
WynTrader
P. s. :
My name is WynTrader. I cumulate 24 years of experience. In 2001, I took an intensive technical analysis course taught by an exceptional friend, Cyril, who taught me everything I know. The foundation I gained through his teaching remains solid and relevant to this day, never failing me.
Before i made this Indicator, I have used many Trading View Buy/Sell Indicators using alone or combined RSI, SMI, OBV, MACD ATR, ADX, Neural, Fractal, Geometry, etc., that are already available for the Trading View community. A great thanks to those who give their time that help me build this tool.
Note that I'm not a programmer, so... ;-)
BTC 5-MA Multi Cross Strategy By Hardik Prajapati Ai TradelabThis strategy is built around the five most powerful and commonly used moving averages in crypto trading — 5, 20, 50, 100, and 200-period SMAs (Simple Moving Averages) — applied on a 1-hour Bitcoin chart.
Core Idea:
The strategy aims to identify strong bullish trends by confirming when the price action crosses above all key moving averages. This alignment of multiple MAs indicates momentum shift and helps filter out false breakouts.
⸻
⚙️ How It Works:
1. Calculates 5 Moving Averages:
• 5 MA → Short-term momentum (fastest signal)
• 20 MA → Near-term trend confirmation
• 50 MA → Mid-term trend filter
• 100 MA → Long-term trend foundation
• 200 MA → Macro-trend direction (strongest support/resistance)
2. Buy Condition (Entry):
• A Buy is triggered when:
• The price crosses above the 5 MA, and
• The closing price remains above all other MAs (20, 50, 100, 200)
This signals that momentum is aligned across all time horizons — a strong uptrend confirmation.
3. Sell Condition (Exit):
• The position is closed when price crosses below the 20 MA, showing weakness in short-term momentum.
4. Visual Signals:
• 🟢 BUY triangle below candles → Entry signal
• 🔴 SELL triangle above candles → Exit signal
• Colored MAs plotted for trend clarity.
⸻
📈 Recommended Usage:
• Chart: BTC/USDT
• Timeframe: 1 Hour
• Type: Trend-following crossover strategy
• Ideal for: Identifying major breakout moves and confirming trend reversals.
⸻
⚠️ Notes:
• This script is meant for educational and backtesting purposes only.
• Always apply additional confirmation tools (like RSI, Volume, or VIX-style filters) before live trading.
• Works best during trending markets; may produce whipsaws in sideways zones.

Round Number Analyzer v3Round Number Analyzer v3 is an indicator designed to analyze how price interacts with round number levels (levels spaced at fixed intervals in points or pips).
The indicator does not generate entry/exit signals, but provides detailed statistics to better understand market dynamics around these key levels.
✨ Key Features
Cross Counting: detects every time the price crosses a round number level (up = Long, down = Short).
Continuations & Reversals: classifies each cross as:
Continuation: the move continues in the same direction as the previous sequence.
Reversal: the move changes direction compared to the previous sequence.
Sequence Classification (L1…L5+): each level is labelled based on its position within the consecutive cross sequence:
L1 = first level of the sequence,
L2 = second consecutive,
…
L5+ = fifth or higher.
Comprehensive Stats Table (top right corner):
Total crosses (Long, Short, Totals).
Total continuations + breakdown by L1…L5+.
Total reversals + breakdown by L1…L5+.
Percentages calculated against the proper denominator, displayed directly inside the cells next to the absolute values.
Date range of analysis (user-defined).
Customizable Step: Works in both points and pips, making the indicator suitable for indices and forex.
⚙️ Main Inputs
Start date / End date → sets the analysis period.
Step mode → Points or Pips.
Step value → distance between round levels.
Pip size → pip size (default = 0.0001, typical for forex).
📈 How to Interpret
A high continuation percentage after L1–L2 suggests the market tends to extend multiple times beyond the first breakout levels.
Higher reversal percentages at advanced levels (L4–L5+) may signal trend exhaustion.
The analysis helps estimate the probability of continuation or reversal depending on how many consecutive levels have already been crossed.
🔎 Practical Applications
Support for breakout or mean-reversion strategies.
Comparative analysis across different markets (e.g. indices vs forex) or different time periods.
📝 Notes
The indicator is timeframe-robust, as it accounts for multiple steps within the same candle, ensuring results do not depend on the selected timeframe (except for TradingView’s historical data limits).
It does not provide automatic trading signals, but serves as a quantitative analysis tool to refine your strategies.
---
Round Number Analyzer v3 è un indicatore pensato per analizzare come il prezzo interagisce con i livelli di round number (livelli a distanza fissa in punti o pips).
L’indicatore non genera segnali di ingresso/uscita, ma fornisce statistiche dettagliate utili per comprendere la dinamica del mercato attorno a questi livelli.
✨ Funzionalità principali
Conteggio dei Cross: rileva ogni volta che il prezzo attraversa un livello round (verso l’alto = Long, verso il basso = Short).
Continuations & Reversals: classifica ogni attraversamento come:
Continuation: il movimento prosegue nella stessa direzione della sequenza precedente.
Reversal: il movimento inverte la direzione rispetto alla sequenza precedente.
Classificazione per sequenza (L1…L5+): ogni livello è etichettato in base alla sua posizione nella sequenza di cross consecutivi:
L1 = primo livello della sequenza,
L2 = secondo consecutivo,
…
L5+ = quinto o superiore.
Statistiche complete in tabella (in alto a destra):
Cross totali (Long, Short, Totals).
Continuations totali + breakdown per L1…L5+.
Reversals totali + breakdown per L1…L5+.
Percentuali calcolate sul denominatore corretto, mostrate direttamente dentro le celle accanto ai valori assoluti.
Date range di analisi (impostabile dall’utente).
Step personalizzabile: puoi lavorare sia in punti che in pips, così l’indicatore è adatto sia per indici che per forex.
⚙️ Input principali
Start date / End date → imposta l’intervallo temporale di analisi.
Step mode → punti o pips.
Step value → ampiezza tra i livelli round.
Pip size → dimensione del pip (default = 0.0001, tipico per il forex).
📈 Come interpretarlo
Una percentuale di continuation molto alta dopo L1–L2 indica che il mercato tende a proseguire più volte oltre i primi livelli di breakout.
Percentuali di reversal più elevate nei livelli avanzati (L4–L5+) possono suggerire esaurimento della spinta.
L’analisi permette di stimare la probabilità che un movimento in corso continui o si inverta in base a quanti livelli sono già stati attraversati consecutivamente.
🔎 Applicazioni pratiche
Supporto per strategie di breakout o mean reversion.
Analisi comparativa tra mercati (es. indici vs forex) o tra periodi temporali diversi.
📝 Note
L’indicatore è timeframe-robust: il conteggio tiene conto di multipli step dentro la stessa candela, così i risultati non dipendono dal timeframe scelto (salvo i limiti di caricamento storico di TradingView).
Non fornisce segnali operativi automatici, ma è un tool di analisi quantitativa per affinare le proprie strategie.
