Hidden SMT Divergence ICT 01 [TradingFinder] HSMT SMC Technique🔵 Introduction
Hidden SMT Divergence, an advanced concept within the Smart Money Technique (SMT), identifies discrepancies between correlated assets by focusing on their closing prices.
Unlike the standard SMT Divergence, which uses high and low prices for analysis, Hidden SMT Divergence uncovers subtle signals by examining divergences based on the assets' closing values.
These divergences often highlight potential reversals or trend continuations, making this technique a valuable tool for traders aiming to anticipate market movements.
This approach applies across various markets and asset classes, including :
Commodities : CAPITALCOM:GOLD vs. CAPITALCOM:SILVER or BLACKBULL:BRENT vs. BLACKBULL:WTI .
Indices : NASDAQ:NDX vs. TVC:SPX vs. FX:US30 .
FOREX : FX:EURUSD vs. OANDA:GBPUSD vs. TVC:DXY (US Dollar Index).
Cryptocurrencies : BITSTAMP:BTCUSD vs. COINBASE:ETHUSD vs. KUCOIN:SOLUSDT vs. CRYPTOCAP:TOTAL3 .
Volatility Measures : FOREXCOM:XAUUSD vs. TVC:VIX (Volatility Index).
By identifying divergences within these asset groups, traders can gain actionable insights into potential market reversals or shifts in trend direction. Hidden SMT Divergence is particularly effective for pinpointing subtle market signals that traditional methods may overlook.
Bullish Hidden SMT Divergence : This divergence emerges when one asset forms a higher low, while the correlated asset creates a lower low in terms of their closing prices. It often signals weakening downward momentum and a potential reversal to the upside.
Bearish Hidden SMT Divergence : This occurs when one asset establishes a higher high, while the correlated asset forms a lower high based on their closing prices. It typically reflects declining upward momentum and a probable shift to the downside.
🔵 How to Use
The Hidden SMT Divergence indicator provides traders with a systematic approach to identify market reversals or trend continuations through divergences in closing prices between two correlated assets.
🟣 Bullish Hidden SMT Divergence
Bullish Hidden SMT Divergence occurs when the closing price of the primary asset forms a higher low, while the correlated asset creates a lower low. This pattern indicates weakening downward momentum and signals a potential reversal to the upside.
After identifying the divergence, confirm it using additional tools like support levels, volume trends, or indicators such as RSI and MACD. Enter a buy position as the price shows signs of reversal near support zones, ensuring proper risk management by placing a stop-loss below the support level.
Bearish Hidden SMT Divergence
Bearish Hidden SMT Divergence is identified when the closing price of the primary asset forms a higher high, while the correlated asset creates a lower high. This divergence suggests a weakening uptrend and a likely reversal to the downside.
Validate the signal by examining resistance levels, declining volume, or complementary indicators. Consider entering a sell position as the price starts declining from resistance levels, and set a stop-loss above the resistance zone to limit potential losses.
🔵 Setting
Second Symbol : Select the secondary asset to compare with the primary asset. By default, "XAUUSD" (Gold) is used, but it can be customized to any stock, cryptocurrency, or currency pair.
Divergence Fractal Periods : Defines the number of past candles considered for identifying divergences. The default value is 2, but traders can adjust it for greater precision.
Bullish Divergence Line : Displays a dashed line connecting the points of bullish divergence.
Bearish Divergence Line : Shows a similar line for bearish divergence points.
Bullish Divergence Label : Marks areas of bullish divergence with a "+SMT" label.
Bearish Divergence Label : Highlights bearish divergences with a "-SMT" label.
Chart Type : Choose between Line or Candle charts for enhanced visualization.
🔵 Conclusion
Hidden SMT Divergence offers traders a refined method for identifying market reversals by analyzing closing price discrepancies between correlated assets. Its ability to uncover subtle divergences makes it an essential tool for traders who aim to stay ahead of market trends.
By integrating this technique with other technical analysis tools and sound risk management, traders can enhance their decision-making process and capitalize on market opportunities with greater confidence.
Hidden SMT Divergence’s focus on closing prices ensures more precise signals, helping traders refine their strategies across various markets, including Forex, commodities, indices, and cryptocurrencies.
Its open-source nature allows for customization and verification, providing transparency and flexibility to suit diverse trading needs. Hidden SMT Divergence stands as a powerful addition to the arsenal of any trader seeking to unlock hidden opportunities in dynamic financial markets.
In den Scripts nach "xauusd黄金实时价格" suchen

SMT Divergence ICT 01 [TradingFinder] Smart Money Technique🔵 Introduction
SMT Divergence (short for Smart Money Technique Divergence) is a trading technique in the ICT Concepts methodology that focuses on identifying divergences between two positively correlated assets in financial markets.
These divergences occur when two assets that should move in the same direction move in opposite directions. Identifying these divergences can help traders spot potential reversal points and trend changes.
Bullish and Bearish divergences are clearly visible when an asset forms a new high or low, and the correlated asset fails to do so. This technique is applicable in markets like Forex, stocks, and cryptocurrencies, and can be used as a valid signal for deciding when to enter or exit trades.
Bullish SMT Divergence : This type of divergence occurs when one asset forms a higher low while the correlated asset forms a lower low. This divergence is typically a sign of weakness in the downtrend and can act as a signal for a trend reversal to the upside.
Bearish SMT Divergence : This type of divergence occurs when one asset forms a higher high while the correlated asset forms a lower high. This divergence usually indicates weakness in the uptrend and can act as a signal for a trend reversal to the downside.
🔵 How to Use
SMT Divergence is an analytical technique that identifies divergences between two correlated assets in financial markets.
This technique is used when two assets that should move in the same direction move in opposite directions.
Identifying these divergences can help you pinpoint reversal points and trend changes in the market.
🟣 Bullish SMT Divergence
This divergence occurs when one asset forms a higher low while the correlated asset forms a lower low. This divergence indicates weakness in the downtrend and can signal a potential price reversal to the upside.
In this case, when the correlated asset is forming a lower low, and the main asset is moving lower but the correlated asset fails to continue the downward trend, there is a high probability of a trend reversal to the upside.
🟣 Bearish SMT Divergence
Bearish divergence occurs when one asset forms a higher high while the correlated asset forms a lower high. This type of divergence indicates weakness in the uptrend and can signal a potential trend reversal to the downside.
When the correlated asset fails to make a new high, this divergence may be a sign of a trend reversal to the downside.
🟣 Confirming Signals with Correlation
To improve the accuracy of the signals, use assets with strong correlation. Forex pairs like OANDA:EURUSD and OANDA:GBPUSD , or cryptocurrencies like COINBASE:BTCUSD and COINBASE:ETHUSD , or commodities such as gold ( FX:XAUUSD ) and silver ( FX:XAGUSD ) typically have significant correlation. Identifying divergences between these assets can provide a strong signal for a trend change.
🔵 Settings
Second Symbol : This setting allows you to select another asset for comparison with the primary asset. By default, "XAUUSD" (Gold) is set as the second symbol, but you can change it to any currency pair, stock, or cryptocurrency. For example, you can choose currency pairs like EUR/USD or GBP/USD to identify divergences between these two assets.
Divergence Fractal Periods : This parameter defines the number of past candles to consider when identifying divergences. The default value is 2, but you can change it to suit your preferences. This setting allows you to detect divergences more accurately by selecting a greater number of candles.
Bullish Divergence Line : Displays a line showing bullish divergence from the lows.
Bearish Divergence Line : Displays a line showing bearish divergence from the highs.
Bullish Divergence Label : Displays the "+SMT" label for bullish divergences.
Bearish Divergence Label : Displays the "-SMT" label for bearish divergences.
🔵 Conclusion
SMT Divergence is an effective tool for identifying trend changes and reversal points in financial markets based on identifying divergences between two correlated assets. This technique helps traders receive more accurate signals for market entry and exit by analyzing bullish and bearish divergences.
Identifying these divergences can provide opportunities to capitalize on trend changes in Forex, stocks, and cryptocurrency markets. Using SMT Divergence along with risk management and confirming signals with other technical analysis tools can improve the accuracy of trading decisions and reduce risks from sudden market changes.

MERCURY by DrAbhiramSivprasad"MERCURY by DrAbhiramSivprasad"
Developed from over 10 years of personal trading experience, the Mercury Indicator is a strategic tool designed to enhance accuracy in trading decisions. Think of it as a guiding light—a supportive tool that helps traders refine and build more robust strategies by integrating multiple powerful elements into a single indicator. I’ll be sharing some examples to illustrate how I use this indicator in my own trading journey, highlighting its potential to improve strategy accuracy.
Reason behind the combination of emas , cpr and vwap is it provides very good support and resistance in my trading carrier so now i brought them together in one plate
How It Works:
Mercury combines three essential elements—EMA, VWAP, and CPR—each of which plays a vital role in detecting support and resistance:
Exponential Moving Averages (EMAs): Known for their strength in providing dynamic support and resistance levels, EMAs help in identifying trends and shifts in momentum. This indicator includes a dashboard with up to nine customizable EMAs, showing whether each is acting as support or resistance based on real-time price movement.
Volume Weighted Average Price (VWAP): VWAP also provides valuable support and resistance, often regarded as a fair price level by institutional traders. Paired with EMAs, it forms a dual-layered support/resistance system, adding an additional level of confirmation.
Central Pivot Range (CPR): By combining CPR with EMAs and VWAP, Mercury highlights “traffic blocks” in your target journey. This means it identifies zones where price is likely to stall or reverse, providing additional guidance for navigating entries and exits.
Why This Combination Matters:
Using these three tools together gives you a more complete view of the market. VWAP and EMAs offer dynamic trend direction and support/resistance, while CPR pinpoints critical price zones. This combination helps you find high-probability trades, adding clarity to complex market situations and enabling stronger confirmation on trend or reversal decisions.
How to Use:
Trend Confirmation: Check if all EMAs are aligned (green for uptrend, red for downtrend), which is visible in the EMA dashboard. An alignment across VWAP, CPR, and EMAs signifies high confidence in trend direction.
Breakouts & Breakdowns: Mercury has an alert system to signal when a price breakout or breakdown occurs across VWAP, EMA1, and EMA2. This can help in spotting strong directional moves.
Example Application: In my trading, I use Mercury to identify support/resistance zones, confirming trends with EMA/VWAP alignment and using CPR as a checkpoint. I find this especially useful for day trading and swing setups.
Recommended Timeframes:
Day Trading: 5 to 15-minute charts for swift, actionable insights.
Swing Trading: 1-hour or 4-hour charts for broader trend analysis.
Note:
The Mercury Indicator should be used as a supportive tool rather than a standalone strategy, guiding you toward informed decisions in line with your trading style and goals.
EXAMPLE OF TRADE
you can see the cart of XAUUSD on 11th nov 2024
1.SHORT POSITION - TIME FRAME 15 MIN
So here for a short position you need to wait for a breakdown candle which will print in orange post the candle you need to check ema dashboard is completly red that indicates no traffic blocks in your journey to destiny target from ema's and you can take the target from nearest cpr support line
TAKEN IN XAUUSD you can see in chart of XAUUSD on 7th nov
2.LONG POSITION - TIME FRAME 15 MIN -
So here for long position you need to wait for a breakout candle from indicator thats here is blue and check all ema boxes are green and candle body should close above all the 3 lines here it is the both ema 1 and 2 and the vwap line then you can take and entry and your target will be the nearest resistance from the daily cpr
3. STOP LOSS CRITERIA
After the entry any candle close below any of the last line from entry for example we have 3 lines vwap and ema 1 and 2 lines and u have made an entry and the last line before the entry is vwap then if any candle closes below vwap can be considered as stoploss like wise in any lines
The MERCURY indicator is a comprehensive trading tool designed to enhance traders' ability to identify trends, breakouts, and reversals effectively. Created by Dr. Abhiram Sivprasad, this indicator integrates several technical elements, including Central Pivot Range (CPR), EMA crossovers, VWAP levels, and a table-based EMA dashboard, to offer a holistic trading view.
Core Components and Functionality:
Central Pivot Range (CPR):
The CPR in MERCURY provides a central pivot level along with Below Central (BC) and Top Central (TC) pivots. These levels act as potential support and resistance, useful for identifying reversal points and zones where price may consolidate.
Exponential Moving Averages (EMAs):
MERCURY includes up to nine EMAs, with a customizable EMA crossover alert system. This feature enables traders to see shifts in trend direction, especially when shorter EMAs cross longer ones.
VWAP (Volume-Weighted Average Price):
VWAP is incorporated as a dynamic support/resistance level and, combined with EMA crossovers, helps refine entry and exit points for higher probability trades.
Breakout and Breakdown Alerts:
MERCURY monitors conditions for upside and downside breakouts. For an upside breakout, all EMAs turn green and a candle closes above VWAP, EMA1, and EMA2. Similarly, all EMAs turning red, combined with a close below VWAP and EMA1/EMA2, signals a downside breakdown. Continuous alerts are available until the trend shifts.
Real-Time EMA Dashboard:
A table displays each EMA’s relative position (Above or Below), helping traders quickly gauge trend direction. Colors in the table adjust to long/short conditions based on EMA alignment.
Usage Recommendations:
Trend Confirmation:
Use the CPR, EMA alignments, and VWAP to confirm uptrends and downtrends. The table highlights trends, making it easy to spot long or short setups at a glance.
Breakout and Breakdown Alerts:
The alert system is customizable for continuous notifications on critical price levels. When all EMAs align in one direction (green for long, red for short) and the close is above or below VWAP and key EMAs, the indicator confirms a breakout/breakdown.
Adaptable for Different Styles:
Day Trading: Traders can set shorter EMAs for quick insights.
Swing Trading: Longer EMAs combined with CPR offer insights into sustained trends.
Recommended Settings:
Timeframes: MERCURY is suitable for timeframes as low as 5 minutes for intraday traders, up to daily charts for trend analysis.
Symbols: Works across forex, stocks, and crypto. Adjust EMA lengths for asset volatility.
Example Strategy:
Long Entry: When the price crosses above CPR and closes above both EMA1 and EMA2.
Short Entry: When the price falls below CPR with a close below both EMA1 and EMA2.

HBK Price Action Strategy HBKPrice Action Strategy for XAUUSD with a Favorable Risk-Reward Ratio
Understanding the Strategy:
This strategy leverages price action principles to identify potential entry and exit points for XAUUSD on a 5-minute timeframe. The core idea is to identify price action patterns that suggest a high probability of a particular direction, and then to set stop-loss and take-profit levels to manage risk and reward.
Key Price Action Patterns to Watch:
Pin Bar: A pin bar is a candlestick with a long wick in one direction and a small body in the opposite direction. It often signals a reversal in the current trend.
Inside Bar: An inside bar forms when the current candle's high is lower than the previous candle's high, and the current candle's low is higher than the previous candle's low. It often indicates indecision or a potential breakout.
Engulfing Pattern: An engulfing pattern occurs when the current candle completely engulfs the previous candle. A bullish engulfing pattern signals a potential uptrend, while a bearish engulfing pattern signals a potential downtrend.
Risk-Reward Ratio:
A favorable risk-reward ratio is crucial for long-term trading success. Aim for a minimum risk-reward ratio of 1:2, meaning you risk $1 to potentially gain $2.
Entry and Exit Signals:
Long Entry:
Identify a bullish pin bar or engulfing pattern.
Wait for a confirmation candle to close above the pin bar's high or the engulfing pattern's high.
Place a stop-loss below the recent swing low.
Set a take-profit target at a key resistance level or a multiple of the stop-loss distance.
Short Entry:
Identify a bearish pin bar or engulfing pattern.
Wait for a confirmation candle to close below the pin bar's low or the engulfing pattern's low.
Place a stop-loss above the recent swing high.
Set a take-profit target at a key support level or a multiple of the stop-loss distance.
Additional Tips:
Use Support and Resistance Levels: Identify key support and resistance levels to set your stop-loss and take-profit targets.
Consider Market Sentiment: Pay attention to market sentiment and news events that may impact gold prices.
Manage Risk: Always use stop-loss orders to limit potential losses.
Be Patient: Don't force trades. Wait for high-probability setups.
Practice Discipline: Stick to your trading plan and avoid impulsive decisions.
Remember:
Price action trading requires practice and patience.
Backtest your strategy on historical data to refine your approach.
Always adapt to changing market conditions.
By following these guidelines and practicing disciplined risk management, you can increase your chances of success in trading XAUUSD on a 5-minute timeframe.

Every $5 (3 Up, 3 Down) GOLD onlyDescription :
This indicator plots customizable horizontal lines spaced every $5 on the XAUUSD chart, with exactly 3 lines above and 3 lines below the nearest $5 level from the current price.
Key Features :
Line Spacing: The lines are plotted at $5 intervals starting from the nearest whole $5 price below the current price (e.g., $1900, $1905, etc.).
Customizable Line Color : Users can select the color of the lines via the indicator settings, making it adaptable to different chart themes and styles.
Customizable Line Style : The indicator allows you to choose from the following line styles:
Solid : Continuous line.
Dashed: Dashed line for a more discrete visual.
Dotted: Dotted line for minimalistic visibility.
Visibility Control : The indicator limits the number of lines to 3 above and 3 below the current price, keeping the chart clean and uncluttered while providing key levels of interest.
Use Cases :
Support and Resistance Identification: Easily spot key psychological levels in $5 increments, useful for identifying potential support or resistance zones in XAUUSD trading.
Price Action Monitoring : Traders can visually track how XAUUSD interacts with specific price levels spaced by $5 increments.
Customization Options :
Color Selection: Modify the line color to match your chart theme or highlight important levels.
Line Style: Select between solid, dashed, or dotted lines to customize the look of your chart.
This indicator is ideal for XAUUSD traders looking for clear, customizable visual levels on their charts to aid in decision-making, whether you're tracking price action or setting targets for entry and exit.

SD Distance Mean BetaThe "SD Distance Mean Indicator" is a currently a developing tool designed to enhance trading precision by dynamically adjusting to market conditions. This indicator provides insights into price deviations from the mean, helping traders make inf OANDA:XAUUSD ormed decisions based on significant price movements.
Key Features:
Adaptive Length Adjustment:
The indicator dynamically adjusts the calculation period based on the Average True Range (ATR). This allows it to respond to different market conditions, using a shorter length during consolidations and a longer length during trends.
Standardized Distance Calculation:
The indicator calculates the distance of the current price from the mean and standardizes it using the standard deviation. This standardized distance is then smoothed to reduce noise and provide clearer signals.
Dynamic Standard Deviation (SD) Levels:
SD levels are adjusted dynamically based on ATR, providing a more accurate representation of price volatility. These levels are further smoothed to minimize wiggling on shorter timeframes like the 30-minute chart.
Visual Cues for Trading Signals:
The indicator plots multiple SD levels (+1, +2, +3, +4 and their negatives) and highlights significant price movements. When the standardized distance line hits or exceeds these levels, it signals potential overbought or oversold conditions.
Customizable Smoothing: The smoothing length for both the standardized distance and SD levels can be customized to suit different trading strategies and timeframes. Default values are set to provide a balance between responsiveness and stability.
Usage:
Identifying Reversals : The indicator helps in spotting potential reversal points. When the smoothed standardized distance line hits +2 SD or -2 SD and rebounds, it signals a possible price reversal back towards the mean.
Confirming Trends: Dynamic SD levels provide a clear visual representation of price volatility, helping traders confirm trend strength and potential breakout points.
Enhancing Precision: By dynamically adjusting to market conditions, the indicator enhances trading precision, making it suitable for various market environments.
This script is an essential addition to any trader's toolkit, offering a blend of adaptability, precision, and visual clarity to support more informed trading decisions.
Settings:
Short Length: Period length used during consolidations.
Long Length: Period length used during trends.
ATR Length: Length for ATR calculation.
ATR Threshold: Threshold value to switch between short and long lengths.
Smoothing Length: Length for smoothing the standardized distance.
SD Smoothing Length: Length for smoothing the dynamic SD levels.
By using this indicator, traders can leverage its adaptive capabilities to navigate various market conditions effectively and enhance their trading performance on XAUUSD and other assets.
Mexnepal price convert By Np Trader's ProThis indicator converts the trading view price of commodity items to mexnpal price by multiplying the price by its conversion value for eg : it converts price of FXOPEN:XAUUSD (ounce) by multiplying by 32.22 gives value in kg hence it helps to put stoplosses and target points to Nepali traders who trades in mexnepal (commodity trading platform based in Nepal ) . People are selling such indicators to new traders so i decided to publish one for free to help neplese Commodity trading community lets hope trading view moderators approves this.
Features
1. converts price of all mexnepal trading items available in tradingview in real time
2. plots candels according to converted price hence giving better view of price fluxuation
3. All in one tool for all item listed in mex nepal like FXOPEN:XAUUSD FXOPEN:XAGUSD CAPITALCOM:COPPER
TVC:USOIL

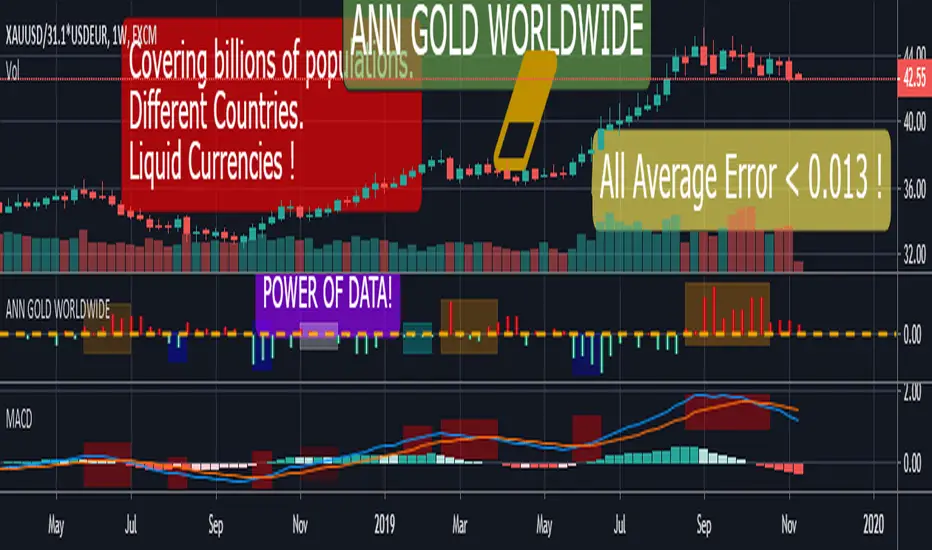
ANN GOLD WORLDWIDE This script consists of converting the value of 1 gram and / or 1 ounce of gold according to the national currencies into a system with artificial neural networks.
Why did I feel such a need?
Even though the printed products in the market are digitally circulated, only precious metals are available in full or near full.
Silver is difficult to carry because you have to buy too much because the unit price is low.
Platinum is very difficult to find and used in industry.
Gold is both practical and has less volatile movements, even more balanced than dollars, to preserve the value of money.
Uncertainty and tensions benefit gold.
Obviously this is my own opinion and is not worth the investment advice:
If there is to be an economic crisis, it is obvious that the dollar will rise against the emerging currencies, but I expect a crisis where gold and the dollar will rise together.
The world has been on a mercantilist line more than ever!
Spot gold can be bought from goldsmiths and banks.
I think this command will benefit people everywhere but in economies that are subject to developing currencies.
Now we can look at the details:
All you have to do is load the appropriate chart and select it from the menu.
Thus, the system will adjust itself to that instrument.
MENU and Tickers :
"GOLD" : XAUUSD or GC1! or GOLD (Average error = 0.0128)
"GOLDSILVER" : XAUXAG or GOLDSILVER (Gold Silver Ratio ) ( Average error : 0.01 )
"GOLD CZK " : XAUUSD/USDCZK ( 1 Ounce Gold Czech Koruna) ( Average error = 0.010879 )
"GOLD NZD " : XAUUSD/USDNZD ( 1 Ounce Gold New Zealand Dollar ) (Average error = 0.010736 )
"GOLD EURO" : XAUUSD/USDEUR ( 1 Ounce Gold Euro) ( Average error = 0.010000 )
"GOLD HUF " : XAUUSD/USDHUF ( 1 Ounce Gold Hungarian Forint ) ( Average error = 0.010000 )
"GOLD INR " : XAUUSD/USDINR (1 Ounce Gold Indian Rupee ) (Average error = 0.010458 )
"GOLD DKK" : XAUUSD/USDDKK (1 Ounce Gold Danish Krone) (Average error = 0.010671 )
"GOLD CHF" : XAUUSD/USDCHF (1 Ounce Gold Swiss Franc ) (Average error = 0.010967 )
"GOLD CNH" : XAUUSD/USDCNH(1 Ounce Gold Offshore RMB) (Average error = 0.012017 )
"GOLD MXN" : XAUUSD/USDMXN(1 Ounce Gold Mexican Peso) (Average error = 0.010000 )
"GOLD PLN" : XAUUSD/USDPLN (1 Ounce Gold Polish Zloty ) (Average error = 0.010173 )
"GOLD ZAR" : XAUUSD/USDZAR (1 Ounce Gold South African Rand (Average error = 0.010484 )
"GOLD NOK" : XAUUSD/USDNOK (1 Ounce Gold Norwegian Krone ) (Average error = 0.010842 )
"GOLD TRY" : XAUUSD/USDTRY (1 Ounce Gold Turkish Lira ) (Average error = 0.010000 )
"GOLD THB" : XAUUSD/USDTHB (1 Ounce Gold Thai Baht ) (Average error = 0.011747 )
Important note : XAUUSD/USDCUR = 1 Ounce Gold , XAUUSD/31.1*USDCUR = 1 gram Gold (CUR = Currency )
If you want to physically hold it, look gram value, because as far as I know, all goldsmiths and jewelleries in the world are selling gram gold.
I think that this command is the most useful and the concrete one that I have ever written.
I end my sentences with this anonymous proverb :
"Even if gold falls into the mud, it's still gold ! "
UNDETECTED FX - 250 Pip LevelsIndicator Description – UNDETECTED FX: 250-Pip Psychological Levels
This indicator automatically plots major 250-pip psychological levels on XAUUSD and highlights the price zones around them. These levels act as strong reaction points where liquidity, reversals, and institutional activity commonly occur.
What the Indicator Does
✔ Plots every 250-pip level starting from a user-defined base (e.g., 4050 → 4075 → 4100 → 4125 → …)
✔ Each level is represented by a thick black horizontal line for maximum visual clarity
✔ Around every 250-pip level, the indicator draws a liquidity zone
Top of zone: +200 pips
Bottom of zone: –200 pips
(configured as ± zoneHalf in settings)
✔ Uses extend: both, so levels stretch across the entire chart and stay fixed, no matter how far you scroll
✔ Zones are filled with a customizable color for clear premium/discount visualization
✔ The indicator never repaints and requires no updates after drawing — all levels are fixed on their price coordinates
Why It’s Useful
🔹 Helps quickly identify institutional levels where gold often reacts
🔹 Acts as a framework for scalping, intraday trading, and swing bias
🔹 Makes it easy to spot liquidity sweeps, rejections, and premium/discount areas
🔹 Clearly shows market structure breaks around key psychological levels
🔹 Forces discipline by creating predefined, fixed levels for trading decisions
Best Use Case
XAUUSD scalpers
Intraday traders who rely on precision entries
Traders who use psychological levels, liquidity grabs, or smart-money concepts
Anyone wanting a clean, non-cluttered chart with high-impact levels only

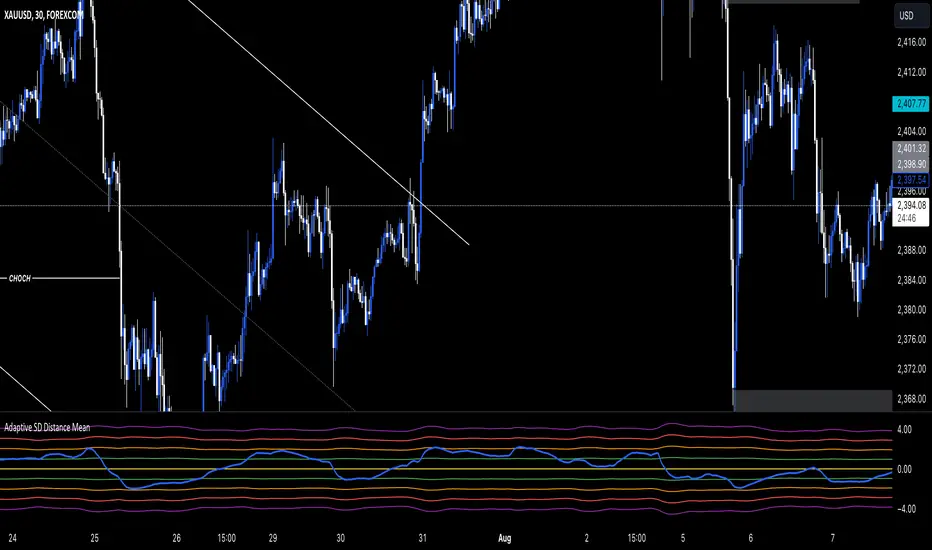
Trend Break Targets [MarkitTick]Trend Break Targets
Trend Break Targets is a technical analysis tool designed to assist traders in identifying trendline breakouts and projecting potential price targets based on market geometry. Unlike fully automated indicators that guess trendlines, this tool provides you with precise control by allowing you to manually Pivot Point the trendline to specific points in time, while automating the complex math of target projection and structure mapping.
Theoretical Basis & Concepts
This indicator is grounded in classic technical analysis principles found in foundational trading literature. It automates the following methodology:
Drawing a trend line between two key points to represent dynamic support or resistance.
Identifying a breakout when the price closes above or below this line, potentially signaling a change in trend.
Calculating a price target by measuring the vertical distance between the breakout line and the last high/low (pivot), then projecting that same distance in the direction of the breakout.
This concept is based on methods and "Measured Move" theories explained in classic books such as "Technical Analysis of Stock Trends" by Edwards & Magee, "Technical Analysis of the Financial Markets" by John Murphy, and in Thomas Bulkowski's Price Pattern Studies.
How It Works
Pivot Pointed Trendline Construction The script draws a trendline between two user-defined points in time (Start Date and End Date). It calculates the slope between these points and extends the line infinitely to the right, allowing you to define the exact structure (e.g., a resistance trendline on a wedge).
Breakout Detection The script monitors the "Price Source" (High, Low, or Close) relative to the extended trendline.
A Bullish Breakout (BC) occurs when the Close crosses above a bearish trendline.
A Bearish Breakout (BC) occurs when the Close crosses below a bullish trendline.
Dynamic Target Projection (The Math) Upon a confirmed breakout, the script automatically calculates three distinct targets by identifying the most significant "Swing Point" (Pivot) prior to the breakout.
Distance (D): The vertical distance between the Trendline and the Pivot Price at the specific bar where the pivot occurred.
Target 1 (T1): The Breakout Price +/- (Distance × 1.0). This represents a classic 1:1 measured move.
Target 2 (T2): The Breakout Price +/- (Distance × 1.618). Based on the Golden Ratio extension.
Target 3 (T3): The Breakout Price +/- (Distance × 2.618).
Market Structure (CHOCH) The script includes an optional Change of Character (CHOCH) module. This runs independently of the trendline logic, identifying local Swing Highs and Swing Lows based on the "Swing Detection Length." It plots dashed lines and labels to visualize immediate shifts in market structure.
How to Use This Tool
This is an interactive tool that requires user input to define the setup.
Identify a Setup: Locate a clear trend, wedge, or flag pattern on your chart.
Set Pivot Points: Go to the Indicator Settings. Input the exact Start Date and End Date corresponding to the two main touches of your trendline.
Monitor for Breakout: The script will extend the line. Wait for a "BC" label to appear.
Trade Management: Once "BC" prints, the T1, T2, and T3 lines will instantly render. These can be used as potential take-profit zones or areas to tighten stop-losses.
Settings & Configuration
Indicator Settings
Start/End Date: The timestamp Pivot Points for your trendline.
Price Source: Determines what price (High or Low) Pivot Points the line and triggers the breakout.
Pivot Left/Right: Adjusts the sensitivity for finding the "Pivot Before Break" used for target calculations.
Extend Target Line: How far forward the target lines are drawn.
Visual Style
Colors: Fully customizable colors for the Trendline, Breakout Labels, and each Target level (T1, T2, T3).
Gold Bullish Reversal
This analysis dissects a confirmed bullish reversal on Gold using a custom Trend Break system. The setup identifies a transition from a bearish corrective phase to bullish momentum, validated by a structural break and a geometric target projection.
Trend Identification (The Pivot Points) The descending white trendline serves as the primary dynamic resistance, defining the bearish correction.
Pivot Points: The line is drawn connecting two significant swing highs, marked by Label 1 and Label 2.
Logic: These points represent the "lower highs" characteristic of the previous downtrend. As long as price remained below this trajectory, the bearish bias was intact.
The Trigger: Breakout & Confirmation The transition occurs at the candle marked BC (Breakout Candle).
Breakout Criteria: The indicator logic dictates that a signal is only valid when the bar closes above the trendline. This filters out intraday wicks and ensures genuine buyer commitment.
CHOCH Confluence: Immediately following the breakout, a CHOCH (Change of Character) label appears. This signals a shift in market structure, indicating that the internal lower-high/lower-low sequence has been violated, adding probability to the reversal.
Target Projection: The Measured Move The vertical green lines (T1, T2) represent profit objectives derived from the depth of the prior move. The logic calculates the distance between the breakout line and the lowest pivot prior to the break.
T1 (Standard Target): This is a 1:1 projection of the pre-breakout volatility. We see price action initially stalling near this level, confirming it as a zone of interest.
T2 (Golden Ratio Extension): The second target is calculated as the initial distance multiplied by 1.618 (Fibonacci Golden Ratio). The chart shows the price rallying aggressively through T1 to tap the T2 zone, often considered an exhaustion or major take-profit level in harmonic extensions.
Conclusion Gold has successfully invalidated the 4-hour bearish trendline. The confluence of a confirmed close above resistance (BC) and a structural shift (CHOCH) provided a high-probability long setup. The price has now fulfilled the T2 (1.618) extension, suggesting traders should watch for consolidation or a reaction at this key Fibonacci resistance level.
Bearish Trendline Breakdown
The image displays a Bearish Trendline Breakdown on the Gold (XAUUSD) 4-hour chart. The indicator is actually functioning in "Low" mode here (connecting swing lows to form support), which triggers the bearish logic found in the code. Here is the step-by-step breakdown:
The Setup: Pivot Points & Trendline
Visual: The Blue Labels "1" and "2" connected by a white diagonal line.
Code Logic: These are the user-defined start and end points.
Pivot Point 1 (startDate): The starting pivot of the trendline.
Pivot Point 2 (endDate): The ending pivot.
Trendline: The code draws a line between these two points and extends it to the right (extend.right). In this specific image, the line acts as a Support Trendline.
The Trigger: Break Candle (BC)
Visual: The Red Label "BC" appearing just below the white trendline.
Code Logic: This is the execution signal. The code detects a "Down Break" (dnBreak) because the Price Source was likely set to "Low" and the candle's Close was lower than the Trendline Price at that specific bar (close < currLinePrice). This confirms the support level has been breached.
The Projection: Targets (T1 & T2)
Visual: The Green Labels "T1" and "T2" with dotted horizontal lines projected downward.
Code Logic: These are profit targets based on a "Measured Move."
Pivot Calculation: The script looks back for a recent "Pivot High" (the peak before the crash) to calculate the volatility/distance (dist) between that peak and the trendline.
T1 (Conservative): The price is projected downward by 1x that distance (currLinePrice - dist).
T2 (Extended): The price is projected downward by 1.618x that distance (Golden Ratio extension).
Market Context: CHOCH
Visual: The small Red/Orange "CHOCH" labels appearing above the price action.
Code Logic: This is a secondary confirmation system running independently of the trendline. It detects a Change of Character (structural shift). The red labels indicate a "Bearish CHOCH," meaning the price broke below a significant prior swing low (last_swing_low). This supports the bearish bias of the trendline break.
Disclaimer This tool is for educational and technical analysis purposes only. Breakouts can fail (fake-outs), and past geometric patterns do not guarantee future price action. Always manage risk and use this tool in conjunction with other forms of analysis.

Volume-Gated Trend Ribbon [QuantAlgo]🟢 Overview
The Volume-Gated Trend Ribbon employs a selective price-updating mechanism that filters market noise through volume validation, creating a trend-following system that responds exclusively to significant price movements. The indicator gates price updates to moving average calculations based on volume threshold crossovers, ensuring that only bars with significant participation influence the trend direction. By interpolating between fast and slow moving averages to create a multi-layered visual ribbon, the indicator provides traders and investors with an adaptive trend identification framework that distinguishes between volume-backed directional shifts and low-conviction price fluctuations across multiple timeframes and asset classes.
🟢 How It Works
The indicator first establishes a dynamic baseline by calculating the simple moving average of volume over a configurable lookback period, then applies a user-defined multiplier to determine the significance threshold:
avgVol = ta.sma(volume, volPeriod)
highVol = volume >= avgVol * volMult
The gated price mechanism employs conditional updating where the close price is only captured and stored when volume exceeds the threshold. During low-volume periods, the indicator maintains the last qualified price level rather than tracking every minor fluctuation:
var float gatedClose = close
if highVol
gatedClose := close
Dual moving averages are calculated using the gated price input, with the indicator supporting various MA types. The fast and slow periods create the outer boundaries of the trend ribbon:
fastMA = volMA(gatedClose, close, fastPeriod)
slowMA = volMA(gatedClose, close, slowPeriod)
Ribbon interpolation creates intermediate layers by blending the fast and slow moving averages using weighted combinations, establishing a gradient effect that visually represents trend strength and momentum distribution:
midFastMA = fastMA * 0.67 + slowMA * 0.33
midSlowMA = fastMA * 0.33 + slowMA * 0.67
Trend state determination compares the fast MA against the slow MA, establishing bullish regimes when the faster average trades above the slower average and bearish regimes during the inverse relationship. Signal generation triggers on state transitions, producing alerts when the directional bias shifts:
bullish = fastMA > slowMA
longSignal = trendState == 1 and trendState != 1
shortSignal = trendState == -1 and trendState != -1
The visualization architecture constructs a three-tiered opacity gradient where the ribbon's core (between mid-slow and slow MAs) displays the highest opacity, the inner layer (between mid-fast and mid-slow) shows medium opacity, and the outer layer (between fast and mid-fast) presents the lightest fill, creating depth perception that emphasizes the trend center while acknowledging edge uncertainty.
🟢 How to Use This Indicator
▶ Long and Short Signals: The indicator generates long/buy signals when the trend state transitions to bullish (fast MA crosses above slow MA) and short/sell signals when transitioning to bearish (fast MA crosses below slow MA). Because these crossovers only reflect volume-validated price movements, they represent significant level of participation rather than random noise, providing higher-conviction entry signals that filter out false breakouts occurring on thin volume.
▶ Ribbon Width Dynamics: The spacing between the fast and slow moving averages creates the ribbon width, which serves as a visual proxy for trend strength and volatility. Expanding ribbons indicate accelerating directional movement with increasing separation between short-term and long-term momentum, suggesting robust trend development. Conversely, contracting ribbons signal momentum deceleration, potential trend exhaustion, or impending consolidation as the fast MA converges toward the slow MA.
▶ Preconfigured Presets: Three optimized parameter sets accommodate different trading styles and market conditions. Default provides balanced trend identification suitable for swing trading on daily timeframes with moderate volume filtering and responsiveness. Fast Response delivers aggressive signal generation optimized for intraday scalping on 1-15 minute charts, using lower volume thresholds and shorter moving average periods to capture rapid momentum shifts. Smooth Trend offers conservative trend confirmation ideal for position trading on 4-hour to weekly charts, employing stricter volume requirements and extended periods to filter noise and identify only the most robust directional moves.
▶ Built-in Alerts: Three alert conditions enable automated monitoring: Bullish Trend Signal triggers when the fast MA crosses above the slow MA confirming uptrend initiation, Bearish Trend Signal activates when the fast MA crosses below the slow MA confirming downtrend initiation, and Trend Change alerts on any directional transition regardless of direction. These notifications allow you to respond to volume-validated regime shifts without continuous chart monitoring.
▶ Color Customization: Six visual themes (Classic, Aqua, Cosmic, Ember, Neon, plus Custom) accommodate different chart backgrounds and display preferences, ensuring optimal contrast and visual clarity across trading environments. The adjustable fill opacity control (0-100%) allows fine-tuning of ribbon prominence, with lower opacity values create subtle background context while higher values produce bold trend emphasis. Optional bar coloring extends the trend indication directly to the price bars, providing immediate directional reference without requiring visual cross-reference to the ribbon itself.

Volatility High/Low Projection (PHOD / PLOD)AP Capital – Volatility + High/Low Projection
This indicator is designed to identify high-probability intraday turning points by combining daily range statistics, session behaviour, and volatility context into a single clean framework.
It is built for index, forex, and metals traders who want structure, not noise.
🔹 Core Features
1️⃣ Potential High of Day (PHOD) & Potential Low of Day (PLOD)
The indicator highlights likely intraday extremes based on:
Session timing (Asia, London, New York)
Current day volatility vs historical averages
Prior day expansion or compression behaviour
Each level is displayed with:
A clear label (PHOD / PLOD)
A forward-extending box acting as a live Point of Interest (POI)
Automatic invalidation when price breaks the zone
2️⃣ Volatility & Range Context (Info Panel)
A compact information panel in the top-right corner provides real-time context without cluttering the chart:
20-Day Average Range
% of the average range already used today
Range status (NORMAL / EXHAUSTED)
Average session ranges for:
Asia
London
New York
This allows traders to immediately assess whether price is:
Early in the day with room to trend
Statistically stretched and prone to reversal
Over-extended where breakout chasing is risky
3️⃣ Session-Aware Logic
The model respects how markets behave across the trading day:
Asia favours accumulation and potential lows
London provides expansion
New York often delivers distribution or exhaustion
This prevents random high/low marking and focuses only on structurally meaningful levels.
🧠 How to Use
Use PHOD / PLOD boxes as reaction zones, not blind entries
Combine with your own confirmation (structure break, momentum, volume, EMA reclaim, etc.)
Avoid chasing trades when the Range Status = EXHAUSTED
Particularly effective on 15m – 1h timeframes
⚠️ Important Notes
This indicator does not repaint
It is contextual, not a buy/sell signal generator
Best used as part of a complete trading plan
📈 Suitable Markets
XAUUSD (Gold)
Indices (NASDAQ, S&P 500, DAX)
Major FX pairs
📌 Disclaimer
This indicator is for educational and analytical purposes only.
It does not constitute financial advice. Trading involves risk.

FOMC Sweep Reaction AP Capital – FOMC Sweep Reaction v1.0
AP Capital – FOMC Sweep Reaction v1.0 is a news-reaction and liquidity-based trading tool designed specifically to track and trade FOMC volatility on Gold (XAUUSD) and other highly reactive instruments.
The indicator focuses on liquidity sweeps, structure breaks, and EMA reclaims that commonly occur around Federal Reserve interest-rate decisions and Powell speeches, helping traders identify high-probability reversal or continuation moves after the initial spike.
🔍 What This Indicator Detects
This tool highlights the most repeatable FOMC behaviours observed across multiple months of broker data:
• Sweeps of previous day’s high or low
• Stop-hunt wicks into liquidity pools
• EMA13 reclaim after the news spike
• Break and close beyond short-term structure
• Momentum shift following volatility exhaustion
The goal is not to predict the news, but to react to confirmed price behaviour after liquidity has been taken.
📌 Core Features
• FOMC Sweep Detection
Identifies aggressive wicks into prior highs/lows during news volatility
• EMA Reclaim Confirmation
Uses EMA13 to validate momentum shift after the sweep
• Market Structure Awareness
Filters reactions that fail to break structure to avoid false reversals
• Session-Aligned Logic
Designed around London → NY → FOMC release timing
• Clean Visuals
Minimal chart clutter for fast decision-making during volatile conditions
🧠 How to Use
Wait for FOMC release / Powell speech
Allow price to sweep previous liquidity (PDH / PDL / local extremes)
Observe reclaim of EMA13
Enter only after structure confirmation
Manage trade using EMA trailing or structure-based exits
⚠️ This is a reaction system, not a prediction tool.
📊 Best Use Cases
• XAUUSD (Gold)
• NASDAQ / US indices
• High-impact macro news events
• 5-min to 15-min timeframes
⚠️ Important Notes
• News volatility is extreme — risk management is essential
• Not designed for low-volatility or ranging markets
• Best combined with a clear trading plan and strict risk rules
📎 Disclaimer
This indicator is for educational purposes only and does not constitute financial advice. Trading during high-impact news events involves significant risk.

Ahmed Gold Signals - 5M LIVE (Frequent)📈 Gold (XAUUSD) Trading Signals – Precision-Based Strategy
Our Gold signals are built on pure price action, not random indicators or guesswork.
🔍 How our signals are generated
We focus on:
🧲 Liquidity Sweeps
Identifying when price grabs stop-losses above highs or below lows and then reverses
📊 Clear trend direction using EMA 50 & EMA 200
✅ Strong confirmation candles after the sweep
🎯 Entries only in the direction of the trend to increase accuracy
🔵 BUY Signals
Bullish market structure
Price sweeps liquidity below recent lows
Strong bullish confirmation candle closes
➡️ High-probability BUY setup
🔴 SELL Signals
Bearish market structure
Price sweeps liquidity above recent highs
Strong bearish confirmation candle closes
➡️ High-probability SELL setup
⏱️ Timeframe
5-minute chart (5M)
Fast, precise signals ideal for scalping Gold
🛡️ Risk Management
Stop loss placed beyond the liquidity sweep
Clear take-profit targets
Risk-to-reward typically 1:2 or better
⚠️ Important Notes
We do not trade every move
We wait for confirmation
Quality over quantity — always

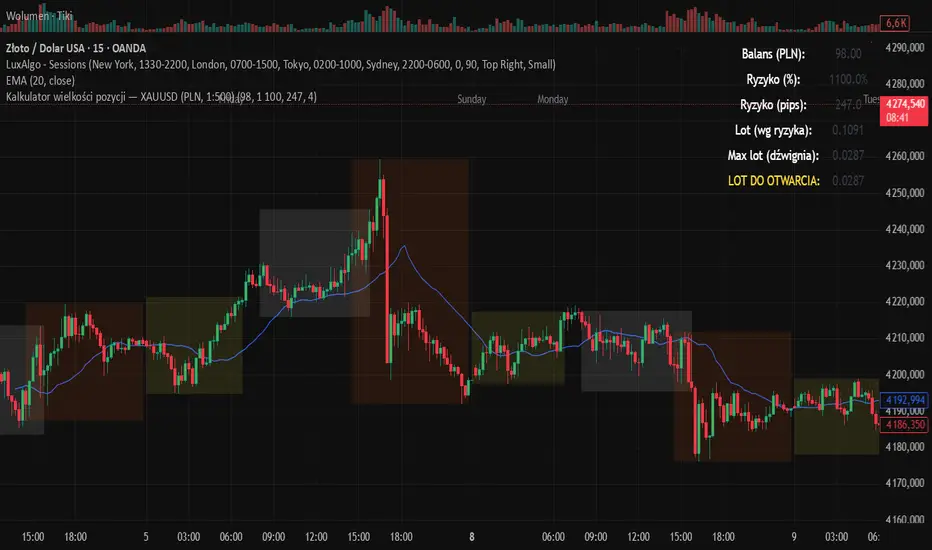
Kalkulator pozycji XAUUSD PLN, 1:500, 1100 to 100 kontaPosition calculator based on the number of pips that you quickly enter from the tool, this device will select the appropriate lot for you and you can quickly take a position
Multi-MA + RSI Pullback Strategy (Jordan)1️⃣ Strategy logic I’ll code
From your screenshots:
Indicators
• EMAs: 600 / 200 / 100 / 50
• RSI: length 6, levels 80 / 20
Rules (simplified so a script can handle them):
• Use a higher-timeframe trend filter (15m or 1h) using the EMAs.
• Take entries on the chart timeframe (you can use 1m or 5m).
• Long:
• Higher-TF trend is up.
• Price is pulling back into a zone (between 50 EMA and 100 EMA on the entry timeframe – this approximates your 50–61% retrace).
• RSI crosses below 20 (oversold).
• Short:
• Higher-TF trend is down.
• Price pulls back between 50 & 100 EMAs.
• RSI crosses above 80 (overbought).
• Exits: ATR-based stop + take-profit with adjustable R:R (2:1 or 3:1).
• Max 4 trades per day.
News filter & “only trade gold” you handle manually (run it on XAUUSD and avoid news times yourself – TradingView can’t read the economic calendar from code).

XAU Micro ScalperThis indicator is designed for short-term price rotation detection on XAUUSD, especially on the 1-minute timeframe.
It combines three momentum components—Stochastic, RSI, and OBV slope—to highlight potential reversal points and short-term scalping opportunities.
Core Logic
The script generates a signal only when multiple conditions align:
1. Stochastic Reversal (Timing Component)
A basic long/short trigger occurs when the Stochastic oscillator exits oversold (long) or overbought (short).
This represents a potential shift in short-term momentum.
2. RSI “Smart Rotation” Filter (Context Component)
Instead of using fixed oversold/overbought thresholds, the indicator checks whether RSI is turning:
Long: RSI is below a contextual ceiling (default 50) and rising
Short: RSI is above a contextual floor (default 55) and falling
This avoids premature entries during strong trending phases and confirms that momentum is actually rotating.
3. OBV Slope Filter (Volume Confirmation)
The On-Balance Volume trend is compared to its previous value:
Long: OBV slope improving
Short: OBV slope deteriorating
This helps confirm whether volume pressure is shifting in favor of the trade direction.
Both RSI and OBV filters can be enabled or disabled independently via the indicator settings.
Signals
Small circles mark raw Stochastic reversal points (unfiltered).
Green / red triangles represent validated long/short signals where all active filters agree.
Optional candle coloring highlights confirmed entry signals on the chart.
Use Cases
Intraday and scalping strategies on XAUUSD
Identifying short-term momentum reversals
Filtering noisy signals during high-volatility sessions
Studying how volume and momentum align around turning points
Customization
Users can adjust:
RSI contextual thresholds
Lookback periods
OBV slope sensitivity
Stochastic parameters
Activation of RSI and OBV filters
This flexibility allows the indicator to adapt to different market conditions and timeframes.
Disclaimer
This indicator does not provide financial advice or guarantee performance.
Always test any strategy on historical data and use proper risk management.

Momentum Candle by DNDFXMomentum Candle v2 is a simple yet powerful indicator designed to detect strong momentum candles based on candle body size and the ratio between the body and total wick.
This indicator is ideal for traders who focus on:
Momentum trading
Breakout strategies
XAUUSD (Gold) scalping
Supply & Demand / Smart Money Concepts (SMC) confirmation
🔧 How the Indicator Works
The indicator analyzes each candle and classifies it as a Bullish Momentum or Bearish Momentum candle when these conditions are met:
✅ The candle body exceeds the minimum size
✅ The total wick is smaller compared to the body
✅ The Body-to-Wick ratio meets the strength filter
Visual signals include:
Green background for bullish momentum
Red background for bearish momentum
Up/Down triangle markers as entry guidance
⚙️ Customizable Parameters
Min Body Size (Points) – Sets the minimum candle body size
Min Body : Wick Ratio – Controls how dominant the body is compared to the wicks
All parameters can be optimized according to your trading style and timeframe.
✅ Best Use Cases
This indicator is useful for:
Breakout confirmation
Momentum validation
Filtering false breakouts
Scalping and intraday trading on XAUUSD
🧠 Trading Tips
For better accuracy, combine this indicator with:
Support & Resistance
Supply & Demand zones
Break of Structure (BOS) / CHoCH
Best performance on M5 – H1 timeframes.
⚠️ DISCLAIMER
This indicator is a supporting tool, not a guaranteed profit system. Always apply proper risk management. You are fully responsible for your trading decisions.

rosha xau-usd 3.1.6 (v6)one of my fresh creations, use to trade profitably, includes months of my analysis and sgreen time for you all xauusd traders

rosha 3.1.6 (v6)ema based for scalping xauusd,good during london and newyork sassions, use withour modifications, dont enter in tranverse markate

Reversal WaveThis is the type of quantitative system that can get you hated on investment forums, now that the Random Walk Theory is back in fashion. The strategy has simple price action rules, zero over-optimization, and is validated by a historical record of nearly a century on both Gold and the S&P 500 index.
Recommended Markets
SPX (Weekly, Monthly)
SPY (Monthly)
Tesla (Weekly)
XAUUSD (Weekly, Monthly)
NVDA (Weekly, Monthly)
Meta (Weekly, Monthly)
GOOG (Weekly, Monthly)
MSFT (Weekly, Monthly)
AAPL (Weekly, Monthly)
System Rules and Parameters
Total capital: $10,000
We will use 10% of the total capital per trade
Commissions will be 0.1% per trade
Condition 1: Previous Bearish Candle (isPrevBearish) (the closing price was lower than the opening price).
Condition 2: Midpoint of the Body The script calculates the exact midpoint of the body of that previous bearish candle.
• Formula: (Previous Open + Previous Close) / 2.
Condition 3: 50% Recovery (longCondition) The current candle must be bullish (green) and, most importantly, its closing price must be above the midpoint calculated in the previous step.
Once these parameters are met, the system executes a long entry and calculates the exit parameters:
Stop Loss (SL): Placed at the low of the candle that generated the entry signal.
Take Profit (TP): Calculated by projecting the risk distance upward.
• Calculation: Entry Price + (Risk * 1).
Risk:Reward Ratio of 1:1.
About the Profit Factor
In my experience, TradingView calculates profits and losses based on the percentage of movement, which can cause returns to not match expectations. This doesn’t significantly affect trending systems, but it can impact systems with a high win rate and a well-defined risk-reward ratio. It only takes one large entry candle that triggers the SL to translate into a major drop in performance.
For example, you might see a system with a 60% win rate and a 1:1 risk-reward ratio generating losses, even though commissions are under control relative to the number of trades.
My recommendation is to manually calculate the performance of systems with a well-defined risk-reward ratio, assuming you will trade using a fixed amount per trade and limit losses to a fixed percentage.
Remember that, even if candles are larger or smaller in size, we can maintain a fixed loss percentage by using leverage (in cases of low volatility) or reducing the capital at risk (when volatility is high).
Implementing leverage or capital reduction based on volatility is something I haven’t been able to incorporate into the code, but it would undoubtedly improve the system’s performance dramatically, as it would fix a consistent loss percentage per trade, preventing losses from fluctuating with volatility swings.
For example, we can maintain a fixed loss percentage when volatility is low by using the following formula:
Leverage = % of SL you’re willing to risk / % volatility from entry point to exit or SL
And if volatility is high and exceeds the fixed percentage we want to expose per trade (if SL is hit), we could reduce the position size.
For example, imagine we only want to risk 15% per SL on Tesla, where volatility is high and would cause a 23.57% loss. In this case, we subtract 23.57% from 15% (the loss percentage we’re willing to accept per trade), then subtract the result from our usual position size.
23.57% - 15% = 8.57%
Suppose I use $200 per trade.
To calculate 8.57% of $200, simply multiply 200 by 8.57/100. This simple calculation shows that 8.57% equals about $17.14 of the $200. Then subtract that value from $200:
$200 - $17.14 = $182.86
In summary, if we reduced the position size to $182.86 (from the usual $200, where we’re willing to lose 15%), no matter whether Tesla moves up or down 23.57%, we would still only gain or lose 15% of the $200, thus respecting our risk management.
Final Notes
The code is extremely simple, and every step of its development is detailed within it.
If you liked this strategy, which complements very well with others I’ve already published, stay tuned. Best regards.

🟡 GOLD 4H HUD v8.9 — Loose ICT OB + Strong/Weak + FVG/HVN/LVNGOLD 4H HUD v8.9 is a clean, structured Smart Money Concepts (SMC)–based analysis tool designed exclusively for XAUUSD on the 4-hour timeframe.
It focuses on the three most important elements for institutional orderflow analysis:
✔ Loose ICT Order Blocks (Demand/Supply)
✔ Fair Value Gaps (FVG)
✔ Volume Profile Zones (HVN/LVN/POC)
The script builds a professional-style HUD that displays the key institutional regions and structural levels that matter most for gold traders.
📌 Key Features
1 — Market Structure Engine (HH/HL & BOS)
The indicator detects:
Minor swing Highs and Lows
Last confirmed HH / HL levels
Break of Structure (BOS) for directional bias
EMA-200 trend filter (UP / DOWN / NEUTRAL)
This gives traders a clean structural read without clutter or noise.
2 — Loose FVG Engine (Tolerance-Based ICT Gaps)
A soft-threshold FVG engine detects “loose” Fair Value Gaps using a 0.1% price tolerance.
This method ensures:
Fewer missed imbalances
Cleaner OB/FVG alignment
Higher accuracy on 4H gold displacement legs
FVGs automatically shift to the right side of the chart for clean visualization.
3 — Order Block Engine (Demand/Supply + Strong/Weak Classification)
A simplified ICT-style OB engine scans the past few candles whenever BOS is detected.
It identifies:
Demand OB during bullish BOS
Supply OB during bearish BOS
Strong OB if fully nested inside an active FVG
Weak OB otherwise
OB boxes include:
Clear color coding (strong vs. weak)
Price range labels inside each box
Automatic right-shift for visual clarity
4 — Volume Profile Engine (POC / HVN / LVN / VAH / VAL)
Based on a rolling window (default 120 bars), the script builds a lightweight volume distribution.
It displays:
POC (Point of Control)
HVN (High Volume Node)
LVN (Low Volume Node)
Value Area High / Low
HVN/LVN zones are shown as right-shifted colored boxes with price labels.
These zones help identify:
Institutional accumulation
Low-liquidity rejection points
Areas where price tends to react strongly
5 — Support / Resistance Mapping
The script automatically generates:
OB-based support/resistance
Swing-high/swing-low levels
HVN/LVN structural levels
These are displayed in the HUD for fast reference.
6 — Professional HUD Panel
A compact, easy-to-read HUD summarizes:
Trend direction
Latest HH/HL
OB ranges (Strong/Weak)
HVN/LVN price zones
POC
Multi-layer support & resistance
This turns the script into a fully functional analysis dashboard.
📌 What This Indicator Is NOT
To avoid misunderstanding:
It does not take entries or generate buy/sell signals
It does not auto-detect CHOCH, MSS, SMT, or sweeps
It is not a trading bot
This tool is designed as an institutional-style map and analysis HUD, not a strategy.
📌 Best Use Case
This indicator is ideal for traders who want to:
Read institutional structure on XAUUSD
Identify clean Demand/Supply zones
Visualize FVG/OB/HVN interactions
Track high-value liquidity levels
Build directional bias on 4H before dropping to execution timeframes
⚠ Important Note
This tool is designed exclusively for the 4H timeframe.
Using it on lower timeframes will display a warning.
