Implied Volatility TestThought for 42sOverview of the "Implied Volatility Suite" Indicator
The "Implied Volatility Suite" is a custom TradingView indicator written in Pine Script (version 6) designed to estimate and visualize implied volatility (IV) for any stock or asset charted on TradingView. Unlike true implied volatility derived from options pricing (e.g., via Black-Scholes), this script provides a synthetic approximation based on historical price data. It offers flexibility by allowing users to choose between two calculation methods: "Model Implied Volatility" (a statistical projection based on log-normal assumptions) or "VixFix" (a historical volatility proxy inspired by Larry Williams' VIX Fix indicator). The output is plotted as an oscillating line, similar to the Relative Strength Index (RSI), making it easy to interpret overbought/oversold conditions or trends in volatility. Users can select what to plot: raw Implied Volatility, IV Rank, IV Percentile, or Volatility Skew Index, with color-coded visuals for quick analysis (e.g., red/green thresholds for ranks/percentiles).
This indicator is particularly useful for stocks without listed options, where real IV data isn't available, or for traders seeking a quick volatility gauge integrated into their charts.
What the Code Does
At its core, the script computes a volatility metric and transforms it into one of four plottable formats, then displays it as a line chart in a separate pane below the main price chart. Here's a breakdown:
User Inputs and Configuration:
Volatility Calculation Method: Choose "Model Implied Volatility" (default) or "VixFix".
Expiry Parameters (for Model method): Minutes, Hours, and Days until expiry (default 45 days). These are combined into Days (as a float for fractional days) and converted to years (Expiry = Days / 365).
Length Parameters: For Model IV rank/percentile (default 365), VixFix length (default 252, with recommendations like 9, 22, etc.), and VixFix rank/percentile length (default 252).
Output Choice: Select "Implied Volatility", "IV Rank", "IV Percentile" (default "IV Rank"), or "Volatility Skew Index".
The script uses spot = close as the reference price.
Core Calculations:
Model Implied Volatility:
Computes log returns: LogReturn = math.log(spot / spot ) (percentage change between prior bars).
Calculates the simple moving average (Average) and standard deviation (STDEV) of log returns over an integer-rounded Days period.
Projects a time-adjusted mean (Time_Average = Days * Average) and standard deviation (Time_STDEV = STDEV * math.sqrt(Days)), assuming a random walk scaled by time.
Derives upper and lower bounds for the price at expiry: upper = spot * math.exp(Time_Average + 1 * Time_STDEV) and lower = spot * math.exp(Time_Average - 1 * Time_STDEV), representing a 1-standard-deviation range under log-normal distribution.
Computes the width of this range (width = upper - lower), halves it to get standard_dev, and annualizes it to sigma: sigma = standard_dev / (spot * math.sqrt(Expiry)).
Applies an "optimizer": If sigma > 1, halve it (to prevent unrealistically high values).
Result: IV (a decimal, e.g., 0.25 for 25% IV).
VixFix (Synthetic VIX Proxy):
Based on Larry Williams' VIX Fix formula, which estimates fear/volatility without options data: (ta.highest(spot, VIXFixLength) - low) / ta.highest(spot, VIXFixLength) * 100.
The script extends this for "upside" and "downside" by shifting the spot and low prices by multiples of standard deviation (0 for base VixFix).
VixFix is the average of upside(0) and downside(0), which are identical, yielding the standard VIX Fix value.
Volatility Skew Index:
Measures asymmetry in volatility (e.g., higher downside vol indicating fear).
For Model: Averages "upside IV" (calculated on spot shifted up by 1,2,3 * stdev) minus "downside IV" (shifted down).
For VixFix: Similar, but using shifted VIX Fix formulas for upside/downside.
Positive skew might indicate upside bias; negative indicates downside.
Rank and Percentile:
IV Rank: Normalizes the current volatility: (Volatility - ta.lowest(Volatility, Len)) / (ta.highest(Volatility, Len) - ta.lowest(Volatility, Len)) * 100.
IV Percentile: Uses ta.percentrank(Volatility, Len) to show what percentage of past values are below the current.
Len depends on the chosen method (e.g., 365 for Model).
Plotting and Visualization:
Selects VolatilityData based on user choice (e.g., IV * 100 for percentage display).
Applies colors: Red (<50) or green (>=50) for rank/percentile; aqua for skew; yellow for raw IV.
Plots as a line: plot(VolatilityData, color=col, title="Volatility Data").
The script switches logic seamlessly via conditionals (e.g., Volatility = VolCalc == "VixFix" ? VixFix : IV), ensuring the chosen method and output are used.
How It Works (Step-by-Step Execution Flow)
Initialization: Reads user inputs and sets spot = close. Computes Days (float) and DaysInt = math.round(Days) for integer lengths in TA functions.
Log Returns and Base Stats: For Model, calculates log returns, then SMA and STDEV over DaysInt.
Projection and IV Derivation: Scales stats to expiry time, computes bounds, derives sigma/IV.
Skew Functions: Defines reusable functions Model_Upside(i) and Model_Downside(i) (or VIX equivalents) to shift prices and recompute IV/VIX on shifted series.
Aggregation: Computes skew as average difference; sets Volatility to IV or VixFix.
Rank/Percentile/Skew: Applies over user-defined lengths.
Output Logic: Determines what to plot and its color based on VolatilityChoice.
Rendering: Plots the line in TradingView's indicator pane, updating bar-by-bar.
This leverages Pine Script's built-in functions like ta.sma, ta.stdev, ta.highest/lowest, and math.exp/log for efficiency.
Pros
Accessibility: Provides IV estimates for non-optionable assets (e.g., individual stocks, ETFs without options), filling a gap in TradingView's native tools.
Customization: Multiple methods (Model for forward-looking, VixFix for historical) and outputs (raw, ranked, percentile, skew) allow tailored analysis. Expiry adjustments make it suitable for options-like thinking.
Visual Simplicity: Oscillates like RSI (0-100 for ranks/percentiles), with intuitive colors, aiding quick decisions (e.g., high IV Rank might signal options selling opportunities).
No External Data Needed: Relies solely on chart data (close, low), making it lightweight and real-time.
Educational Value: Exposes users to volatility concepts like skew and log-normal projections, potentially improving trading strategies.
Flexibility in Timeframes: Works on any chart interval, with adjustable lengths for short-term (e.g., 9-bar VixFix) or long-term (365-day ranks).
Limitations
Not True Implied Volatility: This is a historical or model-based proxy, not derived from actual options prices. It may overestimate/underestimate real market-implied vol, especially during events (e.g., earnings) where options premium spikes unpredictably.
Assumptions in Model Method: Relies on log-normal distribution and constant volatility, ignoring fat tails, jumps, or mean reversion in real markets. The "optimizer" (halving sigma >1) is arbitrary and may distort results.
VixFix Variant Limitations: While based on a proven indicator, the upside/downside shifts (by stdev of prices, not returns) could be inaccurate for skew, as stdev(prices) doesn't scale properly with returns. It's backward-looking, not predictive like true IV.
Data Requirements: Needs sufficient historical bars (e.g., 365 for ranks), failing on new listings or short charts. Rounding Days to integer may introduce minor inaccuracies for fractional expiries.
Computational Intensity: Functions like repeated ta.stdev and shifts for skew (called multiple times per bar) could slow performance on long histories or low-power devices.
No Real-Time Options Integration: Doesn't pull live options data; users must manually compare to actual IV (e.g., via CBOE VIX for indices).
Potential for Misinterpretation: Oscillating line might mislead (e.g., high IV Rank doesn't always mean "sell vol"), and skew calculation is non-standard, requiring user expertise.
Version Dependency: Built for Pine v6 (as of 2025); future TradingView updates could break it, though it's straightforward to migrate.
Overall, this script is a valuable tool for volatility-aware trading but should be used alongside other indicators (e.g., ATR, Bollinger Bands) and validated against real options data when available. For improvements, consider backtesting its signals or integrating alerts for thresholds.1.9sHow can Grok help?
In den Scripts nach "williams" suchen
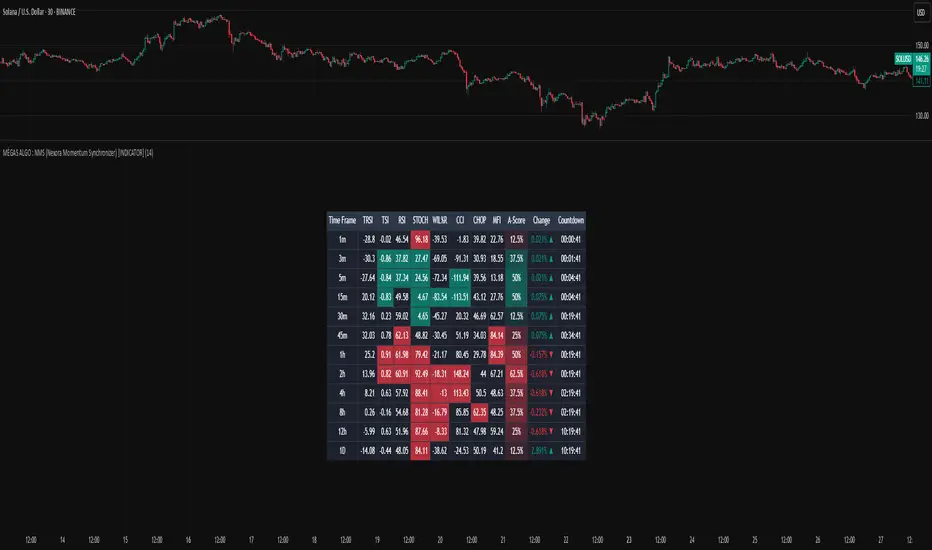
MÈGAS ALGO : NMS (Nexora Momentum Synchronizer) [INDICATOR]Overview
The NMS (Nexora Momentum Synchronizer) is a multi-timeframe indicator that aggregates and analyzes data of multiple momentum oscillators across different timeframes (1m, 5m, 15m, 30m, 45m, 1h, 2h, 4h, 8h, 12h and 24h).
A user-friendly table displaying the indicator’s current values for each timeframe simultaneously.
The script, thanks to the best technical momentum indicators provided by Tradingview, evaluates trend strength and market momentum through synchronized readings of TRSI , TSI , RSI , Stochastic RSI , Williams %R , and CCI.
In addition to the indicator also tracks:
-percentage change in price from the last bar's open across each timeframes
-countdown time to bar close
This indicator caters to the diverse needs of traders, whether they are focused on short-term momentum bursts or long-term trend-following strategies.
By synchronizing momentum indicators, real-time price change(%) from last open and countdow time to close, across multiple timeframes, this tool provides a holistic view of market dynamics, empowering traders to make informed decisions with confidence.
Key Features
1.Multi-Timeframe Momentum Analysis
The Nexora Momentum Synchronizer performs an analysis of key momentum indicator :
—Trend Strength Index (TSI) , True Strength Index (TSI) , Relative Strength Index (RSI) , Stochastic Oscillator (STOCH), Williams Percent Range (W%R) and Commodity Channel Index (CCI) —across multiple timeframes. This ensures traders receive a
comprehensive understanding of momentum alignment, helping them identify high-probability
trade setups with reduced noise and false signals.
In addition to oscillator alignment and regression-based zone detection, the script includes:
-real-time price change(%) from last open for each timeframe, providing insight into intrabar momentum and directional bias.
-real-time countdown to bar close , displayed directly in the table, which enhances timing precision and supports scalping or event-based trading strategies.
These tools combine to offer a comprehensive, real-time framework for both discretionary and alert-driven trading systems.
2.Customizable Parameters
Fully adjustable settings allow traders to tailor the indicator to their specific preferences and
adapt to diverse market conditions. From adjusting overbought and oversold levels to selecting preferred timeframes for alignment alerts, the Nexora Momentum Synchronizer offers unparalleled flexibility to meet individual trading styles.
3.Multi-Timeframe Alerts
Traders can set up alerts for momentum alignment across up to four different timeframes. These alerts ensure that no opportunity is missed, regardless of the trading horizon or strategy being employed.
These alerts can be set up to three different mode : All (to never miss opportunity), Once_for_Bar (to limit to one alert triggered during bar's period) or Bar_Close (to avoid earlier bias).
4.User-Friendly Interface
Designed with simplicity in mind, the Nexora Momentum Synchronizer features an intuitive
table interface that makes complex data easy to interpret. Clear visual cues and
interactive elements allow traders to focus on executing strategies without being
overwhelmed by cluttered charts.
Advantages of Nexora Momentum Synchronizer
Flexibility : Fully customizable parameters ensure the indicator adapts to diverse market
conditions and trader preferences.
Comprehensive Analysis : Multi-timeframe evaluation of momentum indicators provides a
holistic view of market dynamics, enhancing trade confidence.
Real-Time Alerts : Multi-timeframe alert functionality keeps traders informed of critical
market movements and momentum shifts across different horizons.
Please Note:
This indicator is provided for informational and educational purposes only. It is not financial advice, and it should not be considered a recommendation to buy, sell, or trade any financial instrument. Trading involves significant risks, including the potential loss of your entire investment. Always conduct your own research and consult with a licensed financial advisor before making any trading decisions.
The results and images provided are based on algorithms and historical/paid real-time market data but do not guarantee future results or accuracy. Use this tool at your own risk, and understand that past performance is not indicative of future outcomes.
Magnificent 7 OscillatorThe Magnificent 7 Oscillator is a sophisticated momentum-based technical indicator designed to analyze the collective performance of the seven largest technology companies in the U.S. stock market (Apple, Microsoft, Alphabet, Amazon, NVIDIA, Tesla, and Meta). This indicator incorporates established momentum factor research and provides three distinct analytical modes: absolute momentum tracking, equal-weighted market comparison, and relative performance analysis. The tool integrates five different oscillator methodologies and includes advanced breadth analysis capabilities.
Theoretical Foundation
Momentum Factor Research
The indicator's foundation rests on seminal momentum research in financial markets. Jegadeesh and Titman (1993) demonstrated that stocks with strong price performance over 3-12 month periods tend to continue outperforming in subsequent periods¹. This momentum effect was later incorporated into formal factor models by Carhart (1997), who extended the Fama-French three-factor model to include a momentum factor (UMD - Up Minus Down)².
The momentum calculation methodology follows the academic standard:
Momentum(t) = / P(t-n) × 100
Where P(t) is the current price and n is the lookback period.
The focus on the "Magnificent 7" stocks reflects the increasing market concentration observed in recent years. Fama and French (2015) noted that a small number of large-cap stocks can drive significant market movements due to their substantial index weights³. The combined market capitalization of these seven companies often exceeds 25% of the total S&P 500, making their collective momentum a critical market indicator.
Indicator Architecture
Core Components
1. Data Collection and Processing
The indicator employs robust data collection with error handling for missing or invalid security data. Each stock's momentum is calculated independently using the specified lookback period (default: 14 periods).
2. Composite Oscillator Calculation
Following Fama-French factor construction methodology, the indicator offers two weighting schemes:
- Equal Weight: Each active stock receives identical weighting (1/n)
- Market Cap Weight: Reserved for future enhancement
3. Oscillator Transformation Functions
The indicator provides five distinct oscillator types, each with established technical analysis foundations:
a) Momentum Oscillator (Default)
- Pure rate-of-change calculation
- Centered around zero
- Direct implementation of Jegadeesh & Titman methodology
b) RSI (Relative Strength Index)
- Wilder's (1978) relative strength methodology
- Transformed to center around zero for consistency
- Scale: -50 to +50
c) Stochastic Oscillator
- George Lane's %K methodology
- Measures current position within recent range
- Transformed to center around zero
d) Williams %R
- Larry Williams' range-based oscillator
- Inverse stochastic calculation
- Adjusted for zero-centered display
e) CCI (Commodity Channel Index)
- Donald Lambert's mean reversion indicator
- Measures deviation from moving average
- Scaled for optimal visualization
Operational Modes
Mode 1: Magnificent 7 Analysis
Tracks the collective momentum of the seven constituent stocks. This mode is optimal for:
- Technology sector analysis
- Growth stock momentum assessment
- Large-cap performance tracking
Mode 2: S&P 500 Equal Weight Comparison
Analyzes momentum using an equal-weighted S&P 500 reference (typically RSP ETF). This mode provides:
- Broader market momentum context
- Size-neutral market analysis
- Comparison baseline for relative performance
Mode 3: Relative Performance Analysis
Calculates the momentum differential between Magnificent 7 and S&P 500 Equal Weight. This mode enables:
- Sector rotation analysis
- Style factor assessment (Growth vs. Value)
- Relative strength identification
Formula: Relative Performance = MAG7_Momentum - SP500EW_Momentum
Signal Generation and Thresholds
Signal Classification
The indicator generates three signal states:
- Bullish: Oscillator > Upper Threshold (default: +2.0%)
- Bearish: Oscillator < Lower Threshold (default: -2.0%)
- Neutral: Oscillator between thresholds
Relative Performance Signals
In relative performance mode, specialized thresholds apply:
- Outperformance: Relative momentum > +1.0%
- Underperformance: Relative momentum < -1.0%
Alert System
Comprehensive alert conditions include:
- Threshold crossovers (bullish/bearish signals)
- Zero-line crosses (momentum direction changes)
- Relative performance shifts
- Breadth Analysis Component
The indicator incorporates market breadth analysis, calculating the percentage of constituent stocks with positive momentum. This feature provides insights into:
- Strong Breadth (>60%): Broad-based momentum
- Weak Breadth (<40%): Narrow momentum leadership
- Mixed Breadth (40-60%): Neutral momentum distribution
Visual Design and User Interface
Theme-Adaptive Display
The indicator automatically adjusts color schemes for dark and light chart themes, ensuring optimal visibility across different user preferences.
Professional Data Table
A comprehensive data table displays:
- Current oscillator value and percentage
- Active mode and oscillator type
- Signal status and strength
- Component breakdowns (in relative performance mode)
- Breadth percentage
- Active threshold levels
Custom Color Options
Users can override default colors with custom selections for:
- Neutral conditions (default: Material Blue)
- Bullish signals (default: Material Green)
- Bearish signals (default: Material Red)
Practical Applications
Portfolio Management
- Sector Allocation: Use relative performance mode to time technology sector exposure
- Risk Management: Monitor breadth deterioration as early warning signal
- Entry/Exit Timing: Utilize threshold crossovers for position sizing decisions
Market Analysis
- Trend Identification: Zero-line crosses indicate momentum regime changes
- Divergence Analysis: Compare MAG7 performance against broader market
- Volatility Assessment: Oscillator range and frequency provide volatility insights
Strategy Development
- Factor Timing: Implement growth factor timing strategies
- Momentum Strategies: Develop systematic momentum-based approaches
- Risk Parity: Use breadth metrics for risk-adjusted portfolio construction
Configuration Guidelines
Parameter Selection
- Momentum Period (5-100): Shorter periods (5-20) for tactical analysis, longer periods (50-100) for strategic assessment
- Smoothing Period (1-50): Higher values reduce noise but increase lag
- Thresholds: Adjust based on historical volatility and strategy requirements
Timeframe Considerations
- Daily Charts: Optimal for swing trading and medium-term analysis
- Weekly Charts: Suitable for long-term trend analysis
- Intraday Charts: Useful for short-term tactical decisions
Limitations and Considerations
Market Concentration Risk
The indicator's focus on seven stocks creates concentration risk. During periods of significant rotation away from large-cap technology stocks, the indicator may not represent broader market conditions.
Momentum Persistence
While momentum effects are well-documented, they are not permanent. Jegadeesh and Titman (1993) noted momentum reversal effects over longer time horizons (2-5 years).
Correlation Dynamics
During market stress, correlations among the constituent stocks may increase, reducing the diversification benefits and potentially amplifying signal intensity.
Performance Metrics and Backtesting
The indicator includes hidden plots for comprehensive backtesting:
- Individual stock momentum values
- Composite breadth percentage
- S&P 500 Equal Weight momentum
- Relative performance calculations
These metrics enable quantitative strategy development and historical performance analysis.
References
¹Jegadeesh, N., & Titman, S. (1993). Returns to buying winners and selling losers: Implications for stock market efficiency. Journal of Finance, 48(1), 65-91.
Carhart, M. M. (1997). On persistence in mutual fund performance. Journal of Finance, 52(1), 57-82.
Fama, E. F., & French, K. R. (2015). A five-factor asset pricing model. Journal of Financial Economics, 116(1), 1-22.
Wilder, J. W. (1978). New concepts in technical trading systems. Trend Research.

S/R with Multi-Indicator ConsensusThis script identifies key support and resistance levels by analyzing consensus across multiple technical indicators. Here's how it works:
Core Concept
The script monitors 14 different technical indicators simultaneously, looking for areas where most indicators agree on potential reversal points. When a strong consensus emerges (over 60% agreement by default), it marks these price levels as significant support or resistance zones.
Indicator Analysis
The script uses an advanced "harmonic convergence" technique that examines:
Momentum indicators (RSI, Stochastic, Williams %R)
Volume-based indicators (OBV, MFI)
Trend indicators (MACD, WaveTrend)
Volatility measures (ATR, Bollinger Bands)
Special proprietary oscillators (RVI, Ultimate Oscillator)
Each indicator is normalized to a 0-100 scale for consistent comparison. The script then applies a "quantum weighting" algorithm that gives more importance to indicators showing extreme readings.
Support/Resistance Identification
When multiple indicators simultaneously reach overbought or oversold conditions near the same price level, the script:
Records these "harmonic convergence points"
Applies volume-based weighting (heavier volume = stronger level)
Uses time decay to fade older, less relevant levels
Groups nearby levels using a proprietary "price magnetism" algorithm
Visual Features
Colored Lines: Red for resistance, green for support
Line Styles: Solid (strong), dashed (medium), dotted (weak)
Dynamic Width: Thicker lines indicate stronger consensus
Info Labels: Show price, strength percentage, and touch count
Info Table: Displays key statistics in the corner
In this script, "Consensus Type" refers to whether the majority of indicators are signaling a potential support (oversold) or resistance (overbought) level.
How It Works:
The script checks multiple normalized indicators (RSI, Stochastic, MACD, OBV, etc.) to see if they are in overbought (OB) or oversold (OS) zones.
It calculates a consensus score (0% to 100%) based on how many indicators agree:
Type = 1 → Most indicators are in overbought (resistance likely).
Type = -1 → Most indicators are in oversold (support likely).
Type = 0 → No clear consensus (neutral).
The strength of the signal depends on the consensus score (higher = stronger level).
Example:
If RSI, Stochastic, and MACD are all in overbought territory (above ob_threshold), the script detects a Type 1 (Resistance).
If Williams %R, CCI, and OBV are oversold (below os_threshold), it detects a Type -1 (Support).
Why It Matters:
Helps traders identify high-probability reversal zones.
Filters out weak levels where indicators don’t agree.
Works alongside volume weighting & time decay to prioritize the strongest S/R levels.
The Info Table in the top-right corner shows the current Consensus Type (1, -1, or 0) and its strength (e.g., 75% means 75% of indicators agree on resistance/support).

Overnight ES Strategy: CBC + Fractal + RSI + ATR FilterThis script is designed for overnight trading of the E-mini S&P 500 futures (ES) between 6 PM and 11 PM EST.
It combines multiple technical confluences to generate high-probability buy and sell signals, focusing on volatility-rich, low-liquidity evening sessions.
Key Features:
Candle Body Confluence (CBC) Approximation:
Identifies candles with small real bodies compared to total range, simulating consolidation zones where price is likely to reverse.
Williams Fractal Confirmation:
Detects local tops and bottoms based on 5-bar fractal reversal patterns, helping validate breakout or reversal points.
RSI Filter:
Ensures momentum is supportive — buys only when RSI < 35 (oversold) and sells only when RSI > 65 (overbought).
ATR Volatility Filter:
Trades are only allowed if the Average True Range (ATR) exceeds a user-defined threshold, filtering out low-volatility, risky environments.
Time Session Control:
Signals are only generated during the user-defined evening session (default: 6 PM to 11 PM EST) to match market behavior.
Real-Time Alerts Enabled:
Alerts can be set for BUY or SELL conditions, enabling mobile notifications, emails, or pop-ups without constant chart monitoring.
Recommended Settings:
Chart Timeframe: 15-minute or 30-minute candles
Assets: ES Mini (ES1!), NQ Mini, or other CME futures
Session: New York Time (EST)
ATR Threshold: Adjust based on market conditions; 5.0 suggested starting point for ES Mini on 15m.
Important:
This script only plots signals, it does not auto-execute trades.
Always backtest and paper trade before using live capital.
Volatility can vary; consider adjusting RSI and ATR filters based on market environment.
Credits:
Script designed based on confluence of price action, momentum, reversal structure, and volatility filtering principles used by professional traders.
Inspired by Candle Body Confluence (CBC) theory and Williams fractal techniques.

Multiple Values TableThis Pine Script indicator, named "Multiple Values Table," provides a comprehensive view of various technical indicators in a tabular format directly on your trading chart. It allows traders to quickly assess multiple metrics without switching between different charts or panels.
Key Features:
Table Position and Size:
Users can choose the position of the table on the chart (e.g., top left, top right).
The size of the table can be adjusted (e.g., tiny, small, normal, large).
Moving Averages:
Calculates the 5-day Exponential Moving Average (5DEMA) using daily data.
Calculates the 5-week and 20-week EMAs (5WEMA and 20WEMA) using weekly data.
Indicates whether the current price is above or below these moving averages in percentage terms.
Drawdown and Williams VIX Fix:
Computes the drawdown from the 365-day high to the current close.
Calculates the Williams VIX Fix (WVF), which measures the volatility of the asset.
Shows both the current WVF and a 2% drawdown level.
Relative Strength Index (RSI):
Displays the current RSI and compares it to the RSI from 14 days ago.
Indicates whether the RSI is increasing, decreasing, or flat.
Stochastic RSI:
Computes the Stochastic RSI and compares it to the value from 14 days ago.
Indicates whether the Stochastic RSI is increasing, decreasing, or flat.
Normalized MACD (NMACD):
Calculates the Normalized MACD values.
Indicates whether the MACD is increasing, decreasing, or flat.
Awesome Oscillator (AO):
Calculates the AO on a daily timeframe.
Indicates whether the AO is increasing, decreasing, or flat.
Volume Analysis:
Displays the average volume over the last 22 days.
Shows the current day's volume as a percentage of the average volume.
Percentile Calculations:
Calculates the current percentile rank of the WVF and ATH over specified periods.
Indicates the percentile rank of the current volume percentage over the past period.
Table Display:
All these values are presented in a neatly formatted table.
The table updates dynamically with the latest data.
Example Use Cases:
Comprehensive Market Analysis: Quickly assess multiple indicators at a glance.
Trend and Momentum Analysis: Identify trends and momentum changes based on various moving averages and oscillators.
Volatility and Drawdown Monitoring: Track volatility and drawdown levels to manage risk effectively.
This script offers a powerful tool for traders who want to have a holistic view of various technical indicators in one place. It provides flexibility in customization and a user-friendly interface to enhance your trading experience.

Buy/Sell Signals for CM_Williams_Vix_FixThis script in Pine Script is designed to create an indicator that generates buy and sell signals based on the Williams VIX Fix (WVF) indicator. Here’s a brief explanation of how this script works:
Main Components:
Williams VIX Fix (WVF) – This volatility indicator is calculated using the formula:
WVF
=
(
highest(close, pd)
−
low
highest(close, pd)
)
×
100
WVF=(
highest(close, pd)
highest(close, pd)−low
)×100
where highest(close, pd) represents the highest closing price over the period pd, and low represents the lowest price over the same period.
Bollinger Bands are used to determine levels of overbought and oversold conditions. They are constructed around the moving average (SMA) of the WVF value using standard deviation (SD).
Ranges based on percentiles help identify extreme levels of WVF values to spot entry and exit points.
Buy and sell signals are generated when the WVF crosses the Bollinger Bands lines or reaches the ranges based on percentiles.
Adjustable Parameters:
LookBack Period Standard Deviation High (pd): The lookback period for calculating the highest closing price.
Bolinger Band Length (bbl): The length of the period for constructing the Bollinger Bands.
Bollinger Band Standard Devaition Up (mult): The multiplier for the standard deviation used for the upper Bollinger Band.
Look Back Period Percentile High (lb): The lookback period for calculating maximum and minimum WVF values.
Highest Percentile (ph): The percentile threshold for determining the high level.
Lowest Percentile (pl): The percentile threshold for determining the low level.
Show High Range (hp): Option to display the range based on percentiles.
Show Standard Deviation Line (sd): Option to display the standard deviation line.
Signals:
Buy Signal: Generated when the WVF crosses above the lower Bollinger Band or falls below the lower boundary of the percentile-based range.
Sell Signal: Generated when the WVF crosses below the upper Bollinger Band or rises above the upper boundary of the percentile-based range.
These signals are displayed as triangles below or above the candles respectively.
Application:
The script can be used by traders to analyze market conditions and make buying or selling decisions based on volatility and price behavior.

rsi wf breakoutRSI Breakout Asif
RSI Breakout Asif Indicator
Overview:
The RSI Breakout Asif indicator is a custom script designed to analyze and highlight potential
breakout points using the Relative Strength Index (RSI) combined with Williams Fractals. This
indicator is specifically developed for traders who want to identify key momentum shifts in the
market.
Features:
1. RSI Analysis:
- The RSI is calculated using a user-defined length and price source.
- Horizontal lines are plotted at levels 70 (overbought), 50 (neutral), and 30 (oversold) to visually
aid decision-making.
2. Williams Fractals on RSI:
- Detects fractal highs and lows based on RSI values.
- Highlights these fractal points with dynamic, symmetrical lines for better visibility.
3. Customization:
- Users can adjust the RSI length and price source for personalized analysis.
- Fractal settings (left and right bar length) are also adjustable, making the indicator versatile for
different trading styles.
4. Visual Enhancements:
- Fractal highs are marked in red, while fractal lows are marked in green.
Asif - Page 1
RSI Breakout Asif
- Precise line placement ensures clarity and reduces chart clutter.
5. Practical Utility:
- Use the fractal breakout signals in conjunction with other technical indicators for enhanced
decision-making.
Usage:
- Add the RSI Breakout Asif indicator to your TradingView chart.
- Adjust the settings according to your trading strategy.
- Observe the RSI values and fractal points to identify potential breakout zones.
Disclaimer:
This indicator is a technical analysis tool and should be used in combination with other analysis
methods. It does not guarantee profitable trades.
Watermarked by Asif.
Asif - Page 2

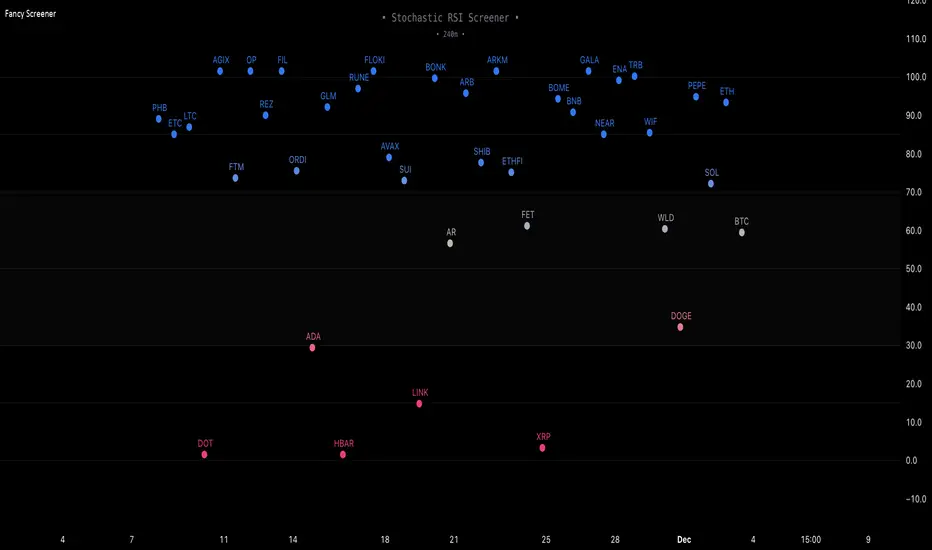
Fancy Oscillator Screener [Daveatt]⬛ OVERVIEW
Building upon LeviathanCapital original RSI Screener (), this enhanced version brings comprehensive technical analysis capabilities to your trading workflow. Through an intuitive grid display, you can monitor multiple trading instruments simultaneously while leveraging powerful indicators to identify market opportunities in real-time.
⬛ FEATURES
This script provides a sophisticated visualization system that supports both cross rates and heat map displays, allowing you to track exchange rates and percentage changes with ease. You can organize up to 40 trading pairs into seven customizable groups, making it simple to focus on specific market segments or trading strategies.
If you overlay on any circle/asset on the chart, you'll see the accurate oscillator value displayed for that asset
⬛ TECHNICAL INDICATORS
The screener supports the following oscillators:
• RSI - the oscillator from the original script version
• Awesome Oscillator
• Chaikin Oscillator
• Stochastic RSI
• Stochastic
• Volume Oscillator
• CCI
• Williams %R
• MFI
• ROC
• ATR Multiple
• ADX
• Fisher Transform
• Historical Volatility
• External : connect your own custom oscillator
⬛ DYNAMIC SCALING
One of the key improvements in this version is the implementation of dynamic chart scaling. Unlike the original script which was optimized for RSI's 0-100 range, this version automatically adjusts its scale based on the selected oscillator.
This adaptation was necessary because different indicators operate on vastly different numerical ranges - for instance, CCI typically ranges from -200 to +200, while Williams %R operates from -100 to 0.
The dynamic scaling ensures that each oscillator's data is properly displayed within its natural range, making the visualization both accurate and meaningful regardless of which indicator you choose to use.
⬛ ALERTS
I've integrated a comprehensive alert system that monitors both overbought and oversold conditions.
Users can now set custom threshold levels for their alerts.
When any asset in your monitored group crosses these thresholds, the system generates an alert, helping you catch potential trading opportunities without constant manual monitoring.
em will help you stay informed of market movements and potential trading opportunities.
I hope you'll find this tool valuable in your trading journey
All the BEST,
Daveatt
Weekly COTAdjusted COT Index
Improves upon: "COT Index Commercials vs large and small Speculators" by SystematicFutures
How: CoT Indexes are adjusted by Open Interest to normalise data over time, and threshold background colours are in-line with Larry Williams recommendations from his book.
Note: This indicator is **only** accurate on the Daily time-frame due to the mid-week release date for CoT data.
This script calculates and plots the Adjusted Commitment of Traders (COT) Index for Commercial, Large Speculator, and Retail (Small Speculator) categories.
The CoT Index is adjusted by Open Interest to normalise data through time, following the methodology of Larry Williams, providing insights into how these groups are positioned in the market with an arguably more historically accurate context.
COT Categories
-------------------
- Commercials (Producers/Hedgers): Large entities hedging against price changes in the underlying asset.
- Large Speculators (Non-commercials): Professional traders and funds speculating on price movements.
- Retail Traders (Nonreportable/Small Speculators): Small individual traders, typically less informed.
Features
----------
- Open Interest Adjustment
- The net positions for each category are normalized by Open Interest to account
for varying contract sizes.
- Customisable Look-back Period
- You can adjust the number of weeks for the index calculation to control the
historical range used for comparison.
- Thresholds for Extremes
- Upper and lower thresholds (configurable) are provided to mark overbought and
oversold conditions.
- Defaults
- Overbought: <=20
- Oversold: >= 80
- Hide Current Week Option
- Optionally hide the current week's data until market close for more accurate comparison.
- Visual Aids
- Plot the Commercials, Large Speculators, and Retail indexes, and optionally highlight extreme positioning.
Inputs
--------
- weeks
- Number of weeks for historical range comparison.
- upperExtreme and lowerExtreme
- Thresholds to identify overbought/oversold conditions (default 80/20).
- hideCurrentWeek
- Option to hide current week's data until market close.
- markExtremes
- Highlight extremes where any index crosses the upper or lower thresholds.
- Options to display or hide indexes for Commercials, Large Speculators, and Small Speculators.
Outputs
----------
- The script plots the COT Index for each of the three categories and highlights periods of extreme positioning with customisable thresholds.
Usage
-------
- This tool is useful for traders who want to track the positioning of different market participants over time.
- By identifying the extreme positions of Commercials, Large Speculators, and Retail traders, it can give insights into market sentiment and potential reversals.
- Reversals of trend can be confirmed with RSI Divergence (daily), for example
- Continuation can be confirmed with RSI overbought/oversold conditions (daily), and/or hidden RSI Hidden Divergence, for example

Flush Percent RangeFans of Woodies CCI may recognize the approach to this one. This is my attempt at using the same methods but for taking the highs and lows into account without the standard deviation of the CCI. The smoothness of other oscillators may not be ideal however the Williams Percent Range is a fast stochastic that also operates within a channel. This provides an alternative yet still complex view for the virtuoso. A unique feature is total utilization of the weighted moving average, from the standard to the more complex. A fun fact is the Hull Moving Average is actually calculated using weighted moving averages.
How to use:
The base length is for accuracy, the fast length is for catching all the moves(even the wrong ones sometimes.)
The bars back option will not flip the histogram/base trend to its bullish/bearish alternative until the base plot remains on the latter half of the oscillator for a certain number of bars. This can be set to zero if desired.
The factor controls the chop on the various levels. A higher number will increase it.
The oscillator levels are measuring slope, price relative to the average, and a summation of percent changes between the two. Both the baseline/histogram and the levels have color coding for bullishness, bearishness, and indecision(depending on the factor.) The fast line matches the indecision color by default. This is all customizable.
There are many potential ways to trade with this indicator. From hooks back toward the trend and range line crossovers to divergence and reversals. It's important to note the current performance of the oscillator levels. Time cycles may come in handy along with other forecasting tools.
Lastly, there are optional linear regression lines plotted on the chart. They're synchronized to the lengths in the oscillator. This is an additional visual aid to provide context to the direction of the channel.
Overall the Flush Percent Range is for analyzing multiple regression models within a single price channel. No smoothing, fast averages, and specified timeframes of highs/lows. Credit to Larry Williams for the original calculation and Ken Woods for design/methodology inspiration.

ka66: Swing/Pivot Point LinesThis indicator draws swing-highs and swing-lows, also called pivot highs and lows.
A swing high is a bar which has a higher-high than its surrounding bars (to the left and the right).
A swing low is a bar which has a lower-low than its surrounding bars (to the left and the right).
A common example of a pivot is Bill Williams' Fractal, which specifies that the centre bar must have a higher high than 2 bars to its left, and 2 bars to its right for a swing high, taking into account 5 bars at a time. Similarly, for a swing low, the centre bar must have a lower low than the 2 bars to its left and right.
This indicator allows configurable adjacent bars as input. Entering 2, means it essentially picks out a Williams Fractal. But you can select 1 (say for higher timeframes), using one 1 bar to the left and right of the centre bar.
The indicator will draw Swing/Pivot High/Low as circles at the same price level as the centre bar, till the next one shows up. Drawing is offset so it starts at the centre bar (the swing bar), showing exactly where the pivot bar is.
There are 2 main uses of pivot points, in various strategies:
Market Structure: to objectively define higher-highs/lows and lower-highs/lows in Trend Analysis.
More generally, to then determine if a trend might reverse, or continue as pivot levels are broken.
Messy pivot structures easily point out ranging markets.
There are a few of these, some closed source, which I don't like, since I think people should generally know what they are trading with, and I want to make sure I understand the logic exactly.
Gabriels Trend Regularity Adaptive Moving Average Dragon This is an improved version of the trend following Williams Alligator, through the use of five Trend Regularity Adaptive Moving Averages (TRAMA) instead of three smoothed averages (SMMA). This indicator can double as a TRAMA Ribbon indicator by reducing the offset to zero. Whereas the active offset can double as a forecasting indicator for options and futures.
This indicator uses five TRAMAs, set at 8, 21, 55, 144, and 233 periods. They make up the Lips, Teeth, Jaws, Wings, and Tail of the Dragon. This indicator uses convergence-divergence relationships to build trading signals, with the Tail making the slowest turns and the Lips making the fastest turns. The Lips crossing downwards through the other lines signal a short opportunity, whereas Lips crossing upwards through other lines signal a buying opportunity. The downward cross can be referred to as the Dragon "Sleeping" , and the upward cross as the Dragon "Awakening" .
In particular, but not limited to, the Wings and Tail movements possess a Roar-like forecast effect on the market. Respectively, they can be referred to as the Dragon "Spreading its Wings" or "Swinging its Tail" .
The first three lines, stretching apart and constantly moving higher or lower, denote periods in which long or short equity positions should be managed and maintained. This can be referred to as the Dragon "Eating with a mouth wide open" . Whereas indicator lines converging into narrow bands and shifting into a horizontal position can denote a trending period coming to an end, signaling the need for profit-taking and position realignment. Conversely, a previous flat line moving can denote a new trending period starting.
This indicator can double as a Multiple TRAMAs indicator by reducing the offset to zero. As such, very interesting results can be observed when used in a moving average crossover system such as the Williams Alligator or as trailing support and resistance.
The following moving average adapts to the average of the highest high and lowest low made over a specific period, thus adapting to trend strength. The TRAMA can be used like most moving averages, with the advantage of being smoother during ranging markets because it is calculated through exponential averaging.
It is calculating, using a smoothing factor, the squared simple moving average of the number of highest highs or lowest lows previously made. Where the highest highs and lowest lows are calculated using rolling maximums and minimums. Therefore, squaring allows the moving average to penalize lower values, thus appearing stationary during ranging markets.
As with all moving averages, it is still a lagging indicator, and it can suffer whipsaws when the market moves too violently or when it consolidates in ranging conditions. Despite it working in all timeframes, it won't be as formidable in the 1–5-minute scalping timeframes due to that. I would suggest 5 to 45 minutes if you are a swing trader, or hourly, daily, and weekly if you are a long-term investor.
I hope you enjoy this indicator! It's the first indicator I made, so constructive criticism would be appreciated. Thanks!
Advanced Divergence OscillatorIntroduction to ADO
The Advanced Divergence Oscillator (ADO) is a modern tool crafted for traders in various markets like stocks, forex, or cryptocurrencies. Imagine it as a smart gadget that helps you understand the ebb and flow of market prices. Unlike standard tools, ADO provides a more nuanced view, enabling you to grasp subtle changes in market trends.
Functionality of ADO
ADO operates by observing and comparing market price movements over different timeframes. Picture a racetrack where cars are moving at various speeds. Some are racing ahead, while others are gradually picking up pace. ADO keeps track of these varying 'speeds' in market prices.
By analyzing these movements, ADO generates a smooth, flowing line – the oscillator. This line moves in a wave-like pattern, offering hints about the market's momentum and possible future trends. When the line moves up, it suggests increasing prices, and when it moves down, it hints at falling prices.
How to Use ADO
Setup: You can easily integrate ADO into your trading platform, adjusting settings like length and color to suit your preference.
Reading the Oscillator: Watch for the oscillator's movement. Rising and falling patterns can indicate potential buying or selling opportunities.
Identifying Divergences: ADO excels in spotting divergences – situations where market prices and the oscillator don't align. For instance, if prices are climbing but the oscillator is falling, it might signal a potential price drop ahead.
Brief History of the Ultimate Oscillator
The concept of oscillators in trading isn’t new. The Ultimate Oscillator, developed by Larry Williams in the 1970s, is a foundational tool in this field. Williams' innovation was to combine short, intermediate, and long-term market trends into a single oscillator. This approach offered a more comprehensive market view, helping traders make informed decisions.
The ADO is a step further in this evolution. It takes the core principles of the Ultimate Oscillator and enhances them with proper smoothing and divergence detection methods. This evolution represents the continuous effort in the trading community to refine tools for better market analysis and decision-making.
LW StructureThis easy and intuitive tool can be helpful to capture market trends.
This indicator marks the max and the min generated from the price with labels. The green labels are for the max peak and the red label for the min peak. This tool is inspired to the Larry Williams technique to easily catch the trend basing on the decreasing maximums and increasing mininums of the market structure.
Drawing inspiration from the Larry Williams approach, the LW Structure Indicator simplifies the process of recognizing trend patterns through the lens of market structure dynamics .
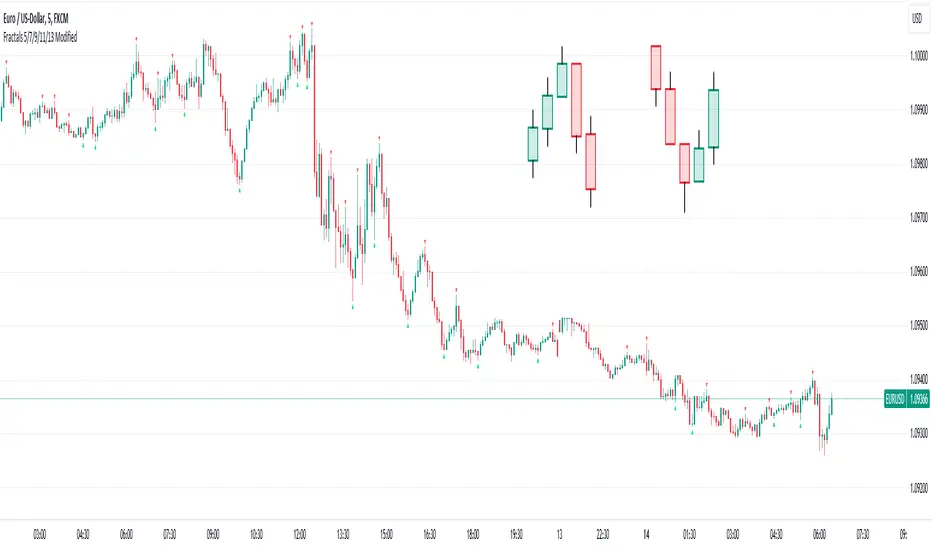
Fractals 5/7/9/11/13 ModifiedDescription:
The Modified Fractals Indicator is designed to help traders identify specific fractal patterns on a chart. Unlike traditional Williams Fractals, this indicator focuses on highlighting two distinct types of fractals:
- UpFractals: These fractals are identified when each preceding candle has a higher high than the one before it, and each succeeding candle has a higher high than the one following it.
- DownFractals: Conversely, DownFractals are detected when each preceding candle has a lower low than the one before it, and each succeeding candle has a lower low than the one following it.
This unique approach sets it apart from standard Fractal indicators.
Features:
1. Originality and Uniqueness: This indicator employs a distinctive algorithm to detect and display modified fractals, providing a fresh perspective on price reversals.
2. Customizable Parameters: Users can fine-tune the indicator to their trading strategy by adjusting the candle count and arrow size.
3. Easy-to-Understand Chart: The Modified Fractals Indicator is designed to provide clear and easily identifiable signals on your chart, enhancing your trading experience.
4. User-Friendly Interface: This indicator is user-friendly and can be easily integrated into your TradingView setup.
How it Works:
The Modified Fractals Indicator scans the price action on your chart and identifies specific fractal patterns based on the criteria mentioned above for both UpFractals and DownFractals.
Usage:
- Add the Modified Fractals Indicator to your TradingView chart.
- Customize the settings, including the candle count and arrow size, to align with your trading strategy.
- Observe the chart for the appearance of UpFractals and DownFractals as marked by the indicator's arrows.
- Use the signals provided by the indicator to inform your trading decisions, such as potential entry or exit points.
Please note that this Modified Fractals Indicator offers a unique approach to fractal analysis, focusing on specific price patterns that differ from traditional Williams Fractals. It provides traders with an additional tool for identifying potential trend reversals and market opportunities.
Volumen Salvatierra
The "Salvatierra Volume" Indicator is an indicator based and created in homage to Tom Williams (author of "Master The Markets") . It helps to interpret the volume and movements of the market, in a simple way. Its benefits are:
Helps identify climatic volumes
Helps identify if there are or not strong hands in the market
Shows if a trend is being driven by volume and if the volume is strong
Red Volume:
Weak hands only
Green Volume:
Strong Hands Testing or guiding the price
Black Volume:
volume is normal
White Candles:
Sail with very little volume
Black Candles:
candle with a lot of volume
El Indicador de "Volumen Salvatierra" es un indicador basado y creado en homenaje a Tom Williams (autor de "Master The Markets") . Ayuda a interpretar el volumen y los movimientos del mercado, de una manera sencilla. Sus beneficios son:
Ayuda a identificar los volúmenes climáticos
Ayuda a identificar los momentos en los que no hay manos fuertes en el mercado
Muestra si una tendencia esta siendo guiada por el volumen y si el volumen es fuerte
Volumen Rojo:
Solo manos débiles
Volumen Verde:
Manos Fuertes Testeando o guiando el precio
Volumen Negro:
El volumen es normal
Velas blancas:
Vela con muy poco volumen
Velas Negras:
Vela con mucho volumen

ViPlay Signal demo versionViPlay Signal is a trading indicator designed for the TradingView platform that generates buy and sell signals based on a combination of technical indicators. The indicator uses two different Moving Averages, the Market Range Oscillator (MRO), and the Williams Percent Range (WPR) to provide traders with a comprehensive set of tools for identifying potential entry and exit points, confirming trends, and managing risk.
The Moving Averages used in the indicator are the 50-period and 200-period Simple Moving Averages (SMA) of the closing price, which are widely used in technical analysis to identify trends and support/resistance levels. The Market Range Oscillator (MRO) is a proprietary indicator that measures the range of the market, which can help identify extreme market conditions. The MRO is used to determine buy and sell signals, with two different calculations performed to identify each type of signal.
The Williams Percent Range (WPR) is a momentum indicator that helps traders identify overbought and oversold conditions in the market. By using the WPR in combination with the Moving Averages and the MRO, the ViPlay Signal indicator can provide more accurate and reliable signals to traders.
The indicator allows users to select a strategy from a dropdown menu that includes BTC 1m, 3m, 15m, 4H, and LTC 3m, ideal 5m, and 15m super. The values of some of the parameters change based on the selected strategy, allowing traders to customize the indicator to their specific needs.
The ViPlay Signal indicator plots buy and sell signals on the chart as labels with arrows pointing up or down to indicate the direction of the trade. A green arrow represents a buy signal, and a red arrow represents a sell signal. The chart is clean and easy to read, with complete symbol/timeframe and script name information provided.
In summary, the ViPlay Signal indicator is a powerful and customizable tool for traders looking to improve their trading performance. The indicator provides a comprehensive set of technical analysis tools, including Moving Averages, the MRO, and the WPR, to help traders identify potential trading opportunities and manage risk.

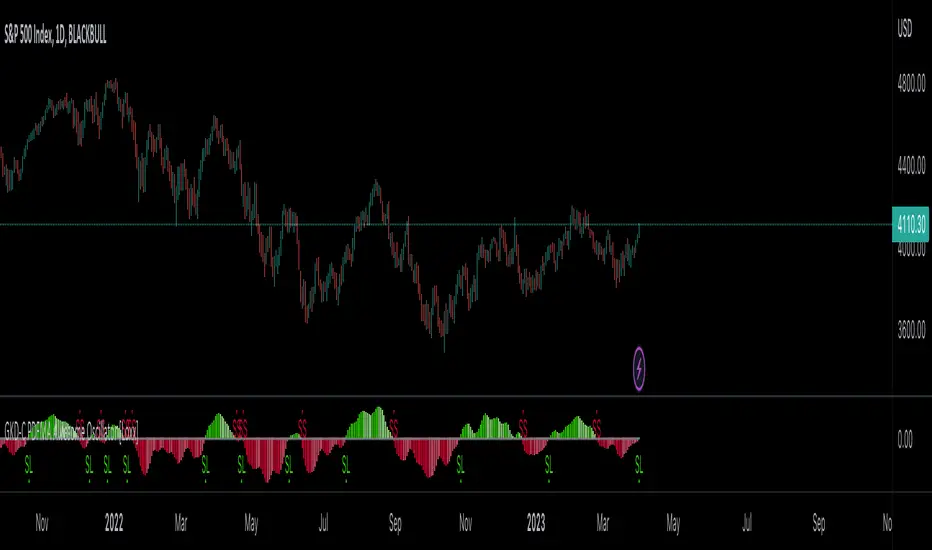
GKD-C PDFMA Awesome Oscillator [Loxx]Giga Kaleidoscope GKD-C PDFMA Awesome Oscillator is a Confirmation module included in Loxx's "Giga Kaleidoscope Modularized Trading System".
█ Giga Kaleidoscope Modularized Trading System
What is Loxx's "Giga Kaleidoscope Modularized Trading System"?
The Giga Kaleidoscope Modularized Trading System is a trading system built on the philosophy of the NNFX (No Nonsense Forex) algorithmic trading.
What is the NNFX algorithmic trading strategy?
The NNFX (No-Nonsense Forex) trading system is a comprehensive approach to Forex trading that is designed to simplify the process and remove the confusion and complexity that often surrounds trading. The system was developed by a Forex trader who goes by the pseudonym "VP" and has gained a significant following in the Forex community.
The NNFX trading system is based on a set of rules and guidelines that help traders make objective and informed decisions. These rules cover all aspects of trading, including market analysis, trade entry, stop loss placement, and trade management.
Here are the main components of the NNFX trading system:
1. Trading Philosophy: The NNFX trading system is based on the idea that successful trading requires a comprehensive understanding of the market, objective analysis, and strict risk management. The system aims to remove subjective elements from trading and focuses on objective rules and guidelines.
2. Technical Analysis: The NNFX trading system relies heavily on technical analysis and uses a range of indicators to identify high-probability trading opportunities. The system uses a combination of trend-following and mean-reverting strategies to identify trades.
3. Market Structure: The NNFX trading system emphasizes the importance of understanding the market structure, including price action, support and resistance levels, and market cycles. The system uses a range of tools to identify the market structure, including trend lines, channels, and moving averages.
4. Trade Entry: The NNFX trading system has strict rules for trade entry. The system uses a combination of technical indicators to identify high-probability trades, and traders must meet specific criteria to enter a trade.
5. Stop Loss Placement: The NNFX trading system places a significant emphasis on risk management and requires traders to place a stop loss order on every trade. The system uses a combination of technical analysis and market structure to determine the appropriate stop loss level.
6. Trade Management: The NNFX trading system has specific rules for managing open trades. The system aims to minimize risk and maximize profit by using a combination of trailing stops, take profit levels, and position sizing.
Overall, the NNFX trading system is designed to be a straightforward and easy-to-follow approach to Forex trading that can be applied by traders of all skill levels.
Core components of an NNFX algorithmic trading strategy
The NNFX algorithm is built on the principles of trend, momentum, and volatility. There are six core components in the NNFX trading algorithm:
1. Volatility - price volatility; e.g., Average True Range, True Range Double, Close-to-Close, etc.
2. Baseline - a moving average to identify price trend
3. Confirmation 1 - a technical indicator used to identify trends
4. Confirmation 2 - a technical indicator used to identify trends
5. Continuation - a technical indicator used to identify trends
6. Volatility/Volume - a technical indicator used to identify volatility/volume breakouts/breakdown
7. Exit - a technical indicator used to determine when a trend is exhausted
What is Volatility in the NNFX trading system?
In the NNFX (No Nonsense Forex) trading system, ATR (Average True Range) is typically used to measure the volatility of an asset. It is used as a part of the system to help determine the appropriate stop loss and take profit levels for a trade. ATR is calculated by taking the average of the true range values over a specified period.
True range is calculated as the maximum of the following values:
-Current high minus the current low
-Absolute value of the current high minus the previous close
-Absolute value of the current low minus the previous close
ATR is a dynamic indicator that changes with changes in volatility. As volatility increases, the value of ATR increases, and as volatility decreases, the value of ATR decreases. By using ATR in NNFX system, traders can adjust their stop loss and take profit levels according to the volatility of the asset being traded. This helps to ensure that the trade is given enough room to move, while also minimizing potential losses.
Other types of volatility include True Range Double (TRD), Close-to-Close, and Garman-Klass
What is a Baseline indicator?
The baseline is essentially a moving average, and is used to determine the overall direction of the market.
The baseline in the NNFX system is used to filter out trades that are not in line with the long-term trend of the market. The baseline is plotted on the chart along with other indicators, such as the Moving Average (MA), the Relative Strength Index (RSI), and the Average True Range (ATR).
Trades are only taken when the price is in the same direction as the baseline. For example, if the baseline is sloping upwards, only long trades are taken, and if the baseline is sloping downwards, only short trades are taken. This approach helps to ensure that trades are in line with the overall trend of the market, and reduces the risk of entering trades that are likely to fail.
By using a baseline in the NNFX system, traders can have a clear reference point for determining the overall trend of the market, and can make more informed trading decisions. The baseline helps to filter out noise and false signals, and ensures that trades are taken in the direction of the long-term trend.
What is a Confirmation indicator?
Confirmation indicators are technical indicators that are used to confirm the signals generated by primary indicators. Primary indicators are the core indicators used in the NNFX system, such as the Average True Range (ATR), the Moving Average (MA), and the Relative Strength Index (RSI).
The purpose of the confirmation indicators is to reduce false signals and improve the accuracy of the trading system. They are designed to confirm the signals generated by the primary indicators by providing additional information about the strength and direction of the trend.
Some examples of confirmation indicators that may be used in the NNFX system include the Bollinger Bands, the MACD (Moving Average Convergence Divergence), and the Stochastic Oscillator. These indicators can provide information about the volatility, momentum, and trend strength of the market, and can be used to confirm the signals generated by the primary indicators.
In the NNFX system, confirmation indicators are used in combination with primary indicators and other filters to create a trading system that is robust and reliable. By using multiple indicators to confirm trading signals, the system aims to reduce the risk of false signals and improve the overall profitability of the trades.
What is a Continuation indicator?
In the NNFX (No Nonsense Forex) trading system, a continuation indicator is a technical indicator that is used to confirm a current trend and predict that the trend is likely to continue in the same direction. A continuation indicator is typically used in conjunction with other indicators in the system, such as a baseline indicator, to provide a comprehensive trading strategy.
What is a Volatility/Volume indicator?
Volume indicators, such as the On Balance Volume (OBV), the Chaikin Money Flow (CMF), or the Volume Price Trend (VPT), are used to measure the amount of buying and selling activity in a market. They are based on the trading volume of the market, and can provide information about the strength of the trend. In the NNFX system, volume indicators are used to confirm trading signals generated by the Moving Average and the Relative Strength Index. Volatility indicators include Average Direction Index, Waddah Attar, and Volatility Ratio. In the NNFX trading system, volatility is a proxy for volume and vice versa.
By using volume indicators as confirmation tools, the NNFX trading system aims to reduce the risk of false signals and improve the overall profitability of trades. These indicators can provide additional information about the market that is not captured by the primary indicators, and can help traders to make more informed trading decisions. In addition, volume indicators can be used to identify potential changes in market trends and to confirm the strength of price movements.
What is an Exit indicator?
The exit indicator is used in conjunction with other indicators in the system, such as the Moving Average (MA), the Relative Strength Index (RSI), and the Average True Range (ATR), to provide a comprehensive trading strategy.
The exit indicator in the NNFX system can be any technical indicator that is deemed effective at identifying optimal exit points. Examples of exit indicators that are commonly used include the Parabolic SAR, the Average Directional Index (ADX), and the Chandelier Exit.
The purpose of the exit indicator is to identify when a trend is likely to reverse or when the market conditions have changed, signaling the need to exit a trade. By using an exit indicator, traders can manage their risk and prevent significant losses.
In the NNFX system, the exit indicator is used in conjunction with a stop loss and a take profit order to maximize profits and minimize losses. The stop loss order is used to limit the amount of loss that can be incurred if the trade goes against the trader, while the take profit order is used to lock in profits when the trade is moving in the trader's favor.
Overall, the use of an exit indicator in the NNFX trading system is an important component of a comprehensive trading strategy. It allows traders to manage their risk effectively and improve the profitability of their trades by exiting at the right time.
How does Loxx's GKD (Giga Kaleidoscope Modularized Trading System) implement the NNFX algorithm outlined above?
Loxx's GKD v1.0 system has five types of modules (indicators/strategies). These modules are:
1. GKD-BT - Backtesting module (Volatility, Number 1 in the NNFX algorithm)
2. GKD-B - Baseline module (Baseline and Volatility/Volume, Numbers 1 and 2 in the NNFX algorithm)
3. GKD-C - Confirmation 1/2 and Continuation module (Confirmation 1/2 and Continuation, Numbers 3, 4, and 5 in the NNFX algorithm)
4. GKD-V - Volatility/Volume module (Confirmation 1/2, Number 6 in the NNFX algorithm)
5. GKD-E - Exit module (Exit, Number 7 in the NNFX algorithm)
(additional module types will added in future releases)
Each module interacts with every module by passing data between modules. Data is passed between each module as described below:
GKD-B => GKD-V => GKD-C(1) => GKD-C(2) => GKD-C(Continuation) => GKD-E => GKD-BT
That is, the Baseline indicator passes its data to Volatility/Volume. The Volatility/Volume indicator passes its values to the Confirmation 1 indicator. The Confirmation 1 indicator passes its values to the Confirmation 2 indicator. The Confirmation 2 indicator passes its values to the Continuation indicator. The Continuation indicator passes its values to the Exit indicator, and finally, the Exit indicator passes its values to the Backtest strategy.
This chaining of indicators requires that each module conform to Loxx's GKD protocol, therefore allowing for the testing of every possible combination of technical indicators that make up the six components of the NNFX algorithm.
What does the application of the GKD trading system look like?
Example trading system:
Backtest: Strategy with 1-3 take profits, trailing stop loss, multiple types of PnL volatility, and 2 backtesting styles
Baseline: Hull Moving Average
Volatility/Volume: Hurst Exponent
Confirmation 1: PDFMA Awesome Oscillator as shown on the chart above
Confirmation 2: Williams Percent Range
Continuation: Fisher Transform
Exit: Rex Oscillator
Each GKD indicator is denoted with a module identifier of either: GKD-BT, GKD-B, GKD-C, GKD-V, or GKD-E. This allows traders to understand to which module each indicator belongs and where each indicator fits into the GKD protocol chain.
Giga Kaleidoscope Modularized Trading System Signals (based on the NNFX algorithm)
Standard Entry
1. GKD-C Confirmation 1 Signal
2. GKD-B Baseline agrees
3. Price is within a range of 0.2x Volatility and 1.0x Volatility of the Goldie Locks Mean
4. GKD-C Confirmation 2 agrees
5. GKD-V Volatility/Volume agrees
Baseline Entry
1. GKD-B Baseline signal
2. GKD-C Confirmation 1 agrees
3. Price is within a range of 0.2x Volatility and 1.0x Volatility of the Goldie Locks Mean
4. GKD-C Confirmation 2 agrees
5. GKD-V Volatility/Volume agrees
6. GKD-C Confirmation 1 signal was less than 7 candles prior
Continuation Entry
1. Standard Entry, Baseline Entry, or Pullback; entry triggered previously
2. GKD-B Baseline hasn't crossed since entry signal trigger
3. GKD-C Confirmation Continuation Indicator signals
4. GKD-C Confirmation 1 agrees
5. GKD-B Baseline agrees
6. GKD-C Confirmation 2 agrees
1-Candle Rule Standard Entry
1. GKD-C Confirmation 1 signal
2. GKD-B Baseline agrees
3. Price is within a range of 0.2x Volatility and 1.0x Volatility of the Goldie Locks Mean
Next Candle:
1. Price retraced (Long: close < close or Short: close > close )
2. GKD-B Baseline agrees
3. GKD-C Confirmation 1 agrees
4. GKD-C Confirmation 2 agrees
5. GKD-V Volatility/Volume agrees
1-Candle Rule Baseline Entry
1. GKD-B Baseline signal
2. GKD-C Confirmation 1 agrees
3. Price is within a range of 0.2x Volatility and 1.0x Volatility of the Goldie Locks Mean
4. GKD-C Confirmation 1 signal was less than 7 candles prior
Next Candle:
1. Price retraced (Long: close < close or Short: close > close )
2. GKD-B Baseline agrees
3. GKD-C Confirmation 1 agrees
4. GKD-C Confirmation 2 agrees
5. GKD-V Volatility/Volume Agrees
PullBack Entry
1. GKD-B Baseline signal
2. GKD-C Confirmation 1 agrees
3. Price is beyond 1.0x Volatility of Baseline
Next Candle:
1. Price is within a range of 0.2x Volatility and 1.0x Volatility of the Goldie Locks Mean
3. GKD-C Confirmation 1 agrees
4. GKD-C Confirmation 2 agrees
5. GKD-V Volatility/Volume Agrees
█ GKD-C PDFMA Awesome Oscillator
What is the Awesome Oscillator?
The Awesome Oscillator (AO) is a technical indicator used in financial analysis to measure the momentum of an asset's price movement. Developed by Bill Williams, it is a histogram-style indicator that calculates the difference between a 34-period and a 5-period Simple Moving Average (SMA) of the asset's price.
The AO indicator is calculated by subtracting the 34-period SMA from the 5-period SMA. The resulting value is plotted as a histogram, with bars above the zero line indicating bullish momentum and bars below the zero line indicating bearish momentum.
Traders use the Awesome Oscillator to identify trends and potential reversals in the price movement of an asset. When the histogram is above the zero line, it indicates that bullish momentum is strong and traders may consider buying the asset. Conversely, when the histogram is below the zero line, it indicates that bearish momentum is strong and traders may consider selling the asset.
In addition to identifying trends and potential reversals, the AO indicator can also be used to confirm the strength of a trend. If the histogram is increasing in height, it indicates that the momentum of the trend is increasing as well. If the histogram is decreasing in height, it indicates that the momentum of the trend is decreasing as well.
Traders often use the Awesome Oscillator in conjunction with other technical indicators to confirm trading signals and improve the accuracy of their trades. While it is not a standalone indicator, it can be a valuable tool for identifying and confirming trends in the price movement of an asset.
What is Probability Density Function?
Probability Density Function ( PDF ) is a statistical function used to describe the likelihood of a continuous random variable taking on a particular value or range of values. In other words, it describes the probability distribution of a random variable over a continuous range of values.
The PDF is defined as the derivative of the cumulative distribution function (CDF) of a continuous random variable. The CDF of a continuous random variable is the probability that the random variable takes on a value less than or equal to a given value. The PDF is a non-negative function that integrates to 1 over the entire range of the random variable.
The PDF is used to calculate the probability of the random variable taking on a value within a specific range. This is done by integrating the PDF over that range. The height of the PDF at a particular value of the random variable indicates the relative likelihood of that value occurring.
The PDF is an essential tool in many areas of statistics, including hypothesis testing, confidence interval estimation, and Bayesian inference.
Probability density function based MA is a sort of weighted moving average that uses probability density function to calculate the weights.
What is the PDFMA Awesome Oscillator?
This indicator is an Awesome Oscillator that makes use of PDFMA smoothing. There is only one varaible input: variance. This adjusts the smoothness of the oscillator. Higher values, smoother oscillator but introduces additional lag.
Requirements
Inputs
Confirmation 1 and Solo Confirmation: GKD-V Volatility / Volume indicator
Confirmation 2: GKD-C Confirmation indicator
Outputs
Confirmation 2 and Solo Confirmation Complex: GKD-E Exit indicator
Confirmation 1: GKD-C Confirmation indicator
Continuation: GKD-E Exit indicator
Solo Confirmation Simple: GKD-BT Backtest strategy
Additional features will be added in future releases.
GKD-C ASC Trend [Loxx]Giga Kaleidoscope ASC Trend is a Confirmation module included in Loxx's "Giga Kaleidoscope Modularized Trading System".
█ Giga Kaleidoscope Modularized Trading System
What is Loxx's "Giga Kaleidoscope Modularized Trading System"?
The Giga Kaleidoscope Modularized Trading System is a trading system built on the philosophy of the NNFX (No Nonsense Forex) algorithmic trading.
What is an NNFX algorithmic trading strategy?
The NNFX algorithm is built on the principles of trend, momentum, and volatility. There are six core components in the NNFX trading algorithm:
1. Volatility - price volatility; e.g., Average True Range, True Range Double, Close-to-Close, etc.
2. Baseline - a moving average to identify price trend
3. Confirmation 1 - a technical indicator used to identify trends
4. Confirmation 2 - a technical indicator used to identify trends
5. Continuation - a technical indicator used to identify trends
6. Volatility/Volume - a technical indicator used to identify volatility/volume breakouts/breakdown
7. Exit - a technical indicator used to determine when a trend is exhausted
How does Loxx's GKD (Giga Kaleidoscope Modularized Trading System) implement the NNFX algorithm outlined above?
Loxx's GKD v1.0 system has five types of modules (indicators/strategies). These modules are:
1. GKD-BT - Backtesting module (Volatility, Number 1 in the NNFX algorithm)
2. GKD-B - Baseline module (Baseline and Volatility/Volume, Numbers 1 and 2 in the NNFX algorithm)
3. GKD-C - Confirmation 1/2 and Continuation module (Confirmation 1/2 and Continuation, Numbers 3, 4, and 5 in the NNFX algorithm)
4. GKD-V - Volatility/Volume module (Confirmation 1/2, Number 6 in the NNFX algorithm)
5. GKD-E - Exit module (Exit, Number 7 in the NNFX algorithm)
(additional module types will added in future releases)
Each module interacts with every module by passing data between modules. Data is passed between each module as described below:
GKD-B => GKD-V => GKD-C(1) => GKD-C(2) => GKD-C(Continuation) => GKD-E => GKD-BT
That is, the Baseline indicator passes its data to Volatility/Volume. The Volatility/Volume indicator passes its values to the Confirmation 1 indicator. The Confirmation 1 indicator passes its values to the Confirmation 2 indicator. The Confirmation 2 indicator passes its values to the Continuation indicator. The Continuation indicator passes its values to the Exit indicator, and finally, the Exit indicator passes its values to the Backtest strategy.
This chaining of indicators requires that each module conform to Loxx's GKD protocol, therefore allowing for the testing of every possible combination of technical indicators that make up the six components of the NNFX algorithm.
What does the application of the GKD trading system look like?
Example trading system:
Backtest: Strategy with 1-3 take profits, trailing stop loss, multiple types of PnL volatility, and 2 backtesting styles
Baseline: Hull Moving Average as shown on the chart above
Volatility/Volume: Volatility Ratio as shown on the chart above
Confirmation 1: ASC Trend as shown on the chart above
Confirmation 2: Williams Percent Range
Continuation: Fisher Transform
Exit: Rex Oscillator
Each GKD indicator is denoted with a module identifier of either: GKD-BT, GKD-B, GKD-C, GKD-V, or GKD-E. This allows traders to understand to which module each indicator belongs and where each indicator fits into the GKD protocol chain.
Giga Kaleidoscope Modularized Trading System Signals (based on the NNFX algorithm)
Standard Entry
1. GKD-C Confirmation 1 Signal
2. GKD-B Baseline agrees
3. Price is within a range of 0.2x Volatility and 1.0x Volatility of the Goldie Locks Mean
4. GKD-C Confirmation 2 agrees
5. GKD-V Volatility/Volume agrees
Baseline Entry
1. GKD-B Baseline signal
2. GKD-C Confirmation 1 agrees
3. Price is within a range of 0.2x Volatility and 1.0x Volatility of the Goldie Locks Mean
4. GKD-C Confirmation 2 agrees
5. GKD-V Volatility/Volume agrees
6. GKD-C Confirmation 1 signal was less than 7 candles prior
Continuation Entry
1. Standard Entry, Baseline Entry, or Pullback; entry triggered previously
2. GKD-B Baseline hasn't crossed since entry signal trigger
3. GKD-C Confirmation Continuation Indicator signals
4. GKD-C Confirmation 1 agrees
5. GKD-B Baseline agrees
6. GKD-C Confirmation 2 agrees
1-Candle Rule Standard Entry
1. GKD-C Confirmation 1 signal
2. GKD-B Baseline agrees
3. Price is within a range of 0.2x Volatility and 1.0x Volatility of the Goldie Locks Mean
Next Candle:
1. Price retraced (Long: close < close or Short: close > close )
2. GKD-B Baseline agrees
3. GKD-C Confirmation 1 agrees
4. GKD-C Confirmation 2 agrees
5. GKD-V Volatility/Volume agrees
1-Candle Rule Baseline Entry
1. GKD-B Baseline signal
2. GKD-C Confirmation 1 agrees
3. Price is within a range of 0.2x Volatility and 1.0x Volatility of the Goldie Locks Mean
4. GKD-C Confirmation 1 signal was less than 7 candles prior
Next Candle:
1. Price retraced (Long: close < close or Short: close > close )
2. GKD-B Baseline agrees
3. GKD-C Confirmation 1 agrees
4. GKD-C Confirmation 2 agrees
5. GKD-V Volatility/Volume Agrees
PullBack Entry
1. GKD-B Baseline signal
2. GKD-C Confirmation 1 agrees
3. Price is beyond 1.0x Volatility of Baseline
Next Candle:
1. Price is within a range of 0.2x Volatility and 1.0x Volatility of the Goldie Locks Mean
3. GKD-C Confirmation 1 agrees
4. GKD-C Confirmation 2 agrees
5. GKD-V Volatility/Volume Agrees
█ ASC Trend
What is ASC Trend?
ASC Trend uses Williams Precent Range and a High/Low comparison to derive price trend. This indicator is hard to see on the chart, so you'll likely want to turn off Baseline and other overlay indicators to see it' however, you can clearly the signals painted on the chart either way.
Requirements
Inputs
Confirmation 1 and Solo Confirmation: GKD-V Volatility / Volume indicator
Confirmation 2: GKD-C Confirmation indicator
Outputs
Confirmation 2 and Solo Confirmation: GKD-E Exit indicator
Confirmation 1: GKD-C Confirmation indicator
Continuation: GKD-E Exit indicator
Additional features will be added in future releases.

Acrylic's 1m/3m Scalper Buy/Sell SignalsAcrylic's Scalper Signals uses a combination of RSI / Stochastic / Williams %R to calculate the perfect entry signals. The script(with it's default settings) has been optimized and thoroughly tested on BTC & ETH 1 and 3 minute time frames. It's intended for quick in and out trades that should only last a few minutes unless a strong trend is caught. Basic knowledge of market structure is needed, as you will not be taking every signal generated by the script.
You also have the option to display all signals regardless of the short term trend that has been confirmed by RSI. This can be good if you're looking for reversal entries at resistance/support levels.
-Large triangle signal: Strongest signal that was confirmed with RSI & Williams %R optimized calculations. (prints at current candle close)
-Small triangle signal: Fractal signal can be used as a late entry signal/continuation. (prints after 2 candle closes)
-Candle colors are matched to stochastic strength for added confluence to enter trades. (Must hide default trading view candles to see these)
-233SMMA color is matched to the extreme short term trend based off of RSI calculations.
Perfect Long Entry Setup Image :
1) EMA21 > EMA55 > EMA100 > SMMA233(Colored green for added confluence) - All pointing up indicating strong trend
2) Enter on pullback to short term EMA after signal candle closes. (Do not take entry if candles closed below 100EMA)
Perfect Short Entry Setup Image :
1) EMA21 < EMA55 < EMA100 < SMMA233(Colored red for added confluence) - All pointing down indicating strong trend
2) Enter on pullback to short term EMA after signal candle closes. (Do not take entry if candles closed above 100EMA)
Feel free to ask questions or leave feedback in the comments, I'm always looking to improve! Thanks!
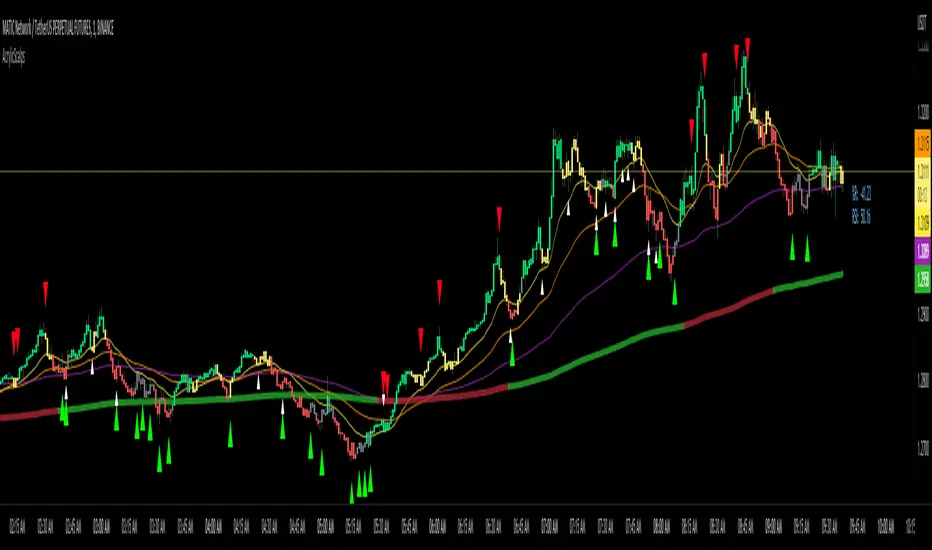
Trading ChannelTrading Channel aims to be a canvas on which to develop any strategy that the user feels comfortable with.
The greatest utility of the script lies in the fact that it plots a channel over the price action, as a support and resistance pivot, within which the price action develops.
It is a script of maximum simplicity in concept and development, but at the same time presents robust support to the price action and a quick visual aid complementary to any indicators that the user works with, feels comfortable with, and uses as a basis for their strategies.
The script includes the following features (most of them disabled by default, available for potential use without the need to add additional indicators):
Fast SMA
Medium SMA
Slow SMA (disabled)
Fast EMA (disabled)
Medium EMA (disabled)
Slow EMA (disabled)
Pivot
Pivot SMA
P Multiplier
Set of resistance and support pivots according to the studies of John L. Person (R3, R2, R1, S1, S2, S3 and midpoints) (disabled by default)
Channel for the current time period in use
Channels for extended time periods (disabled by default)
Various trend, momentum, and overbought/oversold indicating labels (note that the calculations for their representation are based on SMA's even though EMA's are visualized).
SMA's/EMA's
Both are available as both are used as basic indicators for different types of strategies. The default selection of SMA's in this case is based on the fact that the script development is largely based on the studies shared by John L. Person in the area of pivots and by Bill Williams in the area of fractals. Note also that for that same reason the various trend, momentum, and overbought/oversold indicating labels are calculated based on them.
Set of resistance and support pivots
They are included as a consultation tool especially for the higher time periods. They can be used to mark the most interesting supports/resistances and not lose sight of them while operating in lower time periods. Marking monthly, weekly, and daily pivots can be very useful. Additionally, marking S1 and R2 for bullish trends, S1 and R1 for ranges, and S2 and R1 for bearish trends can provide an even more precise framework to work on.
P Multiplier
It is set by default at 4, and is the basis for being able to consider during the use of a specific time frame, the price action with respect to higher time frames. It is the multiplier used for the generation of channels for extended time periods.
Channel for the current time period in use
It is a channel formed by the maximum and minimum closing of the last 21 periods. This value is modifiable and its adjustment depends on the asset under study. 24/7 markets show good results with this adjustment (in the case of BTC really good).
This channel represents a pivot in the form of a yellow middle line, with its support and resistance extremes on the upper green and lower red lines. The same green and red lines, referenced this time to the maximum, are added and serve as possible stop-loss marks.
Channels for extended time periods
Enabling the maximum and minimum channels for extended periods can provide a better idea of the price situation (it is recommended to disable the channel in use and enable the upper one for consultation, it provides a better vision).
Identifying labels:
Following a summary explanation for possible long entries, the same but opposite should be considered for possible short entries:
Small green arrow under candle: indicates possible upward trend (pivot above pivot SMA)
Large green arrow under candle: indicates upward trend (pivot above pivot SMA and above fast SMA)
Green triangle over candle: indicates channel breakout, possible upward momentum (represented as a fractal as its concept is the same)
Green/red arrows at the bottom of the chart: intended to confirm the validity of a signal (should doubt green indications with red lower arrow and vice versa)
Green/red dots at the bottom of the chart: red represents areas of strong resistance and green signals of strong support (with red dots, proceed with caution despite green signals, and vice versa)
Comments
It is emphasized that the basic and most useful functionality of this script is to provide a reliable base on which to develop any strategy, as a framework for working.
If the identifying labels are used, it should be taken into account that the earliest will always be the most reliable and valuable, but their confirmation will always depend on the user's strategy.
Its use in conjunction with the "Pivot Position for Trading Channel" indicator can serve as a base for the development of different strategies, by providing indication of the relative position of the price within the channel.
This script is just a consultation tool with didactic goals, it should not be used as an investment recommendation and the information provided should not be relied upon as such.
------------------------
Trading Channel pretende ser un lienzo sobre el que desarrollar cualquiera que sea la estrategia con la que el usuario se sienta más cómodo.
La mayor utilidad del script radica en que se traza sobre la acción del precio un canal, a modo de pivotes de soporte y resistencia, dentro del cual se desarrolla la acción del precio.
Se trata de un script de máxima sencillez en concepto y desarrollo, pero que a la vez presenta un soporte robusto a la acción del precio y una ayuda rápida visual complementaria a cualquieras que sean los indicadores con los que el usuario trabaje, se sienta más cómodo y utilice como base de sus estrategias.
El script incluye las siguientes funcionalidades (la mayoría desactivadas por defecto, disponibles para su potencial uso sin necesidad de añadir indicadores adicionales):
- SMA rápida
- SMA media
- SMA lenta (desactivada)
- EMA rápida (desactivada)
- EMA media (desactivada)
- EMA lenta (desactivada)
- Pivote
- SMA de pivote
- Multiplicador de P
- Conjunto de pivotes resistencia y soporte de acuerdo a los estudios de John L. Person (R3, R2, R1, S1, S2, S3 y puntos medios) (desactivados por defecto)
- Canal para el periodo temporal en uso
- Canales para periodos temporales extendidos (desactivados por defecto)
- Diversas etiquetas indicativas de cambios de tendencia, de impulso y de sobrecompra y sobreventa (nótese que los cálculos para su representación están basados en SMA's aunque se visualicen EMA's).
SMA's/EMA's
Ambas disponibles pues tanto unas como otras son utilizadas como indicadores básicos para diferentes tipos de estrategias. La selección de SMA's por defecto en este caso se basa en que las bases para desarrollo del script son en gran medida los estudios compartidos por John L. Person en el área de pivotes y de Bill Williams en el área de los fractales. Nótese también que por esa misma razón las diversas etiquetas indicativas de cambios de tendencia, impulso y sobrecompra/sobreventa se calculan en base a ellas.
Conjunto de pivotes resistencia y soporte
Se incluyen como herramienta de consulta sobre todo para los periodos temporales más altos. Pueden utilizarse para marcar los soportes/resistencias de más interés y no perderlos de vista mientras se opera en periodos de tiempo más bajos. De acuerdo a los estudios de John L. Person, marcarse los pivotes mensuales, semanales y diarios puede resultar de mucha utilidad. Adicionalmente, marcar S1 y R2 para tendencias alcistas, S1 y R1 para rangos, y S2 y R1 para tendencias bajistas puede proporcionar un marco aún más preciso sobre el que trabajar.
Multiplicador de p
Está fijado por defecto en 4, y es la base para poder considerar durante el uso de una franja temporal concreta, la acción del precio respecto a franjas temporales superiores. Es el multiplicador utilizado para la generación de los canales para periodos temporales extendidos.
Canal para el periodo temporal en uso
Se trata de un canal conformado por los cierres máximos y mínimos de los últimos 21 periodos. Este valor es modificable y su ajuste depende del activo en estudio. Mercados 24/7 muestran buenos resultados con este ajuste (en el caso de BTC realmente buenos).
Este canal representa en cierta manera un pivote en forma de línea intermedia amarilla, con sus extremos de soporte y resistencia en las líneas verdes superior y roja inferior. Se añaden las mismas líneas verdes y rojas, referenciadas esta vez a los máximos, que sirven como posibles marcas de stop-loss.
Canales para periodos temporales extendidos
Habilitar los máximos y mínimos de canales de periodos extendidos puede proporcionar una mejor idea de la situación del precio (se recomienda deshabilitar el canal en uso y habilitar el superior para consulta, proporciona una mejor visión).
Etiquetas identificativas:
A continuación explicación resumida para posibles entradas en largo, lo mismo pero de modo opuesto debería considerarse para posibles entradas en corto:
Flecha verde pequeña bajo vela: indica inicio de tendencia en alza (pivote por encima de SMA de pivote y ambos por encima de SMA rápida)
Flecha verde grande bajo vela: indica tendencia en alza (pivote por encima de SMA de pivote y ambos por encima de SMA rápida y media)
Triángulo verde sobre vela: indica rotura de canal, posible impulso al alza (representado a modo de fractal pues su concepto es el mismo)
Flechas verdes/rojas a pie de gráfico: pretenden confirmar la validez de una señal (debería dudarse de las indicaciones verdes con flecha inferior roja y viceversa)
Puntos verdes/rojos a pie de gráfico: los rojos representan áreas de fuerte resistencia y los verdes de fuerte soporte (con puntos rojos, proceder con cautela pese a señales verdes, y viceversa)
Comentarios
Se insiste en que la funcionalidad básica y de mayor utilidad de este script es proporcionar una base confiable sobre la que desarrollar cualquier estrategia, a modo de marco de trabajo.
Si se hace uso de las etiquetas identificativas, debe tenerse en cuenta que las más prematuras siempre serán las más confiables y valiosas, pero que su confirmación siempre dependerá de la estrategia por parte del usuario.
Su uso en conjunción al indicador "Pivot Position for Trading Channel" puede servir de base para el desarrollo de diferentes estrategias, al proporcionar indicación de la posición relativa del precio dentro del canal.
Este script es solo una herramienta de consulta con objetivos didácticos, no debe ser utilizado como recomendación de inversión y no se debe confiar en ella como tal.
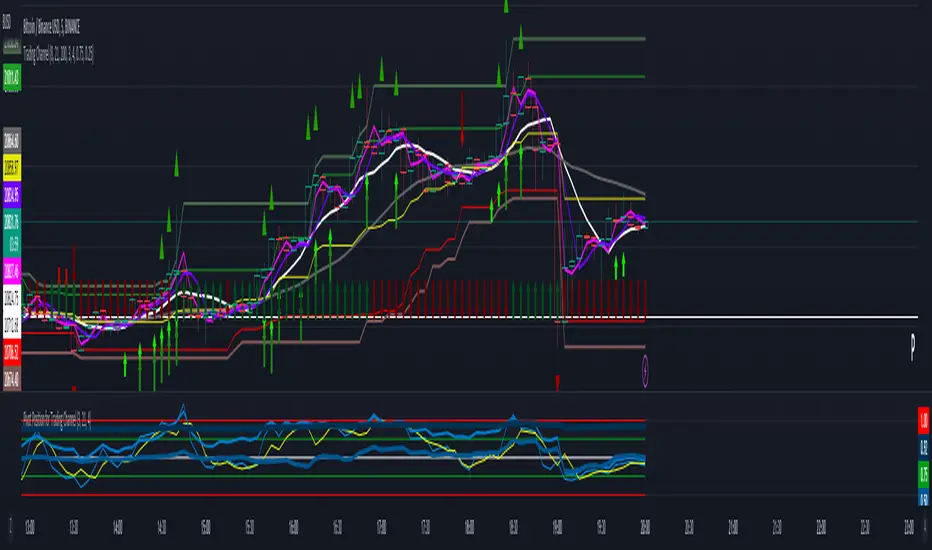
Fourier Extrapolator of 'Caterpillar' SSA of Price [Loxx]Fourier Extrapolator of 'Caterpillar' SSA of Price is a forecasting indicator that applies Singular Spectrum Analysis to input price and then injects that transformed value into the Quinn-Fernandes Fourier Transform algorithm to generate a price forecast. The indicator plots two curves: the green/red curve indicates modeled past values and the yellow/fuchsia dotted curve indicates the future extrapolated values.
What is the Fourier Transform Extrapolator of price?
Fourier Extrapolator of Price is a multi-harmonic (or multi-tone) trigonometric model of a price series xi, i=1..n, is given by:
xi = m + Sum( a*Cos(w*i) + b*Sin(w*i), h=1..H )
Where:
xi - past price at i-th bar, total n past prices;
m - bias;
a and b - scaling coefficients of harmonics;
w - frequency of a harmonic ;
h - harmonic number;
H - total number of fitted harmonics.
Fitting this model means finding m, a, b, and w that make the modeled values to be close to real values. Finding the harmonic frequencies w is the most difficult part of fitting a trigonometric model. In the case of a Fourier series, these frequencies are set at 2*pi*h/n. But, the Fourier series extrapolation means simply repeating the n past prices into the future.
Quinn-Fernandes algorithm find sthe harmonic frequencies. It fits harmonics of the trigonometric series one by one until the specified total number of harmonics H is reached. After fitting a new harmonic , the coded algorithm computes the residue between the updated model and the real values and fits a new harmonic to the residue.
see here: A Fast Efficient Technique for the Estimation of Frequency , B. G. Quinn and J. M. Fernandes, Biometrika, Vol. 78, No. 3 (Sep., 1991), pp . 489-497 (9 pages) Published By: Oxford University Press
Fourier Transform Extrapolator of Price inputs are as follows:
npast - number of past bars, to which trigonometric series is fitted;
nharm - total number of harmonics in model;
frqtol - tolerance of frequency calculations.
What is Singular Spectrum Analysis ( SSA )?
Singular spectrum analysis ( SSA ) is a technique of time series analysis and forecasting. It combines elements of classical time series analysis, multivariate statistics, multivariate geometry, dynamical systems and signal processing. SSA aims at decomposing the original series into a sum of a small number of interpretable components such as a slowly varying trend, oscillatory components and a ‘structureless’ noise. It is based on the singular value decomposition ( SVD ) of a specific matrix constructed upon the time series. Neither a parametric model nor stationarity-type conditions have to be assumed for the time series. This makes SSA a model-free method and hence enables SSA to have a very wide range of applicability.
For our purposes here, we are only concerned with the "Caterpillar" SSA . This methodology was developed in the former Soviet Union independently (the ‘iron curtain effect’) of the mainstream SSA . The main difference between the main-stream SSA and the "Caterpillar" SSA is not in the algorithmic details but rather in the assumptions and in the emphasis in the study of SSA properties. To apply the mainstream SSA , one often needs to assume some kind of stationarity of the time series and think in terms of the "signal plus noise" model (where the noise is often assumed to be ‘red’). In the "Caterpillar" SSA , the main methodological stress is on separability (of one component of the series from another one) and neither the assumption of stationarity nor the model in the form "signal plus noise" are required.
"Caterpillar" SSA
The basic "Caterpillar" SSA algorithm for analyzing one-dimensional time series consists of:
Transformation of the one-dimensional time series to the trajectory matrix by means of a delay procedure (this gives the name to the whole technique);
Singular Value Decomposition of the trajectory matrix;
Reconstruction of the original time series based on a number of selected eigenvectors.
This decomposition initializes forecasting procedures for both the original time series and its components. The method can be naturally extended to multidimensional time series and to image processing.
The method is a powerful and useful tool of time series analysis in meteorology, hydrology, geophysics, climatology and, according to our experience, in economics, biology, physics, medicine and other sciences; that is, where short and long, one-dimensional and multidimensional, stationary and non-stationary, almost deterministic and noisy time series are to be analyzed.
"Caterpillar" SSA inputs are as follows:
lag - How much lag to introduce into the SSA algorithm, the higher this number the slower the process and smoother the signal
ncomp - Number of Computations or cycles of of the SSA algorithm; the higher the slower
ssapernorm - SSA Period Normalization
numbars =- number of past bars, to which SSA is fitted
Included:
Bar coloring
Alerts
Signals
Loxx's Expanded Source Types
Related Fourier Transform Indicators
Real-Fast Fourier Transform of Price w/ Linear Regression
Fourier Extrapolator of Variety RSI w/ Bollinger Bands
Fourier Extrapolator of Price w/ Projection Forecast
Related Projection Forecast Indicators
Itakura-Saito Autoregressive Extrapolation of Price
Helme-Nikias Weighted Burg AR-SE Extra. of Price
Related SSA Indicators
End-pointed SSA of FDASMA
End-pointed SSA of Williams %R