Relative Strength of 2 securities - Jayy This is an update of the Relative Strength to index as used by Leaf_West.. 4th from the top. my original RS script is 3rd from the top.
In this use of the term " Relative Strength" (RS) what is meant is a ratio of one security to another.
The RS can be inerpreted in a fashion similar to price action on a regual security chart.
If you follow his methods be aware of the different moving averages for the different time periods.
From Leaf_West: "on my weekly and monthly R/S charts, I include a 13 EMA of the R/S (brown dash line) and
an 8 SMA of the 13 EMA (pink solid line). The indicator on the bottom of the weekly/monthly charts is an
8 period momentum indicator of the R/S line. The red horizontal line is drawn at the zero line.
For daily or 130-minute time periods (or shorter), my R/S charts are slightly different
- the moving averages of the R/S line include a 20EMA (brown dash line), a 50 EMA (blue dash line) and
an 8 SMA of the20 EMA (pink solid line). The momentum indicator is also slightly different from the weekly/monthly
charts – here I use a 12 period calculation (vs 8 SMA period for the weekly/monthly charts)."
Leaf's website has gone but I if you are interested in his methods message me.
What is different from my previous RS: The RS now displays RS candles. So if you prefer to watch price action of candles to
a line chart which only plots the ratio of closes then this will be more interesting to you.
I have also thrown in a few options to have fun with.
Jayy
In den Scripts nach "weekly" suchen

SuperTrend Oscillator v3Version 3: Improved aesthetically, complete turnaround for the strategy with which to use this indicator.
Once again, thanks to BlindFreddy and ChrisMoody for the bits of code that were assembled into this indicator.
Make the chart yours using the share button for the indicator with barcolors functionality.
Changes from v2 and looking forward: Indicator now uses a 14 length SuperTrend with no ATR multiplier. This my preferred use and I'd be grateful to hear your case for a different length/multiplier. Removed the Bollinger Bands and retracement dots due to these being gimmicky and marginally useful. There may be a version 4 should a similar concept using a rate of change analysis turn out to be useful. I have also tried -in vain- to plot internal trend peaks as horizontal S/R levels. Please pm if you are willing to help in that respect.
Strategy: The indicator will display the trend as a red/green area. It measures the spread between the closing price and the SuperTrend line, much like a CCI (close and ma). When the area contracts warning bars of the opposite trend color will warn of a reversal. When this happens, these areas will either be defended, reviving the trend, or will break, causing a trend flip. SuperTrend is unique in that breaks are typically large candles, and that its levels, especially on Weekly, Daily, Hourly, Minute timeframes, these levels will be defended (think similar to a 200sma or a 21ema). The STO making new highs within (internal) a trend is an overextension sign.
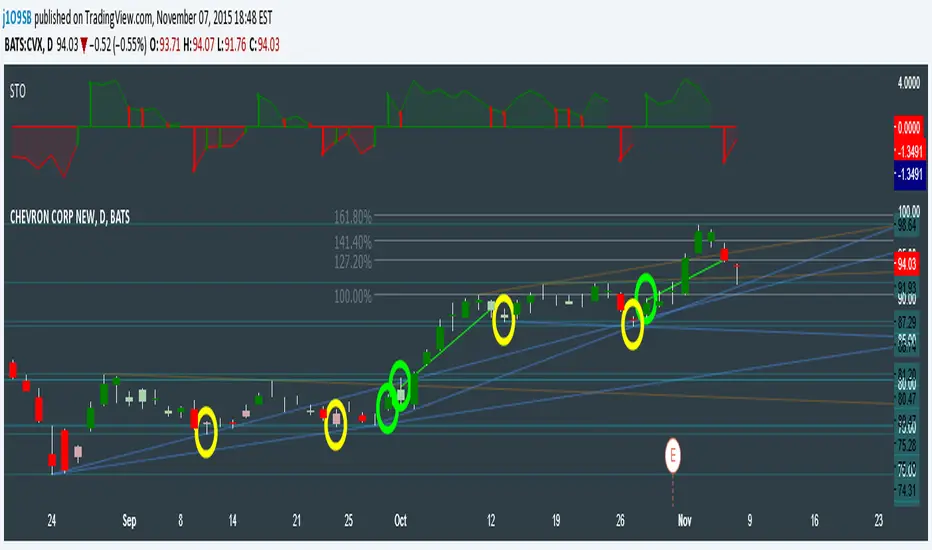
CVX Example: This is not a full analysis of CVX's stock , just an example potential trades. On the posted chart I used a weekly and a daily STO.
Long 1:The weekly showed warnings and then flipped. The daily made a double bottom, showed warnings and then flipped the daily STO at trendline support.
Long 2:The weekly still shows an uptrend, the daily made a weak break to downtrend and reversed back upwards at trendline support, forming a double bottom. Note the conservative exit when the STO made an internal new high.
Long 3: looking forward on CVX stock , the current downtrend made a weak break and is showing sings of reversal (pin bar) at horizontal support. Go long on flip of the daily (conservative) or flip of the hourly (aggressive).
SuperTrend OscillatorVersion 3: Improved aesthetically, complete turnaround for the strategy with which to use this indicator.
Once again, thanks to BlindFreddy and ChrisMoody for the bits of code that were assembled into this indicator.
Make the chart yours using the share button for the indicator with barcolors functionality.
Changes from v2 and looking forward: Indicator now uses a 14 length SuperTrend with no ATR multiplier. This my preferred use and I'd be grateful to hear your case for a different length/multiplier. Removed the Bollinger Bands and retracement dots due to these being gimmicky and marginally useful. There may be a version 4 should a similar concept using a rate of change analysis turn out to be useful. I have also tried -in vain- to plot internal trend peaks as horizontal S/R levels. Please pm if you are willing to help in that respect.
Strategy: The indicator will display the trend as a red/green area. It measures the spread between the closing price and the SuperTrend line, much like a CCI (close and ma). When the area contracts warning bars of the opposite trend color will warn of a reversal. When this happens, these areas will either be defended, reviving the trend, or will break, causing a trend flip. SuperTrend is unique in that breaks are typically large candles, and that its levels, especially on Weekly, Daily, Hourly, Minute timeframes, these levels will be defended (think similar to a 200sma or a 21ema). The STO making new highs within (internal) a trend is an overextension sign.
CVX Example: This is not a full analysis of CVX's stock, just an example potential trades. On the posted chart I used a weekly and a daily STO.
Long 1:The weekly showed warnings and then flipped. The daily made a double bottom, showed warnings and then flipped the daily STO at trendline support.
Long 2:The weekly still shows an uptrend, the daily made a weak break to downtrend and reversed back upwards at trendline support, forming a double bottom. Note the conservative exit when the STO made an internal new high.
Long 3: looking forward on CVX stock, the current downtrend made a weak break and is showing sings of reversal (pin bar) at horizontal support. Go long on flip of the daily (conservative) or flip of the hourly (aggressive).

Momentum of Relative strength to Index Leaf_West styleMomentum of Relative Strength to index as used by Leaf_West. This is to be used with the companion Relative Strength to Index indicator Leaf_West Style. Make sure you use the same index for comparison. If you follow his methods be aware of the different moving averages for the different time periods. From Leaf_West: "on my weekly and monthly R/S charts, I include a 13 EMA of the R/S (brown dash line) and an 8 SMA of the 13 EMA (pink solid line). The indicator on the bottom of the weekly/monthly charts is an 8 period momentum indicator of the R/S line. The red horizontal line is drawn at the zero line.
For daily or 130-minute time periods (or shorter), my R/S charts are slightly different - the moving averages of the R/S line include a 20EMA (brown dash line), a 50 EMA (blue dash line) and an 8 SMA of the20 EMA (pink solid line). The momentum indicator is also slightly different from the weekly/monthly charts – here I use a 12 period calculation (vs 8 SMA period for the weekly/monthly charts)." Leaf's methods do evolve and so watch for any changes to the preferred MAs etc..

Relative strength to Index set up as per Leaf_WestRelative Strength to index as used by Leaf_West. If you follow his methods be aware of the different moving averages for the different time periods. From Leaf_West: "on my weekly and monthly R/S charts, I include a 13 EMA of the R/S (brown dash line) and an 8 SMA of the 13 EMA (pink solid line). The indicator on the bottom of the weekly/monthly charts is an 8 period momentum indicator of the R/S line. The red horizontal line is drawn at the zero line.
For daily or 130-minute time periods (or shorter), my R/S charts are slightly different - the moving averages of the R/S line include a 20EMA (brown dash line), a 50 EMA (blue dash line) and an 8 SMA of the20 EMA (pink solid line). The momentum indicator is also slightly different from the weekly/monthly charts – here I use a 12 period calculation (vs 8 SMA period for the weekly/monthly charts)." Leaf's methods do evolve and so watch for any changes to the preferred MAs etc..

CM_Pivot Points Daily To IntradayNew Pivots Indicator With Options for Daily, 4 Hour, 2 Hour, 1 Hour, 30 Minute Pivot Levels!
Great for Forex Traders! - Take a Look at Chart with Weekly, Daily, and 4 Hour levels. Weekly Pivots Indicator is separate - Link is Below.
Plot one Pivot Level or Multiple at the Same Time via Check Boxes in the Inputs tab.
Defaults to 4 Hour Pivot Levels - Adjust in Inputs Tab.
S3 and R3 are turned off by Default - You can Activate Them In The Inputs Tab.
These Intraday Options were Requested By Users Using My CM_ Pivots Point Custom Indicator that Plots Daily, Weekly, Monthly, Quarterly, and Yearly Pivot Levels. Link is Below.
Now Both Longer-Term Traders and Shorter Term Traders Have All The Pivot Levels They Need. From Yearly Levels All The Way Down to 30 Minute Levels!
***The Candles On The Chart Are Custom Heikin-Ashi Paint Bars. Link is Below
CM_ Pivot Points Custom
Daily, Weekly, Monthly, Quarterly, Yearly Pivot Levels
Heikin-Ashi Paint Bars

CM_Pivot Points_CustomCustom Pivots Indicator - Plots Yearly, Quarterly, Monthly, Weekly, and Daily Levels.
I created this indicator because when you have multiple Pivots on one chart (For Example The Monthly, Weekly, And Daily Pivots), the only way to know exactly what pivot level your looking at is to color ALL S1 Pivots the same color, but create the plot types to look different. For example S1 = Bright Green with Daily being small circles, weekly being bigger circles, and monthly being even bigger crosses for example. This allows you to visually know exactly what pivot levels your looking at…Instantly without thinking. This indicator allows you to Choose any clor you want for any Pivot Level, and Choose The Plot Type.

TQ Gold Trend (Macro Regime)This indicator answers one question only:
Is gold in a monetary uptrend right now?
It does not:
Forecast prices
Time entries
Use momentum or volatility
It simply classifies the macro trend regime of gold.
3️⃣ Logic (Simple, Explicit)
Timeframe: Weekly
Indicator: 30-week Simple Moving Average
Interpretation:
Bullish: Price above a rising 30W SMA
Bearish: Price below a falling 30W SMA
Neutral: Everything else (transition / range)
This is classic macro trend / stage analysis, adapted for gold as a monetary asset.
4️⃣ How to Use It (User Instructions)
How to read the chart
>If Gold is Bull, precious metals matter.
>If Gold is Bear, ignore silver and miners.
>If Gold is Neutral, wait — no edge.
Best use
Check once per week
Use as the first filter before looking at:
Gold/DXY
Gold/SPY
Silver/Gold
Recommended timeframe
Weekly only (designed for macro regimes, not trading)

Adaptive Market Structure Channel By S B PrasadAdaptive Market Structure Channel (AMSC)
Institutional-Grade Trend, Volatility & Liquidity Framework
Overview
The Adaptive Market Structure Channel (AMSC) is a multi-engine, adaptive trading framework designed to read market structure, volatility, liquidity, and trend strength in real time.
It integrates ATR-based channels, pivot structure, supply–demand zones, liquidity sweeps, multi-factor momentum, and higher-timeframe confirmation into a single, coherent visual system.
AMSC is not a single-indicator strategy.
It is a context-driven decision framework intended to help traders align entries with dominant trend, structural levels, and institutional activity.
Core Components
1️⃣ Adaptive ATR Trend Channel
Dynamic ATR-based support & resistance
Automatically adjusts to volatility
Color-coded trend strength (strong / weak regimes)
Acts as the primary trend bias filter
2️⃣ Pivot-Based ATR Trend Channels
Channels built from confirmed pivot highs and lows
ATR-expanded structure, not fixed slopes
Separates impulse moves from corrections
Useful for trend continuation and pullback trades
3️⃣ Market Structure: Supply & Demand Zones
Automatically plots fresh demand and supply zones
Zones extend forward until violated
Helps identify high-probability reaction areas
Used as a location filter, not a standalone signal
4️⃣ Liquidity Sweep Detection (Smart Money Logic)
Identifies equal high / equal low liquidity pools
Detects stop-hunt style sweeps
Validates sweeps only when price reacts from structure zones
Prevents chasing false breakouts
5️⃣ Multi-Factor Trend Confirmation Engine
Combines:
EMA structure
MACD momentum
RSI regime
VWAP positioning
Optional ribbon & HMA filters
Signals are generated only when a majority of factors align, avoiding single-indicator bias.
6️⃣ Volatility Context (Bollinger Bands)
Provides volatility expansion / contraction context
Helps distinguish trend continuation vs compression
Works as a background regime filter
7️⃣ Higher Timeframe Confirmation
Confirms trend using a user-selected HTF
Prevents counter-trend trades during strong HTF bias
Essential for intraday and swing traders
8️⃣ Session-Aware Trading
Optional India, London, and New York session filters
Signals only during active market participation
Avoids low-liquidity false signals
9️⃣ Professional Dashboard
Real-time display of:
Trend direction
Trend strength
Factor alignment
HTF bias
Active zone
Trade signal
Session status
Designed for quick decision-making, not clutter.
How to Use AMSC (Best Practice)
✔ Trade in the direction of the ATR trend
✔ Enter near demand/supply within the channel
✔ Confirm with factor alignment & HTF bias
✔ Use liquidity sweeps as entry triggers, not signals alone
✔ Avoid trades during low-strength or inactive sessions
AMSC performs best when used as a confluence system, not a mechanical entry-exit robot.
Ideal Use Cases
Intraday index trading
Swing trading in trending markets
Futures & FX structure-based trading
Traders who prefer context over indicators
What AMSC Is NOT
❌ Not a scalping toy
❌ Not a repainting indicator
❌ Not a one-click signal generator
It is built for disciplined traders who understand structure and risk.
Final Note
AMSC is designed to think like the market, not predict it.
Use it to read conditions, not chase signals.
MSC — BEST CLEAN SETUP (RECOMMENDED)
🎯 Design Philosophy
“Context first, signals last.”
The goal is to:
Read trend & structure at a glance
Avoid indicator overload
Let price + zones + channel do the heavy lifting
1️⃣ CORE VISUALS (KEEP ON)
These are non-negotiable.
🔹 Adaptive ATR Trend Channel
✅ ON
Primary trend bias
Use ATR Trendline Color = ON
This alone defines:
Bull vs Bear
Strength vs weakness
👉 If price is above channel → bullish context
👉 If price is below channel → bearish context
🔹 Pivot ATR Trend Channel
✅ ON
Channel fill: ON
Transparency ≥ 85
Purpose:
Visualise trend slope
Spot pullbacks inside trend
👉 Treat channel edges as dynamic structure, not entry signals.
🔹 Supply & Demand Zones
✅ ON
Transparency: 80–85
Zones auto-expire visually when violated
👉 These are your only horizontal levels.
2️⃣ SMART FILTERS (SELECTIVE)
💧 Liquidity Sweep
✅ ON
Lookback: 5
Tolerance: 0.15 ATR
👉 Use sweeps only near zones
❌ Ignore sweeps in the middle of nowhere
⏱ Session Filter
✅ ON
Trade only one session
India (for NSE)
London (for FX)
New York (for US indices)
❌ Do NOT enable multiple sessions simultaneously
🔍 Higher Timeframe (HTF)
✅ ON
Intraday: Daily
Swing: Weekly
👉 If HTF disagrees → no trade
3️⃣ WHAT TO TURN OFF (CRITICAL)
This is where clutter dies.
❌ Bollinger Bands
🚫 OFF by default
Use only when studying volatility compression
Otherwise adds visual noise
❌ Full ATR Channel (Ver 15)
🚫 OFF
Redundant with pivot + ATR trend
Keep only one channel logic
❌ SuperTrend Channel
🚫 OFF
ATR Trend Channel already covers this
❌ Pivot Levels (P, R1, S1…)
🚫 OFF
Zones replace static pivots
Too many horizontal lines = paralysis
❌ Previous Day / Week Levels
🚫 OFF
Turn ON only for index option trading
Otherwise clutter
4️⃣ MOVING AVERAGES (STRICT RULE)
Keep ONLY:
EMA Fast (9)
EMA Slow (21)
Optional:
HMA → ON only for scalping
❌ Do NOT stack multiple MAs visually
5️⃣ DASHBOARD (MINIMAL MODE)
🧭 Dashboard
✅ ON
Position: Top Right
Text Size: Small
Watch only:
Trend
Strength
HTF
Zone
Signal
Ignore factor numbers once confidence develops.
6️⃣ SIGNAL USAGE (DISCIPLINE RULE)
✔ Signal must appear inside a zone
✔ Signal must align with trend & HTF
✔ Signal must be during session
❌ Never take:
Signals mid-channel
Signals against HTF
Signals during flat strength (<30%)
7️⃣ RECOMMENDED PRESETS (COPY THIS)
🔹 Intraday (Clean)
Timeframe: 5m / 15m
HTF: Daily
Session: India / NY
BB: OFF
Full ATR: OFF
SuperTrend: OFF
Pivots: OFF
🔹 Swing (Ultra Clean)
Timeframe: 1H / 4H
HTF: Weekly
Liquidity: ON
Zones: ON
Dashboard: ON (small)
8️⃣ GOLDEN RULE (MOST IMPORTANT)
If you cannot explain the trade using only:
Trend channel
One zone
One sweep
Do not trade it.
🏁 FINAL VERDICT
AMSC is not cluttered by design.
Clutter comes from turning everything ON.
Used correctly:
The chart stays clean
Decisions become obvious
Overtrading disappears
AMSC – TRADE EXECUTION RULEBOOK
Framework rule:
Trend → Structure → Liquidity → Entry → Risk → Exit
1️⃣ MARKET PRE-CONDITIONS (MANDATORY)
❌ NO TRADE unless ALL are TRUE
✅ Trend Filter
ATR Trend Channel = Bull for longs / Bear for shorts
Trend strength ≥ 40%
Price must be on the correct side of the channel
✅ HTF Confirmation
HTF bias must match LTF trend
If HTF is neutral → NO TRADE
✅ Session Filter
Trade only during active session
No first 5 minutes after session open
No last 15 minutes before session close
2️⃣ LOCATION RULE (MOST IMPORTANT)
🔹 Long Trades
Price must be inside or just above a DEMAND zone
Zone must be:
Fresh (not tested more than twice)
Within the Pivot ATR Channel
🔹 Short Trades
Price must be inside or just below a SUPPLY zone
Same freshness rules apply
❌ No zone → no trade
3️⃣ LIQUIDITY CONFIRMATION (ENTRY TRIGGER)
🔹 Long Entry Trigger
At the demand zone, you must see:
✔ Sell-side liquidity sweep
✔ Sweep candle closes bullish
✔ Sweep occurs inside the zone
🔹 Short Entry Trigger
At the supply zone, you must see:
✔ Buy-side liquidity sweep
✔ Sweep candle closes bearish
✔ Sweep occurs inside the zone
4️⃣ ENTRY RULE (EXECUTION)
🔵 LONG ENTRY
Enter BUY when all conditions align and:
Enter at:
Close of the sweep candle OR
50% retrace of the sweep candle (preferred)
🔴 SHORT ENTRY
Enter SELL when:
Enter at:
Close of the sweep candle OR
50% retrace of the sweep candle
5️⃣ STOP-LOSS RULES (NON-NEGOTIABLE)
🔻 Long SL
Place SL at:
Lowest point of the demand zone
OR
Below sweep low − 0.1 ATR (whichever is lower)
🔺 Short SL
Place SL at:
Highest point of the supply zone
OR
Above sweep high + 0.1 ATR (whichever is higher)
❌ Never trail SL early
❌ Never move SL to break-even before partial exit
6️⃣ POSITION SIZE (FIXED RISK ONLY)
Risk per trade: 0.5% – 1% max
If SL distance is large → reduce position size
Do not widen SL to fit position
7️⃣ EXIT RULES (STRUCTURED)
🎯 TARGET 1 (T1 – Protection)
At 1R
Action:
Book 50%
Move SL to Break-Even
🎯 TARGET 2 (T2 – Structure)
Next opposite zone
OR
Pivot ATR Channel mid-line
Book 30%
🎯 FINAL EXIT (TREND FOLLOW)
Exit remaining 20% when:
✔ Opposite liquidity sweep occurs
✔ Price closes beyond Pivot ATR Channel
✔ HTF bias flips
✔ Session ends
8️⃣ NO-TRADE CONDITIONS (ABSOLUTE)
❌ Trend strength < 30%
❌ Zone already tested 3+ times
❌ Liquidity sweep outside zone
❌ Entry candle is oversized (>1.8 ATR)
❌ Trade against HTF
❌ Emotional or revenge trade
9️⃣ ONE-SCREEN TRADE CHECKLIST
Before clicking BUY/SELL:
✔ Trend aligned
✔ HTF aligned
✔ In session
✔ At zone
✔ Sweep confirmed
✔ SL defined
✔ R ≥ 2 possible
If any answer = NO → skip trade
🔒 DISCIPLINE STATEMENT (PRINT THIS)
AMSC does not pay for activity.
It pays for patience, location, and discipline.
🏁 EXPECTED PERFORMANCE (REALISTIC)
Win rate: 45–60%
R:R average: 1:2.5 to 1:4
Drawdown: low
Trade frequency: selective
Adaptive Market Structure Channel — Visual Layout
5
🧭 How to READ the Chart (Left → Right)
1️⃣ Core Trend Context (FIRST thing your eyes see)
ATR Trend Channel
Acts as dynamic support/resistance
Green = bullish regime
Red = bearish regime
No second trendline competing with it
👉 If price is on the wrong side → no trade
2️⃣ Pivot ATR Structure Channel (SECOND layer)
Sloping channel following real swing structure
Shows:
Trend acceleration
Healthy pullbacks
Channel fill is very light (high transparency)
👉 Pullbacks inside this channel are valid
👉 Breaks outside = caution / exit
3️⃣ Supply & Demand Zones (ONLY horizontal objects)
Few, wide, soft-colored zones
No pivot clutter, no fibs, no grids
👉 Trades happen only here
4️⃣ Liquidity Sweep Markers (EVENT-BASED)
Appears only near zones
Indicates stop-hunt, not entry by itself
👉 Sweep + zone + trend = setup
👉 Sweep alone = ignore
5️⃣ Dashboard (Decision Support, not distraction)
Small
Corner-placed
Shows only:
Trend
Strength
HTF bias
Zone
Signal
Session
👉 After experience, you’ll barely look at it
🚫 What You DO NOT See (Very Important)
A clean AMSC chart intentionally avoids:
Multiple moving averages
Pivot levels (P/R/S)
Too many channels
Oscillator panels
Bright fills or thick lines
If your chart looks “busy”, something is ON that should be OFF.
🧠 Mental Model (Keep This Image in Mind)
AMSC chart =
1 dynamic trend
1 structure channel
1 zone
1 liquidity event
1 decision
Anything more → clutter
Anything less → blind trading
✅ Final Visual Checklist (Before Trading)
✔ Chart background visible
✔ Candles clearly readable
✔ Zones visible but not loud
✔ Channel guides the eye
✔ Nothing overlaps price excessively
If yes → you are trading AMSC correctly

MACD Trend Count ScoreThis indicator is designed to confirm potential future trends in an asset’s price by analyzing the MACD histogram in the past. It works by counting positive and negative MACD bars within the selected chart timeframe to calculate a Strength Index, which reflects the past trend direction and intensity.
Summarizing the predominance of positive or negative bars across higher timeframes in the past such as daily, weekly, bi-weekly, and quarterly, it provides insight to anticipate how the trend may evolve in upcoming periods, according to the predetermined range scales Strong Bullish, Moderate Bullish, Neutral, Moderate Bearish and Strong Bearish.
Additionally, a dedicated module linked to the strength index is optimized for short-term charts (2-minute, 5-minute and 15-minute timeframes), making it a valuable tool for day trading strategies.

RSI-RS StrategyRSI-RS Strategy: Smart Trend Following 🚀
Overview
This strategy combines Multi-Timeframe RSI with Mansfield Relative Strength to identify high-momentum breakouts in strong stocks. Unlike standard RSI strategies, it features a "Smart Trailing Stop" that tightens when momentum weakens but respects key RSI 50 support levels to avoid shaking you out of winning trades.
Key Features ✨
1. 🎯 High-Probability Entries
Multi-Confirmations: Requires Monthly RSI > 60 and Weekly RSI > 60 (Trend is Up).
Dual Trigger: Enters on a Daily RSI Breakout (>60) OR a Weekly RSI Catch-up, ensuring you don't miss late moves.
RS Filter: Only buys stocks outperforming the Index (RS > 0).
New Listing Safe: Automatically skips Monthly checks for new IPOs lacking history.
2. 🛡️ Advanced "Hybrid" Stop Loss
This strategy solves the "Wick Out" problem:
Confirmation Exit: If price drops below the Stop Loss, it waits for the Next Candle to confirm the breakdown. It ignores intraday wicks!
Crash Protection: Includes a "Panic Button" (Default 3% buffer). If price crashes rapidly intraday, it exits immediately to save capital.
Smart Trailing: The Stop Loss moves UP when RSI shows weakness (<60), locking in profits.
3. 🧠 Smart Support Buffer
Wait for 50: Uniquely detects when RSI is resting on 50 Support (Zone 50-55).
Patience: It ignores minor weakness signals in this zone, waiting for a bounce instead of exiting prematurely.
4. 🧹 Clean Visuals
Minimalist Labels: Transparent Entry/Exit labels that don't declutter the chart.
Setup Watch: Visually signals "Watch > " before the trade triggers.
Transparency: "SL Update" diamonds prove exactly why the stop moved (showing the RSI value).
Settings Guide ⚙️
Confirmation Window: How many bars the breakout remains valid (Default: 2).
RSI Support Buffer: The "Safe Zone" range above 50 (Default: 5).
Crash Buffer %: Distance below SL for immediate emergency exit (Default: 3.0%).
Visuals: Toggle Setup Labels and SL Diamonds on/off to keep your chart clean.
How to Trade It
Green Background: You are in a trade.
Red Line: Your Hard Stop Loss (Closing Basis).
Maroon Dotted Line: Your Crash Limit (Intraday Danger Zone).
Orange Diamond: Warning! RSI Weakness detected, SL has tightened.
Disclaimer
Backtested on Indian Equities (NSE). Designed for Swing Trading on Daily Timeframe. Always manage your own risk.

LevelsOverview
HL Marking Pro is a clean, multi-timeframe level marker designed for traders who prioritize a clutter-free workspace. Unlike standard indicators that crowd the chart area with text labels, this script utilizes native Price Scale Tags to display key historical and intraday levels directly on the Y-axis.
Key Features
Axis-Integrated Labels: Key levels are displayed as colored tags on the right-hand price scale, keeping the candle area clear for price action analysis.
Dynamic Session Tracking: Includes real-time tracking for the current Session High (SH) and Session Low (SL).
Multi-Timeframe Logic: Automatically tracks Previous Daily (PDH/L), Weekly (PWH/L), Monthly (PMH/L), Quarterly (PQH/L), and Yearly (PYH/L) levels.
Smart Visibility: To prevent "color waterfalls" on the axis, lower-tier levels (Daily/Session) are automatically hidden on higher timeframe charts (Weekly/Monthly).
Reliable ATH: The All-Time High (ATH) is calculated via security calls to ensure it remains visible and accurate even on high-timeframe charts where bar history might be limited.
No Repainting: All historical levels reference completed candles to ensure levels stay fixed and reliable throughout the trading session.
How to Use
Add the script to your chart.
To get the cleanest look (matching the screenshots), Right-click the Price Scale -> Labels -> and select "Value Only". This removes the indicator name and the colon (:) prefix.
The script will automatically adjust which levels are shown based on the timeframe you are currently viewing.

Vwap by EVThis indicator provides a complete multi-VWAP framework designed for traders who rely on price acceptance, value areas, and mean reversion across different market horizons. It plots Session, Daily, and Weekly VWAPs simultaneously, allowing users to understand short-term, intraday, and higher-timeframe value in a single, uncluttered view.
The Session VWAP supports custom trading hours and timezones, making it adaptable to equities, indices, forex, and crypto markets. All VWAP calculations are volume-weighted and non-repainting, with optional standard deviation bands based on true volume dispersion rather than fixed offsets. This ensures that each VWAP reflects genuine market participation and volatility.
Daily and Weekly VWAPs act as higher-timeframe equilibrium references, helping traders identify premium and discount zones, dynamic support and resistance, and directional bias. Optional band visibility and independent styling allow the indicator to remain clean while still providing depth when needed.

Previous Highs and Lows (M, W, D) Displays previous Monthly, Weekly, and Daily key swing highs/lows with clean , timeframe-specific coloring. Essential structure reference for multi-timeframe traders!!
Your Monthly/Weekly/Daily structural backbone in one indicator!!!!

EMA Trend Reversal (Regime Change)
EMA Trend Reversal (Regime Change)
This indicator highlights EMA slope reversals that often coincide with trend or regime shifts, using a simple two-stage visual system.
It is especially effective on higher timeframes (Daily / Weekly) for swing trading and trend-bias awareness.
Detailed User Guide
What the signals mean
Unconfirmed signals (triangles)
Yellow triangle below price
- EMA is turning up intrabar (not yet confirmed)
Yellow triangle above price
- EMA is turning down intrabar (not yet confirmed)
Unconfirmed signals may repeat at a set interval until confirmation.
Confirmed signals (dots)
Green dot below price
- EMA slope has confirmed upward (bullish regime shift)
Red dot above price
- EMA slope has confirmed downward (bearish regime shift)
Confirmed dots only appear after the candle closes.
Alerts
This script provides two alerts only:
EMA Reversal UP
EMA Reversal DOWN
Each alert can fire on:
Initial unconfirmed reversal
Reminder interval while unconfirmed
Final confirmed reversal
Alerts will NOT fire unless this indicator is active on at least one chart.
It may be kept on a chart you do not actively trade.
Settings
EMA Length (default: 21)
Reminder interval (minutes)
Show / hide unconfirmed triangles
Show / hide confirmed dots
Dot transparency
Colors (locked to preserve signal meaning)
Best use cases
Identifying trend or regime changes
Weekly swing trade entries and exits
Holding-period guidance during trends
Alert-based monitoring without watching charts
This is not a scalp or oscillator signal.
It works best when combined with structure, support/resistance, or higher-timeframe context.
Disclaimer
This indicator is provided for educational and informational purposes only.
It does not constitute financial, investment, or trading advice.
All trading involves risk. Use at your own discretion.

EMA Trend Reversal (Regime Change)EMA Trend Reversal (Regime Change)
This indicator highlights EMA slope reversals that often coincide with trend or regime shifts, using a simple two-stage visual system.
It is especially effective on higher timeframes (Daily / Weekly) for swing trading and trend-bias awareness.
Detailed User Guide
What the signals mean
Confirmed signals (dots)
Green dot below price
- EMA slope has confirmed upward (bullish regime shift)
Red dot above price
- EMA slope has confirmed downward (bearish regime shift)
Confirmed dots only appear after the candle closes.
Unconfirmed signals (triangles)
Yellow triangle below price
- EMA is turning up intrabar (not yet confirmed)
Yellow triangle above price
- EMA is turning down intrabar (not yet confirmed)
Unconfirmed signals may repeat at a set interval until confirmation.
Alerts
This script provides two alerts:
EMA Reversal UP
EMA Reversal DOWN
Each alert can fire on:
Initial unconfirmed reversal
Reminder interval while unconfirmed
Final confirmed reversal
Alerts will NOT fire unless this indicator is active on at least one chart.
It may be kept on a chart you do not actively trade.
Settings
EMA Length (default: 21)
Reminder interval (minutes)
Show / hide unconfirmed triangles
Show / hide confirmed dots
Dot transparency
Colors (locked to preserve signal meaning)
Best use cases
Identifying trend or regime changes
Weekly swing trade entries and exits
Holding-period guidance during trends
Alert-based monitoring without watching charts
This is not a scalp or oscillator signal.
It works best when combined with structure, support/resistance, or higher-timeframe context.
Disclaimer
This indicator is provided for educational and informational purposes only.
It does not constitute financial, investment, or trading advice.
All trading involves risk. Use at your own discretion.

Dynamic ATR-based Renko Overlay - Non repaintingDaily ATR-Based Renko Overlay
Overview
This Pine Script v5 indicator creates a dynamic Renko overlay on your time-based charts (optimized for 1-minute timeframes), using the previous period's ATR from a user-specified higher timeframe (default: 1-hour) to determine brick sizes. Unlike traditional Renko charts, this is an overlay that draws Renko bricks directly on top of your existing candles, allowing you to combine the noise-filtering power of Renko with the full features of time-based charts.
It's designed for traders who want Renko's trend-clarity benefits without switching chart types, especially useful for intraday trading in volatile markets like forex, stocks, or crypto.
Key Features
- Adaptive Brick Sizing: Brick size is calculated as a percentage (default 40%) of the previous period's ATR (Average True Range, default length 14) from the selected higher timeframe (default: 1-hour). This makes bricks volatility-adjusted—larger in high-vol periods to reduce noise, smaller in low-vol for more detail.
- Periodic Recalculation: Resets brick size at the start of each new period based on the user-specified reset timeframe (default: daily), using the prior period's ATR from the chosen timeframe. This ensures relevance without unwanted disruptions.
- Traditional Renko Logic: Uses 1-box reversal (a full brick against the trend to reverse). Bricks form based on closing prices, ignoring time and minor fluctuations.
- Visual Style: Stepped lines with green (up) and red (down) fills for a box-like appearance. Semi-transparent for easy overlay on candles.
- Customizable Inputs:
- ATR Length: Adjust the ATR period (default: 14).
- Percentage of ATR: Fine-tune brick sensitivity (default: 0.4 or 40%; range 0-1).
- ATR Timeframe: Specify the timeframe for ATR calculation (default: "60" for 1-hour; enter as a string like "240" for 4-hour, "D" for daily, etc.).
- Reset Timeframe: Specify the period for recalculating the brick size (default: "D" for daily; enter as a string like "W" for weekly, "M" for monthly, etc.).
How It Works
1. Fetches ATR from the user-specified timeframe via `request.security` for higher-timeframe volatility data.
2. On new periods based on the reset timeframe (or first load), sets brick size to `percent * ATR_HTF`.
3. Tracks Renko "close" and "previous close" to calculate bricks:
- Upward moves add green bricks in multiples of the size.
- Downward moves add red bricks.
- Reversals require a full brick against the direction.
4. Plots and fills create the overlay, updating on each 1-min bar close.
Add it to a 1-minute chart for best results—bricks will adapt periodically while you retain full candle visibility.
Why This Indicator is Helpful
TradingView's native Renko charts are powerful but come with limitations that can frustrate serious traders:
- No Bar Replay: Native Renko doesn't support TradingView's bar replay feature, making it hard to simulate historical trading sessions.
- Inaccurate/Repainting Strategy Testing: Strategies on native Renko can repaint or lack precision due to the non-time-based nature, leading to unreliable backtests.
- Limited Data History: Fast Renko timeframes (e.g., small bricks) often load very little historical data, restricting long-term analysis.
This overlay solves these by building Renko on a time-based chart:
- Full Bar Replay Support: Replay sessions as usual on your 1-min chart—the Renko follows along.
- Accurate, Non-Repainting Testing: Test strategies on the underlying time chart without repainting issues, as Renko is derived from closes.
- Unlimited Data Depth: Access TradingView's full historical data for 1-min charts (up to years of bars), not limited by Renko's data constraints.
- Hybrid Analysis: Overlay Renko on candles to spot trends while using volume, indicators (e.g., RSI, MAs), or drawing tools that don't work well on native Renko.
It's a game-changer for trend-following, breakout strategies, or filtering noise in short-term trades. No more switching charts—get the best of both worlds!
Usage Tips
- Best on 1-min charts for intraday precision, but experiment with others.
- Tune the percentage lower (e.g., 0.3) for more bricks/sensitivity, higher (e.g., 0.5) for fewer/false-signal reduction.
- Adjust the ATR timeframe to match your strategy—e.g., "240" for longer-term volatility or "15" for shorter.
- Customize the reset timeframe for different recalculation frequencies—e.g., "W" for weekly resets to capture broader market shifts, or "240" for every 4 hours.
- Combine with alerts: right now I am experimenting with 90 period EMA and the Renko brick pullbacks to find some EDGE
If you find this useful, give it a thumbs up or share your tweaks in the comments. Feedback welcome—happy trading! 🚀

[GYTS] VolatilityToolkit LibraryVolatilityToolkit Library
🌸 Part of GoemonYae Trading System (GYTS) 🌸
🌸 --------- INTRODUCTION --------- 🌸
💮 What Does This Library Contain?
VolatilityToolkit provides a comprehensive suite of volatility estimation functions derived from academic research in financial econometrics. Rather than relying on simplistic measures, this library implements range-based estimators that extract maximum information from OHLC data — delivering estimates that are 5–14× more efficient than traditional close-to-close methods.
The library spans the full volatility workflow: estimation, smoothing, and regime detection.
💮 Key Categories
• Range-Based Estimators — Parkinson, Garman-Klass, Rogers-Satchell, Yang-Zhang (academically-grounded variance estimators)
• Classical Measures — Close-to-Close, ATR, Chaikin Volatility (baseline and price-unit measures)
• Smoothing & Post-Processing — Asymmetric EWMA for differential decay rates
• Aggregation & Regime Detection — Multi-horizon blending, MTF aggregation, Volatility Burst Ratio
💮 Originality
To the best of our knowledge, no other TradingView script combines range-based estimators (Parkinson, Garman-Klass, Rogers-Satchell, Yang-Zhang), classical measures, and regime detection tools in a single package. Unlike typical volatility implementations that offer only a single method, this library:
• Implements four academically-grounded range-based estimators with proper mathematical foundations
• Handles drift bias and overnight gaps, issues that plague simpler estimators in trending markets
• Integrates with GYTS FiltersToolkit for advanced smoothing (10 filter types vs. typical SMA-only)
• Provides regime detection tools (Burst Ratio, MTF aggregation) for systematic strategy integration
• Standardises output units for seamless estimator comparison and swapping
🌸 --------- ADDED VALUE --------- 🌸
💮 Academic Rigour
Each estimator implements peer-reviewed methodologies with proper mathematical foundations. The library handles aspects that are easily missed, e.g. drift independence, overnight gap adjustment, and optimal weighting factors. All functions include guards against edge cases (division by zero, negative variance floors, warmup handling).
💮 Statistical Efficiency
Range-based estimators extract more information from the same data. Yang-Zhang achieves up to 14× the efficiency of close-to-close variance, meaning you can achieve the same estimation accuracy with far fewer bars — critical for adapting quickly to changing market conditions.
💮 Flexible Smoothing
All estimators support configurable smoothing via the GYTS FiltersToolkit integration. Choose from 10 filter types to balance responsiveness against noise reduction:
• Ultimate Smoother (2-Pole / 3-Pole) — Near-zero lag; the 3-pole variant is a GYTS design with tunable overshoot
• Super Smoother (2-Pole / 3-Pole) — Excellent noise reduction with minimal lag
• BiQuad — Second-order IIR filter with quality factor control
• ADXvma — Adaptive smoothing based on directional volatility
• MAMA — Cycle-adaptive moving average
• A2RMA — Adaptive autonomous recursive moving average
• SMA / EMA — Classical averages (SMA is default for most estimators)
Using Infinite Impulse Response (IIR) filters (e.g. Super Smoother, Ultimate Smoother) instead of SMA avoids the "drop-off artefact" where volatility readings crash when old spikes exit the window.
💮 Plug-and-Play Integration
Standardised output units (per-bar log-return volatility) make it trivial to swap estimators. The annualize() helper converts to yearly volatility with a single call. All functions work seamlessly with other GYTS components.
🌸 --------- RANGE-BASED ESTIMATORS --------- 🌸
These estimators utilise High, Low, Open, and Close prices to extract significantly more information about the underlying diffusion process than close-only methods.
💮 parkinson()
The Extreme Value Method -- approximately 5× more efficient than close-to-close, requiring about 80% less data for equivalent accuracy. Uses only the High-Low range, making it simple and robust.
• Assumption: Zero drift (random walk). May be biased in strongly trending markets.
• Best for: Quick volatility reads when drift is minimal.
• Parameters: smoothing_length (default 14), filter_type (default SMA), smoothing_factor (default 0.7)
Source: Parkinson, M. (1980). The Extreme Value Method for Estimating the Variance of the Rate of Return. Journal of Business, 53 (1), 61–65. DOI
💮 garman_klass()
Extends Parkinson by incorporating Open and Close prices, achieving approximately 7.4× efficiency over close-to-close. Implements the "practical" analytic estimator (σ̂²₅) which avoids cross-product terms whilst maintaining near-optimal efficiency.
• Assumption: Zero drift, continuous trading (no gaps).
• Best for: Markets with minimal overnight gaps and ranging conditions.
• Parameters: smoothing_length (default 14), filter_type (default SMA), smoothing_factor (default 0.7)
Source: Garman, M.B. & Klass, M.J. (1980). On the Estimation of Security Price Volatilities from Historical Data. Journal of Business, 53 (1), 67–78. DOI
💮 rogers_satchell()
The drift-independent estimator correctly isolates variance even in strongly trending markets where Parkinson and Garman-Klass become significantly biased. Uses the formula: ln(H/C)·ln(H/O) + ln(L/C)·ln(L/O).
• Key advantage: Unbiased regardless of trend direction or magnitude.
• Best for: Trending markets, crypto (24/7 trading with minimal gaps), general-purpose use.
• Parameters: smoothing_length (default 14), filter_type (default SMA), smoothing_factor (default 0.7)
Source: Rogers, L.C.G. & Satchell, S.E. (1991). Estimating Variance from High, Low and Closing Prices. Annals of Applied Probability, 1 (4), 504–512. DOI
💮 yang_zhang()
The minimum-variance composite estimator — both drift-independent AND gap-aware. Combines overnight returns, open-to-close returns, and the Rogers-Satchell component with optimal weighting to minimise estimator variance. Up to 14× more efficient than close-to-close.
• Parameters: lookback (default 14, minimum 2), alpha (default 1.34, optimised for equities).
• Best for: Equity markets with significant overnight gaps, highest-quality volatility estimation.
• Note: Unlike other estimators, Yang-Zhang does not support custom filter types — it uses rolling sample variance internally.
Source: Yang, D. & Zhang, Q. (2000). Drift-Independent Volatility Estimation Based on High, Low, Open, and Close Prices. Journal of Business, 73 (3), 477–491. DOI
🌸 --------- CLASSICAL MEASURES --------- 🌸
💮 close_to_close()
Classical sample variance of logarithmic returns. Provided primarily as a baseline benchmark — it is approximately 5–8× less efficient than range-based estimators, requiring proportionally more data for the same accuracy.
• Parameters: lookback (default 14), filter_type (default SMA), smoothing_factor (default 0.7)
• Use case: Comparison baseline, situations requiring strict methodological consistency with academic literature.
💮 atr()
Average True Range -- measures volatility in price units rather than log-returns. Directly interpretable for stop-loss placement (e.g., "2× ATR trailing stop") and handles gaps naturally via the True Range formula.
• Output: Price units (not comparable across different price levels).
• Parameters: smoothing_length (default 14), filter_type (default SMA), smoothing_factor (default 0.7)
• Best for: Position sizing, trailing stops, any application requiring volatility in currency terms.
Source: Wilder, J.W. (1978). New Concepts in Technical Trading Systems . Trend Research.
💮 chaikin_volatility()
Rate of Change of the smoothed trading range. Unlike level-based measures, Chaikin Volatility shows whether volatility is expanding or contracting relative to recent history.
• Output: Percentage change (oscillates around zero).
• Parameters: length (default 10), roc_length (default 10), filter_type (default EMA), smoothing_factor (default 0.7)
• Interpretation: High values suggest nervous, wide-ranging markets; low values indicate compression.
• Best for: Detecting volatility regime shifts, breakout anticipation.
🌸 --------- SMOOTHING & POST-PROCESSING --------- 🌸
💮 asymmetric_ewma()
Differential smoothing with separate alphas for rising versus falling volatility. Allows volatility to spike quickly (fast reaction to shocks) whilst decaying slowly (stability). Essential for trailing stops that should widen rapidly during turbulence but narrow gradually.
• Parameters: alpha_up (default 0.1), alpha_down (default 0.02).
• Note: Stateful function — call exactly once per bar.
💮 annualize()
Converts per-bar volatility to annualised volatility using the square-root-of-time rule: σ_annual = σ_bar × √(periods_per_year).
• Parameters: vol (series float), periods (default 252 for daily equity bars).
• Common values: 365 (crypto), 52 (weekly), 12 (monthly).
🌸 --------- AGGREGATION & REGIME DETECTION --------- 🌸
💮 weighted_horizon_volatility()
Blends volatility readings across short, medium, and long lookback horizons. Inspired by the Heterogeneous Autoregressive (HAR-RV) model's recognition that market participants operate on different time scales.
• Default horizons: 1-bar (short), 5-bar (medium), 22-bar (long).
• Default weights: 0.5, 0.3, 0.2.
• Note: This is a weighted trailing average, not a forecasting regression. For true HAR-RV forecasting, it would be required to fit regression coefficients.
Inspired by: Corsi, F. (2009). A Simple Approximate Long-Memory Model of Realized Volatility. Journal of Financial Econometrics .
💮 volatility_mtf()
Multi-timeframe aggregation for intraday charts. Combines base volatility with higher-timeframe (Daily, Weekly, Monthly) readings, automatically scaling HTF volatilities down to the current timeframe's magnitude using the square-root-of-time rule.
• Usage: Calculate HTF volatilities via request.security() externally, then pass to this function.
• Behaviour: Returns base volatility unchanged on Daily+ timeframes (MTF aggregation not applicable).
💮 volatility_burst_ratio()
Regime shift detector comparing short-term to long-term volatility.
• Parameters: short_period (default 8), long_period (default 50), filter_type (default Super Smoother 2-Pole), smoothing_factor (default 0.7)
• Interpretation: Ratio > 1.0 indicates expanding volatility; values > 1.5 often precede or accompany explosive breakouts.
• Best for: Filtering entries (e.g., "only enter if volatility is expanding"), dynamic risk adjustment, breakout confirmation.
🌸 --------- PRACTICAL USAGE NOTES --------- 🌸
💮 Choosing an Estimator
• Trending equities with gaps: yang_zhang() — handles both drift and overnight gaps optimally.
• Crypto (24/7 trading): rogers_satchell() — drift-independent without the lag of Yang-Zhang's multi-period window.
• Ranging markets: garman_klass() or parkinson() — simpler, no drift adjustment needed.
• Price-based stops: atr() — output in price units, directly usable for stop distances.
• Regime detection: Combine any estimator with volatility_burst_ratio().
💮 Output Units
All range-based estimators output per-bar volatility in log-return units (standard deviation). To convert to annualised percentage volatility (the convention in options and risk management), use:
vol_annual = annualize(yang_zhang(14), 252) // For daily bars
vol_percent = vol_annual * 100 // Express as percentage
💮 Smoothing Selection
The library integrates with FiltersToolkit for flexible smoothing. General guidance:
• SMA: Classical, statistically valid, but suffers from "drop-off" artefacts when spikes exit the window.
• Super Smoother / Ultimate Smoother / BiQuad: Natural decay, reduced lag — preferred for trading applications.
• MAMA / ADXvma / A2RMA: Adaptive smoothing, sometimes interesting for highly dynamic environments.
💮 Edge Cases and Limitations
• Flat candles: Guards prevent log(0) errors, but single-tick bars produce near-zero variance readings.
• Illiquid assets: Discretisation bias causes underestimation when ticks-per-bar is small. Use higher timeframes for more reliable estimates.
• Yang-Zhang minimum: Requires lookback ≥ 2 (enforced internally). Cannot produce instantaneous readings.
• Drift in Parkinson/GK: These estimators overestimate variance in trending conditions — switch to Rogers-Satchell or Yang-Zhang.
Note: This library is actively maintained. Suggestions for additional estimators or improvements are welcome.

Institutional PointOverview Institutional Point is a sophisticated data-mining indicator designed to identify and track "institutional footprints" by isolating the single candle with the highest volume relative to a specific time anchor. Unlike traditional volume profiles that aggregate data into price bins, this script pinpoints the exact temporal origin of massive liquidity injections.
Core Methodology The script operates on a multi-timeframe analysis engine (MTF). It scans sub-chart data (2-minute or 15-minute intervals) to find the absolute maximum volume peak within a defined period. Once the "Institutional Point" is identified:
Source Identification: The origin candle is highlighted in white, signaling a high-conviction entry or exit by large-scale market participants.
Zone Projection: A borderless "Institutional Zone" is projected forward from the spike’s high/low range.
Dynamic Interaction: The zone remains active until the price revisits the area (mitigation) or until the time-based expiration is reached.
Anchor Modes & Precision
8-Hour Cycle: Optimized for high-frequency scalping. Anchors reset at 00:00, 08:00, and 16:00. Utilizes ultra-precise 2-minute volume detection.
Daily Session: Designed for intraday and swing traders. Anchors to the Daily Open. Utilizes 2-minute volume detection to isolate precise institutional orders.
Weekly Cycle: Built for identifying major structural pivots. Anchors to the Weekly Open. Utilizes 15-minute volume detection for macro-liquidity analysis.
Key Features
Naked Level Tracking: Zones automatically stop extending the moment they are "hit" by price action, providing a clean visual of unmitigated liquidity.
Anti-Noise Filter: Automatically excludes Saturday and Sunday data to maintain statistical integrity across global markets.
Minimalist Interface: High-contrast visual design focused on scannability and professional chart aesthetics.
Use Cases
Data Science & Backtesting: Ideal for measuring the "Z-Score" or "Percentile Distance" from institutional peaks.
Supply & Demand Trading: Automated identification of the "Origin of the Move."
Magnet Analysis: Tracking "Naked" volume spikes as high-probability magnets for future price mean reversion.

Tradix COR Report Index📊 Tradix COT Report Index
The Tradix COT Report Index is an advanced market sentiment and positioning tool built on official Commitment of Traders (COT) Report data, designed to reveal how major market participants are truly positioned, beyond what price alone can show.
Instead of focusing on short-term price movements, the COT Report Index analyzes real futures positioning reported to the CFTC and categorizes it into three key groups:
Commercials – hedgers and so-called smart money
Non-Commercials – institutions, funds, and large speculators
Retail / Non-Reportables – small traders and crowd positioning
Raw positioning data (Long − Short) is transformed into a normalized 0–100 index, allowing traders to instantly identify extreme market sentiment, structural imbalances, and potential turning points — without manually interpreting complex COT tables.
🧠 How the Tradix COT Index Works
The index evaluates current net positions within a historical range (typically the last 52 weeks). This contextual approach makes it easy to see:
when Commercials are at extreme long or short levels
when speculative positioning becomes overcrowded
when the market reaches structural imbalance, increasing the probability of a mean-reversion or trend shift
By standardizing positioning data, the Tradix COT Index allows cross-market comparison, making it equally useful for indices, commodities, currencies, and futures-based CFDs.
🎯 How Traders Use It
The Tradix COT Report Index is not an entry signal tool.
Instead, it acts as a high-timeframe confirmation and market context indicator, commonly used for:
identifying long-term market bias
spotting divergences between price and positioning
confirming trend exhaustion or accumulation phases
filtering trades to align with institutional positioning
When combined with technical analysis, seasonality, and risk management, the COT Index provides a statistical edge rooted in real positioning data, not opinions or lagging indicators.
⚠️ Important Notes
COT data is updated weekly, not in real time
Best used on higher timeframes (Daily, Weekly)
Designed to enhance decision-making, not to replace trading systems

5-Layer Script Strategy P1 Midpoint Package (4H / D / W) This script is a multi timeframe framework that utilizes the 4H, Daily, and the Weekly timeframes. This Indicator automatically tracks the midpoints averages of those candles of the mentioned timeframes . This allows traders to actively see the markets momentum and opportunities for when the market reverses. These points acts as reaction levels and NOT ENTRY SIGNALS. This is a identity that helps identify direction and works with the other 4 Layers.
HOW IT WORKS
-Higher timeframe ranges are calculated using midpoints
-Midpoints persist until the candle closes
-No repainting either.
HOW TO USE THIS STRATEGY
-Start from the higher timeframe and work your way to the smaller ones
-Look for reactions and rejections rather than blind entries.
Weekly = bias is a swing
Daily = session to session directional bias
4HR = intraday framework to locate entries
WARNING
Not everyone uses the same settings therefore its natural to have multiple pieces, look through them and fix it to meet your expectations if need to.

Anchored VWAP PercentageINDICATOR: ANCHORED VWAP PERCENTAGE (AVWAP)
1. Overview
The Anchored VWAP Percentage (AVWAP) is a quantitative momentum and mean-reversion tool. It measures the percentage distance between the current price and a Volume Weighted Average Price (VWAP) that resets automatically based on specific time cycles. It allows traders to identify overextended market conditions relative to institutional value.
---
2. Core Logic & Calculation
The script tracks the relationship between price and volume starting from a specific Anchor Point .
* Volume-Weighted Foundation: Unlike simple moving averages, this indicator uses the VWAP formula: sum(Volume * Price) / sum(Volume) .
* Automatic Anchoring: The starting point (Anchor) resets automatically depending on the chart timeframe (e.g., resets weekly on a 15m chart, or yearly on a Daily chart).
* Percentage Deviation: It calculates the precise gap between the price and the VWAP, plotted as an oscillator: ((Price - VWAP) / VWAP) * 100 .
---
3. Adaptive Intelligence (Multi-Asset & Multi-TF)
The AVWAP is built with an internal database of 85th Percentile (P85) volatility thresholds. It recognizes that different assets have different "stretching" limits:
1. Asset-Specific Calibration: It includes optimized data for Bitcoin, Ethereum, Altcoins, Forex, and Indices .
2. Dynamic Timeframe Mapping: The anchor period and the exhaustion thresholds adjust automatically. For example:
* Intraday (1m-5m): Anchors to an 8-hour (480 min) cycle.
* Mid-Term (15m-60m): Anchors to a Weekly (W) cycle.
* Swing (Daily): Anchors to a Yearly (12M) cycle.
---
4. Visual Anatomy
The indicator is designed for high-speed decision-making:
* The Histogram:
* Green: Price is trading above the VWAP (Bullish premium).
* Red: Price is trading below the VWAP (Bearish discount).
* P85 Threshold Lines:
* These lines represent the 85th percentile of historical deviations . Historically, the price stays within these boundaries 85% of the time.
* Background Highlighting: When the histogram crosses the P85 line, the background glows, signaling a Statistical Exhaustion Zone where a retracement to the mean is highly probable.
---
5. How to Trade with AVWAP
* Mean Reversion: When the histogram reaches the P85 Zone , the price is "statistically overextended." This is a prime area to look for reversals or to take profits on existing trends.
* Trend Strength: If the histogram stays near the Zero Line while the price moves, the trend is supported by healthy volume.
* Value Area: The Zero Line represents the Fair Value . Buying near the Zero Line during a bullish histogram (Green) offers a high-probability entry with low risk.
---
6. Technical Parameters
* Asset Selection: A dropdown to switch between Crypto, Forex, and Indices.
* Color Customization: User-defined colors for bullish and bearish sentiment.
* Precision Control: 4-decimal precision for accurate tracking of thin-margin assets like Forex.

QT-1.2QT یک اندیکاتور چندلایه برای تحلیل ساختار زمانی/چرخهای بازار است که چند منطق کلیدی را بهصورت یکپارچه روی چارت نمایش میدهد:
باکسهای چرخهای (Cycle Boxes): تفکیک دقیق چرخهها در تایمفریمهای مختلف (سالانه، ماهانه، هفتگی، روزانه، 90 دقیقه و Micro) با استایل و رنگبندی قابل تنظیم، جهت درک سریع محدودههای زمانی و ساختار بازار.
SSMT (Smart/Structured SMT) چندلایه: شناسایی SMT بر اساس شکست سقف/کف کوارتر قبلی بین چند نماد (Symbol A/B و خود چارت) با سه سطح نمایش (Same / +1 / +2) و سه حالت خروجی (Trigger-only / Prev+Trigger / Line-only). منطق حذف/لغو سیگنالها و پاکسازی خودکار، برای جلوگیری از شلوغی و سیگنالهای منقضی طراحی شده است.
Negative-Correlation SSMT (اختیاری): پشتیبانی از نمایش SMT برای نمادهای همبستگی معکوس با نرمالسازی دادهها (Invert) تا منطق SMT دقیقاً مطابق نسخه اصلی، روی سری معکوس اجرا شود.
PSP Divergence Markers: نمایش اختلاف جهت کندلها بین نمادها (یا حالت Swing در PSP Mode) با مارکرهای سبک و قابل تنظیم، همراه با محدودیت تعداد مارکها برای کنترل منابع.
True Opens by Q2 (TMO/TWO/TDO/TSO/TMSO): ترسیم خطوط «True Open» برای Q2 چرخههای مختلف (ماهانه/هفتگی/روزانه/90m/Micro) با بهروزرسانی پیشرونده و اتصال دقیق به زمان داخل کندل از طریق داده 1 دقیقهای.
این ابزار برای تریدرهایی طراحی شده که به ساختار زمانی، رفتار بینمارکتی (Intermarket) و تایید/عدم تایید شکستها اهمیت میدهند و میخواهند تمام اجزا را در یک اسکریپت سبک و کنترلشده داشته باشند.
English (Description)
QT is a multi-layer, cycle-aware market structure indicator that consolidates several core logics into a single, clean overlay:
Cycle Boxes: Accurate time-cycle segmentation across multiple horizons (Yearly, Monthly, Weekly, Daily, 90m, and Micro) with configurable styling/colors to quickly contextualize price action inside its time structure.
Multi-layer SSMT (Structured SMT): Detects SMT by comparing current breaks vs. the previous quarter’s high/low across multiple symbols (Chart / Symbol A / Symbol B), with three display layers (Same / +1 / +2) and three output modes (Trigger-only / Prev+Trigger / Line-only). Built-in invalidation/cleanup logic helps reduce clutter and expired signals.
Optional Negative-Correlation SSMT: Supports inverse-correlation instruments via series normalization (inversion), allowing the same SSMT engine to run on the inverted series while preserving the original SSMT behavior and rules.
PSP Divergence Markers: Highlights candle-direction mismatches between symbols (or swing-based PSP mode) using lightweight, customizable markers and resource limits for performance control.
True Opens by Q2 (TMO/TWO/TDO/TSO/TMSO): Plots True Open levels for Q2 across cycles (Monthly/Weekly/Daily/90m/Micro), including progressive extensions and precise intra-bar timestamp attachment using 1-minute data when needed.
QT is built for traders who focus on time structure, intermarket confirmation/denial, and disciplined SMT-based signaling, while keeping everything unified, performant, and configurable.
