LA - Opening Price based Previous day Range PivotThis "LA - Opening Price based Previous day Range Pivot" indicator is a custom technical analysis tool designed for Trading View charts. It plots support and resistance levels (often referred to as pivots or ranges) based on the current opening price combined with the previous period's trading range. The "previous period" can be daily, weekly, or monthly, making it a multi-timeframe tool. These levels are projected using Fibonacci-inspired multipliers to create potential breakout or reversal zones.
The core idea is inspired by concepts like the Opening Range Breakout (ORB) strategy or Fibonacci pivots, but it's customized here to use a dynamic range calculation (the maximum of several absolute price differences) rather than a simple high-low range. This makes it more robust for volatile markets. Levels are symmetric above (resistance) and below (support) the opening price, helping traders identify potential entry/exit points, stop-losses, or targets. This will be useful when there is a gap-up/down as in Nifty/Sensex .
Purpose of the Indicator:
To visualize potential support/resistance zones for the current trading session based on the opening price and historical range data. This helps traders anticipate price movements, such as breakouts above resistance or bounces off support
Use Cases:
Intraday Trading: On lower timeframes (e.g., 5-min or 15-min charts), it shows daily levels for short-term trades.
Swing Trading: On higher timeframes (e.g., hourly or daily), it displays weekly/monthly levels for longer holds.
Range Identification: The filled bands highlight "zones" where price might consolidate or reverse.
Conditional Display: Levels only appear on appropriate timeframes (e.g., daily levels on intraday charts <60min), preventing clutter.
Theoretical Basis: It builds on pivot point theory, where the opening price acts as a central pivot. Multipliers (e.g., 0.618 for Fibonacci golden ratio) project levels, assuming price often respects these ratios due to market psychology.
How Calculations Work
Let's dive into the math with examples. Assume a stock with:
Current daily open (cdo) = $100
Previous daily high (pdh) = $105, low (pdl) = $95, close (pdc) = $102, close 2 days ago (pdc2) = $98
Step 1: Dynamic Range Calculation (var_d2):
This is the max of:
|pdh - pdc2| = |105 - 98| = 7
|pdl - pdc2| = |95 - 98| = 3
|pdh - pdl| = |105 - 95| = 10 (previous day range)
|pdh - cdo| = |105 - 100| = 5
|pdl - cdo| = |95 - 100| = 5
|pdc - cdo| = |102 - 100| = 2
|pdc2 - cdo| = |98 - 100| = 2
Max = 10 (so range = 10). This ensures the range accounts for gaps and extended moves, not just high-low.
Step 2: Level Projections:
Resistance (above open): Open + (Range * Multiplier)
dre6 = 100 + (10 * 1.5) = 115
dre5 = 100 + (10 * 1.27) ≈ 112.7
... down to dre0 = 100 + (10 * 0.1) = 101
dre50 = 100 + (10 * 0.5) = 105 (midpoint)
Support (below open): Open - (Range * Multiplier)
dsu0 = 100 - (10 * 0.1) = 99
... up to dsu6 = 100 - (10 * 1.5) = 85
Without Indicator
With Indicator
Pros and Cons
Pros:
Multi-Timeframe Flexibility: Seamlessly integrates daily, weekly, and monthly levels, useful for aligning short-term trades with longer trends (e.g., intraday breakout confirmed by weekly support).
Dynamic Range Calculation: Unlike standard pivots (just (H+L+C)/3), it uses max of multiple diffs, capturing gaps/volatility better—great for stocks with overnight moves.
Customizable via Inputs: Users can toggle levels, adjust multipliers, or change timeframes without editing code. Inline inputs keep the UI clean.
Visual Aids: Filled bands make zones obvious; conditional colors highlight "tight" vs. "wide" ranges (e.g., for volatility assessment).
Fibonacci Integration: Levels based on proven ratios, appealing to technical traders. Symmetric supports/resistances simplify strategy building (e.g., buy at support, sell at resistance).
No Repainting: Uses historical data with lookahead, so levels are fixed once calculated—reliable for back-testing.
Cons:
Chart Clutter: With all toggles on, 50+ plots/fills can overwhelm the chart, especially on mobile or small screens. Requires manual disabling.
Complexity for Beginners: Many inputs and calculations; without understanding fib ratios or range logic, it might confuse new users.
Performance Overhead: On low timeframes (e.g., 1-min), fetching higher TF data multiple times could lag, especially with many symbols or back-tests.
Assumes Volatility Persistence: Relies on previous range projecting future moves; in low-vol markets (e.g., sideways trends), levels may be irrelevant or too wide/narrow.
No Alerts or Signals: Purely visual; no built-in buy/sell alerts or crossover conditions—users must add separately.
Hardcoded Styles/Colors: Limited customization without code edits (e.g., can't change line styles via inputs).
Also, not optimized for non-stock assets (e.g., forex with 24/7 trading).
In summary, this is a versatile pivot tool for range-based trading based on Opening price, excelling in volatile markets but requiring some setup. If you're using it, start with defaults on a daily chart and toggle off unnecessary levels.
In den Scripts nach "weekly" suchen

Monday's Range Superpowerkyu🔔 Settings
You can customize the colors and toggle ON/OFF in the indicator settings.
Works on daily, hourly, and minute charts.
Easily visualize Monday’s high, low, and mid-line range.
📌 1. Support & Resistance with Monday’s Range
Monday High: Acts as the first resistance of the week.
◽ Example: If price breaks above Monday’s high after Tuesday, it signals potential bullish continuation → long setup.
Monday Low: Acts as the first support of the week.
◽ Example: If price breaks below Monday’s low, it signals bearish continuation → short setup.
📌 2. Mid-Line Trend Confirmation
Monday Mid-Line = average price of Monday.
Price above mid-line → bullish bias.
Price below mid-line → bearish bias.
Use mid-line breaks as entry confirmation for long/short positions.
📌 3. Breakout Strategy
Break of Monday’s High = bullish breakout → long entry.
Break of Monday’s Low = bearish breakout → short entry.
Place stop-loss inside Monday’s range for a conservative approach.
📌 4. False Breakout Strategy
If price breaks Monday’s high/low but then falls back inside Monday’s range, it is a False Breakout.
Strategy: Trade in the opposite direction.
◽ False Breakout at High → short.
◽ False Breakout at Low → long.
Stop-loss at the wick (extreme point) of the failed breakout.
📌 5. Range-Based Scalping
Use Monday’s high and low as a trading range.
Sell near Monday’s High, buy near Monday’s Low, repeat until breakout occurs.
📌 6. Weekly Volatility Forecast
Narrow Monday range → higher chance of strong trend later in the week.
Wide Monday range → lower volatility expected during the week.
📌 7. Pattern & Trend Analysis within Monday Range
Look for candlestick patterns around Monday’s High/Low/Mid-Line.
◽ Example: Double Top near Monday’s High = short setup.
◽ Repeated bounce at Mid-Line = strong long opportunity.
✅ Summary
The Monday’s Range (Superpowerkyu) Indicator helps traders:
Identify weekly support & resistance
Confirm trend direction with Mid-Line
Trade breakouts & false breakouts
Apply range scalping strategies
Forecast weekly volatility
⚡ Especially, the False Breakout strategy is powerful as it captures failed moves and sudden sentiment reversals.

NDOG & NWOG - Liquidity + Sunday Box rroielDescription:
This script combines NDOG & NWOG liquidity levels with a Sunday Box framework to provide traders with structured levels for weekly bias, liquidity mapping, and potential entry/exit zones.
Features:
• Automatic plotting of NDOG & NWOG liquidity zones.
• Sunday Box (weekly open range) drawn to define structure and bias.
• Highlights liquidity sweeps and retests for trade confirmation.
• Configurable settings for box time, liquidity range, and display options.
• Built to support ROI/EL strategies by aligning liquidity with weekly key levels.
Use Case:
Helps traders identify where price is likely to react by combining liquidity-based zones with the Sunday box framework. Designed for clarity, confluence, and efficiency in execution.

Futures Key LevelsKey Levels — Sessions, Previous Ranges & Opens (Chicago-aligned sessions)
What it does
This indicator plots commonly used reference levels across multiple timeframes to help you frame the day and find confluence:
Sessions (Chicago TZ): London, New York, and Asia session high/low ranges.
Previous Period Ranges: Previous Day / Week / Month / Quarter / Year High/Low and optional Mid.
Opens: Current Daily / Weekly / Monthly / Quarterly / Yearly opens.
Intraday (4H): Previous 4-Hour High/Low + optional Mid.
Monday Range: Captures Monday’s High/Low (and optional Mid) to use as a weekly reference.
Price-scale markers: Optional markers that track key levels on the price scale without adding extra lines.
How it works (concepts & calculations)
Higher-timeframe values are retrieved using request.security() and update when a new period begins (e.g., previous day’s H/L become fixed at the start of the new day).
Session ranges are built from bar data within session windows using time(session, "America/Chicago"):
London: 02:00–05:00 CT
New York: 08:30–15:00 CT
Asia: 20:00–00:00 CT
“Mid” levels are simple midpoints between each period’s High and Low.
Merge Levels: when different levels land at the same price, their labels are merged to reduce clutter (e.g., “PDH / PWH”).
Why this version is useful / original bits
All-white baseline for clean charts; session colors stand out by design: London = Yellow, New York = Aquatic Blue, Asia = Red.
Right-anchored mode lets you park levels to the right side of the chart with a configurable anchor distance.
Label merging keeps the display minimal when multiple levels coincide.
Price-scale-only markers available when you prefer fewer lines on the chart.
Inputs & customization
Display Style: Standard or Right Anchored (+ distance controls).
Levels toggles: enable/disable each period (Daily/Weekly/Monthly/Quarterly/Yearly), Monday range, 4H range, and session ranges.
Text: optional shorthand labels (e.g., PDH/PDL, PWH/PWL).
Colors: global white theme, with session highlights; you can override in the Inputs.
Price-scale markers: on/off toggle.
How to use it
Use previous High/Low as liquidity pools and areas to watch for sweeps, breaks, or retests.
The Monday range often frames the rest of the week; breaks or rejections around Monday H/L can be informative.
The 4H previous range gives intraday context—great for mean-reversion vs. continuation reads.
Session ranges help you see where the active session expanded price and where liquidity may remain.
Notes & limitations
Sessions are computed in America/Chicago; higher-TF levels use the symbol’s exchange timezone.
This is an indicator, not a strategy; it does not place trades or claim performance.
Always combine levels with your own execution rules (structure, momentum, risk).
Credit: inspired by spacemanBTC; this version adds the all-white styling, Chicago-aligned sessions, right-anchoring, label merging, and price-scale markers.
Also my mentor to tell me about the levels
Disclaimer
This tool is for educational purposes only and is not financial advice. Markets involve risk; do your own research and manage risk appropriately.

Persistence# Persistence
## What it does
Measures **price change persistence**, defined as the percentage of bars within a lookback window that closed higher than the prior close. A high value means the instrument has been closing up frequently, which can indicate durable momentum. This mirrors Stockbee’s idea: *select stocks with high price change persistence*, and then combine **momentum plus persistence**.
## Can be used for scanning in PineScreener
## Calculation
* `isUp` is true when `close > close `.
* `countUp` counts true instances over the last `len` bars.
* `pctUp = 100 * countUp / len`, bounded between 0 and 100.
* A 50% level is a natural baseline. Above 50% suggests more up closes than down closes in the window.
## Inputs
* **Lookback bars (`len`)**: default 252 for roughly one trading year on a daily chart. On weekly charts use something like 52, on monthly charts use 12.
## How to use
1. **Screen for persistence**
Sort a watchlist by the plotted value, higher is better. Many momentum traders start looking above 58 to 65 percent, then layer a trend filter.
2. **Combine with momentum**
Examples, pick tickers with:
* `pctUp > 60`, and price above a rising EMA50 or EMA100.
* `pctUp rising` and weekly ROC positive.
3. **Switch timeframe to change the horizon**
* Daily chart with `len = 252` approximates one year.
* Weekly chart with `len = 52` approximates one year.
* Monthly chart with `len = 12` approximates one year.
## TC2000 equivalence
Stockbee’s TC2000 expression:
```
CountTrue(c > c1, 252)
```
## Interpretation guide
* **70 to 90**: very strong persistence; often trend leaders, check for extensions and risk controls.
* **60 to 70**: constructive persistence; good hunting ground for swing setups that also pass momentum filters.
* **50**: neutral baseline; around random up vs down frequency.
* **Below 50**: persistent weakness; consider only for mean reversion or short strategies.
## Practical tips
* **Event effects**: ex-dividend gaps can reduce persistence on high yield names. Earnings gaps can swing the value sharply.
* **Survivorship bias**: when backtesting on curated lists, persistence can look cleaner than in live scans.
* **Liquidity**: thin names may show noisy persistence due to erratic prints.
## Reference to Stockbee
* “One way to select stocks for swing trading is to find those with high price change persistence.”
* “Persistence can be calculated on a daily, monthly, or weekly timeframe.”
* TC2000 function: `CountTrue(c > c1, 252)`
* Example noted in the tweet: CVNA had very high one-year price persistence at the time of that post.
* Takeaway: **look for momentum plus persistence**, not persistence alone.

Fibonacci Sequence Circles [BigBeluga]🔵 Overview
The Fibonacci Sequence Circles is a unique and visually intuitive indicator designed for the TradingView platform. It combines the principles of the Fibonacci sequence with geometric circles to help traders identify potential support and resistance levels, as well as price expansion zones. The indicator dynamically anchors to key price points, such as pivot highs, pivot lows, or timeframe changes (daily, weekly, monthly), and generates Fibonacci-based circles around these anchor points.
⚠️For proper indicators visualization use simple not logarithmic chart
🔵 Key Features
Customizable Anchor Points : The indicator can be anchored to Pivot Highs , Pivot Lows , or timeframe changes ( Daily, Weekly, Monthly ), making it adaptable to various trading strategies.
Fibonacci Sequence Logic : The circles are generated using the Fibonacci sequence, where the diameter of each circle is the sum of the diameters of the two preceding circles.
first = start_val
secon = start_val + int(start_val/2)
three = first + secon
four = secon + three
five = three + four
six = four + five
seven = five + six
eight = six + seven
nine = seven + eight
ten = eight + nine
Adjustable Start Value : Traders can modify the starting value of the sequence to scale the circles larger or smaller, ensuring they fit the current price action.
Color Customization : Each circle can be individually enabled or disabled, and its color can be customized for better visual clarity.
Visual Labels : The diameter of each circle (in bars) is displayed next to the circle, providing additional context for analysis.
🔵 Usage
Step 1: Set the Anchor Point - Choose the anchor type ( Pivot High, Pivot Low, Daily, Weekly, Monthly ) to define the center of the Fibonacci circles.
Step 2: Adjust the Start Value - Modify the starting value of the Fibonacci sequence to scale the circles according to the price action.
Step 3: Customize Circle Colors - Enable or disable specific circles and adjust their colors for better visualization.
Step 4: Analyze Price Action - Use the circles to identify potential support/resistance levels, price expansion zones, or trend continuation areas.
Step 5: Combine with Other Tools - Enhance your analysis by combining the indicator with other technical tools like trendlines, moving averages, or volume indicators.
The Fibonacci Sequence Circles is a powerful and flexible tool for traders who rely on Fibonacci principles and geometric patterns. Its ability to anchor to key price points and dynamically scale based on market conditions makes it suitable for various trading styles and timeframes. Whether you're a day trader or a long-term investor, this indicator can help you visualize and anticipate price movements with greater precision.

Androlog DailyWeeklyMonthlyAndrologLevel — Daily / Weekly / Monthly Levels
This indicator visualizes the Daily, Weekly, and Monthly key levels introduced by Daniel. It’s intentionally minimal and fast, focused on clean higher‑timeframe references for intraday and daily trading.
What it shows:
Daily open and prior‑day high/low
Weekly and Monthly “open”-based levels
Optional labels for quick price readouts
Controls
Show only new levels or keep/extend old ones
Choose whether levels extend to the right
Alerts
Optional alert conditions for level touches (per your settings)
Uses confirmed higher‑timeframe bars; no historical repaint
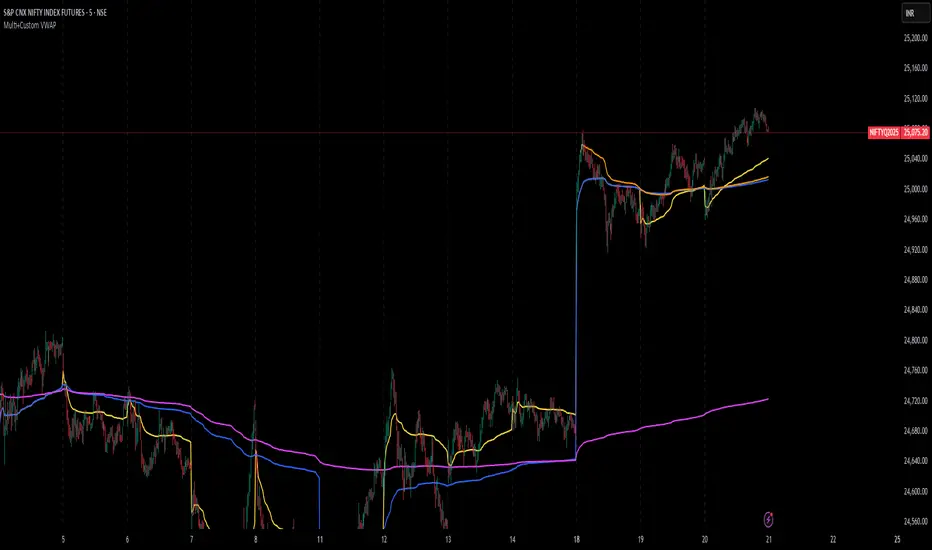
Multi+Custom VWAPMulti-VWAP (Session, Weekly, Monthly, Custom)
Description:
This script plots multiple VWAP (Volume Weighted Average Price) levels on the chart, giving traders a broader perspective of price action across different time horizons.
Features:
Session VWAP → Resets at the start of each trading session.
Weekly VWAP → Resets every Monday.
Monthly VWAP → Resets at the start of each new month.
Custom VWAP → User can specify a custom start date and time, and the script will calculate VWAP from that moment until the current bar.
Use Cases:
Compare intraday (session) VWAP with higher-timeframe VWAPs (weekly & monthly) to spot confluence levels.
Track how price interacts with institutional benchmarks.
Use custom VWAP to anchor from specific events (earnings, news releases, breakouts, etc.).
Notes:
Works on any timeframe and instrument that has volume data.
Designed to be clean and minimal with adjustable colors and line styles.
Useful for day traders, swing traders, and long-term investors who monitor VWAP across multiple time horizons.
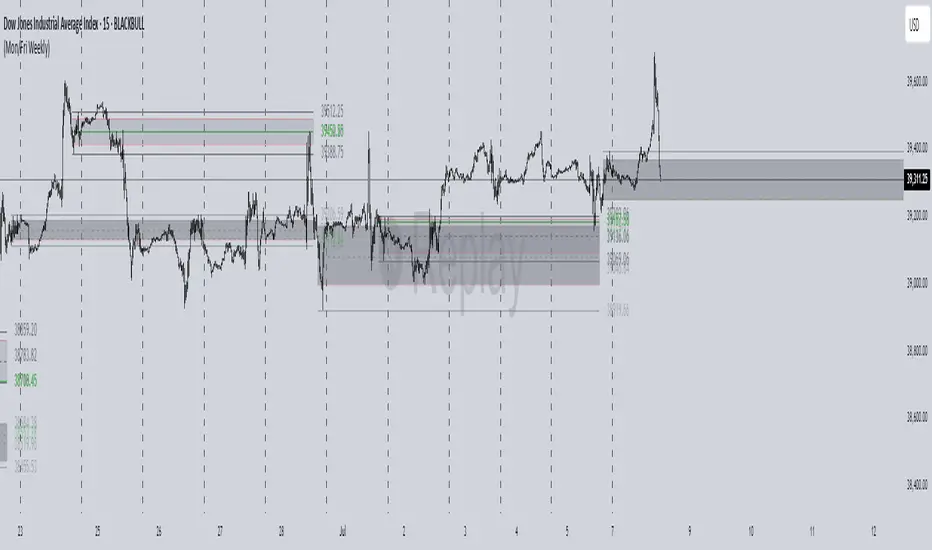
Cheat CodeWhy Monday & Friday
Monday evening (NY): frequently seeds the weekly expansion. Its DR/IDR often acts as a weekly “starter envelope,” useful for breakout continuation or fade back into the box plays as liquidity builds.
Friday evening (NY): often exposes end-of-week traps (run on stops into the close) and sets expectation boundaries into the following week. Carry these levels forward to catch Monday’s reaction to Friday’s closing structure.
Typical use-cases
Breakout & retest:
Price closes outside the Monday DR/IDR → look for retests of the band edge for continuation.
Liquidity sweep (“trap”) recognition:
Friday session wicks briefly beyond Friday DR/IDR then closes back inside → watch for mean reversion early next week.
Bias filter:
Above both Monday DR midline and Friday DR midline → bias long until proven otherwise; the inverse for shorts.
Session open confluence:
Reactions at the open line frequently mark decision points for momentum vs. fade setups.
(This is a levels framework, not a signals engine. Combine with your execution model: orderflow, S/R, session timing, or higher-TF bias.)
Inputs & styling (quick reference)
Display toggles (per day):
Show DR / IDR / Middle DR / Middle IDR
Show Opening Line
Show DR/IDR Box (choose DR or IDR as box source)
Show Price Labels
Style controls (per day):
Line width (1–4), style (Solid/Dashed/Dotted)
Independent colors for DR, IDR, midlines, open line
Box background opacity
Timezone:
Default America/New_York (changeable).
Optional on-chart warning if your chart TZ differs.
Practical notes
Works on intraday charts; levels are anchored using weekly timestamps for accuracy on any symbol.
Live updating: During the Mon/Fri calc windows, DR/IDR highs/lows and midlines keep updating until the session ends.
Clean drawings: Lines, box, and labels are created once per session and then extended/updated—efficient on resources even with long display windows.
Max elements: Script reserves ample line/box/label capacity for stability across weeks.
Advanced VWAP CalendarThe Advanced VWAP Calendar is a designed to plot Volume Weighted Average Price (VWAP) lines anchored to user-defined and preset time periods, including weekly, monthly, quarterly, and custom anchors. As of August 15, 2025, this indicator provides traders with a robust tool for analyzing price trends relative to volume-weighted averages, with clear labeling and extensive customization options. Below is a summary of its key features and functionality, with technical details and code references updated to focus on user-facing behavior and presentation, while preserving all other aspects of the original summary.
Key Features
Multiple Time Period VWAPs:
Weekly VWAPs: Supports up to five VWAPs for a user-selected month and year, starting at midnight each Monday (e.g., W1 Aug 2025, W2 Aug 2025). Enabled via a single toggle, with anchors automatically set to the first Monday of the chosen month.
Monthly VWAPs: Plots VWAPs for all 12 months of a selected year (e.g., Jan 2025, Feb 2025) or a single user-specified month/year. Labels use month abbreviations (e.g., "Aug 2025").
Quarterly VWAPs: Covers four quarters of a selected year (e.g., Q1 2025, Q2 2025), with options to enable all quarters or individual ones (Q1–Q4).
Legacy VWAPs: Provides monthly and quarterly VWAPs for a user-selected legacy year (e.g., 2024), labeled with a "Legacy" prefix (e.g., "Legacy Jan 2024," "Legacy Q1 2024"), with similar enablement options.
Custom VWAPs: Includes 10 fully customizable VWAPs, each with user-defined anchor times, labels (e.g., "Q1 2025"), colors, line widths (1–5), text colors, bubble styles, text sizes (8–40), and background options.
Clear and Dynamic Labeling:
Labels appear to the right of the chart, showing the VWAP value (e.g., "Q1 2025 123.45").
Weekly labels follow a "W# Month Year" format (e.g., "W1 Aug 2025").
Monthly labels use abbreviated months (e.g., "Aug 2025"), while quarterly labels use "Q# Year" (e.g., "Q3 2025").
Legacy labels include a "Legacy" prefix (e.g., "Legacy Q1 2024").
Labels support customizable text sizes (tiny to huge) and can be displayed with or without a background, with optional bubble styles.
Flexible Customization:
Each VWAP can be enabled or disabled independently, with user inputs for anchor times, labels, and visual properties.
Colors are predefined for weekly (red, orange, blue, green, purple), monthly (varied), quarterly (red, blue, green, yellow), and legacy VWAPs, but custom VWAPs allow any color selection.
Line widths and text sizes are adjustable, ensuring visual clarity and chart readability.
This indicator was a dual effort, code was heavily contributed in effort by AzDxB, major credit and THANKS goes to him www.tradingview.com
FVG + Bank Level Targeting w/ Alert TriggerDescription:
FVG + Bank Level Targeting w/ Alert Trigger is an intraday trading tool that combines Fair Value Gap (FVG) detection with dynamic institutional targeting using prior-day, weekly, and monthly high/low "Bank Levels." When a Fair Value Gap is detected, the script projects a logical target using the closest bank level in price's direction, and visually extends that level on your chart.
This tool is designed to help traders anticipate where price is most likely to move after an FVG appears — and alert them when price breaks through key target zones.
How It Works:
* Bank Level Calculation:
The indicator calculates Daily, Weekly, and Monthly high and low levels from the previous bar of each respective timeframe.
These are optionally plotted on the chart with a slight tick offset to avoid overlap with price.
* FVG Detection:
Bullish FVGs are defined by a gap between the low of the current candle and the high two candles prior, with a confirming middle candle.
Bearish FVGs follow the reverse pattern.
Once detected, the script finds the nearest unbroken institutional level (Bank Level) in the direction of the FVG and anchors a target line at that price level.
* Target Line Projection:
The script draws a persistent horizontal line (not just a plotted value) at the selected bank level.
These lines automatically extend a set number of bars into the future for clarity and trade planning.
* Breakout Detection:
When price crosses above a Bull Target or below a Bear Target, the script triggers a breakout condition.
These breakouts are useful for trade continuation or reversal setups.
* Alerts:
Built-in alert conditions notify you in real time when price crosses above or below a target.
These can be used to set TradingView alerts for your preferred Futures symbols or intraday pairs.
Parameters:
Tick Offset Multiplier: Adds distance between price and plotted levels.
Show Daily/Weekly/Monthly Levels: Toggle for each institutional level group.
FVG Extend Right (bars): Controls how far the target lines extend into the future.
Color Controls: Customize colors for FVG fill and target lines.
Use Case:
This indicator is designed for traders who want to:
Trade continuation or reversal moves around institutional price zones
Integrate Fair Value Gap concepts with more logical, historically anchored price targets
Trigger alerts when market structure evolves around key levels
It is especially useful for intraday Futures traders on the 15-minute chart or lower, but adapts well to any instrument with strong reactionary behavior at prior session highs/lows.

Linh Index Trend & Exhaustion SuitePurpose: One overlay to judge trend, reversal risk, overextension, and volatility squeezes on indexes (built for VNINDEX/VN30, works on any symbol & timeframe).
What it shows
Trend state: Bull / Bear / Transition via 20/50/200 EMAs + slope check.
Overextension heatmap: Background paints when price is stretched vs the 20-EMA by ATR or % (you set the thresholds).
Squeeze detection:
Squeeze ON (yellow dot): Bollinger Bands (20,2) inside Keltner Channels (20,1.5).
Squeeze OFF + Release: White dot; script confirms direction only when close > BB upper (up) or close < BB lower (down).
52-week context: Distance to 52-week high/low (%).
Higher-TF alignment: Optional weekly trend reading shown on the label while you’re on the daily.
Anchored VWAP(s): Two optional AVWAPs from dates you choose (e.g., YTD open, last big gap/earnings).
Plots & labels
EMAs 20/50/200 (toggle on/off).
Optional BB & KC bands for diagnostics.
AVWAP #1 / #2 (optional).
Status label with: Trend, EMAs, Dist to 20-EMA (%, ATR), 52-week distances, HTF state.
Built-in alerts (set “Once per bar close”)
EMA10 ↔ EMA20 cross (early momentum shift)
EMA20 ↔ EMA50 cross (trend confirmation/negation)
Price ↔ EMA200 cross (long-term regime)
Squeeze Release UP / DOWN (BB breakout after squeeze)
Overextension Cool-off UP / DN (stretched vs 20-EMA + momentum rolling)
Near 52-week High (within your % threshold)
How to use (playbook)
Map regime: Prefer trades when Daily = Bull and HTF (Weekly) = Bull (shown on label).
Hunt expansion: Yellow → White dot and close beyond BB = fresh move.
Avoid chasing stretch: If background is painted (overextended vs 20-EMA), wait for a pullback or intraday base.
Locations matter: 52-week proximity + HTF Bull improves breakout quality.
Anchors: Add AVWAP from YTD open or last major gap to frame support/resistance.
Suggested settings
Overextension: ATR = 2.0, % = 4.0 to start; tune per index volatility.
Squeeze bands: BB(20,2) & KC(20,1.5) default are balanced; tighten KC (1.3) for more signals, widen (1.8) for fewer/higher quality.
Timeframes: Daily for signals, Weekly for bias. Optional 65-min for entries.

Global Bond Yields Monitor [MarktQuant]Global Bond Yields Monitor
The Global Bond Yields Monitor is designed to help users track and compare government bond yields across major economies. It provides an at-a-glance view of short- and long-term interest rates for multiple countries, enabling users to observe shifts in global fixed-income markets.
Key Features:
Multi-Country Coverage: Includes major advanced and emerging economies such as the United States, China, Japan, Germany, United Kingdom, Canada, Australia, and more.
Multiple Maturities: Displays yields for the 2-year, 5-year, 10-year, and 30-year maturities (20-year for Russia).
Dynamic Yield Data: Plots real-time yields for the selected country directly from TradingView’s data sources.
Weekly Change Tracking: Calculates and displays the yield change from one week ago ( ) for each maturity.
Table Visualization: Option to display a compact data table showing current yields and weekly changes, color-coded for easier interpretation.
Visual Yield Curve Comparison: Plots yield lines for short- and long-term maturities, with shaded areas between curves for visual clarity.
Customizable Display: Choose table placement and whether to show or hide the weekly change table.
Use Cases
This script is intended for analysts, traders, and investors who want to monitor shifts in sovereign bond markets. Changes in yields can reflect adjustments in monetary policy expectations, inflation outlook, or broader macroeconomic trends.
❗Important Note❗
This indicator is for market monitoring and educational purposes only. It does not generate trading signals, and it should not be interpreted as financial advice. All data is sourced from TradingView’s available market feeds, and accuracy may depend on the source data.

cd_HTF_bias_CxOverview:
No matter our trading style or model, to increase our success rate, we must move in the direction of the trend and align with the Higher Time Frame (HTF). Trading "gurus" call this the HTF bias. While we small fish tend to swim in all directions, the smart way is to flow with the big wave and the current. This indicator is designed to help us anticipate that major wave.
________________________________________
Details and Usage:
This indicator observes HTF price action across preferably seven different pairs, following specific rules. It confirms potential directional moves using CISD levels on a Medium Time Frame (MTF). In short, it forecasts the likely direction (HTF bias). The user can then search for trade opportunities aligned with this bias on a Lower Time Frame (LTF), using their preferred pair, entry model, and style.
________________________________________
Timeframe Alignment:
The commonly accepted LTF/MTF/HTF combinations include:
• 1m – 15m – H4
• 3m – H1 – Daily / 3m – 30m – Daily
• 5m – H1 – Daily
• 15m – H4 – Weekly
• H1 – Daily – Monthly
• H4 – Weekly – Quarterly
Example: If you're trading with a 3m model on a 30m/3m setup, you should seek trades in the direction of the H1/Daily bias.
________________________________________
How It Works:
The indicator first looks for sweeps on the selected HTF — when any of the last four candles are swept, the first condition is met.
The second step is confirmation with a CISD close on the MTF — once a candle closes above/below the CISD level, the second condition is fulfilled. This suggests the price has made its directional decision.
Example: If a previous HTF candle is swept and we receive a bearish CISD confirmation on H1, the HTF bias becomes bearish.
After this, you may switch to a more granular setup like HTF: 30m and MTF: 3m to look for trade entries aligned with the bias (e.g., 30m sweep + 3m CISD).
________________________________________
How Is Bias Determined?
• HTF Sweep + MTF CISD = SC (Sweep & CISD)
• Latest Bullish SC → Bias: Bullish
• Latest Bearish SC → Bias: Bearish
• Price closes above the last Bearish SC → Bias: Strong Bullish
• Price closes below the last Bullish SC → Bias: Strong Bearish
• Strong Bullish bias + Bearish CISD (without HTF sweep) → Bias: Bullish
• Strong Bearish bias + Bullish CISD (without HTF sweep) → Bias: Bearish
• Bearish price violates SC high, but Bullish SC is untouched → Bias: Bullish
• Bullish price violates SC low, but Bearish SC is untouched → Bias: Bearish
• If neither side generates SC → Bias: No Bias
The logic is built on the idea that a price overcoming resistance is stronger, and encountering resistance is weaker. This model is based on the well-known “Daily Bias” structure, but with personal refinements.
________________________________________
What’s on the Screen?
• Classic HTF zones (boxes)
• Potential MTF CISD levels
• Confirmed MTF lines
• Sweep zones when HTF sweeps occur
• Result table showing current bias status
________________________________________
Usage:
• Select HTF and MTF timeframes aligned with your trading timeframe.
• Adjust color and position settings as needed.
• Enter up to seven pairs to track via the menu.
• Use the checkbox next to each pair to enable/disable them.
• If “Ignore these assets” is checked, all pairs will be disabled, and only the currently open chart pair will be tracked.
________________________________________
Alerts:
You can choose alerts for Bullish, Bearish, Strong Bullish, or Strong Bearish conditions.
There are two types of alert sources:
1. From the indicator’s internal list
2. From TradingView’s watchlist
Visual example:
________________________________________
How I Use It:
• For spot trades, I use HTF: Weekly and MTF: H4 and look for Bullish or Strong Bullish pairs.
• For scalping, I follow bias from HTF: Daily and MTF: H1.
Example: If the indicator shows a Bearish HTF Bias, I switch to HTF: 30m and MTF: 3m and enter trades once bearish conditions are met (timeframe alignment).
________________________________________
Important Notes:
• The indicator defines CISD levels only at HTF high and low levels.
• If your chart is on a higher timeframe than your selected HTF/MTF, no data will appear.
Example: If HTF = H1 and MTF = 5m, opening a chart on H4 will result in a blank screen.
• The drawn CISD level on screen is the MTF CISD level.
• Not every alert should be traded. Always confirm with personal experience and visual validation.
• Receiving multiple Strong Bullish/Bearish alerts is intentional. (Trick 😊)
• Please share your feedback and suggestions!
________________________________________
And Most Importantly:
Don't leave street animals without water and food!
Happy trading!

Portfolio Tracker ARJO (V-01)Portfolio Tracker ARJO (V-01)
This indicator is a user-friendly portfolio tracking tool designed for TradingView charts. It overlays a customizable table on your chart to monitor up to 15 stocks or symbols in your portfolio. It calculates real-time metrics like current market price (CMP), gains/losses, and stoploss breaches, helping you stay on top of your investments without switching between multiple charts. The table uses color-coding for quick visual insights: green for profits, red for losses, and highlights breached stoplosses in red for alerts. It also shows portfolio-wide totals for overall performance.
Key Features
Supports up to 15 Symbols: Enter stock tickers (e.g., NSE:RELIANCE or BSE:TCS) with details like buy price, date, units, and stoploss.
Symbol: The stock ticker and description.
Buy Date: When you purchased it.
Units: Number of shares/units held.
Buy Price: Your entry price.
Stop Loss: Your set stoploss level (highlighted in red if breached by CMP).
CMP: Current market price (fetched from the chart's timeframe).
% Gain/Loss: Percentage change from buy price (color-coded: green for positive, red for negative).
Gain/Loss: Total monetary gain/loss based on units.
Optional Timeframe Columns: Toggle to show % change over 1 Week (1W), 1 Month (1M), 3 Months (3M), and 6 Months (6M) for historical performance.
Portfolio Summary: At the top of the table, see total % gain/loss and absolute gain/loss for your entire portfolio.
Visual Customizations: Adjust table position (e.g., Top Right), size, colors for positive/negative values, and intensity cutoff for gradients.
Benchmark Index-Based Header: The title row's background color reflects NIFTY's weekly trend (green if above 10-week SMA, red if below) for market context.
Benchmark Index-Based Header: The title row's background color reflects NIFTY's weekly trend (green if above 10-week SMA, red if below) for market context.
How to Use It: Step-by-Step Guide
Add the Indicator to Your Chart: Search for "Portfolio Tracker ARJO (V-01)" in TradingView's indicator library and add it to any chart (preferably Daily timeframe for accuracy).
Input Your Portfolio Symbols:
Open the indicator settings (gear icon).
In the "Symbol 1" to "Symbol 15" groups, fill in:
Symbol: Enter the ticker (e.g., NSE:INFY).
Year/Month/Day: Select your buy date (e.g., 2024-07-01).
Buy Price: Your purchase price per unit.
Stoploss: Your exit price if things go south.
Units: How many shares you own.
Only fill what you need—leave extras blank. The table auto-adjusts to show only entered symbols.
Customize the Table (Optional):
In "Table settings":
Choose position (e.g., Top Right) and size (% of chart).
Toggle "Show Timeframe Columns" to add 1W/1M/3M/6M performance.
In "Color settings":
Pick colors for positive (green) and negative (red) cells.
Set "Color intensity cutoff (%)" to control how strong the colors get (e.g., 10% means changes above 10% max out the color).
Interpret the Table on Your Chart:
The table appears overlaid—scan rows for each symbol's stats.
Look at colors: Greener = better gains; redder = bigger losses.
Check CMP cell: Red means stoploss breached—consider selling!
Portfolio Gain/Loss at the top gives a quick overall health check.
For Best Results:
Use on a Daily chart to avoid CMP errors (the script will warn if on Weekly/Monthly).
Refresh the chart or wait for a new bar if data doesn't update immediately.
For Indian stocks, prefix with NSE: or BSE: (e.g., BSE:RELIANCE).
This is for tracking only—not trading signals. Combine with your strategy.
If no symbols show, ensure inputs are valid (e.g., buy price > 0, valid date).
Finally, this tool makes it quite easy for beginners to track their portfolios, while also giving advanced traders powerful and customizable insights. I'd love to hear your feedback—happy trading!

Super MTF Clouds (4x3 Pairs)Overview:
This script is based on Ripster's MTF clouds, which transcends the standard moving average cloud indicator by offering a powerful and deeply customizable Multi-Timeframe (MTF) analysis. Instead of being limited to the moving averages of your current charts from the current timeframe, this tool allows you to project and visualize the trend and key support/resistance zones from up to 4 different timeframes simultaneously. User can input up to 6 different EMA values which will form 3 pairs of EMA clouds, for each of the timeframes.
The primary purpose is to provide traders with immediate confluence. By observing how price interacts with moving average clouds from higher timeframes (e.g., Hourly, Daily, Weekly), you can make more informed decisions on your active trading timeframe (e.g., 10 Minute). It's designed as a complete MTF Cloud toolkit, allowing you to display all necessary MTFs in a single script to build a comprehensive view of the market structure without having to flick to different timeframe to look for cloud positions.
Key features:
Four Independent Multi-Timeframe Slots: Each slot can be assigned any timeframe available on TradingView (e.g., D, W, M, 4H).
Three MA Pairs Per Timeframe: For each timeframe, configure up to three separate MA clouds (e.g., a 9/12 EMA pair, a 20/50 EMA pair, and a 100/200 SMA pair).
Complete Customisation: For every single moving average (24 in total), you can independently control:
MA Type: Choose between EMA or SMA.
Length: Any period you require.
Line Color: Full colour selection.
Line Thickness: Adjust the visual weight of each line.
Cloud Control: For every pair (12 in total), you can set the fill colour and transparency.
How To Use This Script:
This tool is best used for confirmation and context. Here are some practical strategies that one can adopt:
Trend Confluence: Before taking a trade based on a signal on your current timeframe, glance at the higher timeframe clouds. If you see a buy signal on the 15-minute chart and the price is currently trading above a thick, bullish Daily cloud, the probability of that trade succeeding is significantly higher. Conversely, shorting into strong HTF support is a low-probability trade.
Dynamic Support & Resistance: The edges of the higher timeframe clouds often act as powerful, dynamic levels of support and resistance. A pullback to the 4-Hour 50 EMA on your 15-minute chart can be a prime area to look for entries in the direction of the larger trend.
Gauging Market Regimes: Use the toggles in the settings to quickly switch between different views. You can have a "risk-on" view with short-term clouds and a "macro" view with weekly and monthly clouds. This helps you adapt your trading style to the current market conditions.
Key Settings:
1. Global Setting
Source For All MAs: This determines the price data point used for every single moving average calculation.
Default: hl2 (an average of the High and Low of each bar). This gives a smooth midpoint price.
Options: You can change this to Close (the most common method), Open, High, Low, or ohlc4 (an average of the open, high, low, and close), among others.
Recommendation: For most standard trend analysis, the default hl2 is the common choice.
2. The Timeframe Group Structure
The rest of the settings are organized into four identical, collapsible groups: "Timeframe 1 Settings" through "Timeframe 4 Settings". Each group acts as a self-contained control panel for one multi-timeframe view.
Within each timeframe group, you have two master controls:
Enable Timeframe: This is the main power switch for the entire group. Uncheck this box to instantly hide all three clouds and lines associated with this timeframe. This is perfect for quickly decluttering your chart or focusing on a different set of analyses.
Timeframe: This dropdown menu is the heart of the MTF feature. Here, you select the higher timeframe you want to analyse (e.g., 1D for Daily, 1W for Weekly, 4H for 4-Hour). All calculations for the three pairs within this group will be based on the timeframe you select here.
3. Pair-Specific Controls
Inside each timeframe group, there are three sections for "Pair 1", "Pair 2", and "Pair 3". These control each individual moving average cloud.
Enable Pair: Just like the master switch for the timeframe, this checkbox turns a single cloud and its two MA lines on or off.
For each pair, the settings are further broken down:
Moving Average Lines (A and B): These two rows control the two moving averages that form the cloud. 'A' is typically used for the shorter-period MA and 'B' for the longer-period one.
Type (A/B): A dropdown menu to select either EMA (Exponential Moving Average) or SMA (Simple Moving Average). EMAs react more quickly to recent price changes, while SMAs are smoother and react more slowly.
Length (A/B): The lookback period for the moving average (e.g., 21, 50, 200).
Color (A/B): Sets the specific colour of the MA line itself on your chart.
Cloud Fill Settings
Fill Color: This controls the colour of the shaded area (the "cloud") between the two moving average lines. For a consistent look, you can set this to the same colour as your shorter MA line.
Transparency: Controls how see-through the cloud is, on a scale of 0 to 100. 0 is a solid, opaque colour, while 100 is completely invisible. The default of 85 provides a light, "cloud-like" appearance that doesn't obscure the price action.
----------------------------------------------------------------------
If anything is not clear please let me know!

Luma DCA Simulator (BTC only)Luma DCA Simulator – Guide
What is the Luma DCA Simulator?
The Luma DCA Tracker shows how regular Bitcoin investments (Dollar Cost Averaging) would have developed over a freely selectable period – directly in the chart, transparent and easy to follow.
Settings Overview
1. Investment amount per interval
Specifies how much capital is invested at each purchase (e.g. 100).
2. Start date
Defines the point in time from which the simulation begins – e.g. 01.01.2020.
3. Investment interval
Determines how frequently investments are made:
– Daily
– Weekly
– Every 14 days
– Monthly
4. Language
Switches the info box display between English and German.
5. Show investment data (optional)
If activated, the chart will display additional values such as total invested capital, BTC amount, current value, and profit/loss.
What the Chart Displays
Entry points: Each DCA purchase is marked as a point in the price chart.
Average entry price: An orange line visualizes the evolving DCA average.
Info box (bottom left) with a live summary of:
– Total invested capital
– Total BTC acquired
– Average entry price
– Current portfolio value
– Profit/loss in absolute terms and percentage
Note on Accuracy
This simulation is for illustrative purposes only.
Spreads, slippage, fees, and tax effects are not included.
Actual results may vary.
Technical Note
For daily or weekly intervals, the chart timeframe should be set to 1 day or lower to ensure all purchases are accurately included.
Larger timeframes (e.g. weekly or monthly charts) may result in missed investments.
Currency Handling
All calculations are based on the selected chart symbol (e.g. BTCUSD, BTCEUR, BTCUSDT).
The displayed currency is automatically determined by the chart used.

TBL HTF Highs&LowsThis script plots the previous Daily, Weekly, and Monthly High and Low levels directly on your chart, helping you identify key higher-timeframe support and resistance zones.
Features:
Daily, Weekly, Monthly Lines: Toggle visibility for each timeframe's high/low levels.
Customization Options:
Choose color, style (Solid, Dashed, Dotted), width, and transparency for each line type.
Automatic Updates: Lines update at the start of each new session (day, week, or month).
Summary Table: Displays the latest Pre-Daily High/Low (PDH/PDL), Pre-Weekly High/Low (PWH/PWL), and Pre-Monthly High/Low (PMH/PML) in the top-right corner of the chart.
Configurable Table Font Size: Choose between Tiny, Small, Medium, or Large text.
Use Case:
Ideal for traders who rely on key higher-timeframe levels for confluence, breakout trading, or mean-reversion strategies. The visual lines and summary table provide instant context without cluttering your chart.

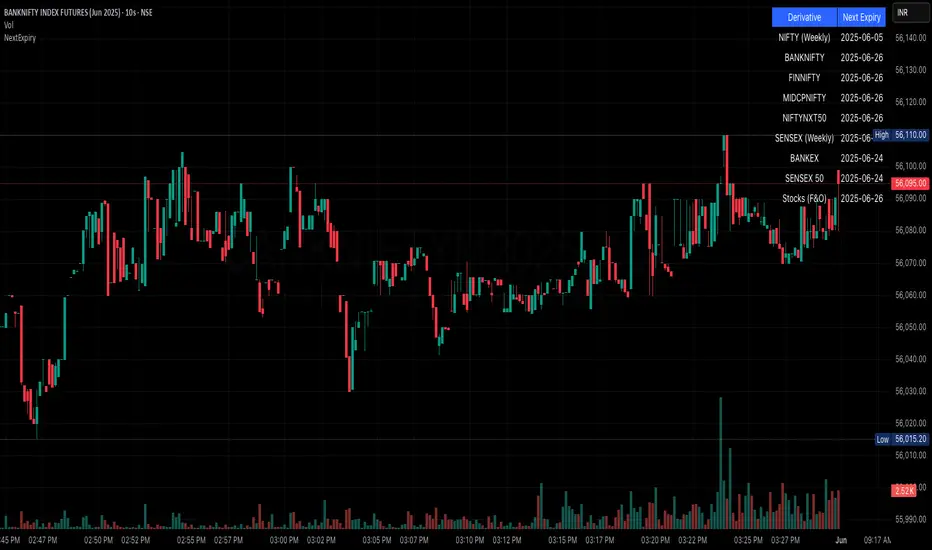
NSE/BSE Derivative - Next Expiry Date With HolidaysNSE & BSE Expiry Tracker with Holiday Adjustments
This Pine Script is a TradingView indicator that helps traders monitor upcoming expiry dates for major Indian derivative contracts. It dynamically adjusts these expiry dates based on weekends and holidays, and highlights any expiry that falls on the current day.
⸻
Key Features
1. Tracks Expiry Dates for Major Contracts
The script calculates and displays the next expiry dates for the following instruments:
• NIFTY (weekly expiry every Thursday)
• BANKNIFTY, FINNIFTY, MIDCPNIFTY, NIFTYNXT50 (monthly expiry on the last Thursday of the month)
• SENSEX (weekly expiry every Tuesday)
• BANKEX and SENSEX 50 (monthly expiry on the last Tuesday of the month)
• Stocks in the F&O segment (monthly expiry on the last Thursday)
2. Holiday Awareness
Users can input a list of holiday dates in the format YYYY-MM-DD,YYYY-MM-DD,.... If any calculated expiry falls on one of these holidays or a weekend, the script automatically adjusts the expiry to the previous working day (Monday to Friday).
3. Customization Options
The user can:
• Choose the position of the expiry table on the chart (e.g. top right, bottom left).
• Select the font size for the expiry table.
• Enable or disable the table entirely (if implemented as an input toggle).
4. Visual Expiry Highlighting
If today is an expiry day for any instrument, the script highlights that instrument in the display. This makes it easy to spot significant expiry days, which are often associated with increased volatility and trading volume.
⸻
How It Works
• The script calculates the next expiry for each index using built-in date/time functions.
• For weekly expiries, it finds the next occurrence of the designated weekday.
• For monthly expiries, it finds the last Thursday or Tuesday of the month.
• Each expiry date is passed through a check to adjust for holidays or weekends.
• If today matches the adjusted expiry date, that row is visually emphasized.
⸻
Use Case
This script is ideal for traders who want a quick glance at which instruments are expiring soon — especially those managing options, futures, or expiry-based strategies.
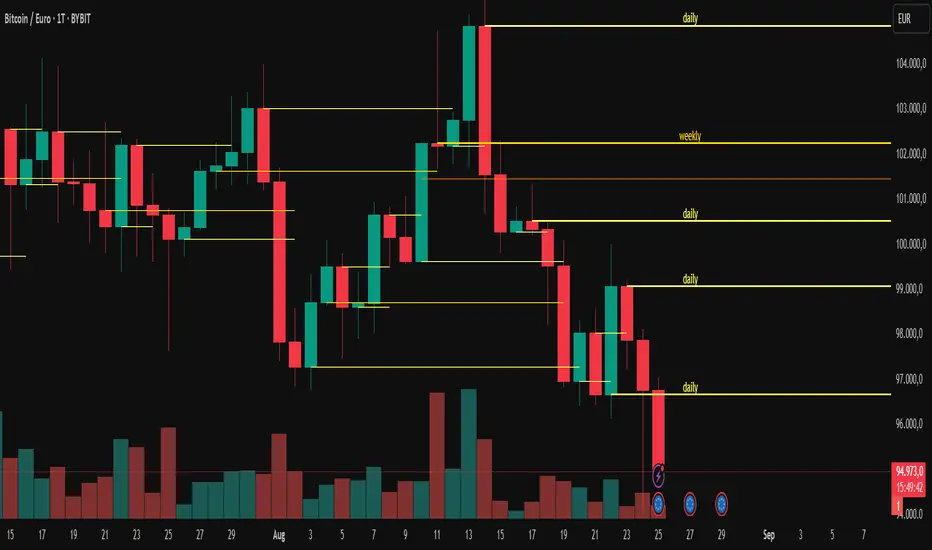
VWAP Indicator Channel | Multi Timeframe by Osbrah📊 Multi-Timeframe VWAP Indicator (Session / Weekly / Monthly)
This powerful indicator plots the Volume Weighted Average Price (VWAP) across multiple timeframes: intraday session, weekly, and monthly. It's designed to give traders a clear understanding of the market’s fair value over different horizons.
Key Features:
* Display Session VWAP (resets daily)
* Enable Weekly and Monthly VWAPs for broader market context
* Customize colors, styles, and visibility for each VWAP
* Toggle between standard VWAP or anchored to session opens
Use Cases:
* Identify value zones where price tends to gravitate
* Spot institutional levels of interest and potential reversal points
* Align entries with VWAP bounces or breaks
* Combine with EMAs or price action for high-probability setups
Perfect for day traders, swing traders, and institutional-style strategies, this VWAP tool helps you stay aligned with volume-based price dynamics across all market phases.

True Seasonal Pattern [tradeviZion]True Seasonal Pattern: Uncover Hidden Market Cycles
Markets have rhythms and patterns that repeat with surprising regularity. The True Seasonal Pattern indicator reveals these hidden cycles across different timeframes, helping you anticipate potential market movements based on historical seasonal tendencies.
What This Indicator Does
The True Seasonal Pattern analyzes years of historical price data to identify recurring seasonal trends. It then plots these patterns on your chart, showing you both the historical pattern and future projection based on past seasonal behavior.
Automatic Timeframe Detection: Works with Monthly, Weekly, and Daily charts
Historical Pattern Analysis: Analyzes up to 100 years of data (customizable)
Future Projection: Projects the seasonal pattern ahead on your chart
Smart Smoothing: Applies appropriate smoothing based on your timeframe
How to Use This Indicator
Add the indicator to a Daily, Weekly, or Monthly chart (not designed for intraday timeframes)
The indicator automatically detects your chart's timeframe
The blue line shows the historical seasonal pattern
Watch for potential turning points in the pattern that align with other technical signals
Seasonal patterns work best as a supporting factor in your analysis, not as standalone trading signals. They are particularly effective in markets with well-established seasonal influences.
Best Applications
Futures Markets: Commodities and futures often show strong seasonal tendencies due to production cycles, weather patterns, and economic factors
Stock Indices: Many stock markets demonstrate regular seasonal patterns (like the "Sell in May" phenomenon)
Individual Stocks: Companies with seasonal business cycles often show predictable price patterns
Practical Applications
Identify potential turning points based on historical seasonal patterns
Plan entries and exits around seasonal tendencies
Add seasonal context to your existing technical analysis
Understand why certain months or periods might show consistent behavior
Pro Tip: For best results, use this tool on instruments with at least 5+ years of historical data. Longer timeframes often reveal more reliable seasonal patterns.
Important Notes
This indicator works best on Daily, Weekly, and Monthly timeframes - not intraday charts
Seasonal patterns are tendencies, not guarantees
Always combine seasonal analysis with other technical tools
Past patterns may not repeat exactly in the future
// Sample of the seasonal calculation approach
float yearHigh = array.max(currentYearHighs)
float yearLow = array.min(currentYearLows)
// Calculate seasonality for each period
for i = 0 to array.size(currentYearCloses) - 1
float periodClose = array.get(currentYearCloses, i)
if not na(periodClose) and yearHigh != yearLow
float seasonality = (periodClose - yearLow) / (yearHigh - yearLow) * 100
I developed this indicator to help traders incorporate seasonal analysis into their trading approach without the complexity of traditional seasonal tools. Whether you're analyzing agricultural commodities, energy futures, or stock indices, understanding the seasonal context can provide valuable insights for your trading decisions.
Remember: Markets don't always follow seasonal patterns, but when they do, being aware of these tendencies can give you a meaningful edge in your analysis.

MACD Multi-Timeframe x4 (Custom Params)■About this indicator
・This indicator can display 4 MACD lines for different time frames. (Multi-time framework)
・The color of the MACD line changes when the MACD has a golden or dead cross.
All MACDs can be set individually for long time period, short time period, and signal smoothing.
All MACDs can show/hide MACD lines, signal lines, histograms, and select colors.
■Explanation of effective usage
By displaying MACDs in multiple time frames, you can time the push.
For example, let's say you have three MACDs: one weekly, one daily, and one hour.
With the weekly and daily MACDs continuing to golden cross, the timing for the hourly MACD to golden cross is considered a push opportunity.
An example chart is attached below for your reference.
The area circled vertically is a push-buying opportunity.
Yellow-green: Weekly Green: Daily Light blue: Hourly
-------------------------------------------------------------------------------------------------------------
■このインジケーターについて
・このインジケーターは別の時間軸の4本のMACDを表示させることが出来ます。(マルチタイムフレームワーク)
・MACDがゴールデンクロス・デッドクロスした場合にMACDラインの色が変化します。
・全てのMACDについて個別に長期の期間・短期の期間・シグナルの平滑化を設定できます。
・全てのMACDはMACDライン・シグナルライン・ヒストグラムの表示/非表示、色の選択ができます。
■有効な使い方の説明
マルチタイムフレームでMACDを表示することで、押し目のタイミングを計ることが出来ます。
例えば、3本のMACDを1週間・1日・1時間とします。
週足と日足のMACDがゴールデンクロスを継続した状態で、1時間足のMACDがゴールデンクロスしてくるタイミングは押し目買いのチャンスと考えられます。
以下に例題のチャートを付けますので、参考にしてください。
縦に囲った辺りが押し目買いのチャンスになります。
黄緑:週足 緑:日足 水色:1時間足

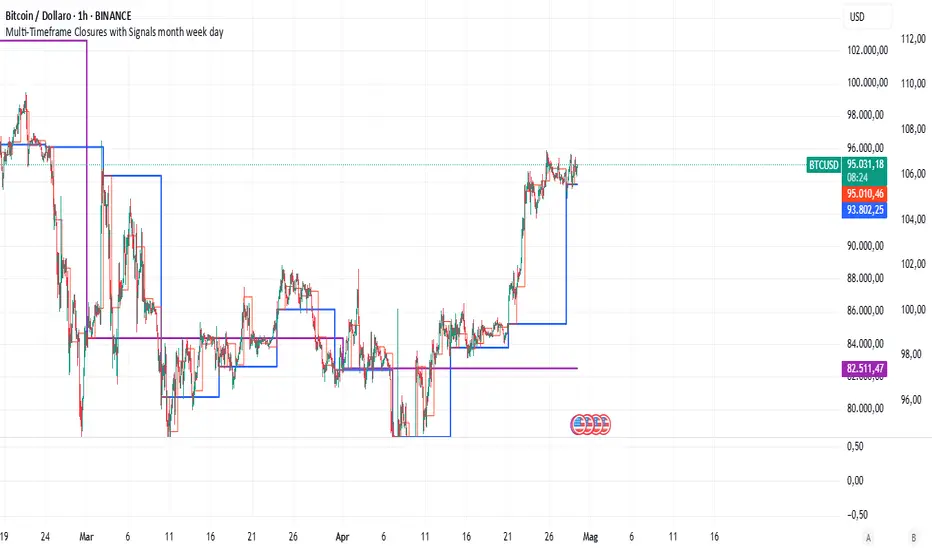
Multi-Timeframe Closures with Signals month week dayMulti-Timeframe Price Anchoring Indicator (Monthly, Weekly, Daily)
This indicator provides a powerful visual framework for analyzing price action across three major timeframes: monthly, weekly, and daily. It plots the closing prices of each timeframe directly on the chart to help traders assess where current price stands in relation to significant historical levels.
🔍 Core Features:
Monthly, Weekly, and Daily Close Lines: Automatically updated at the start of each new period.
Color-coded Price Anchors: Each timeframe is visually distinct for fast interpretation.
Multi-timeframe Awareness: Helps you identify trend alignment or divergence across different time horizons.
Long & Short Bias Signals: The script can optionally display long or short suggestions based on where the current price stands relative to the anchored closing prices.
📈 How to Use:
Trend Confirmation: If price is consistently above all three levels, it signals a strong bullish trend (potential long bias). If it’s below, the opposite applies (short bias).
Reversal or Pullback Zones: When price becomes extended far above/below the monthly and weekly closes, it may suggest overbought/oversold conditions and the possibility of a reversal or retracement.
Intraday Alignment: Useful for traders who want to enter positions on lower timeframes while being aware of higher timeframe trends.
This indicator is ideal for swing traders, day traders, and position traders who want to anchor their decisions to meaningful multi-timeframe reference points.