In den Scripts nach "weekly" suchen
Weekly Futures VWAP (Major Indices) - StableAutomatically puts the VWAP anchor on Sunday opening of futures at 16:00, you are able to toggle on/off VWAP bands and of course enter alerts

Weekly Breakout Screenermencari harga saham yang kuat breakout harga mingguan. potensi swing trading

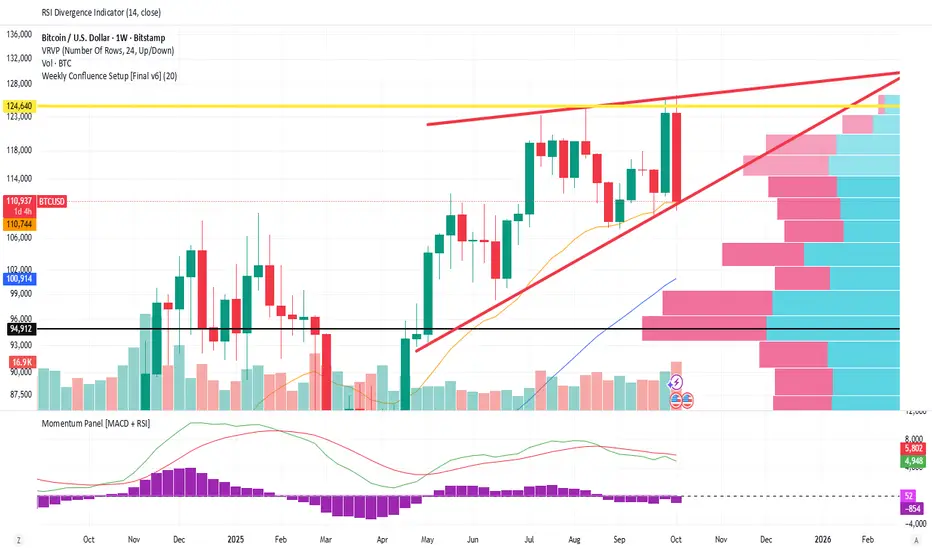
Weekly Confluence Setup [Final v6]Trend: EMA 21 and SMA 50
Momentum: MACD and RSI in a separate pane
Volume: Anchored VWAP from recent swing low
Confluence Signals: Clear triangle markers with optional alerts to the chart timeframe
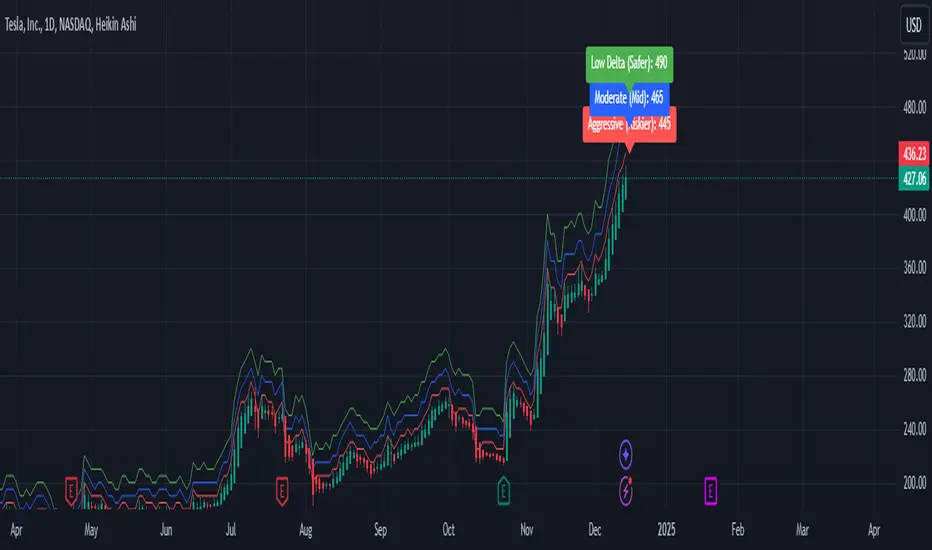
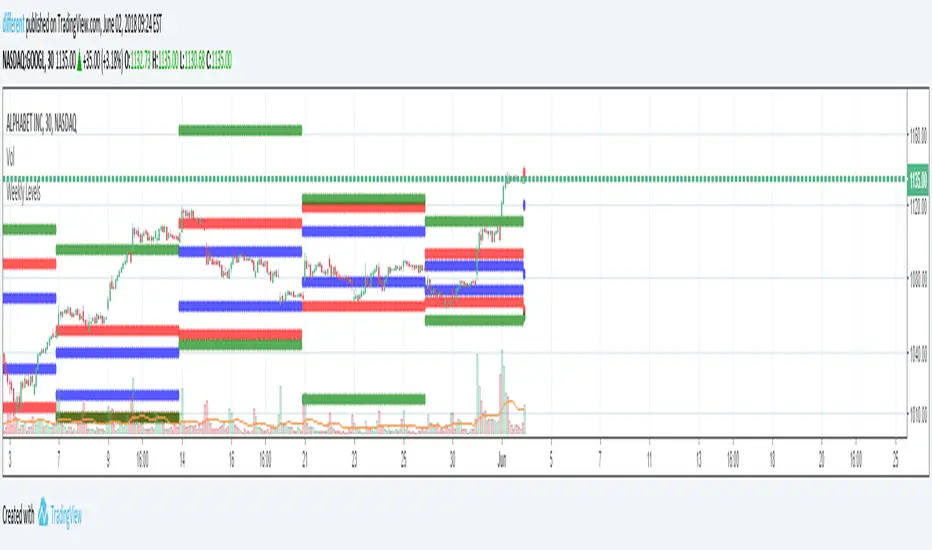
Weekly Covered Calls Strategy with IV & Delta LogicWhat Does the Indicator Do?
this is interactive you must use it with your options chain to input data based on the contract you want to trade.
Visualize three strike price levels for covered calls based on:
Aggressive (closest to price, riskier).
Moderate (mid-range, balanced).
Low Delta (farthest, safer).
Incorporate Implied Volatility (IV) from the options chain to make strike predictions more realistic and aligned with market sentiment. Adjust the risk tolerance by modifying Delta inputs and IV values. Risk is defined for example .30 delta means 30% chance of your shares being assigned. If you want to generate steady income with your shares you might want to lower the risk of them being assigned to .05 or 5% etc.
How to Use the Indicator with the Options Chain
Start with the Options Chain:
Look for the following data points from your options chain:
Implied Volatility (IV Mid): Average IV for a particular strike price.
Delta:
~0.30 Delta: Closest strike (Aggressive).
~0.15–0.20 Delta: Mid-range strike (Moderate).
~0.05–0.10 Delta: Far OTM, safer (Low Delta).
Strike Price: Identify strike prices for the desired Deltas.
Open Interest: Check liquidity; higher OI ensures tighter spreads.
Input IV into the Indicator:
Enter the IV Mid value (e.g., 0.70 for 70%) from the options chain into the Implied Volatility field of the indicator.
Adjust Delta Inputs Based on Risk Tolerance:
Aggressive Delta: Increase if you want strikes closer to the current price (riskier, higher premium).
Default: 0.2 (20% chance of shares being assigned).
Moderate Delta: Balanced risk/reward.
Default: 0.12 (12%)
Low Delta: Decrease for safer, farther OTM strikes.
Default: 0.05 (5%)
Visualize the Chart:
Once inputs are updated:
Red Line: Aggressive Strike (closest, riskiest, higher premium).
Blue Line: Moderate Strike (mid-range).
Green Line: Low Delta Strike (farthest, safer).
Step-by-Step Workflow Example
Open the options chain and note:
Implied Volatility (IV Mid): Example 71.5% → input as 0.715.
Delta for desired strikes:
Aggressive: 0.30 Delta → Closest strike ~ $455.
Moderate: 0.15 Delta → Mid-range strike ~ $470.
Low Delta: 0.05 Delta → Farther strike ~ $505.
Open the indicator and adjust:
IV Mid: Enter 0.715.
Aggressive Delta: Leave at 0.12 (or adjust to bring strikes closer).
Moderate Delta: Leave at 0.18.
Low Delta: Adjust to 0.25 for safer, farther strikes.
View the chart:
Compare the indicator's strikes (red, blue, green) with actual options chain strikes.
Use the visualization to: Validate the risk/reward for each strike.
Align strikes with technical trends, support/resistance.
Adjusting Inputs Based on Risk Tolerance
Higher Risk: Increase Aggressive Delta (e.g., 0.15) for closer strikes.
Use higher IV values for volatile stocks.
Moderate Risk: Use default values (0.12–0.18 Delta).
Balance premiums and probability.
Lower Risk: Increase Low Delta (e.g., 0.30) for farther, safer strikes.
Focus on higher IV stocks with good open interest.
Key Benefits
Simplifies Strike Selection: Visualizes the three risk levels directly on the chart.
Aligns with Market Sentiment: Incorporates IV for realistic forecasts.
Customizable for Risk: Adjust inputs to match personal risk tolerance.
By combining the options chain (IV, Delta, and liquidity) with the technical chart, you get a powerful, visually intuitive tool for covered call strategies.
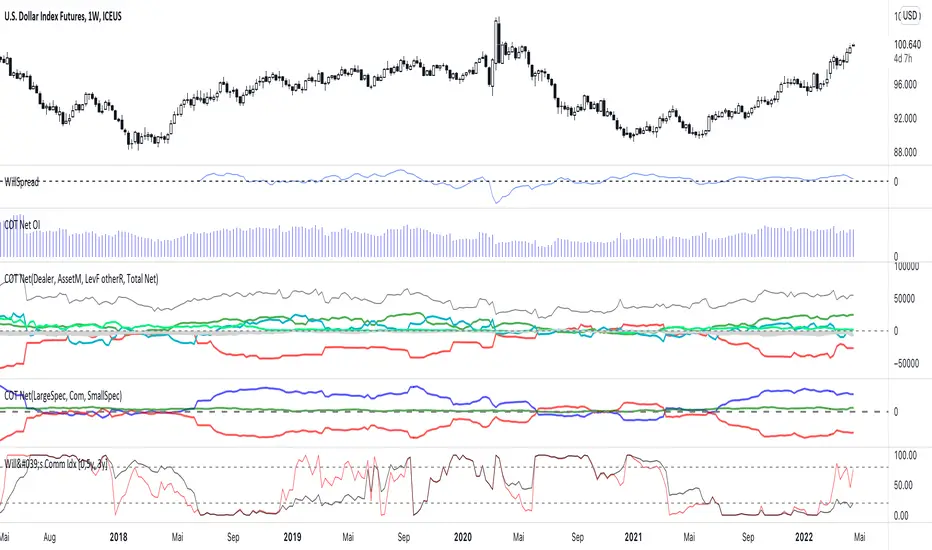
Weekly COTAdjusted COT Index
Improves upon: "COT Index Commercials vs large and small Speculators" by SystematicFutures
How: CoT Indexes are adjusted by Open Interest to normalise data over time, and threshold background colours are in-line with Larry Williams recommendations from his book.
Note: This indicator is **only** accurate on the Daily time-frame due to the mid-week release date for CoT data.
This script calculates and plots the Adjusted Commitment of Traders (COT) Index for Commercial, Large Speculator, and Retail (Small Speculator) categories.
The CoT Index is adjusted by Open Interest to normalise data through time, following the methodology of Larry Williams, providing insights into how these groups are positioned in the market with an arguably more historically accurate context.
COT Categories
-------------------
- Commercials (Producers/Hedgers): Large entities hedging against price changes in the underlying asset.
- Large Speculators (Non-commercials): Professional traders and funds speculating on price movements.
- Retail Traders (Nonreportable/Small Speculators): Small individual traders, typically less informed.
Features
----------
- Open Interest Adjustment
- The net positions for each category are normalized by Open Interest to account
for varying contract sizes.
- Customisable Look-back Period
- You can adjust the number of weeks for the index calculation to control the
historical range used for comparison.
- Thresholds for Extremes
- Upper and lower thresholds (configurable) are provided to mark overbought and
oversold conditions.
- Defaults
- Overbought: <=20
- Oversold: >= 80
- Hide Current Week Option
- Optionally hide the current week's data until market close for more accurate comparison.
- Visual Aids
- Plot the Commercials, Large Speculators, and Retail indexes, and optionally highlight extreme positioning.
Inputs
--------
- weeks
- Number of weeks for historical range comparison.
- upperExtreme and lowerExtreme
- Thresholds to identify overbought/oversold conditions (default 80/20).
- hideCurrentWeek
- Option to hide current week's data until market close.
- markExtremes
- Highlight extremes where any index crosses the upper or lower thresholds.
- Options to display or hide indexes for Commercials, Large Speculators, and Small Speculators.
Outputs
----------
- The script plots the COT Index for each of the three categories and highlights periods of extreme positioning with customisable thresholds.
Usage
-------
- This tool is useful for traders who want to track the positioning of different market participants over time.
- By identifying the extreme positions of Commercials, Large Speculators, and Retail traders, it can give insights into market sentiment and potential reversals.
- Reversals of trend can be confirmed with RSI Divergence (daily), for example
- Continuation can be confirmed with RSI overbought/oversold conditions (daily), and/or hidden RSI Hidden Divergence, for example

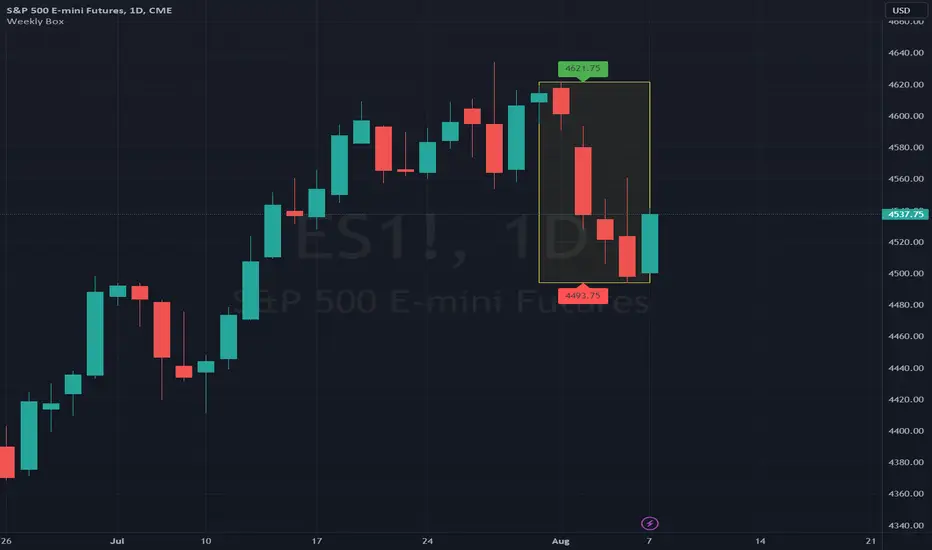
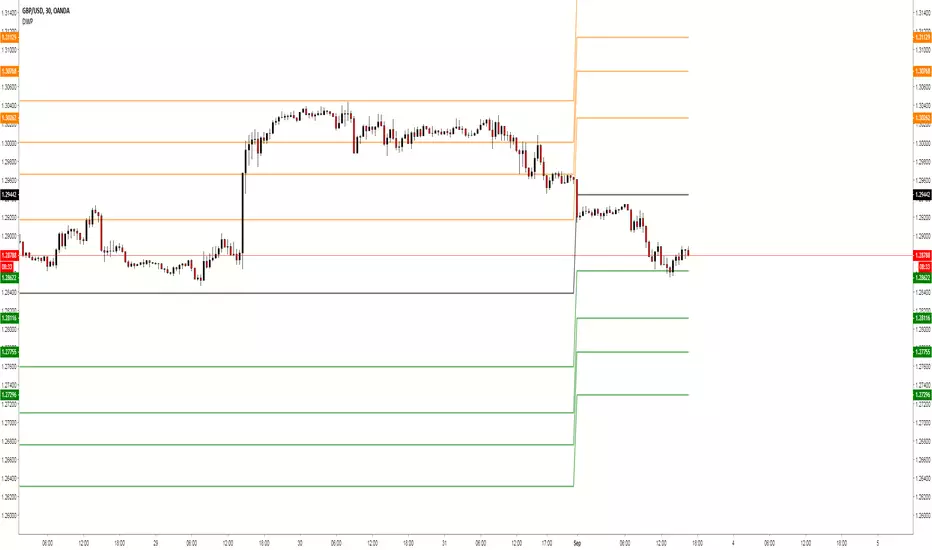
Weekly BoxThe indicator shows a box based on the high and low of the previous week that extends into the current week. The box is used to monitor breakouts or break downs of the price with respect to the previous week levels.
The box is colored:
- green, if there is a breakout above the previous week high; or
- red, if there is a break down below the previous week low; or
- yellow, if the price stays inside of the box.
during the current week.
Labels for the box top and bottom prices can be enabled or disabled in the settings.
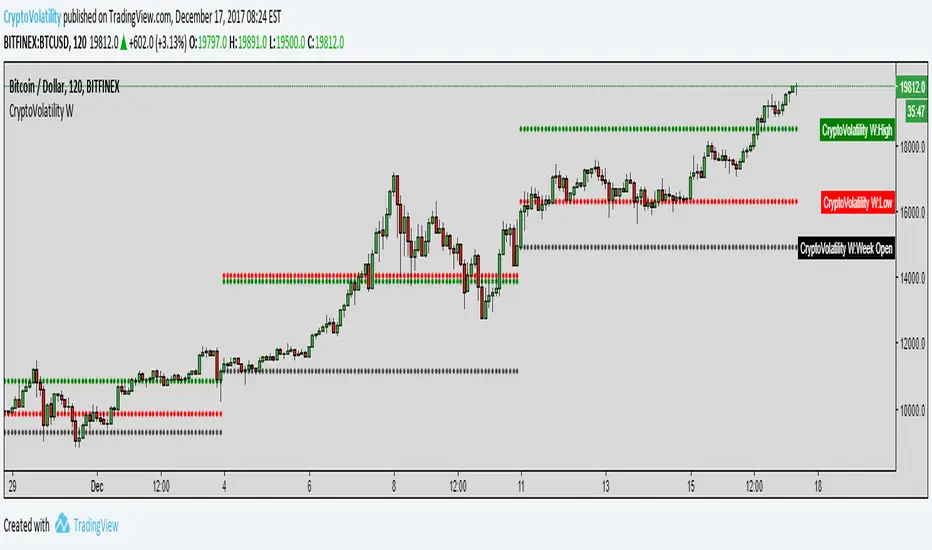
Weekly Opening Gap (cryptonnnite)In the context of general equities, opening price that is substantially higher or lower than the previous day's closing price, usually because of some extraordinarily positive or negative news. Opening gap using as a potential target which market usually trades to.

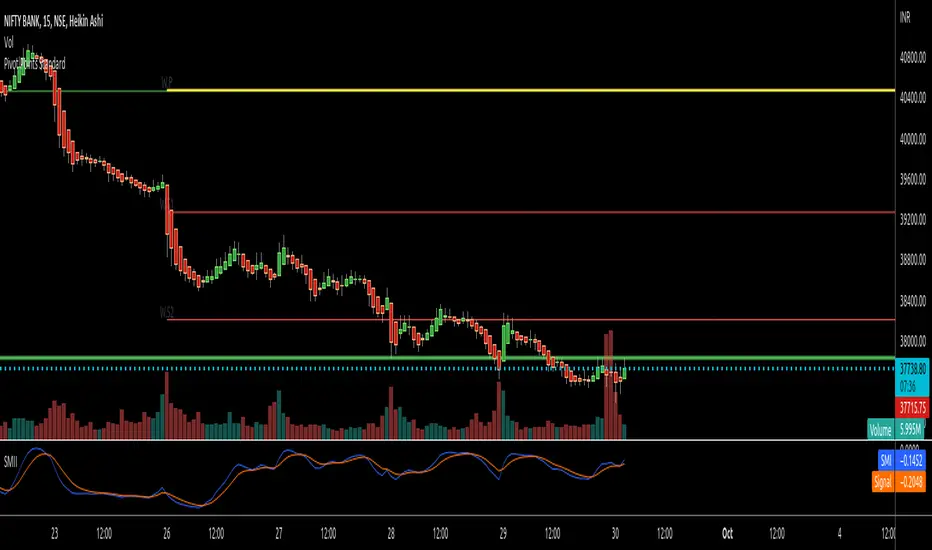
RTI Pivot Points StandardWeekly daily Pivot point for ease.
This is will show support and resistance on 15 minutes and 30 minutes time frame.
COT Net Positions BTC & ETH FO_ALLWeekly Commitment of Traders Report for Futures positions, as well as futures plus options positions.
This is only for Bitcoin and Ether.
OPEN INTEREST
DEALER
ASSET MANAGER
LEVERAGED FUNDS
OTHER REPORTABLE
TOTAL REPORTABLE
NON REPORTABLE
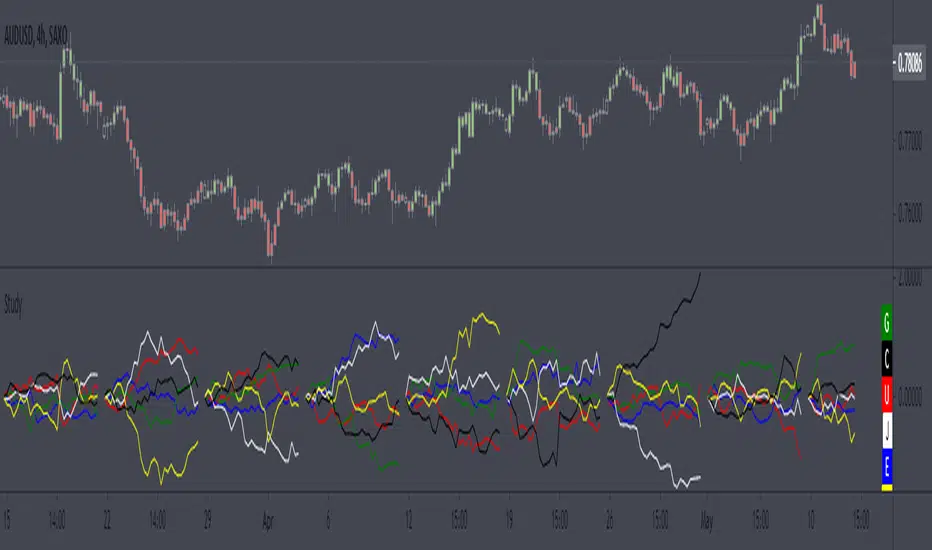
Weekly currency strength indicatorThe indicator uses the SAXO feed for the currencies USD, EUR, GBP, JPY, AUD and CAD. This can easily be changed to your preferred feed and currencies by changing the code.
The overall idea is to get a clear picture of which currencies are strengthening and weakening. This indicator does not predict future price movements.
Weekly & Daily Percantage Price OscillatorMy first script.
By Vitali Apirine. Technical Analysis of Stocks & Commodities ( February 2018, Vol.36 Issue 2). Thank you.

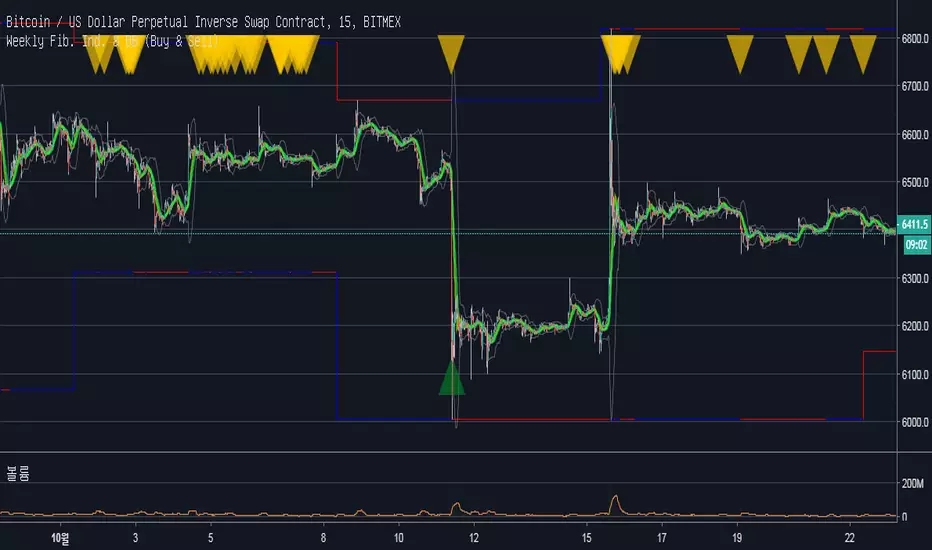
Weekly Fibonacci Ind. & BB (Buy & Sell)Description :
Fibonacci Retracements are used to estimate likely reversal points during an up- or down-trend. Percentage retracement levels, based on significant Fibonacci numbers, are plotted as horizontal lines against the latest trend move.
1. Blue and Red Line : The highest and lowest peak of candles.
Blue line and Red line changes colors according to the position of candles above or below the 0.5 Fibonacci Retracements line.
2. Yellow Line : 0.5 Fibonacci Retracements line.
3. Green Line : BB Basis line.
Reference of Fibonacci Retracements :
www.incrediblecharts.com
Mavilim Multiple Trend By BDweekly mavilim line,daily mavilim line and more,within your current chart. and shows multiple mavilim trend. if u need something like this

Multiple Trend Indicatorweekly 21wma,daily 21wma and more,within your current chart. and shows multiple trend. if u need something like this


Warpath Structure + Liquidity Tool (Updated - V3)Warpath visually organizes the key elements required to trade Gold professionally:
1. Market Structure Clarity
Automatically labels HH / HL / LH / LL on major pivot points (current chart timeframe). Makes directional bias immediately obvious. Helps prevent counter-trend trading in strong expansions.
2. Liquidity Sweep Detection (Wick-Only)
Highlights true liquidity sweeps using wick behavior (no breakout guessing). Marks the sweep wick with user-defined colors. Draws a swept-zone box that extends forward to show where liquidity was taken. Designed to identify fuel vs reversal behavior in trends.
3. Key Session Levels
Automatically plots:
Asian High / Low
Previous Day High / Low
Equal Highs / Equal Lows from current timeframe and higher timeframes (1H / 4H / Daily)
These levels represent where price is likely to react, not where trades should be forced.
4. Multi-Confluence HTF Bias Dashboard
Small dashboard showing bias for 15M, 1H, 4H, and Daily timeframes. Each timeframe bias is calculated using four confluence factors:
EMA Stack: 8/21/50 alignment and price position relative to EMAs
Structure: Recent HH/HL vs LH/LL pivot behavior
Price Patterns: Engulfing candles, hammers, double bottoms/tops, break of structure
Momentum: Recent candle direction and close trend
Displays a confluence score (e.g., "BULLS (4)") so you can see signal strength, not just direction. Overall bias weights higher timeframes more heavily for smarter alignment.
5. Trade Positioning Dashboard
Replaces basic overbought/oversold readings with actionable positioning context:
Range Position: Shows exactly where price sits within the selected range (Previous Session, Previous Day, or Weekly) as a percentage. Zones include Deep Discount (0-25%), Discount (25-40%), Equilibrium (40-60%), Premium (60-75%), and Deep Premium (75-100%).
VWAP Deviation: Displays distance from VWAP in standard deviations (σ). Readings beyond ±1.5σ indicate meaningful extension. Readings beyond ±2σ suggest caution on continuation and potential mean reversion.
Trade Favor: Combines HTF bias alignment, range position, and VWAP deviation into a single directional score. Displays as "LONGS ●●●○" or "SHORTS ●●○○" so you know at a glance whether conditions favor continuation or reversal.
6. Continuation Reload Awareness (Strong Trend Environments)
Built to handle markets that:
Remain overbought
Stay in premium
Sweep buy-side liquidity repeatedly
The multi-confluence scoring system catches trend continuation setups (like higher lows forming with bullish momentum) even before swing structure fully confirms. Supports compression → expansion continuation behavior. Prevents missed participation during multi-day trends without abandoning discipline.

DAYOFWEEK performance1 -Objective
"What is the ''best'' day to trade .. Monday, Tuesday...."
This script aims to determine if there are different results depending on the day of the week.
The way it works is by dividing data by day of the week (Monday, Tuesday, Wednesday ... ) and perform calculations for each day of the week.
1 - Objective
2 - Features
3 - How to use (Examples)
4 - Inputs
5 - Limitations
6 - Notes
7 - Final Tooughs
2 - Features
AVG OPEN-CLOSE
Calculate de Percentage change from day open to close
Green % (O-C)
Percentage of days green (open to close)
Average Change
Absolute day change (O-C)
AVG PrevD. Close-Close
Percentage change from the previous day close to the day of the week close
(Example: Monday (C-C) = Friday Close to Monday close
Tuesday (C-C) = Monday C. to Tuesday C.
Green % (C1-C)
Percentage of days green (open to close)
AVG Volume
Day of the week Average Volume
Notes:
*Mon(Nº) - Nº = Number days is currently calculated
Example: Monday (12) calculation based on the last 12 Mondays. Note: Discrepancies in numbers example Monday (12) - Friday (11) depend on the initial/end date or the market was closed (Holidays).
3 - How to use (Examples)
For the following example, NASDAQ:AAPL from 1 Jan 21 to 1 Jul 21 the results are following.
The highest probability of a Close being higher than the Open is Monday with 52.17 % and the Lowest Tuesday with 38.46 %. Meaning that there's a higher chance (for NASDAQ:AAPL ) of closing at a higher value on Monday while the highest chance of closing is lower is Tuesday. With an average gain on Tuesday of 0.21%
Long - The best day to buy (long) at open (on average) is Monday with a 52.2% probability of closing higher
Short - The best day to sell (short) at open (on average) is Tuesday with a 38.5% probability of closing higher (better chance of closing lower)
Since the values change from ticker to ticker, there is a substantial change in the percentages and days of the week. For example let's compare the previous example ( NASDAQ:AAPL ) to NYSE:GM (same settings)
For the same period, there is a substantial difference where there is a 62.5% probability Friday to close higher than the open, while Tuesday there is only a 28% probability.
With an average gain of 0.59% on Friday and an average loss of -0.34%
Also, the size of the table (number of days ) depends if the ticker is traded or not on that day as an example COINBASE:BTCUSD
4 - Inputs
DATE RANGE
Initial Date - Date from which the script will start the calculation.
End Date - Date to which the script will calculate.
TABLE SETTINGS
Text Color - Color of the displayed text
Cell Color - Background color of table cells
Header Color - Color of the column and row names
Table Location - Change the position where the table is located.
Table Size - Changes text size and by consequence the size of the table
5 - LIMITATIONS
The code determines average values based on the stored data, therefore, the range (Initial data) is limited to the first bar time.
As a consequence the lower the timeframe the shorter the initial date can be and fewer weeks can be calculated. To warn about this limitation there's a warning text that appears in case the initial date exceeds the bar limit.
Example with initial date 1 Jan 2021 and end date 18 Jul 2021 in 5m and 10 m timeframe:
6 - Notes and Disclosers
The script can be moved around to a new pane if need. -> Object Tree > Right Click Script > Move To > New pane
The code has not been tested in higher subscriptions tiers that allow for more bars and as a consequence more data, but as far I can tell, it should work without problems and should be in fact better at lower timeframes since it allows more weeks.
The values displayed represent previous data and at no point is guaranteed future values
7 - Final Tooughs
This script was quite fun to work on since it analysis behavioral patterns (since from an abstract point a Tuesday is no different than a Thursday), but after analyzing multiple tickers there are some days that tend to close higher than the open.
PS: If you find any mistake ex: code/misspelling please comment.

Khango's Key//@version=5
//@sbtnc thank you for doing the base code
//Added additional levels for convienience sake.
indicator('Key Levels SpacemanBTC IDWM', shorttitle='Khangos Key', overlay=true, max_lines_count=100)
//35 works
displayStyle = input.string(defval='Standard', title='Display Style', options= , inline='Display')
mergebool = input.bool(defval=true, title='Merge Levels?', inline='Display')
distanceright = input.int(defval=30, title='Distance', minval=5, maxval=500, inline='Dist')
radistance = input.int(defval=250, title='Anchor Distance', minval=5, maxval=500, inline='Dist')
labelsize = input.string(defval='Medium', title='Text Size', options= )
linesize = input.string(defval='Small', title='Line Width', options= , inline='Line')
linestyle = input.string(defval='Solid', title='Line Style', options= , inline='Line')
GlobalTextType = input.bool(defval=false, title='Global Text ShortHand', tooltip='Enable for shorthand text on all text')
var globalcoloring = input.bool(defval=false, title='Global Coloring', tooltip='Enable for all color controls via one color', inline='GC')
GlobalColor = input.color(title='', defval=color.white, inline='GC')
//var show_tails = input(defval = false, title = "Always Show", type = input.bool)
= request.security(syminfo.tickerid, 'D', , lookahead=barmerge.lookahead_on)
= request.security(syminfo.tickerid, 'D', [time , high ], lookahead=barmerge.lookahead_on)
= request.security(syminfo.tickerid, 'D', [time , low ], lookahead=barmerge.lookahead_on)
cdailyh_open = request.security(syminfo.tickerid, 'D', high, lookahead=barmerge.lookahead_on)
cdailyl_open = request.security(syminfo.tickerid, 'D', low, lookahead=barmerge.lookahead_on)
var monday_time = time
var monday_high = high
var monday_low = low
= request.security(syminfo.tickerid, 'W', , lookahead=barmerge.lookahead_on)
= request.security(syminfo.tickerid, 'W', [time , high ], lookahead=barmerge.lookahead_on)
= request.security(syminfo.tickerid, 'W', [time , low ], lookahead=barmerge.lookahead_on)
= request.security(syminfo.tickerid, 'M', , lookahead=barmerge.lookahead_on)
= request.security(syminfo.tickerid, 'M', [time , high ], lookahead=barmerge.lookahead_on)
= request.security(syminfo.tickerid, 'M', [time , low ], lookahead=barmerge.lookahead_on)
= request.security(syminfo.tickerid, '3M', , lookahead=barmerge.lookahead_on)
= request.security(syminfo.tickerid, '3M', [time , high ], lookahead=barmerge.lookahead_on)
= request.security(syminfo.tickerid, '3M', [time , low ], lookahead=barmerge.lookahead_on)
= request.security(syminfo.tickerid, '12M', , lookahead=barmerge.lookahead_on)
= request.security(syminfo.tickerid, '12M', , lookahead=barmerge.lookahead_on)
= request.security(syminfo.tickerid, '12M', , lookahead=barmerge.lookahead_on)
= request.security(syminfo.tickerid, '240', , lookahead=barmerge.lookahead_on)
= request.security(syminfo.tickerid, '240', [time , high ], lookahead=barmerge.lookahead_on)
= request.security(syminfo.tickerid, '240', [time , low ], lookahead=barmerge.lookahead_on)
//------------------------------ Inputs -------------------------------
var is_intra_enabled = input.bool(defval=false, title='Open', group='4H', inline='4H')
var is_intrarange_enabled = input.bool(defval=false, title='Prev H/L', group='4H', inline='4H')
var is_intram_enabled = input.bool(defval=false, title='Prev Mid', group='4H', inline='4H')
IntraTextType = input.bool(defval=false, title='ShortHand', group='4H', inline='4Hsh')
var is_daily_enabled = input.bool(defval=true, title='Open', group='Daily', inline='Daily')
var is_dailyrange_enabled = input.bool(defval=false, title='Prev H/L', group='Daily', inline='Daily')
var is_dailym_enabled = input.bool(defval=false, title='Prev Mid', group='Daily', inline='Daily')
DailyTextType = input.bool(defval=false, title='ShortHand', group='Daily', inline='Dailysh')
var is_monday_enabled = input.bool(defval=true, title='Range', group='Monday Range', inline='Monday')
var is_monday_mid = input.bool(defval=true, title='Mid', group='Monday Range', inline='Monday')
var untested_monday = false
MondayTextType = input.bool(defval=false, title='ShortHand', group='Monday Range', inline='Mondaysh')
var is_weekly_enabled = input.bool(defval=true, title='Open', group='Weekly', inline='Weekly')
var is_weeklyrange_enabled = input.bool(defval=true, title='Prev H/L', group='Weekly', inline='Weekly')
var is_weekly_mid = input.bool(defval=true, title='Prev Mid', group='Weekly', inline='Weekly')
WeeklyTextType = input.bool(defval=false, title='ShortHand', group='Weekly', inline='Weeklysh')
var is_monthly_enabled = input.bool(defval=true, title='Open', group='Monthly', inline='Monthly')
var is_monthlyrange_enabled = input.bool(defval=true, title='Prev H/L', group='Monthly', inline='Monthly')
var is_monthly_mid = input.bool(defval=true, title='Prev Mid', group='Monthly', inline='Monthly')
MonthlyTextType = input.bool(defval=false, title='ShortHand', group='Monthly', inline='Monthlysh')
var is_quarterly_enabled = input.bool(defval=true, title='Open', group='Quarterly', inline='Quarterly')
var is_quarterlyrange_enabled = input.bool(defval=false, title='Prev H/L', group='Quarterly', inline='Quarterly')
var is_quarterly_mid = input.bool(defval=true, title='Prev Mid', group='Quarterly', inline='Quarterly')
QuarterlyTextType = input.bool(defval=false, title='ShortHand', group='Quarterly', inline='Quarterlysh')
var is_yearly_enabled = input.bool(defval=true, title='Open', group='Yearly', inline='Yearly')
var is_yearlyrange_enabled = input.bool(defval=false, title='Current H/L', group='Yearly', inline='Yearly')
var is_yearly_mid = input.bool(defval=true, title='Mid', group='Yearly', inline='Yearly')
YearlyTextType = input.bool(defval=false, title='ShortHand', group='Yearly', inline='Yearlysh')
var is_londonrange_enabled = input.bool(defval=false, title='London Range', group='FX Sessions', inline='FX')
var is_usrange_enabled = input.bool(defval=false, title='New York Range', group='FX Sessions', inline='FX')
var is_asiarange_enabled = input.bool(defval=false, title='Asia Range', group='FX Sessions', inline='FX')
SessionTextType = input.bool(defval=false, title='ShortHand', group='FX Sessions', inline='FXColor')
Londont = input.session("0800-1600", "London Session")
USt = input.session("1400-2100", "New York Session")
Asiat = input.session("0000-0900", "Tokyo Session")
DailyColor = input.color(title='', defval=#08bcd4, group='Daily', inline='Dailysh')
MondayColor = input.color(title='', defval=color.white, group='Monday Range', inline='Mondaysh')
WeeklyColor = input.color(title='', defval=#fffcbc, group='Weekly', inline='Weeklysh')
MonthlyColor = input.color(title='', defval=#08d48c, group='Monthly', inline='Monthlysh')
YearlyColor = input.color(title='', defval=color.red, group='Yearly', inline='Yearlysh')
quarterlyColor = input.color(title='', defval=color.red, group='Quarterly', inline='Quarterlysh')
IntraColor = input.color(title='', defval=color.orange, group='4H', inline='4Hsh')
LondonColor = input.color(title='', defval=color.white, group='FX Sessions', inline='FXColor')
USColor = input.color(title='', defval=color.white, group='FX Sessions', inline='FXColor')
AsiaColor = input.color(title='', defval=color.white, group='FX Sessions', inline='FXColor')
var pdhtext = GlobalTextType or DailyTextType ? 'PDH' : 'Prev Day High'
var pdltext = GlobalTextType or DailyTextType ? 'PDL' : 'Prev Day Low'
var dotext = GlobalTextType or DailyTextType ? 'DO' : 'Daily Open'
var pdmtext = GlobalTextType or DailyTextType ? 'PDM' : 'Prev Day Mid'
var pwhtext = GlobalTextType or WeeklyTextType ? 'PWH' : 'Prev Week High'
var pwltext = GlobalTextType or WeeklyTextType ? 'PWL' : 'Prev Week Low'
var wotext = GlobalTextType or WeeklyTextType ? 'WO' : 'Weekly Open'
var pwmtext = GlobalTextType or WeeklyTextType ? 'PWM' : 'Prev Week Mid'
var pmhtext = GlobalTextType or MonthlyTextType ? 'PMH' : 'Prev Month High'
var pmltext = GlobalTextType or MonthlyTextType ? 'PML' : 'Prev Month Low'
var motext = GlobalTextType or MonthlyTextType ? 'MO' : 'Monthly Open'
var pmmtext = GlobalTextType or MonthlyTextType ? 'PMM' : 'Prev Month Mid'
var pqhtext = GlobalTextType or QuarterlyTextType ? 'PQH' : 'Prev Quarter High'
var pqltext = GlobalTextType or QuarterlyTextType ? 'PQL' : 'Prev Quarter Low'
var qotext = GlobalTextType or QuarterlyTextType ? 'QO' : 'Quarterly Open'
var pqmtext = GlobalTextType or QuarterlyTextType ? 'PQM' : 'Prev Quarter Mid'
var cyhtext = GlobalTextType or YearlyTextType ? 'CYH' : 'Current Year High'
var cyltext = GlobalTextType or YearlyTextType ? 'CYL' : 'Current Year Low'
var yotext = GlobalTextType or YearlyTextType ? 'YO' : 'Yearly Open'
var cymtext = GlobalTextType or YearlyTextType ? 'CYM' : 'Current Year Mid'
var pihtext = GlobalTextType or IntraTextType ? 'P-4H-H' : 'Prev 4H High'
var piltext = GlobalTextType or IntraTextType ? 'P-4H-L' : 'Prev 4H Low'
var iotext = GlobalTextType or IntraTextType ? '4H-O' : '4H Open'
var pimtext = GlobalTextType or IntraTextType ? 'P-4H-M' : 'Prev 4H Mid'
var pmonhtext = GlobalTextType or MondayTextType ? 'MDAY-H' : 'Monday High'
var pmonltext = GlobalTextType or MondayTextType ? 'MDAY-L' : 'Monday Low'
var pmonmtext = GlobalTextType or MondayTextType ? 'MDAY-M' : 'Monday Mid'
var lhtext = GlobalTextType or SessionTextType ? 'Lon-H' : 'London High'
var lltext = GlobalTextType or SessionTextType ? 'Lon-L' : 'London Low'
var lotext = GlobalTextType or SessionTextType ? 'Lon-O' : 'London Open'
var ushtext = GlobalTextType or SessionTextType ? 'NY-H' : 'New York High'
var usltext = GlobalTextType or SessionTextType ? 'NY-L' : 'New York Low'
var usotext = GlobalTextType or SessionTextType ? 'NY-O' : 'New York Open'
var asiahtext = GlobalTextType or SessionTextType ? 'AS-H' : 'Asia High'
var asialtext = GlobalTextType or SessionTextType ? 'AS-L' : 'Asia Low'
var asiaotext = GlobalTextType or SessionTextType ? 'AS-O' : 'Asia Open'
if globalcoloring == true
DailyColor := GlobalColor
MondayColor := GlobalColor
WeeklyColor := GlobalColor
MonthlyColor := GlobalColor
YearlyColor := GlobalColor
quarterlyColor := GlobalColor
IntraColor := GlobalColor
IntraColor
if weekly_time != weekly_time
untested_monday := false
untested_monday
if is_monday_enabled == true and untested_monday == false
untested_monday := true
monday_time := daily_time
monday_high := cdailyh_open
monday_low := cdailyl_open
monday_low
linewidthint = 1
if linesize == 'Small'
linewidthint := 1
linewidthint
if linesize == 'Medium'
linewidthint := 2
linewidthint
if linesize == 'Large'
linewidthint := 3
linewidthint
var DEFAULT_LINE_WIDTH = linewidthint
var DEFAULT_TAIL_WIDTH = linewidthint
fontsize = size.small
if labelsize == 'Small'
fontsize := size.small
fontsize
if labelsize == 'Medium'
fontsize := size.normal
fontsize
if labelsize == 'Large'
fontsize := size.large
fontsize
linestyles = line.style_solid
if linestyle == 'Dashed'
linestyles := line.style_dashed
linestyles
if linestyle == 'Dotted'
linestyles := line.style_dotted
linestyles
var DEFAULT_LABEL_SIZE = fontsize
var DEFAULT_LABEL_STYLE = label.style_none
var DEFAULT_EXTEND_RIGHT = distanceright
London = time(timeframe.period, Londont)
US = time(timeframe.period, USt)
Asia = time(timeframe.period, Asiat)
var clondonhigh = 0.0
var clondonlow = close
var londontime = time
var flondonhigh = 0.0
var flondonlow = 0.0
var flondonopen = 0.0
var onelondonfalse = false
if London
if high > clondonhigh
clondonhigh := high
clondonhigh
if low < clondonlow
clondonlow := low
clondonlow
if onelondonfalse
londontime := time
flondonopen := open
flondonopen
flondonhigh := clondonhigh
flondonlow := clondonlow
onelondonfalse := false
onelondonfalse
else
if onelondonfalse == false
flondonhigh := clondonhigh
flondonlow := clondonlow
flondonlow
onelondonfalse := true
clondonhigh := 0.0
clondonlow := close
clondonlow
//////////////////////////////////
var cushigh = 0.0
var cuslow = close
var ustime = time
var fushigh = 0.0
var fuslow = 0.0
var fusopen = 0.0
var oneusfalse = false
if US
if high > cushigh
cushigh := high
cushigh
if low < cuslow
cuslow := low
cuslow
if oneusfalse
ustime := time
fusopen := open
fusopen
fushigh := cushigh
fuslow := cuslow
oneusfalse := false
oneusfalse
else
if oneusfalse == false
fushigh := cushigh
fuslow := cuslow
fuslow
oneusfalse := true
cushigh := 0.0
cuslow := close
cuslow
//////////////////////////////////
var casiahigh = 0.0
var casialow = close
var asiatime = time
var fasiahigh = 0.0
var fasialow = 0.0
var fasiaopen = 0.0
var oneasiafalse = false
if Asia
if high > casiahigh
casiahigh := high
casiahigh
if low < casialow
casialow := low
casialow
if oneasiafalse
asiatime := time
fasiaopen := open
fasiaopen
fasiahigh := casiahigh
fasialow := casialow
oneasiafalse := false
oneasiafalse
else
if oneasiafalse == false
fasiahigh := casiahigh
fasialow := casialow
fasialow
oneasiafalse := true
casiahigh := 0.0
casialow := close
casialow
//------------------------------ Plotting ------------------------------
var pricearray = array.new_float(0)
var labelarray = array.new_label(0)
f_LevelMerge(pricearray, labelarray, currentprice, currentlabel, currentcolor) =>
if array.includes(pricearray, currentprice)
whichindex = array.indexof(pricearray, currentprice)
labelhold = array.get(labelarray, whichindex)
whichtext = label.get_text(labelhold)
label.set_text(labelhold, label.get_text(currentlabel) + ' / ' + whichtext)
label.set_text(currentlabel, '')
label.set_textcolor(labelhold, currentcolor)
else
array.push(pricearray, currentprice)
array.push(labelarray, currentlabel)
var can_show_daily = is_daily_enabled and timeframe.isintraday
var can_show_weekly = is_weekly_enabled and not timeframe.isweekly and not timeframe.ismonthly
var can_show_monthly = is_monthly_enabled and not timeframe.ismonthly
get_limit_right(bars) =>
timenow + (time - time ) * bars
// the following code doesn't need to be processed on every candle
if barstate.islast
is_weekly_open = dayofweek == dayofweek.monday
is_monthly_open = dayofmonth == 1
can_draw_daily = (is_weekly_enabled ? not is_weekly_open : true) and (is_monthly_enabled ? not is_monthly_open : true)
can_draw_weekly = is_monthly_enabled ? not(is_monthly_open and is_weekly_open) : true
can_draw_intra = is_intra_enabled
can_draw_intrah = is_intrarange_enabled
can_draw_intral = is_intrarange_enabled
can_draw_intram = is_intram_enabled
pricearray := array.new_float(0)
labelarray := array.new_label(0)
/////////////////////////////////
if is_londonrange_enabled
//label.new(bar_index,high)
london_limit_right = get_limit_right(DEFAULT_EXTEND_RIGHT)
if displayStyle == 'Right Anchored'
londontime := get_limit_right(radistance)
londontime
var londonh_line = line.new(x1=londontime, x2=london_limit_right, y1=flondonhigh, y2=flondonhigh, color=LondonColor, width=DEFAULT_LINE_WIDTH, xloc=xloc.bar_time, style=linestyles)
var londonl_line = line.new(x1=londontime, x2=london_limit_right, y1=flondonlow, y2=flondonlow, color=LondonColor, width=DEFAULT_LINE_WIDTH, xloc=xloc.bar_time, style=linestyles)
var londono_line = line.new(x1=londontime, x2=london_limit_right, y1=flondonopen, y2=flondonopen, color=LondonColor, width=DEFAULT_LINE_WIDTH, xloc=xloc.bar_time, style=linestyles)
var londonh_label = label.new(x=london_limit_right, y=flondonhigh, text=lhtext, style=DEFAULT_LABEL_STYLE, textcolor=LondonColor, size=DEFAULT_LABEL_SIZE, xloc=xloc.bar_time)
var londonl_label = label.new(x=london_limit_right, y=flondonlow, text=lltext, style=DEFAULT_LABEL_STYLE, textcolor=LondonColor, size=DEFAULT_LABEL_SIZE, xloc=xloc.bar_time)
var londono_label = label.new(x=london_limit_right, y=flondonopen, text=lotext, style=DEFAULT_LABEL_STYLE, textcolor=LondonColor, size=DEFAULT_LABEL_SIZE, xloc=xloc.bar_time)
line.set_x1(londonh_line, londontime)
line.set_x2(londonh_line, london_limit_right)
line.set_y1(londonh_line, flondonhigh)
line.set_y2(londonh_line, flondonhigh)
line.set_x1(londonl_line, londontime)
line.set_x2(londonl_line, london_limit_right)
line.set_y1(londonl_line, flondonlow)
line.set_y2(londonl_line, flondonlow)
line.set_x1(londono_line, londontime)
line.set_x2(londono_line, london_limit_right)
line.set_y1(londono_line, flondonopen)
line.set_y2(londono_line, flondonopen)
label.set_x(londonh_label, london_limit_right)
label.set_y(londonh_label, flondonhigh)
label.set_text(londonh_label, lhtext)
label.set_x(londonl_label, london_limit_right)
label.set_y(londonl_label, flondonlow)
label.set_text(londonl_label, lltext)
label.set_x(londono_label, london_limit_right)
label.set_y(londono_label, flondonopen)
label.set_text(londono_label, lotext)
if mergebool
f_LevelMerge(pricearray, labelarray, flondonhigh, londonh_label, LondonColor)
f_LevelMerge(pricearray, labelarray, flondonlow, londonl_label, LondonColor)
f_LevelMerge(pricearray, labelarray, flondonopen, londono_label, LondonColor)
//////////////////////////////////////////////////////////////////////////////////
/////////////////////////////////
if is_usrange_enabled
//label.new(bar_index,high)
us_limit_right = get_limit_right(DEFAULT_EXTEND_RIGHT)
if displayStyle == 'Right Anchored'
ustime := get_limit_right(radistance)
ustime
var ush_line = line.new(x1=ustime, x2=us_limit_right, y1=fushigh, y2=fushigh, color=USColor, width=DEFAULT_LINE_WIDTH, xloc=xloc.bar_time, style=linestyles)
var usl_line = line.new(x1=ustime, x2=us_limit_right, y1=fuslow, y2=fuslow, color=USColor, width=DEFAULT_LINE_WIDTH, xloc=xloc.bar_time, style=linestyles)
var uso_line = line.new(x1=ustime, x2=us_limit_right, y1=fusopen, y2=fusopen, color=USColor, width=DEFAULT_LINE_WIDTH, xloc=xloc.bar_time, style=linestyles)
var ush_label = label.new(x=us_limit_right, y=fushigh, text=lhtext, style=DEFAULT_LABEL_STYLE, textcolor=USColor, size=DEFAULT_LABEL_SIZE, xloc=xloc.bar_time)
var usl_label = label.new(x=us_limit_right, y=fuslow, text=lltext, style=DEFAULT_LABEL_STYLE, textcolor=USColor, size=DEFAULT_LABEL_SIZE, xloc=xloc.bar_time)
var uso_label = label.new(x=us_limit_right, y=fusopen, text=lotext, style=DEFAULT_LABEL_STYLE, textcolor=USColor, size=DEFAULT_LABEL_SIZE, xloc=xloc.bar_time)
line.set_x1(ush_line, ustime)
line.set_x2(ush_line, us_limit_right)
line.set_y1(ush_line, fushigh)
line.set_y2(ush_line, fushigh)
line.set_x1(usl_line, ustime)
line.set_x2(usl_line, us_limit_right)
line.set_y1(usl_line, fuslow)
line.set_y2(usl_line, fuslow)
line.set_x1(uso_line, ustime)
line.set_x2(uso_line, us_limit_right)
line.set_y1(uso_line, fusopen)
line.set_y2(uso_line, fusopen)
label.set_x(ush_label, us_limit_right)
label.set_y(ush_label, fushigh)
label.set_text(ush_label, ushtext)
label.set_x(usl_label, us_limit_right)
label.set_y(usl_label, fuslow)
label.set_text(usl_label, usltext)
label.set_x(uso_label, us_limit_right)
label.set_y(uso_label, fusopen)
label.set_text(uso_label, usotext)
if mergebool
f_LevelMerge(pricearray, labelarray, fushigh, ush_label, USColor)
f_LevelMerge(pricearray, labelarray, fuslow, usl_label, USColor)
f_LevelMerge(pricearray, labelarray, fusopen, uso_label, USColor)
/////////////////////////////////
if is_asiarange_enabled
//label.new(bar_index,high)
asia_limit_right = get_limit_right(DEFAULT_EXTEND_RIGHT)
if displayStyle == 'Right Anchored'
asiatime := get_limit_right(radistance)
asiatime
var asiah_line = line.new(x1=asiatime, x2=asia_limit_right, y1=fasiahigh, y2=fasiahigh, color=AsiaColor, width=DEFAULT_LINE_WIDTH, xloc=xloc.bar_time, style=linestyles)
var asial_line = line.new(x1=asiatime, x2=asia_limit_right, y1=fasialow, y2=fasialow, color=AsiaColor, width=DEFAULT_LINE_WIDTH, xloc=xloc.bar_time, style=linestyles)
var asiao_line = line.new(x1=asiatime, x2=asia_limit_right, y1=fasiaopen, y2=fasiaopen, color=AsiaColor, width=DEFAULT_LINE_WIDTH, xloc=xloc.bar_time, style=linestyles)
var asiah_label = label.new(x=asia_limit_right, y=fasiahigh, text=asiahtext, style=DEFAULT_LABEL_STYLE, textcolor=AsiaColor, size=DEFAULT_LABEL_SIZE, xloc=xloc.bar_time)
var asial_label = label.new(x=asia_limit_right, y=fasialow, text=asialtext, style=DEFAULT_LABEL_STYLE, textcolor=AsiaColor, size=DEFAULT_LABEL_SIZE, xloc=xloc.bar_time)
var asiao_label = label.new(x=asia_limit_right, y=fasiaopen, text=asiaotext, style=DEFAULT_LABEL_STYLE, textcolor=AsiaColor, size=DEFAULT_LABEL_SIZE, xloc=xloc.bar_time)
line.set_x1(asiah_line, asiatime)
line.set_x2(asiah_line, asia_limit_right)
line.set_y1(asiah_line, fasiahigh)
line.set_y2(asiah_line, fasiahigh)
line.set_x1(asial_line, asiatime)
line.set_x2(asial_line, asia_limit_right)
line.set_y1(asial_line, fasialow)
line.set_y2(asial_line, fasialow)
line.set_x1(asiao_line, asiatime)
line.set_x2(asiao_line, asia_limit_right)
line.set_y1(asiao_line, fasiaopen)
line.set_y2(asiao_line, fasiaopen)
label.set_x(asiah_label, asia_limit_right)
label.set_y(asiah_label, fasiahigh)
label.set_text(asiah_label, asiahtext)
label.set_x(asial_label, asia_limit_right)
label.set_y(asial_label, fasialow)
label.set_text(asial_label, asialtext)
label.set_x(asiao_label, asia_limit_right)
label.set_y(asiao_label, fasiaopen)
label.set_text(asiao_label, asiaotext)
if mergebool
f_LevelMerge(pricearray, labelarray, fasiahigh, asiah_label, AsiaColor)
f_LevelMerge(pricearray, labelarray, fasialow, asial_label, AsiaColor)
f_LevelMerge(pricearray, labelarray, fasiaopen, asiao_label, AsiaColor)
//////////////////////////////////////////////////////////////////////////////////
//////////////////////////////////////////////////////////////////////////////////
if can_draw_intra
intra_limit_right = get_limit_right(DEFAULT_EXTEND_RIGHT)
if displayStyle == 'Right Anchored'
intra_time := get_limit_right(radistance)
intra_time
var intra_line = line.new(x1=intra_time, x2=intra_limit_right, y1=intra_open, y2=intra_open, color=IntraColor, width=DEFAULT_LINE_WIDTH, xloc=xloc.bar_time, style=linestyles)
var intra_label = label.new(x=intra_limit_right, y=intra_open, text=iotext, style=DEFAULT_LABEL_STYLE, textcolor=IntraColor, size=DEFAULT_LABEL_SIZE, xloc=xloc.bar_time)
line.set_x1(intra_line, intra_time)
line.set_x2(intra_line, intra_limit_right)
line.set_y1(intra_line, intra_open)
line.set_y2(intra_line, intra_open)
label.set_x(intra_label, intra_limit_right)
label.set_y(intra_label, intra_open)
label.set_text(intra_label, iotext)
if mergebool
f_LevelMerge(pricearray, labelarray, intra_open, intra_label, IntraColor)
//////////////////////////////////////////////////////////////////////////////////
//HIGH HIGH HIGH HIGH HIGH HIGH HIGH HIGH HIGH HIGH HIGH HIGH HIGH HIGH HIGH HIGH
if can_draw_intrah
intrah_limit_right = get_limit_right(DEFAULT_EXTEND_RIGHT)
if displayStyle == 'Right Anchored'
intrah_time := get_limit_right(radistance)
intrah_time
var intrah_line = line.new(x1=intrah_time, x2=intrah_limit_right, y1=intrah_open, y2=intrah_open, color=IntraColor, width=DEFAULT_LINE_WIDTH, xloc=xloc.bar_time, style=linestyles)
var intrah_label = label.new(x=intrah_limit_right, y=intrah_open, text=pihtext, style=DEFAULT_LABEL_STYLE, textcolor=IntraColor, size=DEFAULT_LABEL_SIZE, xloc=xloc.bar_time)
line.set_x1(intrah_line, intrah_time)
line.set_x2(intrah_line, intrah_limit_right)
line.set_y1(intrah_line, intrah_open)
line.set_y2(intrah_line, intrah_open)
label.set_x(intrah_label, intrah_limit_right)
label.set_y(intrah_label, intrah_open)
label.set_text(intrah_label, pihtext)
if mergebool
f_LevelMerge(pricearray, labelarray, intrah_open, intrah_label, IntraColor)
//////////////////////////////////////////////////////////////////////////////////
//LOW LOW LOW LOW LOW LOW LOW LOW LOW LOW LOW LOW LOW LOW LOW LOW
if can_draw_intral
intral_limit_right = get_limit_right(DEFAULT_EXTEND_RIGHT)
if displayStyle == 'Right Anchored'
intral_time := get_limit_right(radistance)
intral_time
var intral_line = line.new(x1=intral_time, x2=intral_limit_right, y1=intral_open, y2=intral_open, color=IntraColor, width=DEFAULT_LINE_WIDTH, xloc=xloc.bar_time, style=linestyles)
var intral_label = label.new(x=intral_limit_right, y=intral_open, text=piltext, style=DEFAULT_LABEL_STYLE, textcolor=IntraColor, size=DEFAULT_LABEL_SIZE, xloc=xloc.bar_time)
line.set_x1(intral_line, intral_time)
line.set_x2(intral_line, intral_limit_right)
line.set_y1(intral_line, intral_open)
line.set_y2(intral_line, intral_open)
label.set_x(intral_label, intral_limit_right)
label.set_y(intral_label, intral_open)
label.set_text(intral_label, piltext)
if mergebool
f_LevelMerge(pricearray, labelarray, intral_open, intral_label, IntraColor)
///////////////////////////////////////////////////////////////////////////////
if can_draw_intram
intram_limit_right = get_limit_right(DEFAULT_EXTEND_RIGHT)
intram_time = intrah_time
intram_open = (intral_open + intrah_open) / 2
if displayStyle == 'Right Anchored'
intram_time := get_limit_right(radistance)
intram_time
var intram_line = line.new(x1=intram_time, x2=intram_limit_right, y1=intram_open, y2=intram_open, color=IntraColor, width=DEFAULT_LINE_WIDTH, xloc=xloc.bar_time, style=linestyles)
var intram_label = label.new(x=intram_limit_right, y=intram_open, text=pimtext, style=DEFAULT_LABEL_STYLE, textcolor=IntraColor, size=DEFAULT_LABEL_SIZE, xloc=xloc.bar_time)
line.set_x1(intram_line, intram_time)
line.set_x2(intram_line, intram_limit_right)
line.set_y1(intram_line, intram_open)
line.set_y2(intram_line, intram_open)
label.set_x(intram_label, intram_limit_right)
label.set_y(intram_label, intram_open)
label.set_text(intram_label, pimtext)
if mergebool
f_LevelMerge(pricearray, labelarray, intram_open, intram_label, IntraColor)
////////////////////////////////////////// MONDAY
if is_monday_enabled
monday_limit_right = get_limit_right(DEFAULT_EXTEND_RIGHT)
if displayStyle == 'Right Anchored'
monday_time := get_limit_right(radistance)
monday_time
var monday_line = line.new(x1=monday_time, x2=monday_limit_right, y1=monday_high, y2=monday_high, color=MondayColor, width=DEFAULT_LINE_WIDTH, xloc=xloc.bar_time, style=linestyles)
var monday_label = label.new(x=monday_limit_right, y=monday_high, text=pmonhtext, style=DEFAULT_LABEL_STYLE, textcolor=MondayColor, size=DEFAULT_LABEL_SIZE, xloc=xloc.bar_time)
line.set_x1(monday_line, monday_time)
line.set_x2(monday_line, monday_limit_right)
line.set_y1(monday_line, monday_high)
line.set_y2(monday_line, monday_high)
label.set_x(monday_label, monday_limit_right)
label.set_y(monday_label, monday_high)
label.set_text(monday_label, pmonhtext)
if mergebool
f_LevelMerge(pricearray, labelarray, monday_high, monday_label, MondayColor)
if is_monday_enabled
monday_limit_right = get_limit_right(DEFAULT_EXTEND_RIGHT)
if displayStyle == 'Right Anchored'
monday_time := get_limit_right(radistance)
monday_time
var monday_low_line = line.new(x1=monday_time, x2=monday_limit_right, y1=monday_low, y2=monday_low, color=MondayColor, width=DEFAULT_LINE_WIDTH, xloc=xloc.bar_time, style=linestyles)
var monday_low_label = label.new(x=monday_limit_right, y=monday_low, text=pmonltext, style=DEFAULT_LABEL_STYLE, textcolor=MondayColor, size=DEFAULT_LABEL_SIZE, xloc=xloc.bar_time)
line.set_x1(monday_low_line, monday_time)
line.set_x2(monday_low_line, monday_limit_right)
line.set_y1(monday_low_line, monday_low)
line.set_y2(monday_low_line, monday_low)
label.set_x(monday_low_label, monday_limit_right)
label.set_y(monday_low_label, monday_low)
label.set_text(monday_low_label, pmonltext)
if mergebool
f_LevelMerge(pricearray, labelarray, monday_low, monday_low_label, MondayColor)
if is_monday_mid
mondaym_limit_right = get_limit_right(DEFAULT_EXTEND_RIGHT)
mondaym_open = (monday_high + monday_low) / 2
if displayStyle == 'Right Anchored'
monday_time := get_limit_right(radistance)
monday_time
var mondaym_line = line.new(x1=monday_time, x2=mondaym_limit_right, y1=mondaym_open, y2=mondaym_open, color=MondayColor, width=DEFAULT_LINE_WIDTH, xloc=xloc.bar_time, style=linestyles)
var mondaym_label = label.new(x=mondaym_limit_right, y=mondaym_open, text=pmonmtext, style=DEFAULT_LABEL_STYLE, textcolor=MondayColor, size=DEFAULT_LABEL_SIZE, xloc=xloc.bar_time)
line.set_x1(mondaym_line, monday_time)
line.set_x2(mondaym_line, mondaym_limit_right)
line.set_y1(mondaym_line, mondaym_open)
line.set_y2(mondaym_line, mondaym_open)
label.set_x(mondaym_label, mondaym_limit_right)
label.set_y(mondaym_label, mondaym_open)
label.set_text(mondaym_label, pmonmtext)
if mergebool
f_LevelMerge(pricearray, labelarray, mondaym_open, mondaym_label, MondayColor)
//////////////////////////////////////////////////////////////////////////////////
////////////////////////DAILY OPEN DAILY OPEN DAILY OPEN DAILY OPEN DAILY OPEN DAILY OPEN DAILY OPEN
if is_daily_enabled
daily_limit_right = get_limit_right(DEFAULT_EXTEND_RIGHT)
if displayStyle == 'Right Anchored'
daily_time := get_limit_right(radistance)
daily_time
var daily_line = line.new(x1=daily_time, x2=daily_limit_right, y1=daily_open, y2=daily_open, color=DailyColor, width=DEFAULT_LINE_WIDTH, xloc=xloc.bar_time, style=linestyles)
var daily_label = label.new(x=daily_limit_right, y=daily_open, text=dotext, style=DEFAULT_LABEL_STYLE, textcolor=DailyColor, size=DEFAULT_LABEL_SIZE, xloc=xloc.bar_time)
line.set_x1(daily_line, daily_time)
line.set_x2(daily_line, daily_limit_right)
line.set_y1(daily_line, daily_open)
line.set_y2(daily_line, daily_open)
label.set_x(daily_label, daily_limit_right)
label.set_y(daily_label, daily_open)
label.set_text(daily_label, dotext)
if mergebool
f_LevelMerge(pricearray, labelarray, daily_open, daily_label, DailyColor)
//////////////////////////////////////////////////////////////////////////////////
//////////////////DAILY HIGH DAILY HIGH DAILY HIGH DAILY HIGH DAILY HIGH DAILY HIGH DAILY HIGH
if is_dailyrange_enabled
dailyh_limit_right = get_limit_right(DEFAULT_EXTEND_RIGHT)
if displayStyle == 'Right Anchored'
dailyh_time := get_limit_right(radistance)
dailyh_time
// draw tails before lines for better visual
var dailyh_line = line.new(x1=dailyh_time, x2=dailyh_limit_right, y1=dailyh_open, y2=dailyh_open, color=DailyColor, width=DEFAULT_LINE_WIDTH, xloc=xloc.bar_time, style=linestyles)
var dailyh_label = label.new(x=dailyh_limit_right, y=dailyh_open, text=pdhtext, style=DEFAULT_LABEL_STYLE, textcolor=DailyColor, size=DEFAULT_LABEL_SIZE, xloc=xloc.bar_time)
line.set_x1(dailyh_line, dailyh_time)
line.set_x2(dailyh_line, dailyh_limit_right)
line.set_y1(dailyh_line, dailyh_open)
line.set_y2(dailyh_line, dailyh_open)
label.set_x(dailyh_label, dailyh_limit_right)
label.set_y(dailyh_label, dailyh_open)
label.set_text(dailyh_label, pdhtext)
if mergebool
f_LevelMerge(pricearray, labelarray, dailyh_open, dailyh_label, DailyColor)
//////////////////////////////////////////////////////////////////////////////////
//////////////////DAILY LOW DAILY LOW DAILY LOW DAILY LOW DAILY LOW DAILY LOW DAILY LOW DAILY LOW
if is_dailyrange_enabled
dailyl_limit_right = get_limit_right(DEFAULT_EXTEND_RIGHT)
if displayStyle == 'Right Anchored'
dailyl_time := get_limit_right(radistance)
dailyl_time
var dailyl_line = line.new(x1=dailyl_time, x2=dailyl_limit_right, y1=dailyl_open, y2=dailyl_open, color=DailyColor, width=DEFAULT_LINE_WIDTH, xloc=xloc.bar_time, style=linestyles)
var dailyl_label = label.new(x=dailyl_limit_right, y=dailyl_open, text=pdltext, style=DEFAULT_LABEL_STYLE, textcolor=DailyColor, size=DEFAULT_LABEL_SIZE, xloc=xloc.bar_time)
line.set_x1(dailyl_line, dailyl_time)
line.set_x2(dailyl_line, dailyl_limit_right)
line.set_y1(dailyl_line, dailyl_open)
line.set_y2(dailyl_line, dailyl_open)
label.set_x(dailyl_label, dailyl_limit_right)
label.set_y(dailyl_label, dailyl_open)
label.set_text(dailyl_label, pdltext)
if mergebool
f_LevelMerge(pricearray, labelarray, dailyl_open, dailyl_label, DailyColor)
//////////////////////////////////////////////////////////////////////////////// Daily MID
if is_dailym_enabled
dailym_limit_right = get_limit_right(DEFAULT_EXTEND_RIGHT)
dailym_time = dailyh_time
dailym_open = (dailyl_open + dailyh_open) / 2
if displayStyle == 'Right Anchored'
dailym_time := get_limit_right(radistance)
dailym_time
var dailym_line = line.new(x1=dailym_time, x2=dailym_limit_right, y1=dailym_open, y2=dailym_open, color=DailyColor, width=DEFAULT_LINE_WIDTH, xloc=xloc.bar_time, style=linestyles)
var dailym_label = label.new(x=dailym_limit_right, y=dailym_open, text=pdmtext, style=DEFAULT_LABEL_STYLE, textcolor=DailyColor, size=DEFAULT_LABEL_SIZE, xloc=xloc.bar_time)
line.set_x1(dailym_line, dailym_time)
line.set_x2(dailym_line, dailym_limit_right)
line.set_y1(dailym_line, dailym_open)
line.set_y2(dailym_line, dailym_open)
label.set_x(dailym_label, dailym_limit_right)
label.set_y(dailym_label, dailym_open)
label.set_text(dailym_label, pdmtext)
if mergebool
f_LevelMerge(pricearray, labelarray, dailym_open, dailym_label, DailyColor)
//////////////////////////////////////////////////////////////////////////////////
if is_weekly_enabled
weekly_limit_right = get_limit_right(DEFAULT_EXTEND_RIGHT)
cweekly_time = weekly_time
if displayStyle == 'Right Anchored'
cweekly_time := get_limit_right(radistance)
cweekly_time
var weekly_line = line.new(x1=cweekly_time, x2=weekly_limit_right, y1=weekly_open, y2=weekly_open, color=WeeklyColor, width=DEFAULT_LINE_WIDTH, xloc=xloc.bar_time, style=linestyles)
var weekly_label = label.new(x=weekly_limit_right, y=weekly_open, text=wotext, style=DEFAULT_LABEL_STYLE, textcolor=WeeklyColor, size=DEFAULT_LABEL_SIZE, xloc=xloc.bar_time)
line.set_x1(weekly_line, cweekly_time)
line.set_x2(weekly_line, weekly_limit_right)
line.set_y1(weekly_line, weekly_open)
line.set_y2(weekly_line, weekly_open)
label.set_x(weekly_label, weekly_limit_right)
label.set_y(weekly_label, weekly_open)
label.set_text(weekly_label, wotext)
if mergebool
f_LevelMerge(pricearray, labelarray, weekly_open, weekly_label, WeeklyColor)
// the weekly open can be the daily open too (monday)
// only the weekly will be draw, in these case we update its label
// if is_weekly_open and can_show_daily
// label.set_text(weekly_label, "DO / WO ")
//////////////////////////////////////////////////////////////////////////////////
////////////////////////////////////////////////////////////////////////////////// WEEKLY HIGH WEEKLY HIGH WEEKLY HIGH
if is_weeklyrange_enabled
weeklyh_limit_right = get_limit_right(DEFAULT_EXTEND_RIGHT)
if displayStyle == 'Right Anchored'
weeklyh_time := get_limit_right(radistance)
weeklyh_time
var weeklyh_line = line.new(x1=weeklyh_time, x2=weeklyh_limit_right, y1=weeklyh_open, y2=weeklyh_open, color=WeeklyColor, width=DEFAULT_LINE_WIDTH, xloc=xloc.bar_time, style=linestyles)
var weeklyh_label = label.new(x=weeklyh_limit_right, y=weeklyh_open, text=pwhtext, style=DEFAULT_LABEL_STYLE, textcolor=WeeklyColor, size=DEFAULT_LABEL_SIZE, xloc=xloc.bar_time)
line.set_x1(weeklyh_line, weeklyh_time)
line.set_x2(weeklyh_line, weeklyh_limit_right)
line.set_y1(weeklyh_line, weeklyh_open)
line.set_y2(weeklyh_line, weeklyh_open)
label.set_x(weeklyh_label, weeklyh_limit_right)
label.set_y(weeklyh_label, weeklyh_open)
label.set_text(weeklyh_label, pwhtext)
if mergebool
f_LevelMerge(pricearray, labelarray, weeklyh_open, weeklyh_label, WeeklyColor)
//////////////////////////////////////////////////////////////////////////////////
////////////////////////////////////////////////////////////////////////////////// WEEKLY LOW WEEKLY LOW WEEKLY LOW
if is_weeklyrange_enabled
weeklyl_limit_right = get_limit_right(DEFAULT_EXTEND_RIGHT)
if displayStyle == 'Right Anchored'
weeklyl_time := get_limit_right(radistance)
weeklyl_time
var weeklyl_line = line.new(x1=weeklyl_time, x2=weeklyl_limit_right, y1=weekly_open, y2=weekly_open, color=WeeklyColor, width=DEFAULT_LINE_WIDTH, xloc=xloc.bar_time, style=linestyles)
var weeklyl_label = label.new(x=weeklyl_limit_right, y=weeklyl_open, text=pwltext, style=DEFAULT_LABEL_STYLE, textcolor=WeeklyColor, size=DEFAULT_LABEL_SIZE, xloc=xloc.bar_time)
line.set_x1(weeklyl_line, weeklyl_time)
line.set_x2(weeklyl_line, weeklyl_limit_right)
line.set_y1(weeklyl_line, weeklyl_open)
line.set_y2(weeklyl_line, weeklyl_open)
label.set_x(weeklyl_label, weeklyl_limit_right)
label.set_y(weeklyl_label, weeklyl_open)
label.set_text(weeklyl_label, pwltext)
if mergebool
f_LevelMerge(pricearray, labelarray, weeklyl_open, weeklyl_label, WeeklyColor)
//////////////////////////////////////////////////////////////////////////////////
//////////////////////////////////////////////////////////////////////////////// Weekly MID
if is_weekly_mid
weeklym_limit_right = get_limit_right(DEFAULT_EXTEND_RIGHT)
weeklym_time = weeklyh_time
weeklym_open = (weeklyl_open + weeklyh_open) / 2
if displayStyle == 'Right Anchored'
weeklym_time := get_limit_right(radistance)
weeklym_time
var weeklym_line = line.new(x1=weeklym_time, x2=weeklym_limit_right, y1=weeklym_open, y2=weeklym_open, color=WeeklyColor, width=DEFAULT_LINE_WIDTH, xloc=xloc.bar_time, style=linestyles)
var weeklym_label = label.new(x=weeklym_limit_right, y=weeklym_open, text=pwmtext, style=DEFAULT_LABEL_STYLE, textcolor=WeeklyColor, size=DEFAULT_LABEL_SIZE, xloc=xloc.bar_time)
line.set_x1(weeklym_line, weeklym_time)
line.set_x2(weeklym_line, weeklym_limit_right)
line.set_y1(weeklym_line, weeklym_open)
line.set_y2(weeklym_line, weeklym_open)
label.set_x(weeklym_label, weeklym_limit_right)
label.set_y(weeklym_label, weeklym_open)
label.set_text(weeklym_label, pwmtext)
if mergebool
f_LevelMerge(pricearray, labelarray, weeklym_open, weeklym_label, WeeklyColor)
////////////////////////////////////////////////////////////////////////////////// YEEEAARRLLYY LOW LOW LOW
if is_yearlyrange_enabled
yearlyl_limit_right = get_limit_right(DEFAULT_EXTEND_RIGHT)
if displayStyle == 'Right Anchored'
yearlyl_time := get_limit_right(radistance)
yearlyl_time
var yearlyl_line = line.new(x1=yearlyl_time, x2=yearlyl_limit_right, y1=yearlyl_open, y2=yearlyl_open, color=YearlyColor, width=DEFAULT_LINE_WIDTH, xloc=xloc.bar_time, style=linestyles)
var yearlyl_label = label.new(x=yearlyl_limit_right, y=yearlyl_open, text=cyltext, style=DEFAULT_LABEL_STYLE, textcolor=YearlyColor, size=DEFAULT_LABEL_SIZE, xloc=xloc.bar_time)
line.set_x1(yearlyl_line, yearlyl_time)
line.set_x2(yearlyl_line, yearlyl_limit_right)
line.set_y1(yearlyl_line, yearlyl_open)
line.set_y2(yearlyl_line, yearlyl_open)
label.set_x(yearlyl_label, yearlyl_limit_right)
label.set_y(yearlyl_label, yearlyl_open)
label.set_text(yearlyl_label, cyltext)
if mergebool
f_LevelMerge(pricearray, labelarray, yearlyl_open, yearlyl_label, YearlyColor)
//////////////////////////////////////////////////////////////////////////////////
////////////////////////////////////////////////////////////////////////////////// YEEEAARRLLYY HIGH HIGH HIGH
if is_yearlyrange_enabled
yearlyh_limit_right = get_limit_right(DEFAULT_EXTEND_RIGHT)
if displayStyle == 'Right Anchored'
yearlyh_time := get_limit_right(radistance)
yearlyh_time
var yearlyh_line = line.new(x1=yearlyh_time, x2=yearlyh_limit_right, y1=yearlyh_open, y2=yearlyh_open, color=YearlyColor, width=DEFAULT_LINE_WIDTH, xloc=xloc.bar_time, style=linestyles)
var yearlyh_label = label.new(x=yearlyh_limit_right, y=yearlyh_open, text=cyhtext, style=DEFAULT_LABEL_STYLE, textcolor=YearlyColor, size=DEFAULT_LABEL_SIZE, xloc=xloc.bar_time)
line.set_x1(yearlyh_line, yearlyh_time)
line.set_x2(yearlyh_line, yearlyh_limit_right)
line.set_y1(yearlyh_line, yearlyh_open)
line.set_y2(yearlyh_line, yearlyh_open)
label.set_x(yearlyh_label, yearlyh_limit_right)
label.set_y(yearlyh_label, yearlyh_open)
label.set_text(yearlyh_label, cyhtext)
if mergebool
f_LevelMerge(pricearray, labelarray, yearlyh_open, yearlyh_label, YearlyColor)
//////////////////////////////////////////////////////////////////////////////////
////////////////////////////////////////////////////////////////////////////////// YEEEAARRLLYY OPEN
if is_yearly_enabled
yearly_limit_right = get_limit_right(DEFAULT_EXTEND_RIGHT)
if displayStyle == 'Right Anchored'
yearly_time := get_limit_right(radistance)
yearly_time
var yearly_line = line.new(x1=yearly_time, x2=yearly_limit_right, y1=yearly_open, y2=yearly_open, color=YearlyColor, width=DEFAULT_LINE_WIDTH, xloc=xloc.bar_time, style=linestyles)
var yearly_label = label.new(x=yearly_limit_right, y=yearly_open, text=yotext, style=DEFAULT_LABEL_STYLE, textcolor=YearlyColor, size=DEFAULT_LABEL_SIZE, xloc=xloc.bar_time)
line.set_x1(yearly_line, yearly_time)
line.set_x2(yearly_line, yearly_limit_right)
line.set_y1(yearly_line, yearly_open)
line.set_y2(yearly_line, yearly_open)
label.set_x(yearly_label, yearly_limit_right)
label.set_y(yearly_label, yearly_open)
label.set_text(yearly_label, yotext)
if mergebool
f_LevelMerge(pricearray, labelarray, yearly_open, yearly_label, YearlyColor)
//////////////////////////////////////////////////////////////////////////////////
//////////////////////////////////////////////////////////////////////////////// yearly MID
if is_yearly_mid
yearlym_limit_right = get_limit_right(DEFAULT_EXTEND_RIGHT)
yearlym_time = yearlyh_time
yearlym_open = (yearlyl_open + yearlyh_open) / 2
if displayStyle == 'Right Anchored'
yearlym_time := get_limit_right(radistance)
yearlym_time
var yearlym_line = line.new(x1=yearlym_time, x2=yearlym_limit_right, y1=yearlym_open, y2=yearlym_open, color=YearlyColor, width=DEFAULT_LINE_WIDTH, xloc=xloc.bar_time, style=linestyles)
var yearlym_label = label.new(x=yearlym_limit_right, y=yearlym_open, text=cymtext, style=DEFAULT_LABEL_STYLE, textcolor=YearlyColor, size=DEFAULT_LABEL_SIZE, xloc=xloc.bar_time)
line.set_x1(yearlym_line, yearlym_time)
line.set_x2(yearlym_line, yearlym_limit_right)
line.set_y1(yearlym_line, yearlym_open)
line.set_y2(yearlym_line, yearlym_open)
label.set_x(yearlym_label, yearlym_limit_right)
label.set_y(yearlym_label, yearlym_open)
label.set_text(yearlym_label, cymtext)
if mergebool
f_LevelMerge(pricearray, labelarray, yearlym_open, yearlym_label, YearlyColor)
////////////////////////////////////////////////////////////////////////////////// QUATERLLYYYYY OPEN
if is_quarterly_enabled
quarterly_limit_right = get_limit_right(DEFAULT_EXTEND_RIGHT)
if displayStyle == 'Right Anchored'
quarterly_time := get_limit_right(radistance)
quarterly_time
var quarterly_line = line.new(x1=quarterly_time, x2=quarterly_limit_right, y1=quarterly_open, y2=quarterly_open, color=quarterlyColor, width=DEFAULT_LINE_WIDTH, xloc=xloc.bar_time, style=linestyles)
var quarterly_label = label.new(x=quarterly_limit_right, y=quarterly_open, text=qotext, style=DEFAULT_LABEL_STYLE, textcolor=quarterlyColor, size=DEFAULT_LABEL_SIZE, xloc=xloc.bar_time)
line.set_x1(quarterly_line, quarterly_time)
line.set_x2(quarterly_line, quarterly_limit_right)
line.set_y1(quarterly_line, quarterly_open)
line.set_y2(quarterly_line, quarterly_open)
label.set_x(quarterly_label, quarterly_limit_right)
label.set_y(quarterly_label, quarterly_open)
label.set_text(quarterly_label, qotext)
if mergebool
f_LevelMerge(pricearray, labelarray, quarterly_open, quarterly_label, quarterlyColor)
//////////////////////////////////////////////////////////////////////////////////
////////////////////////////////////////////////////////////////////////////////// QUATERLLYYYYY High
if is_quarterlyrange_enabled
quarterlyh_limit_right = get_limit_right(DEFAULT_EXTEND_RIGHT)
if displayStyle == 'Right Anchored'
quarterlyh_time := get_limit_right(radistance)
quarterlyh_time
var quarterlyh_line = line.new(x1=quarterlyh_time, x2=quarterlyh_limit_right, y1=quarterlyh_open, y2=quarterlyh_open, color=quarterlyColor, width=DEFAULT_LINE_WIDTH, xloc=xloc.bar_time, style=linestyles)
var quarterlyh_label = label.new(x=quarterlyh_limit_right, y=quarterlyh_open, text=pqhtext, style=DEFAULT_LABEL_STYLE, textcolor=quarterlyColor, size=DEFAULT_LABEL_SIZE, xloc=xloc.bar_time)
line.set_x1(quarterlyh_line, quarterlyh_time)
line.set_x2(quarterlyh_line, quarterlyh_limit_right)
line.set_y1(quarterlyh_line, quarterlyh_open)
line.set_y2(quarterlyh_line, quarterlyh_open)
label.set_x(quarterlyh_label, quarterlyh_limit_right)
label.set_y(quarterlyh_label, quarterlyh_open)
label.set_text(quarterlyh_label, pqhtext)
if mergebool
f_LevelMerge(pricearray, labelarray, quarterlyh_open, quarterlyh_label, quarterlyColor)
//////////////////////////////////////////////////////////////////////////////////
////////////////////////////////////////////////////////////////////////////////// QUATERLLYYYYY Low
if is_quarterlyrange_enabled
quarterlyl_limit_right = get_limit_right(DEFAULT_EXTEND_RIGHT)
if displayStyle == 'Right Anchored'
quarterlyl_time := get_limit_right(radistance)
quarterlyl_time
var quarterlyl_line = line.new(x1=quarterlyl_time, x2=quarterlyl_limit_right, y1=quarterlyl_open, y2=quarterlyl_open, color=quarterlyColor, width=DEFAULT_LINE_WIDTH, xloc=xloc.bar_time, style=linestyles)
var quarterlyl_label = label.new(x=quarterlyl_limit_right, y=quarterlyl_open, text=pqltext, style=DEFAULT_LABEL_STYLE, textcolor=quarterlyColor, size=DEFAULT_LABEL_SIZE, xloc=xloc.bar_time)
line.set_x1(quarterlyl_line, quarterlyl_time)
line.set_x2(quarterlyl_line, quarterlyl_limit_right)
line.set_y1(quarterlyl_line, quarterlyl_open)
line.set_y2(quarterlyl_line, quarterlyl_open)
label.set_x(quarterlyl_label, quarterlyl_limit_right)
label.set_y(quarterlyl_label, quarterlyl_open)
label.set_text(quarterlyl_label, pqltext)
if mergebool
f_LevelMerge(pricearray, labelarray, quarterlyl_open, quarterlyl_label, quarterlyColor)
//////////////////////////////////////////////////////////////////////////////////
//////////////////////////////////////////////////////////////////////////////// QUATERLLYYYYY MID
if is_quarterly_mid
quarterlym_limit_right = get_limit_right(DEFAULT_EXTEND_RIGHT)
quarterlym_time = quarterlyh_time
quarterlym_open = (quarterlyl_open + quarterlyh_open) / 2
if displayStyle == 'Right Anchored'
quarterlym_time := get_limit_right(radistance)
quarterlym_time
var quarterlym_line = line.new(x1=quarterlym_time, x2=quarterlym_limit_right, y1=quarterlym_open, y2=quarterlym_open, color=quarterlyColor, width=DEFAULT_LINE_WIDTH, xloc=xloc.bar_time, style=linestyles)
var quarterlym_label = label.new(x=quarterlym_limit_right, y=quarterlym_open, text=pqmtext, style=DEFAULT_LABEL_STYLE, textcolor=quarterlyColor, size=DEFAULT_LABEL_SIZE, xloc=xloc.bar_time)
line.set_x1(quarterlym_line, quarterlym_time)
line.set_x2(quarterlym_line, quarterlym_limit_right)
line.set_y1(quarterlym_line, quarterlym_open)
line.set_y2(quarterlym_line, quarterlym_open)
label.set_x(quarterlym_label, quarterlym_limit_right)
label.set_y(quarterlym_label, quarterlym_open)
label.set_text(quarterlym_label, pqmtext)
if mergebool
f_LevelMerge(pricearray, labelarray, quarterlym_open, quarterlym_label, quarterlyColor)
////////////////////////////////////////////////////////////////////////////////// Monthly LOW LOW LOW
if is_monthlyrange_enabled
monthlyl_limit_right = get_limit_right(DEFAULT_EXTEND_RIGHT)
if displayStyle == 'Right Anchored'
monthlyl_time := get_limit_right(radistance)
monthlyl_time
var monthlyl_line = line.new(x1=monthlyl_time, x2=monthlyl_limit_right, y1=monthlyl_open, y2=monthlyl_open, color=MonthlyColor, width=DEFAULT_LINE_WIDTH, xloc=xloc.bar_time, style=linestyles)
var monthlyl_label = label.new(x=monthlyl_limit_right, y=monthlyl_open, text=pmltext, style=DEFAULT_LABEL_STYLE, textcolor=MonthlyColor, size=DEFAULT_LABEL_SIZE, xloc=xloc.bar_time)
line.set_x1(monthlyl_line, monthlyl_time)
line.set_x2(monthlyl_line, monthlyl_limit_right)
line.set_y1(monthlyl_line, monthlyl_open)
line.set_y2(monthlyl_line, monthlyl_open)
label.set_x(monthlyl_label, monthlyl_limit_right)
label.set_y(monthlyl_label, monthlyl_open)
label.set_text(monthlyl_label, pmltext)
if mergebool
f_LevelMerge(pricearray, labelarray, monthlyl_open, monthlyl_label, MonthlyColor)
// the weekly open can be the daily open too (monday)
// only the weekly will be draw, in these case we update its label
//////////////////////////////////////////////////////////////////////////////////
////////////////////////////////////////////////////////////////////////////////// MONTHLY HIGH HIGH HIGH
if is_monthlyrange_enabled
monthlyh_limit_right = get_limit_right(DEFAULT_EXTEND_RIGHT)
if displayStyle == 'Right Anchored'
monthlyh_time := get_limit_right(radistance)
monthlyh_time
var monthlyh_line = line.new(x1=monthlyh_time, x2=monthlyh_limit_right, y1=monthlyh_open, y2=monthlyh_open, color=MonthlyColor, width=DEFAULT_LINE_WIDTH, xloc=xloc.bar_time, style=linestyles)
var monthlyh_label = label.new(x=monthlyh_limit_right, y=monthlyh_open, text=pmhtext, style=DEFAULT_LABEL_STYLE, textcolor=MonthlyColor, size=DEFAULT_LABEL_SIZE, xloc=xloc.bar_time)
line.set_x1(monthlyh_line, monthlyl_time)
line.set_x2(monthlyh_line, monthlyh_limit_right)
line.set_y1(monthlyh_line, monthlyh_open)
line.set_y2(monthlyh_line, monthlyh_open)
label.set_x(monthlyh_label, monthlyh_limit_right)
label.set_y(monthlyh_label, monthlyh_open)
label.set_text(monthlyh_label, pmhtext)
if mergebool
f_LevelMerge(pricearray, labelarray, monthlyh_open, monthlyh_label, MonthlyColor)
// the weekly open can be the daily open too (monday)
// only the weekly will be draw, in these case we update its label
//////////////////////////////////////////////////////////////////////////////// MONTHLY MID
if is_monthly_mid
monthlym_limit_right = get_limit_right(DEFAULT_EXTEND_RIGHT)
monthlym_time = monthlyh_time
monthlym_open = (monthlyl_open + monthlyh_open) / 2
if displayStyle == 'Right Anchored'
monthlym_time := get_limit_right(radistance)
monthlym_time
var monthlym_line = line.new(x1=monthlym_time, x2=monthlym_limit_right, y1=monthlym_open, y2=monthlym_open, color=MonthlyColor, width=DEFAULT_LINE_WIDTH, xloc=xloc.bar_time, style=linestyles)
var monthlym_label = label.new(x=monthlym_limit_right, y=monthlym_open, text=pmmtext, style=DEFAULT_LABEL_STYLE, textcolor=MonthlyColor, size=DEFAULT_LABEL_SIZE, xloc=xloc.bar_time)
line.set_x1(monthlym_line, monthlym_time)
line.set_x2(monthlym_line, monthlym_limit_right)
line.set_y1(monthlym_line, monthlym_open)
line.set_y2(monthlym_line, monthlym_open)
label.set_x(monthlym_label, monthlym_limit_right)
label.set_y(monthlym_label, monthlym_open)
label.set_text(monthlym_label, pmmtext)
if mergebool
f_LevelMerge(pricearray, labelarray, monthlym_open, monthlym_label, MonthlyColor)
//////////////////////////////////////////////////////////////////////////////////
if is_monthly_enabled
monthly_limit_right = get_limit_right(DEFAULT_EXTEND_RIGHT)
if displayStyle == 'Right Anchored'
monthly_time := get_limit_right(radistance)
monthly_time
var monthlyLine = line.new(x1=monthly_time, x2=monthly_limit_right, y1=monthly_open, y2=monthly_open, color=MonthlyColor, width=DEFAULT_LINE_WIDTH, xloc=xloc.bar_time, style=linestyles)
var monthlyLabel = label.new(x=monthly_limit_right, y=monthly_open, text=motext, style=DEFAULT_LABEL_STYLE, textcolor=MonthlyColor, size=DEFAULT_LABEL_SIZE, xloc=xloc.bar_time)
line.set_x1(monthlyLine, monthly_time)
line.set_x2(monthlyLine, monthly_limit_right)
line.set_y1(monthlyLine, monthly_open)
line.set_y2(monthlyLine, monthly_open)
label.set_x(monthlyLabel, monthly_limit_right)
label.set_y(monthlyLabel, monthly_open)
label.set_text(monthlyLabel, motext)
if mergebool
f_LevelMerge(pricearray, labelarray, monthly_open, monthlyLabel, MonthlyColor)
/////////////////////////////////////////////////////////////////////////////
// the monthly open can be the weekly open (monday 1st) and/or daily open too
// only the monthly will be draw, in these case we update its label
// if is_monthly_open
// if can_show_daily
// label.set_text(monthlyLabel, "DO / MO ")
// if is_weekly_open
// if can_show_weekly
// label.set_text(monthlyLabel, "WO / MO ")
// if can_show_daily and can_show_weekly
// label.set_text(monthlyLabel, "DO / WO / MO ")
// the start of the line is drew from the first week of the month
// if the first day of the weekly candle (monday) is the 2nd of the month
// we fix the start of the line position on the Prev weekly candle
if timeframe.isweekly and dayofweek(monthly_time) != dayofweek.monday
line.set_x1(monthlyLine, monthly_time - (weekly_time - weekly_time ))
