In den Scripts nach "wave" suchen

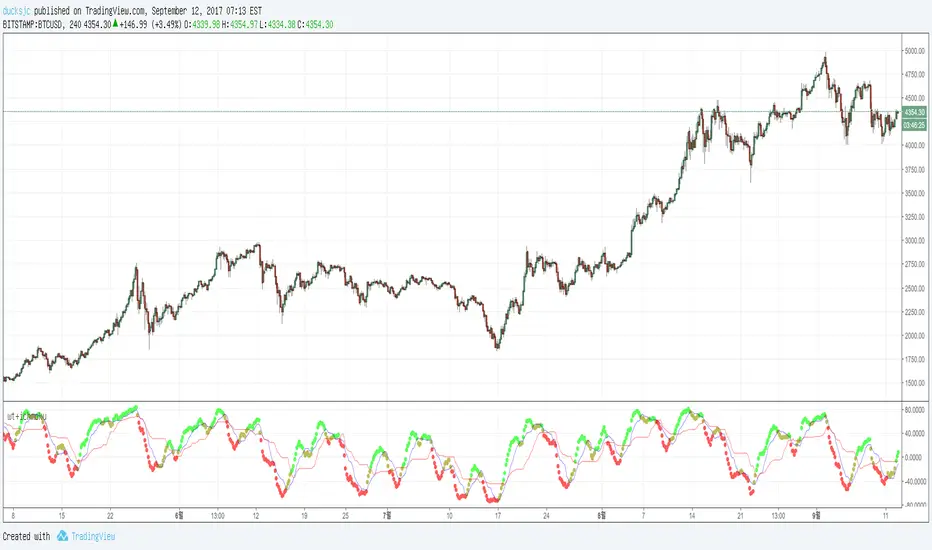
wt+ichmokuwaveTrend is very very very nice script.
and i also like ichmoku
yesterday 'nssoholik' gave me some idea that is rsi+ichmoku
and this is wt+ichmoku
easily
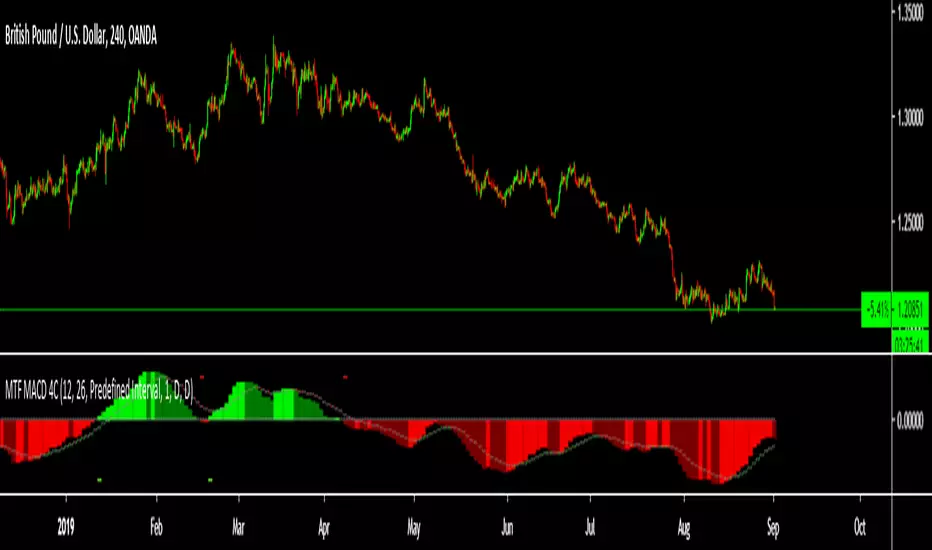
red to green = buy
green to red = sell
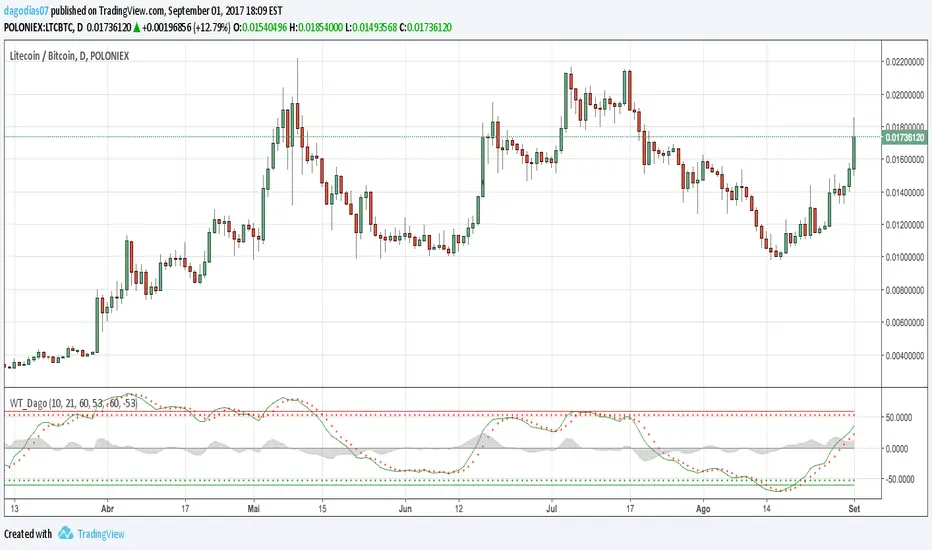
WaveTrend [DagoDias]@author LazyBear -- Modificado por Dagodias adicionado títulos às variáveis e traduzido para o Português.
Através dos títulos fica melhor para customizar o indicador e criar alertas a partir do indicador.
Para utilização em Criptomoedas acredito ser interessante suavemente levantar as linhas base; tornando a área de sobre venda antecipada.
Este indicador não é recomendado para fortes tendências.
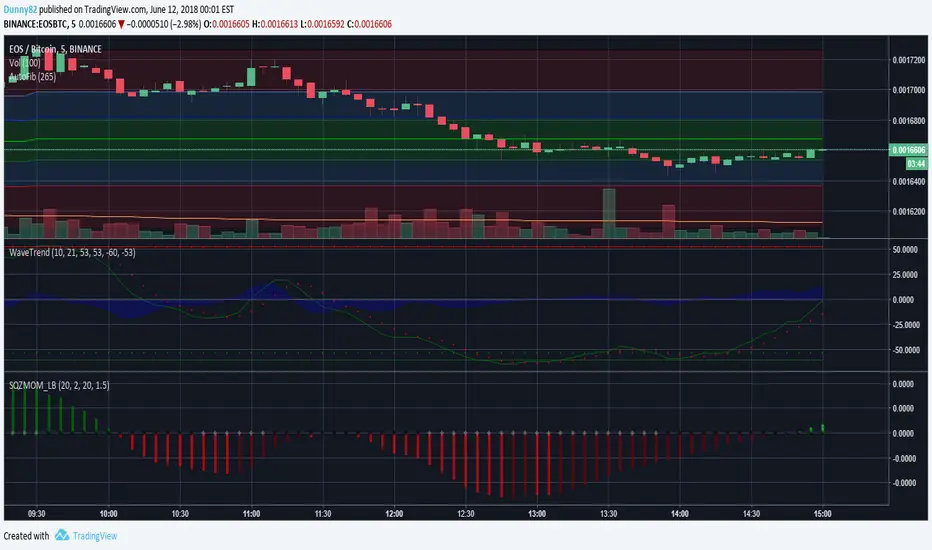
WaveTrend [MastroFran]Great indicator to show short term price movements. 5 day moving average oscillator. When green crosses red and under the 60 mark, buy with caution. when over the 60 mark and red crosses green sell immediately for highest profits.

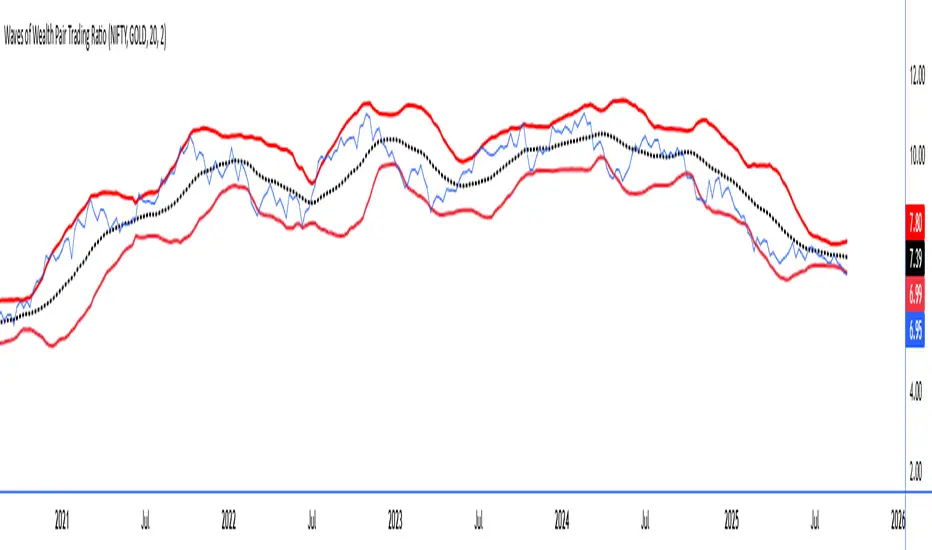
Waves of Wealth Pair Trading RatioThis versatile indicator dynamically plots the ratio between two user-selected instruments, helping traders visualize relative performance and detect potential mean-reversion or trend continuation opportunities.
Features include:
User inputs for selecting any two instrument symbols for comparison.
Adjustable moving average period to track the average ratio over time.
Customizable standard deviation multiplier to define statistical bands for overbought and oversold conditions.
Visual display of the ratio line alongside upper and lower bands for clear trading signals.
Ideal for pair traders and market analysts seeking a flexible tool to monitor inter-asset relationships and exploit deviations from historical norms.
Simply set your preferred symbols and parameters to tailor the indicator to your trading style and assets of interest.
How to Use the Custom Pair Trading Ratio Indicator
Select symbols: Use the indicator inputs to set any two instruments you want to compare—stocks, commodities, ETFs, or indices. No coding needed, just type or select from the dropdown.
Adjust parameters: Customize the moving average length to suit your trading timeframe and style. The standard deviation multiplier lets you control sensitivity—higher values mean wider bands, capturing only larger deviations.
Interpret the chart:
The ratio line shows relative strength between the two instruments.
The middle line represents the average ratio (mean).
The upper and lower bands indicate statistical extremes where price action is usually overextended.
Trading signals:
Look to enter pair trades when the ratio moves outside the bands—expecting a return to the mean.
Use the bands and mean to set stop-loss and profit targets.
Combine with other analysis or fundamental insight for best results.
JooNim_Wave Trend_Multi Time FrameWave Trend Multi Time Frame
웨이브 트렌드 멀티타임 프레임입니다.
과매수 혹은 과매도 구간에서 자동으로 화살표가 나오게끔 설정이 되어 있습니다.
15분 / 30분 / 1시간 /4시간 / 일봉 에서의 과매수 과매도 구간을 확인하실 수 있습니다.
앞전에 올렸던 Wave Trend Multi Time Frame Indicator와 함께 사용하시면 큰 도움이 될 것이라고 예상됩니다.
하나의 단순한 지표이므로 모든 상하향 방향성을 다 맞출순 없습니다.
다른 다양한 지표와 함께 사용하심을 권장합니다.
사용이 필요하신분들은 언제든지 댓글 달아주시기 바랍니다 ^-^!
Wave trend multi-time frame.
It is set so that the arrow automatically appears in the overbought or oversold section.
15 minutes / 30 minutes / 1 hour / 4 hours / You can check the oversold section at daily wages.
It is expected to be of great help when used in conjunction with the Wave Trend Multi Time Frame Indicator previously posted.
As it is a simple indicator, it is impossible to match all directions in the up and down direction.
It is recommended to use it with various other indicators.
If you need to use, please comment anytime ^-^!

Wave MasterThis indicator will automatically paint the candles in Green/Red if they are Above/Below the inputted MA, which will also be Green when up and Red when down.
The default MA setting is 60 periods.
There's also a longer term MA pre-setted at 200 periods to give you a longer term perspective of Trend.
All of this concept is from the work of @Kazonomics


Wave Trend Arrows [Salty]This is just like WT_LB, but with arrows that increase in size to show cross over points. The larger down arrows indicate resistance for overbought levels, and the larger up arrows indicate support for oversold levels.


Wave SMA As far as i can tell there is no other SMA thats works the same, the signal line changes color if closing above or below it.


JK Scalp - Nishith RajwarJK Scalp Nishith Rajwar
Multi-Stochastic Rotation & Momentum Scalping Framework
JK Scalp is a rule-based momentum and rotation oscillator designed for short-term scalping and intraday execution.
It focuses on how momentum rotates across multiple stochastic speeds, instead of relying on a single oscillator or lagging averages.
This is an execution aid, not a predictive indicator.
🧠 Concept & Originality
Unlike standard stochastic tools, JK Scalp uses four synchronized stochastic layers:
• Fast (9,3) → execution timing
• Medium (14,3) → structure confirmation
• Slow (44,3) → swing context
• Trend (60,10,10) → dominant momentum regime
The core idea is quad-rotation:
High-probability trades occur when all momentum layers rotate together after reaching an extreme.
This script combines:
• Momentum rotation
• Divergence logic
• Flag continuation logic
• Trend-state filtering
into a single cohesive framework, not a simple indicator mashup.
📊 How to Use (Step-by-Step)
1️⃣ Best Timeframes
• Scalping: 1m – 3m
• Intraday: 5m – 15m
• Avoid higher timeframes (not designed for swing holding)
Works best on:
• Index options
• Index futures
• Highly liquid stocks
• Crypto majors
2️⃣ Understanding the Signals
🔁 Quad Rotation (Core Signal)
A valid rotation requires:
• Fast, Medium, Slow, and Trend stochastic moving in the same direction
• Momentum exiting Overbought / Oversold zones
• Trend stochastic supporting the move
This filters out random oscillator noise.
3️⃣ Entry Conditions
🟢 LONG Setup
• Bullish quad rotation
• Either:
– Bullish divergence OR
– Bullish flag pullback
• Fast stochastic turning up
🔴 SHORT Setup
• Bearish quad rotation
• Either:
– Bearish divergence OR
– Bearish flag pullback
• Fast stochastic turning down
⚠️ Signals are confirmation-based, not anticipatory.
4️⃣ SUPER LONG / SUPER SHORT
These appear only when:
• Quad rotation
• Divergence confirmation
They represent high-confidence momentum inflection zones, not guaranteed reversals.
5️⃣ Stop-Loss Visualization
Optional SL zones are plotted using:
• Recent swing high / low
• ATR-based buffer (configurable)
This helps traders visualize risk, not automate exits.
🎨 Visual System (Why It Looks Different)
• Multi-layer glow effects → momentum strength
• Dynamic cloud → fast vs trend dominance
• Color-shifting fast line → acceleration vs decay
• Chart overlays → execution clarity without clutter
Everything is designed for speed and readability during live trading.
⭐ Unique Selling Points (USP)
✅ Multi-speed stochastic rotation (not single-line signals)
✅ Context-first, not signal spam
✅ Built-in divergence + continuation logic
✅ Non-repainting logic
✅ Designed for scalpers, not hindsight analysis
✅ Works across indices, options, crypto, and futures
⚠️ Important Notes
• Not a standalone trading system
• Best combined with:
– Market structure
– Key levels
– Session timing
• Avoid low-liquidity or news-spike candles
This indicator guides execution, it does not replace discretion.
👤 Who This Is For
• Scalpers & intraday traders
• Options traders needing precise timing
• Traders who understand momentum & structure
• Users who want fewer but higher-quality signals
🏁 Summary
JK Scalp helps you trade momentum rotation, not overbought/oversold myths.
Wait for alignment. Execute with discipline.
