Macro Score - Dem. Fib. McGinley DynamicsA "macro score", as defined here, is created by giving various weights to different signals and adding them together to get one smooth score. Positive or negative values are assigned to each of the signals depending on if the statement is true or false (e.g. DPO > 0: +1, DPO < 0: -1). This manner of strategy allows for a subset of the available signals to be present at one time as opposed to every technical signal having to be active in order for a long/short signal to trigger.
The DFMG - Democratic Fibonacci McGinley Dynamic - is a separate indicator that we have released that takes 10 different Fibonacci McGinley Dynamics (lengths of 3 to 233, at Fibonacci intervals) and averages them to form the DFMG line. This helps by creating a consensus on the trend based on these dynamic lines alone. Crossovers of the DFMG with the various McGinley lengths as well as a cross of the price source and these lines can provide adequate long and short signals.
This strategy has the signals and weights pre-determined in the code. Heaviest weights have been given to crosses of the DFMG line/McGinley(233) as well as the crosses of the McGinley(3)/DFMG. Additionally, there are thresholds for DPO ( Detrended Price Oscillator , above or below 0), CMO ( Chande Momentum Oscillator , above or below 0), Jurik Volatility Bands (above or below 0), and Stoch RSI (above or below 50). These four signals hold a lighter weight than the McGinley cross signals.
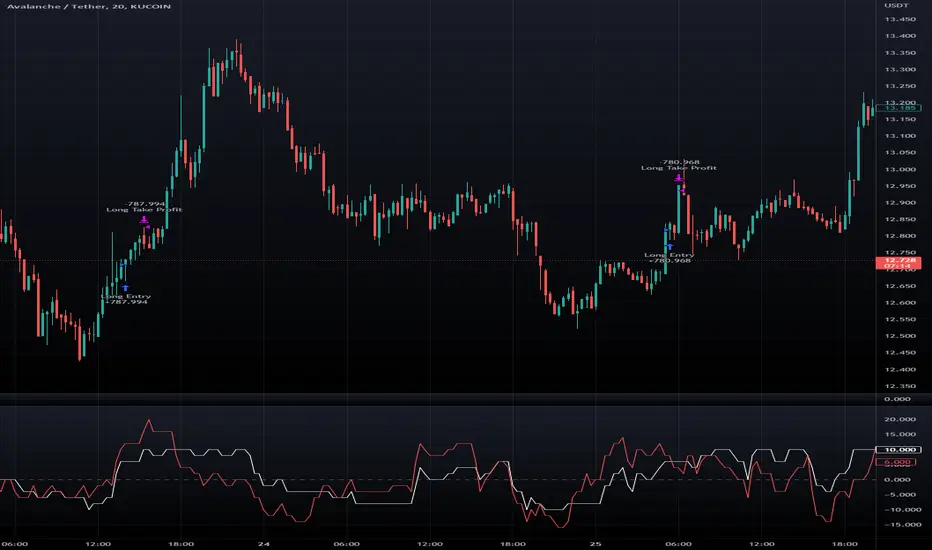
The macro score itself is printed in an underlay as a white line that goes between -10 and 10 for this strategy. In addition to the macro score line, a green momentum line (sourced by the macro score itself) has been included. A crossover/crossunder of the macro score and the macro momentum line is included into the long/short signal syntax in addition to long and short thresholds for the macro score, defaulted to 5 and -5 respectively.
Take profit, stop loss, and trailing percentages are also included, found at the bottom of the Input tab under “TT and TTP” as well as “Stop Loss”. Make sure to understand the TP/SL ratio that you desire before use, as the desired hit rate/profitability percentage will be affected accordingly. The option for adding in a trailing stop has also been included, with options to choose between an ATR-based trail or a percentage-based trail.
This strategy does NOT guarantee future returns. Apply caution in trading regardless of discretionary or algorithmic. Understand the concepts of risk/reward and the intricacies of each strategy choice before utilizing them in your personal trading.
Profitview/Pineconnector Settings:
If you wish to utilize Profitview’s automation system, find the included “Profitview Settings” under the Input tab of the strategy settings menu. If not, skip this section entirely as it can be left blank. Options will be “OPEN LONG TITLE”, “OPEN SHORT TITLE”, “CLOSE LONG TITLE”, and “CLOSE SHORT TITLE”. If you wished to trade SOL, for example, you would put “SOL LONG”, “SOL SHORT”, “SOL CLOSE LONG”, and “SOL CLOSE SHORT” in these areas. Within your Profitview extension, ensure that your Alerts all match these titles. To set an alert for use with Profitview, go to the “Alerts” tab in TradingView, then create an alert. Make sure that your desired asset and timeframe are currently displayed on your screen when creating the alert. Under the “Condition” option of the alert, select the strategy, then select the expiration time. If using TradingView Premium, this can be open-ended. Otherwise, select your desired expiration time and date. This can be updated whenever desired to ensure the strategy does not expire. Under “Alert actions”, nothing necessarily needs to be selected unless so desired. Leave the “Alert name” option empty. For the “Message”, delete the generated message and replace it with {{strategy.order.alert_message}} and nothing else. If using Pineconnector, follow the same directions for setting up an alert, but use the " ,buy, ,risk=" syntax as noted in the tooltips.
Default Properties for AVAX 20M:
DPO - 35 , uncentered
CMO - 25, open
K/D - 3/3
RSI Stoch Length - 3
Stoch Length - 4
Stoch Source - open
JVB Length - 14
JVB Smoothing - 2
DFMG source - close
Macro Length - 14
TP % - 1.5%
TTP % - 0.005%
SL % - 1.8%, no trail
In den Scripts nach "the strat" suchen

Weird Renko StratThis strategy uses Renko, it generates a signal when there is a reversal in Renko. When using historical data, it provides a good entry and an okay exit. However, in a real-time environment, this strategy is subject to repaint and may produce a false signal.
As a result, the backtesting result should not be used as a metric to predict future results. It is highly recommended to forward-test the strategy before using it in real trading. I forward test it from 12/18/2022 to 12/21/2022 in paper trading, using the alert feature in Tradingview. I made 60 trades trading the BTCUSDT BINANCE 3 min with 26 as the param and under the condition that I use 20x margin, compounding my yield, and having 0 trading fee, a steady loss is generated: from $10 to $3.02.
This is quite interesting. As if I flip the signal from "Long" to "Short" and another way too, it will be a steady profit from $10 to $21.85. Hence, if I'm trying to anti-trade the real-time alert signal, the current "4 Days Result" will be good. Nevertheless, I still have to forward-test it for longer to see if it will fail eventually.
Dive into the setting of the strategy
- Margin is the leverage you use. 1 means 1x, 10 means 10x. It affects the backtest yield when you backtest
- Compound Yield button is for compound calculation, disable it to go back to normal backtesting
- Anti Strategy button is to do the opposite direction trade, when the original strat told you to "Long", you "Short" instead. Enable it to use the feature
- Param is the block size for the Renko chart
- Drawdown is just a visual tool for you in case you want to place a stop loss (represent by the semitransparent red area in the chart)
- From date Thru Date is to specify the backtest range of the strategy, This feature is turned off by default. It is controlled by the Max Backtest Timeframe which will be explain below
- Max Backtest Timeframe control the From date Thru Date function, disable it to enable the From Date Thru Date function
Param is the most important input in this strategy as it directly affects performance. It is highly recommended to backtest nearly all the possible parameters before deploying it in real trading. Some factors should be considered:
- Price of the asset (like an asset of 1 USD vs an asset of 10000 USD required different param)
- Timeframe (1-minute param is different than 1-month param)
I believe this is caused by the volatility of the selected timeframe since different timeframe has different volatility. Param should be fine-tuned before usage.
Here is the param I'm using:
BTCUSDT BINANCE 3min: 26
BTCUSDT BINANCE 5min: 28
BTCUSDT BINANCE 1day: 15
Background of the strategy:
- The strategy starts with $10 at the start of backtesting (customizable in setting)
- The trading fee is set to 0.00% which is not common for most of the popular exchanges (customizable in setting)
- The contract size is not a fixed amount, but it uses your balance to buy it at the open price. If you are using the compound mode, your balance will be your current total balance. If you are using the non-compound mode, it will just use the $10 you start with unless you change the amount you start with. If you are using a margin higher than 1, it will calculate the corresponding contract size properly based on your margin. (Only these options are allowed, you are not able to change them without changing the code)

Macro Score - DFMA-BasedA "macro score", as defined here, is created by giving various weights to different signals and adding them together to get one smooth score. Positive or negative values are assigned to each of the signals depending on if the statement is true or false (e.g. DPO > 0: +1, DPO < 0: -1). This manner of strategy allows for a subset of the available signals to be present at one time as opposed to every technical signal having to be active in order for a long/short signal to trigger.
The DFMA - Democratic Fibonacci Moving Average - is a separate indicator that we have released that takes 10 different Fibonacci MAs (lengths of 3 to 233, at Fibonacci intervals) and averages them to form the DFMA line. This helps by creating a consensus on the trend based on moving averages alone. Crossovers of the DFMA with the various Fib MA lengths as well as a cross of the price source and these lines can provide adequate long and short signals.
This strategy has the signals and weights pre-determined in the code. Heaviest weights have been given to crosses of the DFMA line/Fib MA (233) as well as the crosses of the Fib MA (3)/DFMA. Additionally, there are thresholds for DPO ( Detrended Price Oscillator , above or below 0), CMO ( Chande Momentum Oscillator , above or below 0), Jurik Volatility Bands (above or below 0), and Stoch RSI (above or below 50). These foursignals hold a lighter weight than the MA cross signals.
The macro score itself is printed in an underlay as a white line that goes between -10 and 10 for this strategy. In addition to the macro score line, a blue momentum line (sourced by the macro score itself) has been included. A crossover/crossunder of the macro score and the macro momentum line is included into the long/short signal syntax in addition to a threshold for the macro score (-5/5).
Take profit, stop loss, and trailing percentages are also included, found at the bottom of the Input tab under “TT and TTP” as well as “Stop Loss”. Make sure to understand the TP/SL ratio that you desire before use, as the desired hit rate/profitability percentage will be affected accordingly. This strategy does NOT guarantee future returns. Apply caution in trading regardless of discretionary or algorithmic. Understand the concepts of risk/reward and the intricacies of each strategy choice before utilizing them in your personal trading.
Profitview Settings:
If you wish to utilize Profitview’s automation system, find the included “Profitview Settings” under the Input tab of the strategy settings menu. If not, skip this section entirely as it can be left blank. Options will be “OPEN LONG TITLE”, “OPEN SHORT TITLE”, “CLOSE LONG TITLE”, and “CLOSE SHORT TITLE”. If you wished to trade SOL, for example, you would put “SOL LONG”, “SOL SHORT”, “SOL CLOSE LONG”, and “SOL CLOSE SHORT” in these areas. Within your Profitview extension, ensure that your Alerts all match these titles. To set an alert for use with Profitview, go to the “Alerts” tab in TradingView, then create an alert. Make sure that your desired asset and timeframe are currently displayed on your screen when creating the alert. Under the “Condition” option of the alert, select the strategy, then select the expiration time. If using TradingView Premium, this can be open-ended. Otherwise, select your desired expiration time and date. This can be updated whenever desired to ensure the strategy does not expire. Under “Alert actions”, nothing necessarily needs to be selected unless so desired. Leave the “Alert name” option empty. For the “Message”, delete the generated message and replace it with {{strategy.order.alert_message}} and nothing else.
Default Properties, for AVAX 20M:
DPO - 40, uncentered
CMO - 25, open
K/D - 3/3
RSI Stoch Length - 3
Stoch Length - 4
Stoch Source - open
JVB Length - 25
JVB Smoothing - 2
DFMA source - close
Macro Length - 13
TP % - 1.5%
TTP % - 0.005%
SL % - 2%

MACD + RSI + ADX Strategy (ChatGPT-powered) by TradeSmartThis is a trading strategy made by TradeSmart, using the recommendations given by ChatGPT . As an experiment, we asked ChatGPT on which indicators are the most popular for trading. We used all of the recommendations given, and added more. We ended up with a strategy that performs surprisingly well on many crypto and forex assets. See below for exact details on what logic was implemented and how you can change the parameters of the strategy.
The strategy is a Christmas special , this is how we would like to thank the support of our followers.
The strategy has performed well on Forex, tested on 43 1-hour pairs and turned a profit in 21 cases. Also it has been tested on 51 crypto pairs using the 1-hour timeframe, and turned a profit in 45 cases with a Profit Factor over 1.4 in the top-5 cases. Tests were conducted without commission or slippage, unlike the presented result which uses 0.01% commission and 5 tick slippage.
Some of the top performers were:
SNXUSDT
SOLUSDT
CAKEUSDT
LINKUSDT
EGLDUSDT
GBPJPY
TRYJPY
USDJPY
The strategy was implemented using the following logic:
Entry strategy:
Long entry:
Price should be above the Simple Moving Average (SMA)
There should be a cross up on the MACD (indicated by the color switch on the histogram, red to green)
RSI should be above the 50 level
Volume is above the selected volume-based Exponential Moving Average (EMA)
ADX should also agree to this position: below 50 and over 20, and above the Regularized Moving Average (REMA)
Short entry:
Price should be under the Simple Moving Average (SMA)
There should be a cross down on the MACD (indicated by the color switch on the histogram, red to green)
RSI should be below the 50 level
Volume is above the selected volume-based Exponential Moving Average (EMA)
ADX should also agree to this position: below 50 and over 20, and above the Regularized Moving Average (REMA)
Exit strategy:
Stop Loss will be placed based on ATR value (with 1.5 Risk)
Take profit level will be placed with a 2.5 Risk/Reward Ratio
Open positions will be closed early based on the Squeeze Momentum (Long: change to red, Short: change to green)
NOTE! : The position sizes used in the example is with 'Risk Percentage (current)', according which the position size will be determined such
that the potential loss is equal to % of the current available capital. This means that in most of the cases, the positions are calculated using leverage.
Parameters of every indicator used in the strategy can be tuned in the strategy settings as follows:
Plot settings:
Plot Signals: true by default, Show all Long and Short signals on the signal candle
Allow early TP/SL plots: false by default, Checking this option will result in the TP and SL lines to be plotted also on the signal candle rather than just the entry candle. Consider this only when manual trading, since backtest entries does not happen on the signal candle.
Entry Signal:
Fast Length: 12 by default
Slow Length: 26 by default
Source: hlcc4 by default
Signal Smoothing: 9 by default
Oscillator MA Type: EMA by default
Signal Line MA Type: EMA by default
Exit Strategy:
ATR Based Stop Loss: true by default
ATR Length (of the SL): 14 by default
ATR Smoothing (of the SL): EMA by default
Candle Low/High Based Stop Loss: false by default, recent lowest or highest point (depending on long/short position) will be used to calculate stop loss value. Set 'Base Risk Multiplier' to 1 if you would like to use the calculated value as is. Setting it to a different value will count as an additional multiplier. Please select only one active stop loss. Default value (if nothing or multiple stop losses are selected) is the 'ATR Based Stop Loss'.
Candle Lookback (of the SL): 10 by default
Base Risk Multiplier: 1.5 by default, the stop loss will be placed at this risk level (meaning in case of ATR SL that the ATR value will be multiplied by this factor and the SL will be placed that value away from the entry level)
Risk to Reward Ratio: 2.5 by default, the take profit level will be placed such as this Risk/Reward ratio is met
Force Exit based on Squeeze Momentum: true by default, a Long position will be closed when Squeeze Momentum turns red inside an open position and a Short position will be closed when Squeeze Momentum turns green inside an open position
BB Length: 20 by default
BB Mult Factor: 1.0 by default
KC Length: 20 by default
KC Mult Factor: 1.5 by default
Use True Range (KC): Yes by default
Base Setups:
Allow Long Entries: true by default
Allow Short Entries: true by default
Order Size: 1.5 by default
Order Type: Risk Percentage (current) by default, allows adjustment on how the position size is calculated: Cash: only the set cash ammount will be used for each trade Contract(s): the adjusted number of contracts will be used for each trade Capital Percentage: a % of the current available capital will be used for each trade Risk Percentage (current): position size will be determined such that the potential loss is equal to % of the current available capital Risk Percentage (initial): position size will be determined such that the potential loss is equal to % of the initial capital
Trend Filter:
Use long trend filter: true by default, only enter long if price is above Long MA
Show long trend filter: true by default, plot the selected MA on the chart
MA Type (Long): SMA by default
MA Length (Long): 100 by default
MA Source (Long): close by default
Use short trend filter: true by default, only enter long if price is under Short MA
Show short trend filter: false by default, plot the selected MA on the chart
MA Type (Short): SMA by default
MA Length (Short): 100 by default
MA Source (Short): close by default
Simple RSI Limiter:
Limit using Simple RSI: true by default, if set to 'Normal', only enter long when Simple RSI is lower then Long Boundary, and only enter short when Simple RSI is higher then Short Boundary. If set to 'Reverse', only enter long when Simple RSI is higher then Long Boundary, and only enter short when Simple RSI is lower then Short Boundary.
Simple RSI Limiter Type:
RSI Length: 14 by default
RSI Source: hl2 by default
Simple RSI Long Boundary: 50 by default
Simple RSI Short Boundary: 50 by default
ADX Limiter:
Use ADX Limiter: true by default, only enter into any position (long/short) if ADX value is higher than the Low Boundary and lower than the High Boundary.
ADX Length: 5 by default
DI Length: 5 by default
High Boundary: 50 by default
Low Boundary: 20 by default
Use MA based calculation: Yes by default, if 'Yes', only enter into position (long/short) if ADX value is higher than MA (ADX as source).
MA Type: REMA by default
MA Length: 5 by default
Volume Filter:
Only enter trades where volume is higher then the volume-based MA: true by default, a set type of MA will be calculated with the volume as source, and set length
MA Type: EMA by default
MA Length: 10 by default
Session Limiter:
Show session plots: false by default, show crypto market sessions on chart: Sidney (red), Tokyo (orange), London (yellow), New York (green)
Use session limiter: false by default, if enabled, trades will only happen in the ticked sessions below.
Sidney session: false by default, session between: 15:00 - 00:00 (EST)
Tokyo session: false by default, session between: 19:00 - 04:00 (EST)
London session: false by default, session between: 03:00 - 11:00 (EST)
New York session: false by default, session between: 08:00 - 17:00 (EST)
Date Range:
Limit Between Dates: false by default
Start Date: Jul 01 2021 00:00:00 by default
End Date: Dec 31 2022 00:00:00 by default
Trading Time:
Limit Trading Time: false by default, tick this together with the options below to enable limiting based on day and time
Valid Trading Days Global: 1234567 by default, if the Limit Trading Time is on, trades will only happen on days that are present in this field. If any of the not global Valid Trading Days is used, this field will be neglected. Values represent days: Sunday (1), Monday (2), ..., Friday (6), Saturday(7) To trade on all days use: 123457
(1) Valid Trading Days: false, 1234567 by default, values represent days: Sunday (1), Monday (2), ..., Friday (6), Saturday(7) The script will trade on days that are present in this field. Please make sure that this field and also (1) Valid Trading Hours Between is checked
(1) Valid Trading Hours Between: false, 0930-1600 by default, hours between which the trades can happen. The time is always in the exchange's timezone
Fine-tuning is highly recommended when using other asset/timeframe combinations.

Macro Score -- User-Customized Scores and SignalsA "macro score", as defined here, is created by giving various weights to different signals and adding them together to get one smooth score. Positive or negative values are assigned to each of the signals depending on if the statement is true or false (e.g. DPO > 0: +1, DPO < 0: -1). This manner of strategy allows for a subset of the available signals to be present at one time as opposed to every technical signal having to be active in order for a long/short signal to trigger. This particular strategy allows the user to choose between 18 different signals to be used in scoring as well as allowing the user to determine the individual weights of each score as well as the overall threshold to determine long or short signals. Weights for each score range between 1 and 5, with 5 being the greatest weight. The overall threshold for long or short is dependent on the total possible weights added together (i.e. if your weights total -10 or +10, a threshold within this range must be used).
The macro score itself is printed in an underlay as a white line that goes between the maximum positive and negative values for all weights added together for this strategy. In addition to the macro score line, a green momentum line (sourced by the macro score itself) has been included. A crossover/crossunder of the macro score and the macro momentum line is included into the long/short signal syntax in addition to a threshold for the macro score. The length of the Macro Score's momentum line can be found in the settings.
The current signals to choose from include:
- ADX Threshold - if the Average Directional Index is above a set threshold, signal positive or negative
- CMF Threshold - if the Chaikin Money Flow oscillator is above 0, signal positive; otherwise, signal negative
- CMO > TSI Signal - signal positive if there is a cross of the Chande Momentum Oscillator and the True Strength Index signal line
- CMO Threshold - if the Chande Momentum Oscillator is above 0, signal positive; otherwise, signal negative
- DPO Threshold - if the Detrended Price Oscillator is above 0, signal positive; otherwise, signal negative
- EOM Threshold - if the Ease of Money Oscillator is above 0, signal positive; otherwise, signal negative
- Jurik Threshold - if the Jurik price line (from the Jurik Volatility Bands) is above 0, signal positive; otherwise, signal negative
- MACD Threshold - if the MACD signal line is above 0, signal positive; otherwise, signal negative
- McGinley Cross - a crossover of a fast McGinley Dynamic length line and a slow McGinley Dynamic line signals positive; otherwise, signal negative
- PSAR - if the direction of the PSAR is heading long, signal positive; otherwise, signal negative
- ROC Threshold - if the Rate of Change oscillator is above 0, signal positive; otherwise, signal negative
- RSI Threshold - if the Relative Strength Index is above 50, signal positive; otherwise, signal negative
- Stoch RSI Threshold - if the Stoch RSI is above 50, signal positive; otherwise, signal negative
- Supertrend - if the Supertrend determines long, signal positive; otherwise, signal negative
- TSI Cross - a crossover of the True Strength Index value line and the TSI signal line signals positive; otherwise, signal negative
- TSI Signal Threshold - if the TSI signal line is above 0, signal positive; otherwise, signal negative
- Williams Alligator Cross - if the Williams Alligator lips cross the teeth and jaw, signal positive; otherwise, signal negative
- Williams %R - if the Williams %R is above -50, signal positive; otherwise, signal negative
Take profit, stop loss, and trailing percentages are also included, found at the bottom of the Input tab under “TT and TTP” as well as “Stop Loss”. Make sure to understand the TP/SL ratio that you desire before use, as the desired hit rate/profitability percentage will be affected accordingly. This strategy does NOT guarantee future returns. Apply caution in trading regardless of discretionary or algorithmic. Understand the concepts of risk/reward and the intricacies of each strategy choice before utilizing them in your personal trading.
Profitview Settings:
If you wish to utilize Profitview’s automation system, find the included “Profitview Settings” under the Input tab of the strategy settings menu. If not, skip this section entirely as it can be left blank. Options will be “OPEN LONG TITLE”, “OPEN SHORT TITLE”, “CLOSE LONG TITLE”, and “CLOSE SHORT TITLE”. If you wished to trade SOL, for example, you would put “SOL LONG”, “SOL SHORT”, “SOL CLOSE LONG”, and “SOL CLOSE SHORT” in these areas. Within your Profitview extension, ensure that your Alerts all match these titles. To set an alert for use with Profitview, go to the “Alerts” tab in TradingView, then create an alert. Make sure that your desired asset and timeframe are currently displayed on your screen when creating the alert. Under the “Condition” option of the alert, select the strategy, then select the expiration time. If using TradingView Premium, this can be open-ended. Otherwise, select your desired expiration time and date. This can be updated whenever desired to ensure the strategy does not expire. Under “Alert actions”, nothing necessarily needs to be selected unless so desired. Leave the “Alert name” option empty. For the “Message”, delete the generated message and replace it with {{strategy.order.alert_message}} and nothing else.
Sample setup for SOLUSDT 30M:
- Score 1 - Value 4, PSAR (0.05 start, 0.02 increment, 0.2 max value; sourced open)
- Score 2 - Value 4, Jurik Threshold (JVB Length 25, JVB Smoothing 6, JVB Price Threshold 0)
- Score 3 - Value 5, DPO Threshold (DPO Length 40, uncentered)
- Score 4 - Value 5, CMO Threshold (CMO Length 40, sourced open)
- Score 5 - Value 2, MACD Threshold (Fast Length 12, Slow Length 30, sourced open)
- Macro Length 21
- Long Threshold - -3
- Short Threshold - +3
- Take Profit % - 0.9/0.9
- Trail % - 0.005
- Stop Loss % - 1.4
Sample setup for AVAXUSDT 20M:
- Score 1 - Value 3, TSI Cross (Long Length 25, Short Length 16, Signal Length 17)
- Score 2 - Value 2, TSI Signal Threshold (same settings as the TSI Cross)
- Score 3 - Value 2, Jurik Threshold (JVB Length 20, JVB Smoothing 8, JVB Price Threshold 0)
- Score 4 - Value 2, DPO Threshold (DPO Length 40, uncentered)
- Score 5 - Value 1, Stoch Threshold (K/D 3, RSI (Stoch) Length 10, Stochastic Length 4, sourced open)
- Macro Length 13
- Long Threshold - +5
- Short Threshold - -5
- Take Profit % - 1.2/1.2
- Trail % - 0.005
- Stop Loss % - 1.5

Macro Score - TSI-BasedA "macro score", as defined here, is created by giving various weights to different signals and adding them together to get one smooth score. Positive or negative values are assigned to each of the signals depending on if the statement is true or false (e.g. DPO > 0: +1, DPO < 0: -1). This manner of strategy allows for a subset of the available signals to be present at one time as opposed to every technical signal having to be active in order for a long/short signal to trigger.
This strategy has the signals and weights pre-determined in the code. Heaviest weights have been given to various TSI (True Strength Index) signals, including a crossover/crossunder of TSI signal and TSI value, a threshold for the TSI Signal (above or below 0), and a crossover/crossunder of the CMO (Chande Momentum Oscillator) and the TSI signal line. Additionally, there are thresholds for DPO (Detrended Price Oscillator, above or below 0), Jurik Volatility Bands (above or below 0), and Stoch RSI (above or below 50). These three signals hold a lighter weight than the three TSI signals.
The macro score itself is printed in an underlay as a white line that goes between -10 and 10 for this strategy. In addition to the macro score line, a red momentum line (sourced by the macro score itself) has been included. A crossover/crossunder of the macro score and the macro momentum line is included into the long/short signal syntax in addition to a threshold for the macro score (-6/6).
Take profit, stop loss, and trailing percentages are also included, found at the bottom of the Input tab under “TT and TTP” as well as “Stop Loss”. Make sure to understand the TP/SL ratio that you desire before use, as the desired hit rate/profitability percentage will be affected accordingly. This strategy does NOT guarantee future returns. Apply caution in trading regardless of discretionary or algorithmic. Understand the concepts of risk/reward and the intricacies of each strategy choice before utilizing them in your personal trading.
Profitview Settings:
If you wish to utilize Profitview’s automation system, find the included “Profitview Settings” under the Input tab of the strategy settings menu. If not, skip this section entirely as it can be left blank. Options will be “OPEN LONG TITLE”, “OPEN SHORT TITLE”, “CLOSE LONG TITLE”, and “CLOSE SHORT TITLE”. If you wished to trade SOL, for example, you would put “SOL LONG”, “SOL SHORT”, “SOL CLOSE LONG”, and “SOL CLOSE SHORT” in these areas. Within your Profitview extension, ensure that your Alerts all match these titles. To set an alert for use with Profitview, go to the “Alerts” tab in TradingView, then create an alert. Make sure that your desired asset and timeframe are currently displayed on your screen when creating the alert. Under the “Condition” option of the alert, select the strategy, then select the expiration time. If using TradingView Premium, this can be open-ended. Otherwise, select your desired expiration time and date. This can be updated whenever desired to ensure the strategy does not expire. Under “Alert actions”, nothing necessarily needs to be selected unless so desired. Leave the “Alert name” option empty. For the “Message”, delete the generated message and replace it with {{strategy.order.alert_message}} and nothing else.
rt maax EMA cross strategythis just sample of our strategies we published with open source, to learning our investor the way of trading and analysis, this strategy just for study and learning
in this strategy we use expontial moving avarage 20 , 50 , 200 and the we build this strategy when the price move up ema 200 and ema 20,50 cross up the 200 ema in this conditions the strargey will open long postion
and the oppisit it is true for short postion in this sitation the price should be under ema 200 and the ema 20 , 50 should cross under 200 ema then the strategy will open the short postion
we try this strategy on forex ,crypto and futures and it give us very good result ,, also we try this postion on multi time frame we find the stragey give us good result on 1 hour time frame .
in the end our advice for you before you use any stratgy you should have the knowledg of the indecators how it is work and also you should have information about the market you trade and the last news for this market beacuse it effect so much on the price moving .
so we hope this strategy give you brefing of the way we work and build our strategy

[fpemehd] Strategy TemplateHello Guys! Nice to meet you all!
This is my fourth script!
This is the Strategy Template for traders who wants to make their own strategy.
I made this based on the open source strategies by jason5480, kevinmck100, myncrypto. Thank you All!
### StopLoss
1. Can Choose Stop Loss Type: Percent, ATR, Previous Low / High.
2. Can Chosse inputs of each Stop Loss Type.
### Take Profit
1. Can set Risk Reward Ratio for Take Profit.
- To simplify backtest, I erased all other options except RR Ratio.
- You can add Take Profit Logic by adding options in the code.
2. Can set Take Profit Quantity.
### Risk Manangement
1. Can choose whether to use Risk Manangement Logic.
- This controls the Quantity of the Entry.
- e.g. If you want to take 3% risk per trade and stop loss price is 6% below the long entry price,
then 50% of your equity will be used for trade.
2. Can choose How much risk you would take per trade.
### Plot
1. Added Labels to check the data of entry / exit positions.
2. Changed and Added color different from the original one. (green: #02732A, red: #D92332, yellow: #F2E313)

3Commas Dollar cost averaging trading system (DCA)As investors, we often face the dilemma of willing high stock prices when we sell, but not when we buy. There are times when this dilemma causes investors to wait for a dip in prices, thereby potentially missing out on a continual rise. This is how investors get lured away from the markets and become tangled in the slippery slope of market timing, which is not advisable to a long-term investment strategy.
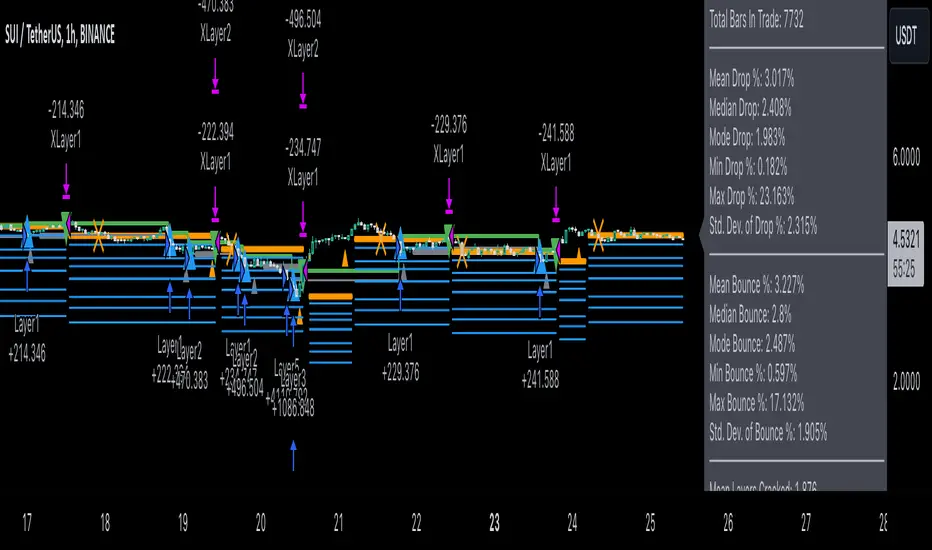
Skyrex developed a complex trading system based on dollar-cost averaging in Quick Fingers Luc's interpretation. It is a combinations of strategies which allows to systematically accumulate assets by investing scaled amounts of money at defined market cycle global support levels. Dollar-cost averaging can reduce the overall impact of price volatility and lower the average cost per asset thus even during market slumps only a small bounce is required to reach take profit.
The strategy script monitors a chart price action and identifies bases as they form. When bases are reached the script provides entry actions. During price action development an asset value can go lower and in this way the script will perform safety entries at each subsequent accumulation levels. When weighted average entry price reaches target profit the script will perform a take profit action.
Bases are identified as pivot lows in a fractal pattern and validated by an adjustable decrease/rise percentage to ensure significancy of identified bases. To qualify a pivot low, the indicator will perform the following validation:
Validate the price rate of change on drops and bounces is above a given threshold amount.
Validate the volume at the low pivot point is above the volume moving average (using a given length).
Validate the volume amount is a given factor of magnitude above is above the volume moving average.
Validate the potential new base is not too close to the previous range by using a given price percent difference threshold amount.
A fractal pattern is a recurring pattern on a price chart that can predict reversals among larger, more chaotic price movements.
These basic fractals are composed of five or more bars. The rules for identifying fractals are as follows:
A bearish turning point occurs when there is a pattern with the highest high in the middle and two lower highs on each side.
A bullish turning point occurs when there is a pattern with the lowest low in the middle and two higher lows on each side.
Basic dollar-cost averaging approach is enhances by implementation of adjustable accumulation levels in order to provide opportunity of setting them at defined global support levels and Martingale volume coefficient to increase averaging effect. According to Quick Fingers Luc's principles trading principles we added volume validation of a base because it allows to confirm that the market is resistant to further price decrease.
The strategy supports traditional and cryptocurrency spot, futures , options and marginal trading exchanges. It works accurately with BTC, USD, USDT, ETH and BNB quote currencies. Best to use with 1H timeframe charts and limit orders. The strategy can be and should be configured for each particular asset according to its global support and resistance levels and price action cycles. You can modify levels and risk management settings to receive better performance
The difference between core script and this interpretation is that this strategy is specially designed for 3Commas bots
How to use?
1. Apply strategy to a trading pair your are interested in using 1H timeframe chart
2. Configure the strategy: change layer values, order size multiple and take profit/stop loss values according to current market cycle stage
3. Set up a TradingView alert to trigger when strategy conditions are met
4. Strategy will send alerts when to enter and when to exit positions which can be applied to your portfolio using external trading platforms
5. Update settings once market conditions are changed using backtests on a monthly period

Dollar cost averaging trading system (DCA)As investors, we often face the dilemma of willing high stock prices when we sell, but not when we buy. There are times when this dilemma causes investors to wait for a dip in prices, thereby potentially missing out on a continual rise. This is how investors get lured away from the markets and become tangled in the slippery slope of market timing, which is not advisable to a long-term investment strategy.
Skyrex developed a complex trading system based on dollar-cost averaging in Quick Fingers Luc's interpretation. It is a combinations of strategies which allows to systematically accumulate assets by investing scaled amounts of money at defined market cycle global support levels. Dollar-cost averaging can reduce the overall impact of price volatility and lower the average cost per asset thus even during market slumps only a small bounce is required to reach take profit.
The strategy script monitors a chart price action and identifies bases as they form. When bases are reached the script provides entry actions. During price action development an asset value can go lower and in this way the script will perform safety entries at each subsequent accumulation levels. When weighted average entry price reaches target profit the script will perform a take profit action.
Bases are identified as pivot lows in a fractal pattern and validated by an adjustable decrease/rise percentage to ensure significancy of identified bases. To qualify a pivot low, the indicator will perform the following validation:
Validate the price rate of change on drops and bounces is above a given threshold amount.
Validate the volume at the low pivot point is above the volume moving average (using a given length).
Validate the volume amount is a given factor of magnitude above is above the volume moving average.
Validate the potential new base is not too close to the previous range by using a given price percent difference threshold amount.
A fractal pattern is a recurring pattern on a price chart that can predict reversals among larger, more chaotic price movements.
These basic fractals are composed of five or more bars. The rules for identifying fractals are as follows:
A bearish turning point occurs when there is a pattern with the highest high in the middle and two lower highs on each side.
A bullish turning point occurs when there is a pattern with the lowest low in the middle and two higher lows on each side.
Basic dollar-cost averaging approach is enhances by implementation of adjustable accumulation levels in order to provide opportunity of setting them at defined global support levels and Martingale volume coefficient to increase averaging effect. According to Quick Fingers Luc's principles trading principles we added volume validation of a base because it allows to confirm that the market is resistant to further price decrease.
The strategy supports traditional and cryptocurrency spot, futures, options and marginal trading exchanges. It works accurately with BTC, USD, USDT, ETH and BNB quote currencies. Best to use with 1H timeframe charts and limit orders. The strategy can be and should be configured for each particular asset according to its global support and resistance levels and price action cycles. You can modify levels and risk management settings to receive better performance
Advantages of this script:
Strategy has high net profit of 255% at backtests
Backtests show high accuracy around 75%
Low Drawdowns of around 14% at backtests
Strategy is sustainable to market slumps and can be used for long-term trading
The strategy provides a large number of entries which is good for diversification
Can be applied to any market and quote currency
Easy to configure user interface settings
How to use?
1. Apply strategy to a trading pair your are interested in using 1H timeframe chart
2. Configure the strategy: change layer values, order size multiple and take profit/stop loss values according to current market cycle stage
3. Set up a TradingView alert to trigger when strategy conditions are met
4. Strategy will send alerts when to enter and when to exit positions which can be applied to your portfolio using external trading platforms
5. Update settings once market conditions are changed using backtests on a monthly period
3C Reversal Filter v1In essence, this strategy is a heavily smoothed range filter.
This strategy includes a backtester and ability to connect it with your 3 commas bot(See adviced settings below)
The calculation steps below gives an example on how signals are made:
1. Calculating the price movement using ATR, % change, standard deviation etc..
2. Obtaining the smoothed price using SMA.
3. Obtaining the absolute value of the bar-to-bar change.
4. Applying EMA, twice, to the values in step 3.
5. Obtaining the slow trailing line by multiplying the result of step 4 by 1.618.
Think of it as a heavily smoothed price range
If the 1.618 value looks familiar, that’s because it’s used in Fibonacci sequences. You can of course experiment with other values. I’ve seen good results with both 2.618 and 4.236
What does the strategy do?
1. Determine Trend Detection
2. Detect Short-Term Momentum
3commas settings:
-For now you can only use simple bots.
-Create LONG and SHORT bots for the coins you like to trade and set up alerts(You can send long and short signal from the same alert)
-Set TP to 50% the strategy will handle buys and exits based on your inputs.
-Set safety orders to 0. I might add DCA to the strategy if testing proves that to be a good solution.
-When you have made the bots input the bot ID and token adress in the settings of the strategy.
-When creating the alert use this webhook :https://3commas.io/trade_signal/trading_view
-In the message field you use {{strategy.order.alert_message}} as the placeholder.

Statistical Correlation Algorithm - The Quant ScienceStatistical Correlation Algorithm - The Quant Science™ is a quantitative trading algorithm.
ALGORITHM DESCRIPTION
This algorithm analyses the correlation ratios between two assets. The main asset (on the chart), and the secondary asset (set by the user). Then apply the long or short trading strategy.
The algorithm divides trading work into three parts:
1. Correlation analysis
2. Long or short entry
3. Closing trades
Inside the strategy: the algorithm analyses the percentage change yields from a previous session, of the secondary asset. If the variation meets the set condition then it will open a long or short position, on the primary asset. The open position is closed after 'x' number of sessions. Stop loss and take profit can be added to the trade exit parameters.
Logic: analyses the correlation between two assets and looks for a statistical advantage within the correlation.
INDICATOR DESCRIPTION
The algorithm includes a quantitative indicator. This indicator is used for correlation analysis and offers a quick reading of the quantitative data. The blue area shows the correlation ratio values. The yellow histograms show the percentage change in the yields of the main asset. Purple histograms show the percentage change in secondary asset yields.
GENERAL FEATURES
Multi time-frame: the user can set any time-frame for the secondary asset.
Multi asset: the user analyses the conditions on a second asset.
Multi-strategy: the algorithm can apply either the long strategy or the short strategy.
Built-in alerts: the algorithm contains alerts that can be customized from the user interface.
Integrated indicator: the quantity indicator is included.
Backtesting included: automatic backtesting of the strategy is generated based on the values set.
Auto-trading compliant: functions for auto trading are included.
USER INTERFACE SETTINGS
Through the intuitive user interface, you can manage all the parameters of this algorithm without any programming experience. The user interface is extremely descriptive and contains all the information needed to understand the logic of the algorithm and to configure it correctly.
1. Date range: through this function you can adjust the analysis and working period of the algorithm.
2. Asset: through this function you can adjust the secondary asset and its time-frame. You can enter any type of asset, even indices and economic indicators.
3. Asset details: this function is used to adjust the percentage change to be analyzed on the secondary asset. The analysis and input conditions are also chosen.
4. Active long or short strategy: this function is used to set the type of strategy to be used, long or short.
5. Setting algo trading alert: with this function, users can manage alerts for their web-hook.
6. Exit&Money management: with this function the user can adjust the exit periods of each trade and activate or deactivate any stop losses and take profits.
7. Data Value Analysis: this function is used to adjust the parameters for the quantity indicator.

VIDYA Trend StrategyOne of the most common messages I get is people reaching out asking for quantitative strategies that trade cryptocurrency. This has compelled me to write this script and article, to help provide a quantitative/technical perspective on why I believe most strategies people write for crypto fail catastrophically, and how one might build measures within their strategies that help reduce the risk of that happening. For those that don't trade crypto, know that these approaches are applicable to any market.
I will start off by qualifying up that I mainly trade stocks and ETFs, and I believe that if you trade crypto, you should only be playing with money you are okay with losing. Most published crypto strategies I have seen "work" when the market is going up, and fail catastrophically when it is not. There are far more people trying to sell you a strategy than there are people providing 5-10+ year backtest results on their strategies, with slippage and commissions included, showing how they generated alpha and beat buy/hold. I understand that this community has some really talented people that can create some really awesome things, but I am saying that the vast majority of what you find on the internet will not be strategies that create alpha over the long term.
So, why do so many of these strategies fail?
There is an assumption many people make that cryptocurrency will act just like stocks and ETFs, and it does not. ETF returns have more of a Gaussian probability distribution. Because of this, ETFs have a short term mean reverting behavior that can be capitalized on consistently. Many technical indicators are built to take advantage of this on the equities market. Many people apply them to crypto. Many of those people are drawn down 60-70% right now while there are mean reversion strategies up YTD on equities, even though the equities market is down. Crypto has many more "tail events" that occur 3-4+ standard deviations from the mean.
There is a correlation in many equities and ETF markets for how long an asset continues to do well when it is currently doing well. This is known as momentum, and that correlation and time-horizon is different for different assets. Many technical indicators are built based on this behavior, and then people apply them to cryptocurrency with little risk management assuming they behave the same and and on the same time horizon, without pulling in the statistics to verify if that is actually the case. They do not.
People do not take into account the brokerage commissions and slippage. Brokerage commissions are particularly high with cryptocurrency. The irony here isn't lost to me. When you factor in trading costs, it blows up most short-term trading strategies that might otherwise look profitable.
There is an assumption that it will "always come back" and that you "HODL" through the crash and "buy more." This is why Three Arrows Capital, a $10 billion dollar crypto hedge fund is now in bankruptcy, and no one can find the owners. This is also why many that trade crypto are drawn down 60-70% right now. There are bad risk practices in place, like thinking the martingale gambling strategy is the same as dollar cost averaging while also using those terms interchangeably. They are not the same. The 1st will blow up your trade account, and the 2nd will reduce timing risk. Many people are systematically blowing up their trade accounts/strategies by using martingale and calling it dollar cost averaging. The more risk you are exposing yourself too, the more important your risk management strategy is.
There is an odd assumption some have that you can buy anything and win with technical/quantitative analysis. Technical analysis does not tell you what you should buy, it just tells you when. If you are running a strategy that is going long on an asset that lost 80% of its value in the last year, then your strategy is probably down. That same strategy might be up on a different asset. One might consider a different methodology on choosing assets to trade.
Lastly, most strategies are over-fit, or curve-fit. The more complicated and more parameters/settings you have in your model, the more likely it is just fit to historical data and will not perform similar in live trading. This is one of the reasons why I like simple models with few parameters. They are less likely to be over-fit to historical data. If the strategy only works with 1 set of parameters, and there isn't a range of parameters around it that create alpha, then your strategy is over-fit and is probably not suitable for live trading.
So, what can I do about all of this!?
I created the VIDYA Trend Strategy to provide an example of how one might create a basic model with a basic risk management strategy that might generate long term alpha on a volatile asset, like cryptocurrency. This is one (of many) risk management strategies that can reduce the volatility of your returns when trading any asset. I chose the Variable Index Dynamic Average (VIDYA) for this example because it's calculation filters out some market noise by taking into account the volatility of the underlying asset. I chose a trend following strategy because regressions are capturing behaviors that are not just specific to the equities market.
The more volatile an asset, the more you have to back-off the short term price movement to effectively trend-follow it. Otherwise, you are constantly buying into short term trends that don't represent the trend of the asset, then they reverse and loose money. This is why I am applying a trend following strategy to a 4 hour chart and not a 4 minute chart. It is also important to note that following these long term trends on a volatile asset exposes you to additional risk. So, how might one mitigate some of that risk?
One of the ways of reducing timing risk is scaling into a trade. This is different from "doubling down" or "trippling down." It is really a basic application of dollar cost averaging to reduce timing risk, although DCA would typically happen over a longer time period. If it is really a trend you are following, it will probably still be a trend tomorrow. Trend following strategies have lower win rates because the beginning of a trend often reverses. The more volatile the asset, the more likely that is to happen. However, we can reduce risk of buying into a reversal by slowly scaling into the trend with a small % of equity per trade.
Our example "VIDYA Trend Strategy" executes this by looking at a medium-term, volatility adjusted trend on a 4 hour chart. The script scales into it with 4% of the account equity every 4-hours that the trend is still up. This means you become fully invested after 25 trades/bars. It also means that early in the trade, when you might be more likely to experience a reversal, most of your account equity is not invested and those losses are much smaller. The script sells 100% of the position when it detects a trend reversal. The slower you scale into a trade, the less volatile your equity curve will be. This model also includes slippage and commissions that you can adjust under the "settings" menu.
This fundamental concept of reducing timing risk by scaling into a trade can be applied to any market.
Disclaimer: This is not financial advice. Open-source scripts I publish in the community are largely meant to spark ideas that can be used as building blocks for part of a more robust trade management strategy. If you would like to implement a version of any script, I would recommend making significant additions/modifications to the strategy & risk management functions. If you don’t know how to program in Pine, then hire a Pine-coder. We can help!

[MT Trader] Backtest template w/ Supertrend Strategy---EN: In this strategy template you will find some functions already pre-programmed to be used in your strategies to speed up the programming process, among them we can highlight the default stop loss and take profit functions, which will help to set easily and quickly, defining the price range in which we want to prevent large losses or protect our profits from unexpected market movements.
🔴 Stop Loss: Among the functions of the stop loss are the 4 most known, first we have the fixed percentage range (%) and price ($), when the price reaches this fixed price will limit the losses of the operation avoiding larger losses, then we have the average true range (ATR), a moving average of true range and X period that can give us good reference points to place our stop loss, finally the last point higher or lower is the most used by traders to place their stop loss.
In addition, the price range between the entry and stop loss can be converted into a trailing stop loss.
🟢 Take Profit: We have 3 options for take profit, just like stop loss, the fixed range of percentage(%) and price($), are available, in addition to this we have the 1:# ratio option, which multiplies by X number the range between the entry and stop loss to use it as take profit, perfect for strategies that use ATR or last high/low point for their strategy.
📈 Heikin Ashi Entrys: The heikin ashi entries are trades that are calculated based on heikin ashi candles but their price is executed in Japanese candles, thus avoiding the false results that occur in heikin candlestick charts, making that in certain cases better results are obtained in the strategies that are executed with this option compared to Japanese candlesticks.
📊 Dashboard: A more visual and organized way to see the results and data needed for our strategy.
Feel free to use this template to program your own strategies, if you find bugs or want to request a new feature let me know in the comments or through my telegram @hvert_mt
__________________________________________________________________________________________________________________________________________________
---ES: En esta plantilla de estrategia podrás encontrar algunas funciones ya pre-programadas para ser usadas en tus estrategias para acelerar procesos de programación, entre ellas podemos destacar las funciones por defecto de stop loss y take profit, que ayudaran a establecer de manera fácil y rápida, definiendo los rango de precio en los que queremos prevenirnos de perdidas grandes o proteger nuestras ganancias de movimientos inesperados del mercado.
🔴 Stop Loss: Entre las funciones del stop loss están las 4 más conocidas, en primer lugar tenemos el rango de porcentaje fijo(%) y el precio($), cuando el precio alcance este precio fijo se limitaran las perdidas de la operación evitando perdidas mas grandes, después tenemos el promedio de rango verdadero(ATR), una media móvil del rango verdadero y X periodo que nos puede dar buenos puntos de referencia para colocar nuestro stop loss, por ultimo el ultimo punto mas alto o mas bajo es de los mas usados por los traders para colocar su stop loss.
Adicional a esto, el rango de precio entre la entrada y el stop loss se puede convertir en un trailing stop loss.
🟢 Take Profit: Tenemos 3 opciones para take profit, al igual que en el stop loss, el rango fijo de porcentaje(%) y precio($) se encuentran disponibles, adicional a esto tenemos la opción de ratio 1:#, que multiplica por X numero el rango entre la entrada y el stop loss para usarlo como take profit, perfecto para estrategias que usen ATR o ultimo punto alto/bajo.
📈 Entradas Heikin Ashi: Las entradas Heikin Ashi son trades que son calculados en base a las velas Aeikin Ashi pero su precio esta ejecutado a velas japonesas, evitando así los falsos resultados que se producen en graficas de velas Heikin, esto haciendo que en ciertos casos se obtengan mejores resultados en las estrategias que son ejecutadas con esta opción en comparación con las velas japonesas.
📊 Panel de Control: Una manera mas visual y organizada de ver los resultados y datos necesarios de nuestra estrategia.
Siéntete libre de usar esta plantilla para programar tus propias estrategias, si encuentras errores o quieres solicitar una nueva función házmelo saber en los comentarios o a través de mi Telegram: @hvert_mt

[Sextan] PINEv5 Sextans Backtest Framework V3.3Level: 5
Background
In order to celebrate the breakthrough of 4000 followers of my account, I decided to release the Sextan backtesting framework for free use to help more quantitative traders quickly evaluate any technical indicators.
The version released this time is based on the algorithm framework optimization of the old version, and integrates the new feature in Pine V5: Bar Magnifier. This new feature to make Sextan strategy backtesting even more accurate. FYI.
www.tradingview.com
Backtesting of technical indicators and strategies is the most common way to understand a quantitative strategy. However, the complicated configuration and adaptation work of backtesting many quantitative tools makes many traders who do not understand the code daunted. Moreover, although I have written a lot of strategies,
However, I am still not very satisfied with the backtest configuration and writing efficiency. Therefore, I have been thinking about how to build a backtesting framework that can quickly and easily evaluate the backtesting performance of any indicator with a "long/short entry" indicator, that is, a "simple backtesting tool for dummies". The performance requirements should be stable, and the operation should be simple and convenient. It is best to "copy", "paste", and "a few mouse clicks" to complete the quick backtest and evaluation of a new indicator.
Luckily, I recently realized that TradingView provides an "Indicator on Indicator" feature, which is the perfect foundation for doing "hot swap" backtesting. My basic idea is to use a two-layer design. The first layer is the technical indicator signal source that needs to be embedded, which is only used to provide buy and sell signals of custom strategies; the second layer is the trading system, which is used to receive the output signals of the first layer, and filter the signals according to the agreed specifications. , Take Profit, Stop Loss, draw buy and sell signals and cost lines, define and send custom buy and sell alert messages to mobile phones, social software or trading interfaces. In general, this two-layer design is a flexible combination of "fixed and flexiable", which can meet the needs of most traders to quickly evaluate the performance of a certain technical indicator. The first layer here is flexible. Users can insert their own strategy codes according to my template, and they can draw buy and sell signals and output them to the second layer. The second layer is fixed, and the overall framework is solidified to ensure the stability and unity of the trading system. It is convenient to compare different or similar strategies under the same conditions. Finally, all trading signals are drawn on the chart, and the output strategy returns. test report.
The main function:
The first layer: "{Sextan} Your Indicator Source", the script provides a template for personalized strategy input, and the signal and definition interfaces ensure full compatibility with the second layer. Backtesting is performed stably in the backtesting framework of the layer. The first layer of this script is also relatively simple: enter your script in the highlighted custom script area, and after ensuring the final buy and sell signals long = bool condition, short = bool condition, the design of the first layer is considered complete. Input it into the PINE script editor of TradingView, save it and add it to the chart, you can see the pulse sequence in yellow (buy) and purple (sell) on the sub-picture, corresponding to the main picture, you can subjectively judge that the quality of the trading point of the strategy is good Bad.
Pine v4 your indicator template:
Pine v5 your indicator template:
Pine v4 your MTF indicator template:
Pine v5 your MTF indicator template:
The second layer: "{Sextan} PINEv4 Sextans Backtest Framework". This script is the standardized trading system strategy execution and alarm, used to generate the final report of the strategy backtest and some key indicators that I have customized that I find useful, such as: winning rate , Odds, Winning Surface, Kelly Ratio, Take Profit and Stop Loss Thresholds, Trading Frequency, etc. are evaluated according to the Kelly formula. To use the second layer, first load it into the TrainingView chart, no markers will appear on the chart, since you have not specified any strategy source signals, click on the gear-shaped setting next to the "{Sextan} PINEv4 Sextans BTFW" header button, you can open the backtest settings, the first item is to select your custom strategy source. Because we have added the strategy source to the chart in the previous step, you can easily find an option "{Sextan} Your Indicator Source: Signal" at the bottom of the list, this is the strategy source input we need, select and confirm , you can see various markers on the main graph, and quickly generate a backtesting profit graph and a list of backtesting reports. You can generate files and download the backtesting reports locally. You can also click the gear on the backtest chart interface to customize some conditions of the backtest, including: initial capital amount, currency type, percentage of each order placed, amount of pyramid additions, commission fees, slippage, etc. configuration. Note: The configuration in the interface dialog overrides the same configuration implemented by the code in the backtest script.
How to output charts:
The first layer: "{Sextan} Your Indicator Source", the output of this script is the pulse value of yellow and purple, yellow +1 means buy, purple -1 means sell.
The second layer: PINEv4 Sextans Backtest Framework". The output of this script is a bit complicated. After all, it is the entire trading system with a lot of information:
1. Blue and red arrows. The blue upward arrow indicates long position, the red downward arrow indicates short position, and the horizontal bar at the end of the purple arrow indicates take profit or stop loss exit.
2. Red and green lines. This is the holding cost line of the strategy, green represents the cost of holding a long position, and red represents the cost of holding a short position. The cost line is a continuous solid line and the price action is relatively close.
3. Green and yellow long take profit and stop loss area and green and yellow long take profit and stop loss fork. Once a long position is held, there is a conditional order for take profit and stop loss. The green horizontal line is the long take profit ratio line, and the yellow is the long stop loss ratio line; the green cross indicates the long take profit price, and the yellow cross indicates the long position. Stop loss price. It's worth noting that the prongs and wires don't necessarily go together. Because of the optimization of the algorithm, for a strong market, the take profit will occur after breaking the take profit line, and the profit will not be taken until the price falls.
4. The purple and red short take profit and stop loss area and the purple red short stop loss fork. Once a short position is held, there will be a take profit and stop loss conditional order, the red is the short take profit ratio line, and the purple is the short stop loss ratio line; the red cross indicates the short take profit price, and the purple cross indicates the short stop loss price.
5. In addition to the above signs, there are also text and numbers indicating the profit and loss values of long and short positions. "L" means long; "S" means short; "XL" means close long; "XS" means close short.
TradingView Strategy Tester Panel:
The overview graph is an intuitive graph that plots the blue (gain) and red (loss) curves of all backtest periods together, and notes: the absolute value and percentage of net profit, the number of all closed positions, the winning percentage, the profit factor, The maximum trading loss, the absolute value and ratio of the average trading profit and loss, and the average number of K-lines held in all trades.
Another is the performance summary. This is to display all long and short statistical indicators of backtesting in the form of a list, such as: net profit, gross profit, Sharpe ratio, maximum position, commission, times of profit and loss, etc.
Finally, the transaction list is a table indexed by the transaction serial number, showing the signal direction, date and time, price, profit and loss, accumulated profit and loss, maximum transaction profit, transaction loss and other values.
Remarks
Free to use but closed source.

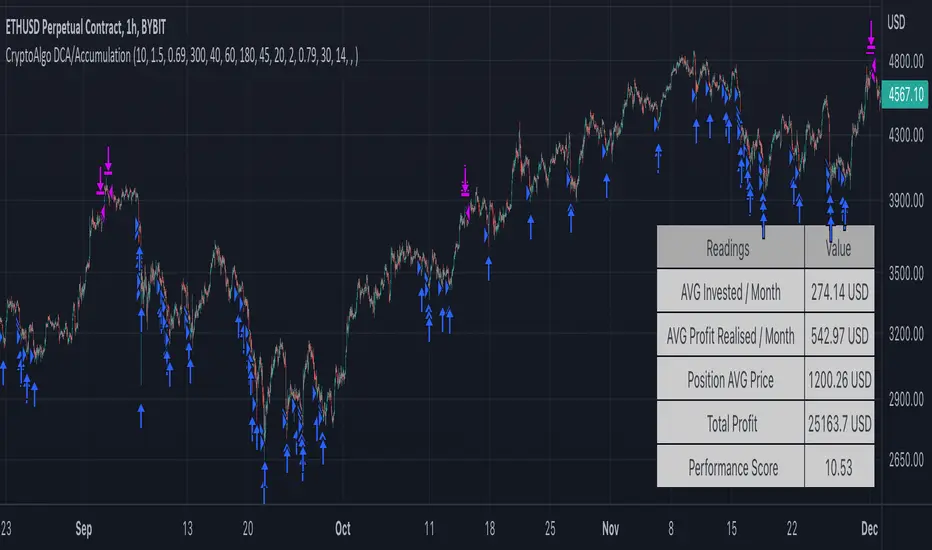
CryptoAlgo DCA / AccumulationThis is a Dollar Cost Average (DCA) / Accumulation strategy. Every time there is a long signal it will buy a fixed USD amount that you have specified in the settings and keep buying at the dips and corrections in the market. This strategy is low-risk, however it assumes you have a long time horizon of at least 2+ years. The longer your holding-period, the better your returns.
There is 3 different entry conditions you can choose from:
The first entry condition is bollinger bands. Bollinger bands is a set of trendlines plotted two standard deviations (positively and negatively) away from a simple moving average (SMA) of an assets price. Every time a candle closes below the lower trendline the strategy will buy.
The second entry condition is the Relative Strength Index (RSI). The RSI is a momentum indicator used in technical analysis that measures the magnitude of recent price changes to evaluate overbought or oversold conditions in the price of a stock or other asset. Every time the RSI is meaning oversold and goes below a point of your choosing the strategy will buy.
The third entry condition is based on pivot points and moving averages that will determine small term trend changes in the market and low price points. Every time there is a bullish trend reversal the strategy will buy.
All three of these entry conditions can be controlled by a higher timeframe RSI that will stop entries when the RSI is above a certain point where the market is overbought and not ideal for accumulation.
The take profits in this strategy is dynamic and will signal trend changes like the third entry condition by using pivot points and moving averages. Since this is a DCA/ Accumulation strategy and will accumulate for the long term it will only exit a small percentage of the accumulated position. This will ensure that you take profit as the asset is appreciating in price while keeping the majority of the position for greater profit in the future.
At the bottom right corner of the chart you will be able to see the key results of the DCA
The first reading is the Average amount USD that the strategy is investing on average every month. This value will help you identify the best settings for you and what USD amount the strategy should enter at the signals so that it stays below the amount you are willing to invest every month. Keep in mind that this is an average and that there will be a lot of deviation up or down based on where the market is going. If the market is having a correction the strategy will signal a lot more entries than when it is going up.
The second reading is the average profit per month. This is also an average and the result will go up exponentially from the starting point as the strategy accumulates and the market appreciates in price.
The third reading is the position average price. This is the average price all the accumulated USD in the asset.
The fourth reading is the total profit. This is the result of both the realised profit from taking profit and the accumulated usd amount left in the position.
The last reading is the performance score. This is a scoring system that i created that looks at the data from the readings and weighs it based on importance and then spits out a number that will help identify the best settings. The higher the number the better the performance, meaning more profit and better DCA.
When you have found the right settings you can insert the messages from your automatic trading platform at the bottom of the inputs and then create an alert with your unique webhook address along with the alert message below:
{{strategy.order.alert_message}}
You will be able to adjust all parameters in the settings.
Enjoy!
Soren test 222Say we use strategy.risk.allow_entry_in() to only trade longs. When our script uses the strategy.entry() function to open a short trade, TradingView of course won’t allow our strategy to go short. But that doesn’t mean the trade is ignored. Instead the ‘enter short’ trade – which is actually a sell command – becomes an ‘exit long’ order.
Another way to think about this is the following. The strategy.entry() function can reverse positions: longs into shorts, and shorts into longs. That reverse behaviour gets stopped by strategy.risk.allow_entry_in(). What strategy.entry() instead ends doing is close positions: from long to flat, or from short to flat.
(The example strategies that we discuss later in this article show how strategy.risk.allow_entry_in() makes strategy.entry() close instead of open trades.)
# Can still trade both long or short
strategy.risk.allow_entry_in() can also allow our strategy to trade both long or short. That’s a bit silly, since this is already the default behaviour. But to cod

MarketCipher B Wavetrend DivergencesCreated for the MarketCipher Community and friends :)
I have published this before but it was taken down by Tradingview and PineCoders because they wanted a more in depth description so here it is:
This strategy is mainly based on Wavetrend Oscillator by LazyBear / blue momentum waves on MarketCipher B.
The Wavetrend indicator is a combination of 2 oscillator lines that signals the short term direction of the price once the lines cross. The Wavetrend indicator is useful but only once a divergence has been identified based on the crosses and the price which is what this strategy partly uses to open trades.
Here is a list and description of the different conditions that goes into the entries and exits.
Long trade:
1) Bullish divergence, regular or hidden
2) Price is above Exponential Moving Average
3) Chande Momentum Oscillator value is above x
Short trade:
1) Bearish divergence, regular or hidden
2) Price is below Exponential Moving Average
3) Chande Momentum Oscillator value is below x
The Exponential Moving Average (EMA) is a type of moving average that is price based, lagging (or reactive) indicator that displays the average price of a security over a set period of time. The EMA is however different from a normal moving average and values the recent price action. A Moving Average is a good way to confirm trends which is what it is used for in this strategy. If enabled the strategy will only open long trades above the EMA and only short trades below the EMA.
The Chande Momentum Oscillator is a technical momentum indicator and was designed specifically to track the movement and momentum of a security. The oscillator calculates the difference between the sum of both recent gains and recent losses, then dividing the result by the sum of all price movement over the same period. In this strategy it is used like the EMA to filter out bad trades that goes against the trend. The EMA is better at trading the overall trend but the Chande Momentum Oscillator is a lot better at identifying short term market conditions that are favorable for entering at divergences.
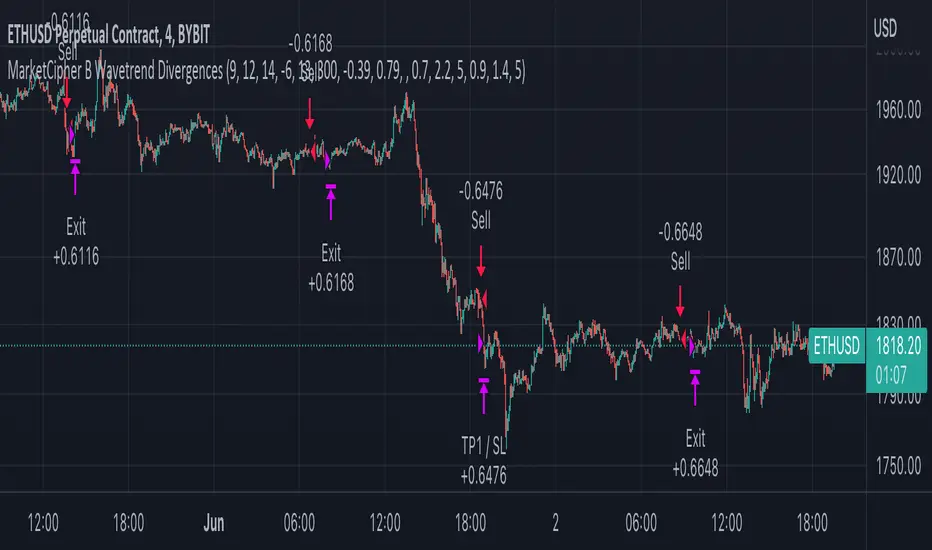
One of the most important aspects when creating a trading strategy is to know when to take profit and to make it as dynamic as possible so that it changes to the market conditions. This is what i have tried to do and the reason why this divergence trading strategy works well.
These are the 3 different exit conditions:
1) A dynamic take profit that will signal a short term trend reversal that is based on pivot points and moving averages.
2) Another dynamic take profit based on pivot points that like the previous take profit is used to determine and anticipate potential changes in market price and reversals.
3) A normal % fixed take profit
Photo of what the dynamic take profit looks like on the chart:
The pivot pointexit comes from this indicator that i have helped update and modify from the original script:
When you have found the right settings you can insert the messages from your automatic trading platform at the bottom of the inputs and then create an alert with your unique webhook address along with the alert message below:
{{strategy.order.alert_message}}
I hope this strategy will be useful to automate part of your trading or help you identify and backtest divergences for your manual trading.
Future updates to come.
Enjoy!
StochRSI + MA Strategy [Kintsugi Trading]What is the StochRSI + MA Strategy?
This premium indicator was inspired by my desire to find and place high probability forex trades in any market, direction, or time of day.
Why Forex?
The Forex markets operate 24 hours, 5.5 days a week
Access to meaningful leverage
Ability to easily trade long or short
High liquidity
How to use it!
----- First, start by choosing a Stop-Loss Strategy, Stop PIP Size, and Risk/Reward Ratio -----
- Stop-Loss Strategy
ATR Trail (No set Target Profit, only uses ATR Stop)
ATR Trail-Stop (Has set Target Profit, however, stop is based on ATR inputs)
Fixed PIP Size
**If you choose an ATR Stop-Loss Strategy - input the desired ATR period and Multiple you would like the stop to be calculated at**
**ATR Stop-Loss Strategies have a unique alert setup for Auto-Trading. See Auto-Trading Section**
- Stop PIP Size = How many PIPs will be representative of the max risk. i.e. - if you are risking $100 and you set the PIP stop to 10, that means 10 PIPs = $100.
- Risk/Reward Ratio = If you have a .5 risk/reward, it means you are risking $100 to make $50.
----- Next, we set the Session Filter. -----
Set the Timezone and Trade Session you desire. If no specific session is desired, simply set the Trade Session to 00:00 - 00:00.
----- Next, we set the Moving Average Cloud. -----
Enter the Moving Average Type:
Simple Moving Average
Exponential Moving Average
Hull Moving Average
Weighted Moving Average
Smoothed Moving Average
Double Exponential Moving Average
Triple Exponential Moving Average
Enter the fast, medium, and slow Moving Average Period you would like the Strategy to use. If you would like like to use (2) Moving Averages, simply set two of the Periods the same.
These inputs will determine whether the strategy looks for Long or Short positions.
**Boxes on the left of the fast, medium, and slow Moving Average Periods**
If you check any of these boxes, the strategy will ignore and set up where the price is trading below the checked moving average.
----- Next, we set the Stochastic RSI Parameters. -----
In combination with the Moving Average Cloud, the Stochastic RSI will help us determine when to take a trade and in what direction.
The strategy is essentially looking for small reversals going against the overall trend and placing a trade once that reversal ends and the price moves back in the direction of the overall trend.
The Stochastic RSI + MA Strategy utilizes confirmation between extreme RSI calculations and the overall trend as measured by (3) separate Moving Averages.
The Stochastic RSI is completely customizable by:
Long Entry Bar Cross Below
Short Entry Bar Cross Above
K
D
RSI Length
Stochastic Length
RSI Source
----- Finally, we backtest our ideas. -----
After using the 'Strategy Tester' tab on TradingView to thoroughly backtest your predictions you are ready to take it to the next level - Automated Trading!
This was my whole reason for creating the script. If you work a full-time job, live in a time zone that is hard to trade, or just don't have the patience, this will be a game-changer for you as it was for me.
Auto-Trading
When it comes to auto-trading this strategy I have included two options in the script that utilize the alert messages generated by TradingView.
*Note: Please trade on a demo account until you feel comfortable enough to use real money, and then please stick to 1%-2% of your total account value in risk per trade.*
AutoView
PineConnector
**ATR Auto-Trading Alert Setup**
How to create alerts on Stoch+MA Strategy
For Trailing Stops:
1) Adjust autoview/pineconnector settings
2) Click "add alert"
3) Select "Condition" = Strategy Name
4) Select "Order Fills Only" from the drop-down
3) Remove template message text from "message" box and place exact text. {{strategy.order.alert_message}}
4) Click "create"
For Fixed Pip Stop:
1) Adjust autoview/pineconnector settings
2) Click "add alert"
3) Select "Condition" = Strategy Name
4) Select "alert() function calls only"
5) I like to title my Alert Name the same thing I named it as an Indicator Template to keep track
Good luck with your trading!

MilleMachineHello traders,
I hereby present to you the second stage of my journey to finding a reliable, profitable trading strategy.
The "Millemachine" is based on the "Millebot", my previous published strategy. This means the backbone of the strategy is still the same: a trend following system. Instead of using a fixed TP and SL, a trailing stoploss is now used. To limit the losses when the trend weakens, the trailing stoploss automatically gets smaller, as it is based on the ATR.
A new utility is you can now easily switch between indicators on which the decision making is based. This allows the user to discover which indicators work best for entry, long/short switching and stoploss configuration.
The strategy has been proven to be very profitable in trending markets, but can suffer losses during ranging market. To make the system more robust, the strategy cannot solely rely on a trending system. Other systems must be added.
I believe that a good trading bot must consist of more than 4 different strategies, based on different systems. This is what I am currently working on.
My goal for publishing this strategy is to help other traders build their own. In my journey I found it difficult to find a good strategy that employs a decent risk management, which is truly essential for having good, consistent results. Also, a realistic commission needs to be defined to have a realistic performance prediction. This weighs on the profitability and therefore is often set at 0 by authors of other strategies, which I find misleading.
If you have found this strategy informative or useful, please leave a comment.
Greetings Michael

Octopus_AlgoGram_IndicatorHello traders!
I have been developing Octopus trading indicator over the last year. This algorithm indicator is based on a set of different strategies, each with its own weight (weighted strategy). The set of strategies that I currently use are 5:
Volume
ADX
MA crossover
Macd
Chaikin Oscillator
Moreover, this indicator includes STOP losses criteria and a taking profit strategy. this indicator must be optimized for the desired asset to achieves its full potential.
Best Time-Frame :
The 10 & 23 Minutes Time frame give good results. The algo has been tested for several asset (same dataframe, different optimization values).
When to Buy & Sell :
Buy Entry & Exit : Take entry when Green Arrow or Buy Trigger on screen & Exit when Purple Arrow or exit trigger on screen
Sell Exit & Exit : Take entry when Red Arrow or Sell Trigger on screen & Exit when Purple Arrow or exit trigger on screen
Important note:
Backtest the algorithm with different data stamps to avoid overfitting results
How it works:
The algorithm is based on a combination of well-documented indicators. First, the algorithm calculated the weight_strategy, which represents a value from 0 to 5 of the number of strategies that are fulfilled (in case the weight of each strategy is the same). To open a position, the value of weight_strategy must be greater than the value of weight_signal, by default 2. Modify the indicator parameters for the desired asset and data frame. Set stop-loss and take profit criteria.
Features:
* The algorithm allows to trade with long, short or both positions.
* Backtest the algorithm over a defined interval (data stamp), e.g., from 2022
* stop loss (SL) orders based on movement of the previous candle source, e.g., close or candle volatility . Only close the position after the candle is close!
* It can moves the stop loss when this indicator takes profit (TP)
* Take profit based on market movement and once all condition true they push exit order
* Define delays to evaluate the strategies of more previous candles:
+ Candle delay Exit is the number of candles the algorithm waits to open a new position.
* Choose if you want to use the weighted strategy or just some of them.
* Choose the weight (relevance) of each strategy.
* Customize the well documented MA cross strategy.
Disclaimer :
AlgoGram Script,Indicator,Strategy,Trading Idea & presentations are only for educational & Research purposes and are not intended as investment advice. I cannot guarantee the accuracy of any information provided above , please take trade with help of your Financial adviser or on your own risk
Cheers! & Best Of Luck
By AlgoGram
Eagle_AlgoGram_IndicatorHello traders!
I have been developing Eagle trading indicator over the last year. This algorithm indicator is based on a set of different strategies, each with its own weight (weighted strategy). The set of strategies that I currently use are 4:
Stochastic RSI
ADX
MA crossover
Keltner Channel
Moreover, this indicator includes STOP losses criteria and a taking profit strategy. this indicator must be optimized for the desired asset to achieves its full potential.
Best Time-Frame :
The 5 & 8 Minutes Time frame give good results. The algo has been tested for several asset (same dataframe, different optimization values).
When to Buy & Sell :
Buy Entry & Exit : Take entry when Green Arrow or Buy Trigger on screen & Exit when Purple Arrow or exit trigger on screen
Sell Exit & Exit : Take entry when Red Arrow or Sell Trigger on screen & Exit when Purple Arrow or exit trigger on screen
Important note:
Backtest the algorithm with different data stamps to avoid overfitting results
How it works:
The algorithm is based on a combination of well-documented indicators. First, the algorithm calculated the weight_strategy, which represents a value from 0 to 5 of the number of strategies that are fulfilled (in case the weight of each strategy is the same). To open a position, the value of weight_strategy must be greater than the value of weight_signal, by default 2. Modify the indicator parameters for the desired asset and data frame. Set stop-loss and take profit criteria.
Features:
* The algorithm allows to trade with long, short or both positions.
* Backtest the algorithm over a defined interval (data stamp), e.g., from 2022
* stop loss (SL) orders based on movement of the previous candle source, e.g., close or candle volatility . Only close the position after the candle is close!
* It can moves the stop loss when this indicator takes profit (TP)
* Take profit based on market movement and once all condition true they push exit order
* Define delays to evaluate the strategies of more previous candles:
+ Candle delay Stoch RSI is for the Stochastic RSI strategy.
+ Candle delay Exit is the number of candles the algorithm waits to open a new position.
* Choose if you want to use the weighted strategy or just some of them.
* Choose the weight (relevance) of each strategy.
* Customize the well-documented Stochastic RSI strategy.
* Customize the well documented MA cross strategy.
Disclaimer :
AlgoGram Script,Indicator,Strategy,Trading Idea & presentations are only for educational & Research purposes and are not intended as investment advice. I cannot guarantee the accuracy of any information provided above , please take trade with help of your Financial adviser or on your own risk
Cheers! & Best Of Luck
By AlgoGram

Shark_AlgoGram_IndicatorHello traders!
I have been developing Shark trading indicator over the last year. This algorithm indicator is based on a set of different strategies, each with its own weight (weighted strategy). The set of strategies that I currently use are 6:
MACD
Stochastic RSI
RSI
Supertrend
MA crossover
Donchin Channel
Moreover, this indicator includes STOP losses criteria and a taking profit strategy. this indicator must be optimized for the desired asset to achieves its full potential.
Best Time-Frame :
The 30 & 31 Minutes Time frame give good results. The algo has been tested for several asset (same dataframe, different optimization values).
When to Buy & Sell :
Buy Entry & Exit : Take entry when Green Arrow or Buy Trigger on screen & Exit when Purple Arrow or exit trigger on screen
Sell Exit & Exit : Take entry when Red Arrow or Sell Trigger on screen & Exit when Purple Arrow or exit trigger on screen
Important note:
Backtest the algorithm with different data stamps to avoid overfitting results
How it works:
The algorithm is based on a combination of well-documented indicators. First, the algorithm calculated the weight_strategy, which represents a value from 0 to 5 of the number of strategies that are fulfilled (in case the weight of each strategy is the same). To open a position, the value of weight_strategy must be greater than the value of weight_signal, by default 2. Modify the indicator parameters for the desired asset and data frame. Set stop-loss and take profit criteria.
Features:
* The algorithm allows to trade with long, short or both positions.
* Backtest the algorithm over a defined interval (data stamp), e.g., from 2022
* stop loss (SL) orders based on movement of the previous candle source, e.g., close or candle volatility. Only close the position after the candle is close!
* It can moves the stop loss when this indicator takes profit (TP) & Market true such condition where trailing SL Activate
* Take profit based on market movement and once 3 condition true out of 6 True they push exit order
* Define delays to evaluate the strategies of more previous candles:
+ Candle Delay is for MACD strategy
+ Candle delay Stoch RSI is for the Stochastic RSI strategy.
+ RSI Candle Delay is for the RSI strategy.
+ Candle delay Exit is the number of candles the algorithm waits to open a new position.
* Choose if you want to use the weighted strategy or just some of them.
* Choose the weight (relevance) of each strategy.
* Customize the well-documented MACD strategy.
* Customize the well-documented Stochastic RSI strategy.
* Customize the well-documented RSI strategy.
* Customize the well-documented Supertrend strategy.
* Customize the well documented MA cross strategy.
Disclaimer :
AlgoGram Script,Indicator,Strategy,Trading Idea & presentations are only for educational & Research purposes and are not intended as investment advice. I cannot guarantee the accuracy of any information provided above , please take trade with help of your Financial adviser or on your own risk
Cheers! & Best Of Luck
By AlgoGram
