🔥 ANDINO Risk Ultimate 🔥Indicator for profitable trading, allowing buy, sell, stop-loss, and 3 take-profit entries, providing profitability and simplifying your trading.
In den Scripts nach "take profit" suchen

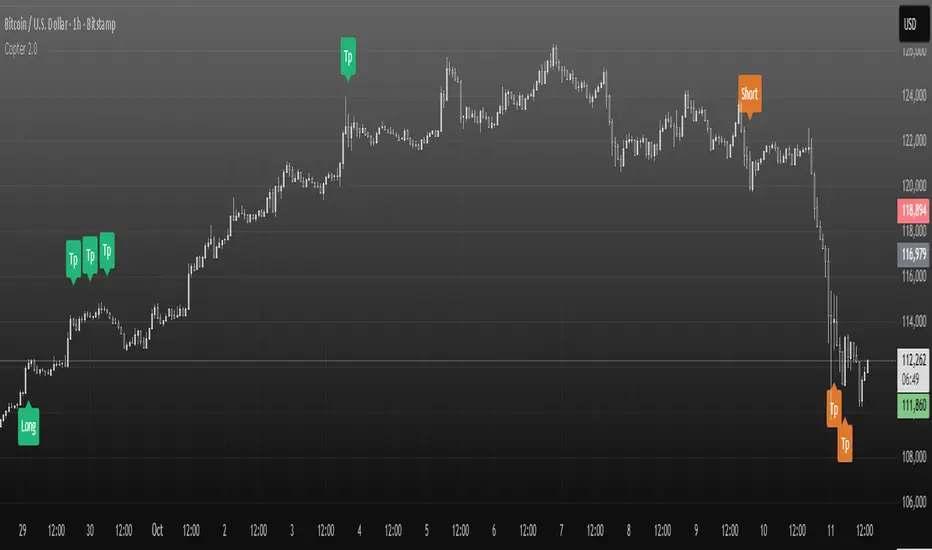
Copter 2.0💡 The indicator is designed for trading on any timeframe and includes a comprehensive system for determining entry and exit points based on technical analysis, price and volume.
📊 In the new version of Copter 2.0, the take profit and stop loss functions have been added
Let's analyze its key components:
✔️ Trend levels and extremes:
- The indicator determines local highs and lows for a certain period.
- the breakdown of these levels serves as a signal to open positions.
- the High-Low price dynamics analysis method is used to find key entry points.
✔️ Volumes:
-The indicator uses a configurable volume threshold to filter out candles with low volume and display only those with significant volume.
- the algorithm analyzes market data and sets an entry signal (opening a trade) and exit (profit taking/closing a position)
📍 Therefore, whether you are a beginner or an experienced trader, the indicator can help you stay ahead of the game and make more informed trading decisions.
📍 As a result, the trader can be sure that the signal is based on data analysis.
A long or short position can be stopped with either a profit or a small loss without prejudice to the potential profit.
✔️ Signal filtering:
- volume and volatile indicators are used to confirm the trend
- if a volume or volatility filter does not confirm the breakdown, the input signal is ignored
- analysis of moving averages of volumes and ATR is used
✔️ The use of the RSI in overbought and oversold analysis:
- the RSI indicator analyzes the strength of the current trend
- if the RSI exceeds 70, exit from a long position is possible
- if the RSI falls below 30, exit from a short position is possible
✔️ The use of EMA 20 and EMA 200
is additional moving average data that determines the current trend and the trend on higher timeframes.
- the main idea is that when they cross, we can see a change in trend movement and determine the general mood at the moment, based on which signals appear to open/close a deal.
- also, the indicator analyzes the past movement, thus determining the future direction
- based on the opening and closing of the past days, weeks, months.
✔️ Stop loss and risk management
- when entering a trade, a dynamic stop loss is set based on the percentage price change
- exit the position is carried out when a stop loss or a signal from the RSI is reached.
- it helps to minimize losses and protect profits
The market is unstable, and it is impossible to know what awaits it in the future.
The only way to manage risk is to limit the loss by setting a stop loss at 1% - 2% of the entry point.
It is recommended to set the profit in the ratio 1:1, 1:2,1:3, with partial fixation of 40%, 30%, 30% or wait for the indicator signal (TP)
We recommend fixing positions in parts. There will be a signal in the opposite direction when the volume is released.
To match the risk of the transaction, we recommend that you do not enter with high leverage.
Trade only with the amount that you are willing to lose.
With increased volatility in the market and flat, the indicator can give many signals.
After a strong fall or growth, we recommend not to open positions, because the probability of a flat is high.
✔️ Visualization of entry and exit points
- Entry points (long and short) are graphically displayed. green - long, orange - short
- stop loss levels are marked for clarity of risk management
✔️Recommendations for working with the indicator!
Entry/exit is performed on the next candle after the candle with the signal (buy/sell)
All timeframes and any trading pairs are used (when selecting settings for each one)
The indicator combines several methods of technical analysis:
- work with support and resistance levels
- filtering of signals based on volumes and volatility
- Overbought and oversold analysis using the RSI
- automatic risk management through stop loss
This approach makes the indicator a useful tool for short-term trading and active scalping.
❗️ NO REPAINT ! ❗️
Market Sentiment Trend Gauge [LevelUp]Market Sentiment Trend Gauge simplifies technical analysis by mathematically combining momentum, trend direction, volatility position, and comparison against a market benchmark, into a single trend score from -100 to +100. Displayed in a separate pane below your chart, it resolves conflicting signals from RSI, moving averages, Bollinger Bands, and market correlations, providing clear insights into trend direction, strength, and relative performance.
THE PROBLEM MARKET SENTIMENT TREND GAUGE (MSTG) SOLVES
Traditional indicators often produce conflicting signals, such as RSI showing overbought while prices rise or moving averages indicating an uptrend despite market underperformance. MSTG creates a weighted composite score to answer: "What's the overall bias for this asset?"
KEY COMPONENTS AND WEIGHTINGS
The trend score combines
▪ Momentum (25%): Normalized 14-period RSI, capped at ±100.
▪ Trend Direction (35%): 10/21-period EMA relationships,
▪ Volatility Position (20%): Price position, 20-period Bollinger Bands, capped at ±100.
▪ Market Comparison (20%): Daily performance vs. SPY benchmark, capped at ±100.
Final score = Weighted sum, smoothed with 5-period EMA.
INTERPRETING THE MSTG CHART
Trend Score Ranges and Colors
▪ Bright Green (>+30): Strong bullish; ideal for long entries.
▪ Light Green (+10 to +30): Weak bullish; cautiously favorable.
▪ Gray (-10 to +10): Neutral; avoid directional trades.
▪ Light Red (-10 to -30): Weak bearish; exercise caution.
▪ Bright Red (<-30): Strong bearish; high-risk for longs, consider shorts.
Reference Lines
▪ Zero Line (Gray): Separates bullish/bearish; crossovers signal trend changes.
▪ ±30 Lines (Dotted, Green/Red): Thresholds for strong trends.
▪ ±60 Lines (Dashed, Green/Red): Extreme strength zones (not overbought/oversold); manage risk (tighten stops, partial profits) but trends may persist.
Background Colors
▪ Green Tint (>+20): Bullish environment; favorable for longs.
▪ Red Tint (<-20): Bearish environment; caution for longs.
▪ Light Gray Tint (-20 to +20): Neutral/range-bound; wait for signals.
Extreme Readings vs. Traditional Signals
MSTG ±60 indicates maximum alignment of all factors, not reversals (unlike RSI >70/<30). Use for risk management, not automatic exits. Strong trends can sustain extremes; breakdowns occur below +30 or above -30.
INFORMATION TABLE INTERPRETATION
Trend Score Symbols
▲▲ >+30 strong bullish
▲ +10 to +30
● -10 to +10 neutral
▼ -30 to -10
▼▼ <-30 strong bearish
Colors: Green (positive), White (neutral), Red (negative).
Momentum Score
+40 to +100 strong bullish
0 to +40 moderate bullish
-40 to 0 moderate bearish
-100 to -40 strong bearish
Market vs. Stock
▪ Green: Stock outperforming market
▪ Red: Stock underperforming market
Example Interpretations:
-0.45% / +1.23% (Green): Market down, stock up = Strong relative strength
+2.10% / +1.50% (Red): Both rising, but stock lagging = Relative weakness
-1.20% / -0.80% (Green): Both falling, but stock declining less = Defensive strength
UNDERSTANDING EXTREME READINGS VS TRADITIONAL OVERBOUGHT/OVERSOLD
⚠️ Critical distinctions
Traditional Overbought/Oversold Signals:
▪ Single indicator (like RSI >70 or <30) showing momentum excess
▪ Often suggests immediate reversal or pullback expected
▪ Based on "price moved too far, too fast" concept
MSTG Extreme Readings (±60):
▪ Composite alignment of 4 different factors (momentum, trend, volatility, relative strength)
▪ Indicates maximum strength in current direction
▪ NOT a reversal signal - means "all systems extremely bullish/bearish"
Key Differences:
▪ RSI >70: "Price got ahead of itself, expect pullback"
▪ MSTG >+60: "Everything is extremely bullish right now"
▪ Strong trends can maintain extreme MSTG readings during major moves
▪ Breakdowns happen when MSTG falls below +30, not at +60
Proper Usage of Extreme Readings:
▪ Risk Management: Tighten stops, take partial profits
▪ Position Sizing: Reduce new position sizes at extremes
▪ Trend Continuation: Watch for sustained extreme readings in strong markets
▪ Exit Signals: Look for breakdown below +30, not reversal from +60
TRADING WITH MSTG
Quick Assessment
1. Check trend symbol for direction.
2. Confirm momentum strength.
3. Note relative performance color.
Examples:
▲▲ 55.2 (Green), Momentum +28.4, Outperforming: Strong buy setup.
▼ -18.6 (Red), Momentum -43.2, Underperforming: Defensive positioning.
Entry Conditions
▪ Long: stock outperforming market
- Score >+30 (bright green)
- Sustained green background
- ▲▲ symbol,
▪ Short: stock underperforming market
- Score <-30 (bright red)
- Sustained red background
- ▼▼ symbol
Avoid Trading When:
▪ Gray zone (-10 to +10).
▪ Rapid color changes or frequent zero-line crosses (choppy market).
▪ Gray background (range-bound).
Risk Management:
▪ Stop Loss: Exit on zero-line crossover against position.
▪ Take Profit: Partial at ±60 for risk control.
▪ Position Sizing: Larger when signals align; smaller in extremes or mixed conditions.
KEY ADVANTAGES
▪ Unified View: Weighted composite reduces noise and conflicts.
▪ Visual Clarity: 5-color system with gradients for rapid recognition.
▪ Market Context: Relative strength vs. SPY identifies leaders/laggards.
▪ Flexibility: Works across timeframes (1-min to weekly); customizable table.
▪ Noise Reduction: EMA smoothing minimizes false signals.
EXAMPLES
Strong Bull: Trend Score 71.9, Momentum Score 76.9
Neutral: Trend Score 0.1, Momentum Score -9.2
Strong Bear: Trend Score -51.7, Momentum Score -51.5
PERFORMANCE AND LIMITATIONS
Strengths: Trend identification, noise reduction, relative performance versus market.
Limitations: Lags at turning points, less effective in extreme volatility or non-trending markets.
Recommendations: View on multiple timeframes, combine with price action and fundamentals.

Trading Mastery Indicator# Trading Mastery Indicator - Complete User Guide
## Overview
The Trading Mastery Indicator is a professional-grade technical analysis tool that provides high-probability trading signals with complete trade management information including entry, stop loss, and take profit levels.
## Key Features
- High-Quality Signal Detection: Identifies strong, medium, and weak trading opportunities
- Complete Trade Setup: Provides entry, stop loss, and take profit for every signal
- Risk Management: Calculates risk-to-reward ratios automatically
- Elliott Wave Analysis: Integrated wave pattern and position analysis
- Active Signal Tracking: Shows when you're currently in a trade
- Professional Alerts: Detailed notifications with all trade parameters
## Signal Quality Classification
### STRONG Signals (Premium Quality)
- Reliability: Highest probability setups
- Market Conditions: Strong trending environments
- Color: Teal for buys, Red for sells
- When to Trade: These are your primary trading opportunities
- Risk Profile: Lowest risk, highest reward potential
### MEDIUM Signals (Standard Quality)
- Reliability: Good probability setups
- Market Conditions: Moderate trend or consolidation breakouts
- Color: Gold for buys, Purple for sells (Change to Blue Gray)
- When to Trade: Secondary opportunities when strong signals are scarce
- Risk Profile: Moderate risk, good reward potential
### WEAK Signals (Entry Quality)
- Reliability: Lower probability setups
- Market Conditions: Counter-trend or unclear market structure
- Color: Coral for buys, Pink for sells
- When to Trade: Only for experienced traders in specific market conditions
- Risk Profile: Higher risk, variable reward
## How to Use the Indicator
### 1. Signal Settings Configuration
Signal Filter Options:
- All Signals: Shows every trading opportunity (strong, medium, weak)
- High Quality Only: Shows only the highest probability setups
- High + Medium Quality**: Balanced approach filtering out weak signals
Recommended Settings by Experience:
- Beginner: Use "High Quality Only"
- Intermediate: Use "High + Medium Quality"
- Advanced: Use "All Signals" with proper risk management
Label Controls:
- Label Position: Adjust how close labels appear to candles
- Label Text Size: Choose based on screen size and preference
- Maximum Labels: Control chart clutter (recommended: 20)
### 2. Understanding the Professional Panel
The panel provides real-time market intelligence:
Primary Trend: Market direction analysis
- BULLISH TREND: Look for buy opportunities only
- BEARISH TREND: Look for sell opportunities only
- CONSOLIDATION: Market indecision, trade with caution
Wave Pattern: Elliott Wave structure analysis
- IMPULSE UP: Strong bullish momentum
- IMPULSE DOWN: Strong bearish momentum
- CORRECTION: Sideways/corrective movement
Wave Position: Current Elliott Wave position
- WAVE 3 (STRONG): Most powerful moves, best for trend following
- WAVE 1 OR 5: Beginning or ending waves
- WAVE 2 OR 4: Corrective phases, lower probability
- CORRECTIVE ABC: Wait for pattern completion
Signal Grade: Current signal status
- SIGNAL ACTIVE: You're currently in a trade
- PREMIUM/STANDARD/SPECULATIVE: New signal quality
- NO SIGNAL: No current opportunities
Trading Bias: Overall market direction
- LONG BIAS: Focus on buy opportunities
- SHORT BIAS: Focus on sell opportunities
- NEUTRAL: No clear directional bias
### 3. Reading Signal Labels
Each signal provides complete trade setup information:
```
STRONG BUY
━━━━━━━━━━━━━━━━━━━━
💰 Entry: 1875.50
🛡️ SL: 1860.25
🎯 TP: 1905.75
📈 R:R = 1:2.0
━━━━━━━━━━━━━━━━━━━━
```
Understanding the Information:
- Entry: Exact price level to enter the trade
- SL: Stop loss level (risk management)
- TP: Take profit level (profit target)
- R:R: Risk-to-reward ratio (1:2.0 means you risk 1 to make 2)
### 4. Entry/TP/SL Level Lines
Visual trade management aids:
- Blue Solid Line: Entry level
- Red Dashed Line: Stop loss level
- Green Dashed Line: Take profit level
- Small Labels: "ENTRY", "SL", "TP" markers
## Trading Strategy Guidelines
### Trend Following Strategy
1. Check Panel: Ensure trend aligns with your trade direction
2. Wait for Signals: Only trade in the direction of the primary trend
3. Quality First: Focus on STRONG signals during trending markets
4. Wave Timing: WAVE 3 positions offer the best trending opportunities
### Reversal Strategy
1. Look for Divergence: Panel shows trend change signals
2. Wait for Confirmation: Don't jump early on potential reversals
3. Use MEDIUM Signals: Often good for catching early trend changes
4. Watch Wave Position: CORRECTIVE ABC patterns may signal trend completion
### Risk Management Rules
Position Sizing:
- Risk no more than 1-2% of account per trade
- Use the provided R:R ratios to calculate position sizes
- Stronger signals can justify slightly larger positions
Stop Loss Management:
- Always use the provided stop loss levels
- Never move stops against your position
- Consider trailing stops once trade moves in your favor
Take Profit Strategy:
- Use provided TP levels as minimum targets
- Consider taking partial profits at TP level
- Let strong trends run beyond TP in trending markets
## Best Practices by Timeframe
### Scalping (M1-M5)
- Use "High Quality Only" filter
- Focus on STRONG signals only
- Quick entry and exit
- Expect more false signals due to market noise
### Intraday Trading (M15-H1)
- Use "High + Medium Quality" filter
- Good balance of opportunity and reliability
- Hold trades for several hours
- Most versatile timeframe for the indicator
### Swing Trading (H4-Daily)
- Use "All Signals" with proper analysis
- Hold trades for days to weeks
- Most reliable signals on higher timeframes
- Best for beginners due to less noise
## Panel Customization
Position Options:
- Top Right: Default, doesn't interfere with price action
- Top Left: Good for wide screens
- Bottom corners: Keeps important info visible while analyzing tops
- Middle positions: Central reference, good for multi-monitor setups
Size Options:
- Small: Minimal screen space, good for small screens
- Normal: Balanced visibility and space usage
- Large: Easy reading, good for detailed analysis
Transparency: Adjust 0-95% based on preference and chart background
## Common Mistakes to Avoid
### Signal Interpretation Errors
- Don't ignore the trend: Trading against primary trend reduces success
- Don't chase weak signals: Focus on quality over quantity
- Don't ignore wave position: WAVE 2/4 corrections are lower probability
### Risk Management Errors
- Don't skip stop losses: Every signal includes SL for a reason
- Don't risk too much: Even strong signals can fail
- Don't move stops against position: Stick to the plan
### Psychological Errors
- Don't overtrade: Wait for quality setups
- Don't second-guess strong signals: Trust the analysis
- Don't panic on normal drawdowns: Expect some losing trades
## Alert Configuration
Enable alerts for:
- Strong signals: Primary trading opportunities
- Medium signals: Secondary opportunities (optional)
- Signal active status: Know when you're in trades
Alert messages include complete trade information for easy execution.
## Performance Optimization
### For Best Results:
1. Combine with price action: Look for confluence with support/resistance
2. Consider market sessions: Different sessions have different characteristics
3. Monitor news events: Avoid trading during high-impact news
4. Keep a trading journal: Track which signals work best for your style
### Regular Review:
- Weekly analysis: Review which signal types performed best
- Timeframe assessment: Determine your most profitable timeframes
- Strategy refinement: Adjust filters based on performance data
## Troubleshooting
If you're not seeing signals:
- Check that "Show Buy/Sell Signals" is enabled
- Verify your signal filter isn't too restrictive
- Market may be in a consolidation phase
If labels are cluttered:
- Reduce "Maximum Labels to Show"
- Change label position to "Far from Candle"
- Use smaller label text size
If panel is in the way:
- Change panel position
- Increase transparency
- Reduce panel size
- Toggle panel off temporarily
Remember: This indicator provides analysis and signals, but successful trading also requires proper risk management, emotional discipline, and understanding of market conditions. Always practice with demo accounts before risking real capital, and never risk more than you can afford to lose.

ICT Institutional Order Flow (Riz)This indicator implements Inner Circle Trader (ICT) institutional order flow concepts to identify high-probability entry points where smart money is actively participating in the market. It combines volume analysis, market structure, and price action patterns to detect institutional accumulation and distribution zones.
Core Concepts & Methodology
1. Institutional Order Blocks Detection
Order blocks represent the last opposing candle before a strong directional move, indicating institutional accumulation (bullish) or distribution (bearish) zones.
How it works:
⦁ Identifies the final bearish candle before bullish expansion (accumulation)
⦁ Identifies the final bullish candle before bearish expansion (distribution)
⦁ Validates with volume spike (2x average) to confirm institutional participation
⦁ Requires minimum 0.5% price displacement to filter weak moves
⦁ Tracks these zones as future support/resistance levels
2. Fair Value Gap (FVG) Analysis
FVGs are price inefficiencies created by aggressive institutional orders that leave gaps in price action.
Detection method:
⦁ Bullish FVG: When current low > high from 2 bars ago
⦁ Bearish FVG: When current high < low from 2 bars ago
⦁ Minimum gap size filter (0.1% default) eliminates noise
⦁ Monitors gap fills with volume for entry signals
⦁ Gaps act as magnets drawing price back for "rebalancing"
3. Liquidity Hunt Detection
Institutions often trigger retail stop losses before reversing direction, creating liquidity for their positions.
Algorithm:
⦁ Calculates rolling 20-period highs/lows as liquidity pools
⦁ Detects wicks beyond these levels (0.1% sensitivity)
⦁ Identifies rejection back inside range (liquidity grab)
⦁ Volume spike confirmation ensures institutional involvement
⦁ These reversals often mark significant turning points
4. Volume Profile Integration
Analyzes volume distribution across price levels to identify institutional interest zones.
Components:
⦁ Point of Control (POC): Price level with highest volume (institutional consensus)
⦁ Value Area: 70% of volume range (institutional comfort zone)
⦁ Uses 50-bar lookback to build volume histogram
⦁ 20 price levels for granular distribution analysis
5. Market Structure Analysis
Determines overall trend bias using pivot points and swing analysis.
Process:
⦁ Identifies swing highs/lows using 3-bar pivots
⦁ Bullish structure: Price above last swing high
⦁ Bearish structure: Price below last swing high
⦁ Filters signals to trade with institutional direction
Signal Generation Logic
BUY signals trigger when ANY condition is met:
1. Order Block Formation: Bearish-to-bullish transition + volume spike + strong move
2. Liquidity Grab Reversal: Sweep below lows + recovery + volume spike
3. FVG Fill: Price fills bullish gap with institutional volume (within 3 bars)
4. Order Block Respect: Price bounces from previous bullish OB + volume
SELL signals trigger when ANY condition is met:
1. Order Block Formation: Bullish-to-bearish transition + volume spike + strong move
2. Liquidity Grab Reversal: Sweep above highs + rejection + volume spike
3. FVG Fill: Price fills bearish gap with institutional volume (within 3 bars)
4. Order Block Respect: Price rejects from previous bearish OB + volume
Additional filters:
⦁ Signals align with market structure (no counter-trend trades)
⦁ No new signals while position is active
⦁ All signals require volume confirmation (institutional fingerprint)
Trading Style Auto-Configuration
The indicator features intelligent preset configurations for different trading styles:
Scalping Mode (1-5 min charts):
⦁ Volume multiplier: 1.5x (more signals)
⦁ Tighter parameters for quick trades
⦁ Risk:Reward 1.5:1, ATR multiplier 1.0
Day Trading Mode (15-30 min charts):
⦁ Volume multiplier: 1.7x (balanced)
⦁ Medium sensitivity settings
⦁ Risk:Reward 2:1, ATR multiplier 1.5
Swing Trading Mode (1H-4H charts):
⦁ Volume multiplier: 2.0x (quality focus)
⦁ Conservative parameters
⦁ Risk:Reward 3:1, ATR multiplier 2.0
Custom Mode:
⦁ Full manual control of all parameters
Visual Components
⦁ Order Blocks: Colored rectangles (green=bullish, red=bearish)
⦁ Fair Value Gaps: Orange boxes showing imbalances
⦁ Liquidity Levels: Dashed blue lines at key highs/lows
⦁ Volume Spikes: Yellow background highlighting
⦁ POC Line: Orange line showing highest volume price
⦁ Value Area: Blue shaded zone of 70% volume
⦁ Buy/Sell Signals: Triangle markers with text labels
⦁ Stop Loss/Take Profit: Dotted lines (red/green)
Information Panel
Real-time dashboard displaying:
⦁ Current trading mode
⦁ Volume ratio (current vs average)
⦁ Market structure (bullish/bearish)
⦁ Active order blocks count
⦁ Position status
⦁ Configuration details
How to Use
Step 1: Select Trading Style
Choose your style in settings - all parameters auto-adjust
Step 2: Timeframe Selection
⦁ Scalping: 1-5 minute charts
⦁ Day Trading: 15-30 minute charts
⦁ Swing: 1H-4H charts
Step 3: Signal Interpretation
⦁ Wait for BUY/SELL markers
⦁ Check volume ratio >2 for strong signals
⦁ Verify market structure alignment
⦁ Note automatic SL/TP levels
Step 4: Risk Management
⦁ Default 2:1 risk:reward (adjustable)
⦁ Stop loss: 1.5x ATR from entry
⦁ Position sizing based on stop distance
Best Practices
1. Higher probability setups occur when multiple conditions align
2. Volume confirmation is crucial - avoid signals without volume spikes
3. Trade with structure - longs in bullish, shorts in bearish structure
4. Monitor POC - acts as dynamic support/resistance
5. Confluence zones where OBs, FVGs, and liquidity levels overlap are strongest
Important Notes
⦁ Not a standalone system - combine with your analysis
⦁ Works best in trending markets with clear structure
⦁ Adjust settings based on instrument volatility
⦁ Backtest thoroughly on your specific markets
⦁ Past performance doesn't guarantee future results
Alerts Available
⦁ ICT Buy Signal
⦁ ICT Sell Signal
⦁ Volume Spike Detection
⦁ Liquidity Grab Detection
This indicator provides a systematic approach to ICT concepts, helping traders identify where institutions are entering positions through volume analysis and key price action patterns. The auto-configuration feature ensures optimal settings for your trading style without manual adjustment.
Disclaimer
This tool is for educational and research purposes only. It is not financial advice, nor does it guarantee profitability. All trading involves risk, and users should test thoroughly before applying live.

PRIMO+ (dc_77)PRIMO+ (dc_77) - Advanced Multi-Session Trading System
Overview
This comprehensive trading indicator combines market structure analysis, Fair Value Gap (FVG) detection, and multi-timeframe bias assessment to identify high-probability trading opportunities during key market sessions. The system operates on a sophisticated framework that evaluates market sentiment across multiple reference points and provides complete trade management projections.
Core Features
Multi-Timeframe Bias System
The indicator establishes directional bias by analyzing price action relative to four critical reference points:
- 18:00 NY Open: Previous day's market opening level
- 00:00 Midnight: Daily reset reference price
- 09:30 NY Open: Current session market opening
- 09:45 NY Open: Key institutional entry timeframe
Bias Logic:
- LONGS Bias: Price trading below ALL reference levels (institutional accumulation zone)
- SHORTS Bias: Price trading above ALL reference levels (institutional distribution zone)
- BEWARE: Mixed signals across reference points (avoid trading)
Four-Session Architecture
The system monitors four distinct trading sessions, each representing different market participant activities:
1. Session 1 (09:45-10:20): London/NY overlap - high liquidity period
2. Session 2 (10:45-11:30): NY continuation - institutional positioning
3. Session 3 (13:50-14:10): Pre-close positioning - smart money moves
4. Session 4 (15:50-16:05): Market close - final institutional plays
Each session can be individually enabled/disabled with custom time ranges.
Advanced Fair Value Gap Detection
The indicator identifies three-candle imbalances using sophisticated filtering:
FVG Classification:
- Bullish FVGs: Gaps between candle 3 high and candle 1 low (upward imbalance)
- Bearish FVGs: Gaps between candle 1 high and candle 3 low (downward imbalance)
Dynamic Filtering System:
- Bias alignment filtering (only shows FVGs aligned with overall market bias)
- Trend direction filtering (FVGs must align with market structure)
- Session-based activation/deactivation
- Real-time gap validation and invalidation
Market Structure Shift (MSS) Detection
Proprietary swing-based algorithm identifies significant market structure changes:
- Bullish MSS: Price breaks above previous significant high with trend confirmation
- Bearish MSS: Price breaks below previous significant low with trend confirmation
- Dynamic Lookback: Configurable swing detection sensitivity (4-5 bar pivots)
Comprehensive Risk Management System
When conditions align, the indicator projects complete trade setups:
Entry Methodology:
- FVG center point calculated using mathematical precision
- Entry triggered only when MSS occurs with aligned bias
- Confirmation timer prevents false signals (22-second default validation)
Stop Loss Calculation:
- Dynamic SL placement based on FVG displacement
- 1.15x multiplier applied to gap distance for optimal risk positioning
- Adaptive to market volatility and gap size
Take Profit Projections:
- Five sequential TP levels (1:1 through 1:5 risk-reward ratios)
- Mathematical progression based on initial risk calculation
- Visual projection lines extend into future bars
Visual Signal System
Trade Signals:
- Green up arrows for bullish setups (positioned below stop loss level)
- Red down arrows for bearish setups (positioned above stop loss level)
- Optional date stamps showing signal generation time
Projection Lines:
- Entry level (gray dotted line)
- Stop loss level (red line)
- Multiple take profit levels (green lines with ratio labels)
- Customizable line styles and widths
Alert Integration
Real-time notifications when complete setups form:
- Bar-close confirmation prevents false alerts
- Separate bull/bear alert messages
- Integration with TradingView's alert system
- Optional sound notifications
Configuration Options
Display Settings
- Session Anchor Lines: Visual markers for session starts
- MSS Lines: Market structure shift visualization
- Trend Lines: ZigZag pattern display
- Signal Arrows: Entry point indicators
- Date Labels: Timestamp display for signals
Color Customization
- Bullish FVG color and transparency
- Bearish FVG color and transparency
- MSS line colors (separate bull/bear)
- Projection line colors
- Stop loss and take profit colors
Risk Parameters
- Confirmation time adjustment (prevents false signals)
- Risk-reward multiplier customization
- Projection line extension length
- Label and arrow size options
Usage Guidelines
Trading Sessions
Best performance during specified session times when institutional activity is highest. The system automatically adjusts for New York timezone.
Entry Criteria
All conditions must align for signal generation:
1. Appropriate market bias established
2. FVG present and validated within session
3. Market structure shift in aligned direction
4. Confirmation timer validation passed
Risk Management
- Always respect projected stop loss levels
- Consider partial profit-taking at projected TP levels
Important Disclaimers
This indicator is for educational and analytical purposes. All trading involves risk, and past performance does not guarantee future results. Users should:
- Practice proper risk management
- Backtest thoroughly before live trading
- Understand all system components before use
- Never risk more than affordable loss amounts
The system provides analysis tools and projections but does not guarantee profitable trades. Market conditions change rapidly, and no indicator can predict future price movements with certainty.
Additional Risk Warnings and Disclaimers
Trading Addiction and Mental Health: Trading can become psychologically addictive and may lead to compulsive behavior, financial ruin, and severe emotional distress. If you find yourself unable to stop trading, risking money you cannot afford to lose, neglecting personal relationships or responsibilities, or experiencing extreme emotional swings based on trading outcomes, please seek help from a qualified mental health professional. The excitement of potential profits can mask serious underlying issues with impulse control and risk-taking behavior.
No Guarantee of Performance: This indicator has not been independently verified or audited. Backtesting results may not reflect actual trading conditions due to market slippage, execution delays, spread variations, and changing market dynamics. Historical performance is not indicative of future results, and all trading strategies can and do lose money.
Market Risk Acknowledgment: Financial markets can experience extreme volatility, flash crashes, liquidity crises, and unprecedented events that render technical analysis ineffective. Economic announcements, geopolitical events, and central bank policies can cause rapid price movements that invalidate technical setups instantly.
Position Sizing and Capital Preservation: Never risk more than 1-2% of your total account on any single trade. Proper position sizing is more important than any trading signal. Multiple consecutive losses are normal and expected - ensure your account can withstand extended drawdown periods without impairing your ability to continue trading or meet personal financial obligations.
Educational Purpose Only: This tool is designed for educational analysis and should not be construed as personalized financial advice. Consult with qualified financial advisors before making investment decisions. The creators assume no responsibility for any financial losses incurred through use of this indicator.

Composite Time ProfileComposite Time Profile Overlay (CTPO) - Market Profile Compositing Tool
Automatically composite multiple time periods to identify key areas of balance and market structure
What is the Composite Time Profile Overlay?
The Composite Time Profile Overlay (CTPO) is a Pine Script indicator that automatically composites multiple time periods to identify key areas of balance and market structure. It's designed for traders who use market profile concepts and need to quickly identify where price is likely to find support or resistance.
The indicator analyzes TPO (Time Price Opportunity) data across different timeframes and merges overlapping profiles to create composite levels that represent the most significant areas of balance. This helps you spot where institutional traders are likely to make decisions based on accumulated price action.
Why Use CTPO for Market Profile Trading?
Eliminate Manual Compositing Work
Instead of manually drawing and compositing profiles across different timeframes, CTPO does this automatically. You get instant access to composite levels without spending time analyzing each individual period.
Spot Areas of Balance Quickly
The indicator highlights the most significant areas of balance by compositing overlapping profiles. These areas often act as support and resistance levels because they represent where the most trading activity occurred across multiple time periods.
Focus on What Matters
Rather than getting lost in individual session profiles, CTPO shows you the composite levels that have been validated across multiple timeframes. This helps you focus on the levels that are most likely to hold.
How CTPO Works for Market Profile Traders
Automatic Profile Compositing
CTPO uses a proprietary algorithm that:
- Identifies period boundaries based on your selected timeframe (sessions, daily, weekly, monthly, or auto-detection)
- Calculates TPO profiles for each period using the C2M (Composite 2 Method) row sizing calculation
- Merges overlapping profiles using configurable overlap thresholds (default 50% overlap required)
- Updates composite levels as new price action develops in real-time
Key Levels for Market Profile Analysis
The indicator displays:
- Value Area High (VAH) and Value Area Low (VAL) levels calculated from composite TPO data
- Point of Control (POC) levels where most trading occurred across all composited periods
- Composite zones representing areas of balance with configurable transparency
- 1.618 Fibonacci extensions for breakout targets based on composite range
Multiple Timeframe Support
- Sessions: For intraday market profile analysis
- Daily: For swing trading with daily profiles
- Weekly: For position trading with weekly structure
- Monthly: For long-term market profile analysis
- Auto: Automatically selects timeframe based on your chart
Trading Applications for Market Profile Users
Support and Resistance Trading
Use composite levels as dynamic support and resistance zones. These levels often hold because they represent areas where significant trading decisions were made across multiple timeframes.
Breakout Trading
When composite levels break, they often lead to significant moves. The indicator calculates 1.618 Fibonacci extensions to give you clear targets for breakout trades.
Mean Reversion Strategies
Value Area levels represent the price range where most trading activity occurred. These levels often act as magnets, drawing price back when it moves too far from the mean.
Institutional Level Analysis
Composite levels represent areas where institutional traders have made significant decisions. These levels often hold more weight than traditional technical analysis levels because they're based on actual trading activity.
Key Features for Market Profile Traders
Smart Compositing Logic
- Automatic overlap detection using price range intersection algorithms
- Configurable overlap thresholds (minimum 50% overlap required for merging)
- Dead composite identification (profiles that become engulfed by newer composites)
- Real-time updates as new price action develops using barstate.islast optimization
Visual Customization
- Customizable colors for active, broken, and dead composites
- Adjustable transparency levels for each composite state
- Premium/Discount zone highlighting based on current price vs composite range
- TPO aggression coloring using TPO distribution analysis to identify buying/selling pressure
- Fibonacci level extensions with 1.618 target calculations based on composite range
Clean Chart Presentation
- Only shows the most relevant composite levels (maximum 10 active composites)
- Eliminates clutter from individual session profiles
- Focuses on areas of balance that matter most to current price action
Real-World Trading Examples
Day Trading with Session Composites
Use session-based composites to identify intraday areas of balance. The VAH and VAL levels often act as natural profit targets and stop-loss levels for scalping strategies.
Swing Trading with Daily Composites
Daily composites provide excellent swing trading levels. Look for price reactions at composite zones and use the 1.618 extensions for profit targets.
Position Trading with Weekly Composites
Weekly composites help identify major trend changes and long-term areas of balance. These levels often hold for months or even years.
Risk Management
Composite levels provide natural stop-loss levels. If a composite level breaks, it often signals a significant shift in market sentiment, making it an ideal place to exit losing positions.
Why Composite Levels Work
Composite levels work because they represent areas where significant trading decisions were made across multiple timeframes. When price returns to these levels, traders often remember the previous price action and make similar decisions, creating self-fulfilling prophecies.
The compositing process uses a proprietary algorithm that ensures only levels validated across multiple time periods are displayed. This means you're looking at levels that have proven their significance through actual market behavior, not just random technical levels.
Technical Foundation
The indicator uses TPO (Time Price Opportunity) data combined with price action analysis to identify areas of balance. The C2M row sizing method ensures accurate profile calculations, while the overlap detection algorithm (minimum 50% price range intersection) ensures only truly significant composites are displayed. The algorithm calculates row size based on ATR (Average True Range) divided by 10, then converts to tick size for precise level calculations.
How the Code Actually Works
1. Period Detection and ATR Calculation
The code first determines the appropriate timeframe based on your chart:
- 1m-5m charts: Session-based profiles
- 15m-2h charts: Daily profiles
- 4h charts: Weekly profiles
- 1D charts: Monthly profiles
For each period type, it calculates the number of bars needed for ATR calculation:
- Sessions: 540 minutes divided by chart timeframe
- Daily: 1440 minutes divided by chart timeframe
- Weekly: 7 days worth of minutes divided by chart timeframe
- Monthly: 30 days worth of minutes divided by chart timeframe
2. C2M Row Size Calculation
The code calculates True Range for each bar in the determined period:
- True Range = max(high-low, |high-prevClose|, |low-prevClose|)
- Averages all True Range values to get ATR
- Row Size = (ATR / 10) converted to tick size
- This ensures each TPO row represents a meaningful price movement
3. TPO Profile Generation
For each period, the code:
- Creates price levels from lowest to highest price in the range
- Each level is separated by the calculated row size
- Counts how many bars touch each price level (TPO count)
- Finds the level with highest count = Point of Control (POC)
- Calculates Value Area by expanding from POC until 68.27% of total TPO blocks are included
4. Overlap Detection Algorithm
When a new profile is created, the code checks if it overlaps with existing composites:
- Calculates overlap range = min(currentVAH, prevVAH) - max(currentVAL, prevVAL)
- Calculates current profile range = currentVAH - currentVAL
- Overlap percentage = (overlap range / current profile range) * 100
- If overlap >= 50%, profiles are merged into a composite
5. Composite Merging Logic
When profiles overlap, the code creates a new composite by:
- Taking the earliest start bar and latest end bar
- Using the wider VAH/VAL range (max of both profiles)
- Keeping the POC from the profile with more TPO blocks
- Marking the composite as "active" until price breaks through
6. Real-Time Updates
The code uses barstate.islast to optimize performance:
- Only recalculates on the last bar of each period
- Updates active composite with live price action if enabled
- Cleans up old composites to prevent memory issues
- Redraws all visual elements from scratch each bar
7. Visual Rendering System
The code uses arrays to manage drawing objects:
- Clears all lines/boxes arrays on every bar
- Iterates through composites array to redraw everything
- Uses different colors for active, broken, and dead composites
- Calculates 1.618 Fibonacci extensions for broken composites
Getting Started with CTPO
Step 1: Choose Your Timeframe
Select the period type that matches your trading style:
- Use "Sessions" for day trading
- Use "Daily" for swing trading
- Use "Weekly" for position trading
- Use "Auto" to let the indicator choose based on your chart timeframe
Step 2: Customize the Display
Adjust colors, transparency, and display options to match your charting preferences. The indicator offers extensive customization options to ensure it fits seamlessly into your existing analysis.
Step 3: Identify Key Levels
Look for:
- Composite zones (blue boxes) - major areas of balance
- VAH/VAL lines - value area boundaries
- POC lines - areas of highest trading activity
- 1.618 extension lines - breakout targets
Step 4: Develop Your Strategy
Use these levels to:
- Set entry points near composite zones
- Place stop losses beyond composite levels
- Take profits at 1.618 extension levels
- Identify trend changes when major composites break
Perfect for Market Profile Traders
If you're already using market profile concepts in your trading, CTPO eliminates the manual work of compositing profiles across different timeframes. Instead of spending time analyzing each individual period, you get instant access to the composite levels that matter most.
The indicator's automated compositing process ensures you're always looking at the most relevant areas of balance, while its real-time updates keep you informed of changes as they happen. Whether you're a day trader looking for intraday levels or a position trader analyzing long-term structure, CTPO provides the market profile intelligence you need to succeed.
Streamline Your Market Profile Analysis
Stop wasting time on manual compositing. Let CTPO do the heavy lifting while you focus on executing profitable trades based on areas of balance that actually matter.
Ready to Streamline Your Market Profile Trading?
Add the Composite Time Profile Overlay to your charts today and experience the difference that automated profile compositing can make in your trading performance.

RSI Crossover AlertRSI Crossover Alert Indicator - User Guide
The RSI Crossover Alert Indicator is a comprehensive technical analysis tool that detects multiple types of RSI crossovers and generates real-time alerts. It combines traditional RSI analysis with signal lines, divergence detection, and multi-level crossing alerts.
1. Multiple Crossover Detection
- RSI/Signal Line Cross: Signals a primary trend change.
- RSI/Second Signal Cross: Confirmation signals for stronger trends.
- Level Crossings: Crosses of Overbought 70, Oversold 30, and Midline 50.
- Divergence Detection: Hidden and regular divergences for reversal signals.
2. Alert Types
- Alert: RSI > Signal
Description: Bullish momentum is building.
Signal: Consider long positions.
- Alert: RSI < Signal
Description: Bearish momentum is building.
Signal: Consider short positions.
- Alert: RSI > 70
Description: Entering the overbought zone.
Signal: Prepare for a potential reversal.
- Alert: RSI < 30
Description: Entering the oversold zone.
Signal: Watch for a bounce opportunity.
- Alert: RSI crosses 50
Description: A shift in momentum.
Signal: Trend confirmation.
3. Visual Components
- Lines: RSI blue, Signal orange, Second Signal purple
- Histogram: Visualizes momentum by showing the difference between RSI and the Signal line.
- Background Zones: Red overbought, Green oversold
- Markers: Up/down triangles to indicate crossovers.
- Info Table: Real-time RSI values and status.
Strategy 1: Classic Crossover
- Entry Long: RSI crosses above the Signal Line AND RSI is below 50.
- Entry Short: RSI crosses below the Signal Line AND RSI is above 50.
- Take Profit: On the opposite signal.
- Stop Loss: At the recent swing high/low.
Strategy 2: Extreme Zone Reversal
- Entry Long: RSI is below 30 and crosses above the Signal Line.
- Entry Short: RSI is above 70 and crosses below the Signal Line.
- Risk Management: Higher win rate but fewer signals. Use a minimum 2:1 risk-reward ratio.
Strategy 3: Divergence Trading
- Setup: Enable divergence alerts and look for price/RSI divergence. Wait for an RSI crossover for confirmation.
- Entry: Enter on the crossover after the divergence appears. Place the stop loss beyond the starting point of the divergence.
Strategy 4: Multi-Timeframe Confirmation
1. Check the higher timeframe e.g. Daily to identify the main trend.
2. Use the current timeframe e.g. 4H/1H for your entry.
3. Only enter in the direction of the main trend.
4. Use the RSI crossover as the entry trigger.
Optimal Settings by Market
- Forex Major Pairs
RSI Length: 14, Signal Length: 9, Overbought/Oversold: 70/30
- Crypto High Volatility
RSI Length: 10-12, Signal Length: 6-8, Overbought/Oversold: 75/25
- Stocks Trending
RSI Length: 14-21, Signal Length: 9-12, Overbought/Oversold: 70/30
- Commodities
RSI Length: 14, Signal Length: 9, Overbought/Oversold: 80/20
Risk Management Rules
1. Position Sizing: Never risk more than 1-2% on a single trade. Reduce size in ranging markets.
2. Stop Loss Placement: Place stops beyond the recent swing high/low for crossovers. Using an ATR-based stop is also effective.
3. Profit Taking: Take partial profits at a 1:1 risk-reward ratio. Switch to a trailing stop after reaching 2:1.
1. Filtering Signals
- Combine with volume indicators.
- Confirm the trend on a higher timeframe.
- Wait for candlestick pattern confirmation.
2. Avoid Common Mistakes
- Don't trade every single crossover.
- Avoid taking signals against a strong trend.
- Do not ignore risk management.
3. Market Conditions
- Trending Market: Focus on midline 50 crosses.
- Ranging Market: Look for reversals from overbought/oversold levels.
- Volatile Market: Widen the overbought/oversold levels.
- If you get too many false signals:
Increase the signal line period, add other confirmation indicators, or use a higher timeframe.
- If you are missing major moves:
Decrease the RSI length, shorten the signal line period, or check your alert settings.
Recommended Combinations
1. RSI + MACD: For dual momentum confirmation.
2. RSI + Bollinger Bands: For volatility-adjusted signals.
3. RSI + Volume: To confirm the strength of a signal.
4. RSI + Moving Averages: To use as a trend filter.
This indicator provides a comprehensive RSI analysis. Success depends on proper configuration, risk management, and combining signals with the overall market context. Start with the default settings, then optimize based on your trading style and market conditions.

Position Size CalculatorPosition Size Calculator
This open-source Pine Script® indicator helps traders manage risk by calculating position size, margin, and risk/reward based on account size, leverage, entry, stop-loss, and take-profit. It features a customizable table and optional chart lines/labels for clear trade planning across stocks, forex, crypto, and futures.
What It Does
- Position Size: Computes units to trade based on risk percentage and stop-loss distance, capped by leverage.
- Margin: Calculates initial margin in base currency and USD, with account size percentage.
- Risk/Reward: Shows risk-reward ratio, percentage price movements, and USD gains/losses.
- Visualization: Displays results in a table and optional chart lines/labels with customizable styles.
How It Works
- Precision: Adjusts price formatting using syminfo.mintick for accuracy across assets.
- Calculations: Position size = accountSize * (riskPercent / 100) / |entry - stoploss|, capped by accountSize * leverage / entry. Margin = positionSize / leverage. Risk-reward = |takeprofit - entry| / |stoploss - entry|.
- Display: Table shows metrics; optional lines/labels plot entry, stop-loss, and take-profit with percentage and USD details.
How to Use
- Set Inputs:
1- Account Size (USD): Your capital (e.g., 1000).
2- % Risk per Trade: Risk tolerance (e.g., 1%).
3- Leverage: Broker leverage (e.g., 1x, 10x).
4- Entry, Stop Loss, Take Profit: Trade prices.
5- Show Lines and Labels: Enable chart overlays.
- Customize: Adjust table position, colors, and line styles (Solid, Dashed, Dotted).
- View Results: Table shows position size, margin, and risk/reward. Chart lines/labels (if enabled) display prices, percentages, and USD outcomes.
- Apply: Use metrics for trade execution; modify code for custom features.
Notes
- Ensure valid inputs (entry ≠ stop-loss, both positive) to avoid “N/A”.
- Open-source: Inspect or extend the code for your needs.
- Contact the author via TradingView for feedback.

ML Compressor Enhanced Trading Indicator# 🤖 ML Enhanced Trading Indicator - Advanced Market Analysis
## 📊 Overview
This is a comprehensive Machine Learning Enhanced Trading Indicator that combines multiple advanced analytical techniques to provide high-probability trading signals. The indicator uses artificial intelligence, pattern recognition, anomaly detection, and traditional technical analysis to identify optimal entry and exit points in the market.
## 🚀 Key Features
### 🧠 **Machine Learning Core**
- **Advanced Pattern Recognition**: Uses cosine similarity, Pearson correlation, and Spearman rank correlation to identify historical patterns
- **AI-Powered Predictions**: Implements multiple correlation methods to forecast price movements
- **Anomaly Detection**: Z-score based detection system for unusual market activities
- **Signal Confidence Scoring**: Reliability assessment for each trading signal
### 📈 **Technical Analysis Integration**
- **Multi-Timeframe RSI Analysis**: 14 and 21-period RSI with oversold/overbought detection
- **MACD Momentum**: Enhanced MACD histogram analysis for trend confirmation
- **Bollinger Bands Position**: Dynamic position tracking within BB channels
- **Volume Analysis**: Spike and dry volume detection with ratio calculations
- **Trend Strength Measurement**: EMA-based trend power analysis
### 🎯 **Perfect Zone Detection**
- **Ideal Buy Zone**: Identifies perfect buying opportunities when 7 conditions align:
- ML Score ≥ 0.60
- Bottom proximity detection
- RSI in 20-35 range
- Volume spike confirmation
- Positive price anomaly
- Bullish pattern match
- Positive MACD momentum
### 📊 **Comprehensive Display Table**
- **Real-time ML Analysis**: Complete breakdown of all indicators
- **Perfect Buy Conditions Tracker**: Visual checklist with completion percentage
- **Performance Metrics**: Win rate tracking and P&L analysis
- **Signal Strength Indicators**: Confidence levels for each signal
## 🔧 **Customizable Parameters**
### **ML Settings**
- **ML Lookback Period**: 20-500 bars (default: 100)
- **Anomaly Threshold**: 1.0-5.0 sensitivity (default: 2.0)
- **Pattern Similarity**: 0.5-0.99 matching threshold (default: 0.80)
- **AI Lookback Period**: 20-200 bars (default: 50)
### **AI Prediction Models**
- **Correlation Methods**: Spearman, Pearson, Cosine Similarity
- **Forecast Length**: 15-250 bars (default: 50)
- **Similarity Type**: Price or %Change analysis
### **Visual Options**
- **Table Position**: Top/Bottom Left/Right positioning
- **Table Size**: Small, Normal, Large options
- **Signal Display**: Toggle buy/sell signals on/off
- **AI Visualization**: Optional prediction paths and ZigZag
## 📋 **How to Use**
### **For Beginners**
1. Add the indicator to your chart
2. Look for "PERFECT BUY" signals in the table
3. Wait for completion percentage ≥ 85% for highest probability trades
4. Use the background color changes as visual confirmation
### **For Advanced Traders**
1. Analyze individual ML components in the detailed table
2. Monitor anomaly detection for unusual market conditions
3. Use pattern confidence levels for trade timing
4. Combine with your existing strategy for confirmation
### **Signal Interpretation**
- **🟢 PERFECT BUY**: All 7 conditions met - highest probability reversal
- **🟡 NEAR BOTTOM**: Close to ideal conditions - monitor closely
- **🔴 NOT READY**: Wait for better setup
- **Strong Buy/Sell Signals**: ML score-based entries with high confidence
## ⚠️ **Important Notes**
### **Risk Management**
- This indicator provides analysis and signals, not guaranteed outcomes
- Always use proper risk management and position sizing
- Consider market conditions and fundamental factors
- Backtest the strategy on your preferred timeframes and assets
### **Best Practices**
- Use multiple timeframe analysis for confirmation
- Combine with support/resistance levels
- Monitor volume confirmation for all signals
- Set appropriate stop-losses and profit targets
### **Performance Tracking**
- The indicator tracks its own performance with win rate calculations
- Monitor the "AI Prediction" accuracy percentage
- Use the P&L tracking to assess signal quality over time
## 🔄 **Updates and Improvements**
This indicator is continuously evolving with:
- Enhanced machine learning algorithms
- Improved pattern recognition capabilities
- Additional correlation methods for better accuracy
- Performance optimization for faster calculations
- New visualization features based on user feedback
## 📚 **Technical Details**
### **Machine Learning Implementation**
- **Pattern Matching**: 20-bar normalized price patterns with historical comparison
- **Correlation Analysis**: Mathematical similarity scoring between current and historical patterns
- **Anomaly Detection**: Statistical Z-score analysis across price, volume, and RSI
- **Signal Weighting**: Multi-factor scoring system with optimized weights
### **Algorithm Components**
1. **Feature Extraction**: Price, volume, momentum, volatility, and trend features
2. **Pattern Recognition**: Historical pattern database with similarity matching
3. **Anomaly Detection**: Multi-dimensional Z-score threshold analysis
4. **Signal Generation**: Weighted scoring system with confidence intervals
5. **Performance Tracking**: Real-time win rate and accuracy monitoring
### **Calculation Methods**
- **Trend Strength**: (EMA8 - EMA21) / EMA21 * 100
- **Volume Ratio**: Current Volume / 20-period SMA Volume
- **BB Position**: (Close - BB_Lower) / (BB_Upper - BB_Lower)
- **Anomaly Score**: Average of normalized Z-scores for price, volume, and RSI
## 🎨 **Visual Elements**
### **Background Colors**
- **Light Green**: Perfect buy zone detected
- **Light Red**: Perfect sell zone detected
- **Light Blue**: Near bottom proximity
- **Green/Red Transparency**: Price anomaly detection
### **Signal Shapes**
- **Green Triangle Up**: Strong buy signal
- **Red Triangle Down**: Strong sell signal
- **Aqua Diamond**: Perfect buy zone entry
- **Purple Diamond**: Perfect sell zone entry
### **Table Information**
- **ML Complete Analysis**: 16 comprehensive metrics
- **Perfect Buy Conditions**: 7-point checklist with status indicators
- **Real-time Values**: Live updating of all calculations
- **Color-coded Status**: Green (good), Yellow (moderate), Red (caution)
## 🔍 **Troubleshooting**
### **Common Issues**
- **Table Not Showing**: Enable "Show ML Table" in settings
- **No Signals Appearing**: Check "Show Buy/Sell Signals" option
- **Performance Issues**: Reduce ML Lookback Period for faster calculation
- **Too Many/Few Signals**: Adjust Anomaly Threshold sensitivity
### **Optimization Tips**
- **For Day Trading**: Use lower timeframes (1m, 5m, 15m) with reduced lookback periods
- **For Swing Trading**: Use higher timeframes (1h, 4h, 1D) with standard settings
- **For Scalping**: Enable only strong signals and reduce pattern similarity threshold
- **For Long-term**: Increase all lookback periods and use daily/weekly timeframes
## 📖 **Disclaimer**
This indicator is for educational and informational purposes only. It should not be considered as financial advice. Trading involves substantial risk of loss and is not suitable for all investors. Past performance does not guarantee future results.
### **Risk Warning**
- All trading involves risk of substantial losses
- Never risk more than you can afford to lose
- This indicator does not guarantee profitable trades
- Always use proper risk management techniques
- Consider consulting with a financial advisor
### **Liability**
The creator of this indicator is not responsible for any losses incurred from its use. Users should thoroughly test and understand the indicator before using it with real money.
### **Feature Requests**
- Suggest improvements through TradingView comments
- Report bugs with detailed descriptions
- Share successful strategies using the indicator
- Contribute to community discussions
## 🏆 **Credits and Acknowledgments**
This indicator builds upon various open-source libraries and mathematical concepts:
- TradingView ZigZag library for visualization
- Statistical correlation methods from academic research
- Machine learning concepts adapted for financial markets
- Community feedback and testing contributions
## 📈 **Performance Metrics**
The indicator includes built-in performance tracking:
- **Win Rate Calculation**: Percentage of profitable signals
- **Signal Accuracy**: ML prediction vs actual price movement
- **Drawdown Tracking**: Current unrealized P&L from last signal
- **Completion Percentage**: How many perfect conditions are met
## 🔬 **Mathematical Foundation**
### **Correlation Calculations**
- **Pearson**: Measures linear correlation between patterns
- **Spearman**: Rank-based correlation for non-linear relationships
- **Cosine Similarity**: Vector-based similarity for pattern matching
### **Statistical Methods**
- **Z-Score**: (Value - Mean) / Standard Deviation
- **Pattern Normalization**: Price / Price
- **Volatility Percentile**: Historical ranking of current volatility
- **Momentum Calculation**: Price change over multiple periods
## 🎯 **Trading Strategies**
### **Conservative Approach**
- Wait for Perfect Buy Zone (85%+ completion)
- Use higher timeframes for confirmation
- Set stop-loss at recent swing low
- Take profits at resistance levels
### **Aggressive Approach**
- Trade on Strong Buy/Sell signals
- Use lower completion thresholds (70%+)
- Tighter stop-losses with faster exits
- Higher position sizes with confirmed trends
### **Hybrid Strategy**
- Combine with other indicators for confirmation
- Use different settings for different market conditions
- Scale in/out based on signal strength
- Adjust parameters based on market volatility

Fundur - Trend LinesFundur - Trend Lines: Complete Trading Indicator Guide
Indicator Overview
The Fundur - Trend Lines is an advanced multi-layered trend analysis system that combines adaptive trend line technology, momentum analysis, and intelligent signal generation into one comprehensive trading tool. This indicator goes beyond traditional moving averages by utilizing volatility-adjusted trend lines that dynamically adapt to market conditions, providing traders with precise trend strength measurements and actionable trading signals.
What Makes Trend Lines Unique?
The Trend Lines indicator introduces Adaptive Trend Line Technology - a sophisticated methodology that uses Average True Range (ATR) calculations to create trend lines that respond intelligently to market volatility. Unlike static indicators, Trend Lines provides dynamic analysis that adapts its sensitivity based on current market conditions, offering more accurate trend identification and strength assessment.
Core Methodology
The indicator operates on the principle that trend strength can be quantified by analyzing the relationship between multiple adaptive trend lines, momentum indicators, and market structure. By combining Alignment Analysis , Distance Measurements , Momentum Confirmation , and Volatility Expansion Potential , the system generates a comprehensive trend strength score from 0-100% with corresponding trading signals.
Key Features
🎯 Adaptive Trend Line System Slow Trend Line : Primary trend direction with lower sensitivity for major trend identification Fast Trend Line : Higher sensitivity trend line for early trend change detection Volatility Adaptation : Both lines automatically adjust to market volatility using ATR calculations Cloud Visualization : Colored areas between trend lines show trend strength and direction
📊 Comprehensive Trend Strength Analysis Quantified Strength (0-100%) : Precise trend strength measurement combining multiple factors Alignment Score : Measures agreement between multiple trend line systems Distance Analysis : Evaluates price proximity to trend lines using ATR normalization Momentum Integration : Incorporates Awesome Oscillator for momentum confirmation Squeeze Factor : Identifies volatility expansion potential for breakout opportunities
🧠 Intelligent Signal Generation Position Signals : Clear ADD LONG, ADD SHORT, REDUCE, HOLD recommendations Risk Zone Classification : STRONG, MEDIUM, WEAK trend categorization Trend Direction : Bullish, Bearish, or Neutral trend identification Dynamic Updates : Real-time signal adjustments based on changing conditions
⚡ Enhanced Momentum Analysis Smoothed Momentum : Configurable momentum smoothing to reduce noise Acceleration Detection : Identifies momentum acceleration and deceleration Divergence Alerts : Detects price-momentum divergences for reversal warnings Directional Bias : Momentum confirmation for trend direction validation
🔍 Advanced Market Structure Detection Momentum Squeeze : Identifies low-volatility periods preceding major moves Volatility Expansion : Detects when markets break out of consolidation phases Trend Weakness Detection : Early warning system for deteriorating trends Structure Transition : Identifies when trends change character or direction
🎨 Professional Visual Interface Comprehensive Analysis Table : All key metrics displayed in organized format Visual Strength Bar : Graphical representation of trend strength Color-Coded Components : Intuitive color scheme for quick analysis Customizable Display : Flexible positioning and sizing options
Setup Guide
Step 1: Adding the Indicator
Open TradingView and navigate to your desired chart Click the "Indicators" button or press "/" key Search for "Fundur - Trend Lines" Add the indicator to your chart
Step 2: Basic Configuration
Main Features Settings ✅ Show Trend Analysis Table : ON (Essential for comprehensive analysis) ✅ Enable Trend Strength Analysis : ON (Core functionality) ✅ Generate Trading Signals : ON (For position management guidance)
Trend Lines Display ✅ Show Slow Trend Line : ON (Primary trend identification) ✅ Show Fast Trend Line : ON (Early signal detection) Trend Cloud Transparency : 89% (Default recommended, adjust for visibility)
Table Positioning Table Position : Top Right (recommended for most setups) Table Size : Normal (adjust based on screen size)
Step 3: Advanced Analysis Configuration
Enhanced Features (Optional) ✅ Enhanced Momentum Analysis : ON (for more accurate signals) ✅ Divergence Detection : ON (for reversal warnings) ⚠️ Momentum Squeeze Analysis : OFF initially (can add visual complexity)
Sensitivity Settings Divergence Sensitivity : 5 (Default - lower = more sensitive) Momentum Smoothing : 3 (Default - higher = smoother signals)
Step 4: Alert Configuration
Essential Alerts (Recommended) Trading Signal Alerts : Enable for position changes Trend Strength Change Alerts : Enable for trend monitoring Strength Change Threshold : 15% (Default recommended)
Advanced Alerts (Optional) Divergence Alerts : Enable for reversal warnings Early Weakness Alerts : Enable for risk management Momentum Squeeze Alerts : Enable for breakout opportunities Trend Line Cross Alerts : Enable for level-based signals
Basic Trading Guide
Understanding Trend Strength
The indicator's foundation is the Trend Strength Score - a quantified measurement (0-100%) that combines four key factors:
Strong Trends (75%+ Strength) 🟢 Characteristics : High alignment, close price-to-trend proximity, strong momentum Signals : ADD LONG (bullish) or ADD SHORT (bearish) Strategy : Aggressive position building, trend continuation trades Risk : Lower risk due to strong trend confirmation
Medium Trends (35-75% Strength) 🟡 Characteristics : Mixed signals, moderate alignment, transitional phases Signals : HOLD current positions Strategy : Conservative approach, wait for clearer signals Risk : Medium risk, requires careful monitoring
Weak Trends (Below 35% Strength) 🔴 Characteristics : Poor alignment, distant from trend lines, weak momentum Signals : REDUCE positions or CLOSE Strategy : Risk reduction, position unwinding Risk : High risk, trend likely changing or failing
Entry Strategies
Primary Strategy: Trend Continuation Entries Setup : Strong trend strength (75%+) with clear directional bias Entry Trigger : ADD LONG or ADD SHORT signal confirmation Direction : Follow the trend direction (Bullish ⬆ or Bearish ⬇) Timing : Enter on signal generation or price pullback to trend lines
Stop Loss Placement Conservative Method : Beyond the opposite trend line Aggressive Method : Below/above recent swing points For Long Positions : Below the Slow Trend Line For Short Positions : Above the Slow Trend Line Dynamic Adjustment : Move stops with trend line progression
Profit Taking Strategy
For Long Positions (Bullish Trend): Take 50% profits when trend strength begins declining from peak Take another 25% when trend strength drops below 60% Close remaining position when REDUCE signal appears Trail stops using Fast Trend Line for remaining position
For Short Positions (Bearish Trend): Take 50% profits when trend strength begins declining from peak Take another 25% when trend strength drops below 60% Close remaining position when REDUCE signal appears Trail stops using Fast Trend Line for remaining position
Alternative Strategy: Divergence-Based Reversal Entries Setup : Bullish or bearish divergence detected with weakening trend strength Entry : On trend direction change confirmation Risk Management : Tight stops due to counter-trend nature Targets : Opposite trend line or previous swing levels
Risk Management Framework
Position Sizing Based on Trend Strength Strong Trends (75%+) : Full position size (within risk tolerance) Medium Trends (35-75%) : Reduced position size (50-75% of normal) Weak Trends (Below 35%) : Minimal or no new positions Transitional Periods : Smallest position sizes due to uncertainty
Dynamic Risk Adjustment Increasing Strength : Can add to positions gradually Decreasing Strength : Begin profit-taking and position reduction Rapid Strength Loss : Quick position reduction or exit Divergence Warning : Tighten stops and prepare for reversal
Analysis Setups
Setup 1: Scalping Configuration (1-5 minute charts)
Settings Optimization: Momentum Smoothing: 2 (more responsive) Divergence Sensitivity: 3 (higher sensitivity) Enhanced Momentum Analysis: ON All alerts: ON for rapid signal updates
Visual Settings: Table Size: Small (less screen space) Table Position: Top Right Trend Cloud Transparency: 85% (subtle background)
Trading Approach: Focus on quick ADD signals in strong trends Use Fast Trend Line for entry timing Quick profit-taking at first sign of strength decline Very tight risk management due to lower timeframe noise
Setup 2: Day Trading Configuration (5-15 minute charts)
Settings Optimization: All default settings work well Enable Momentum Squeeze Analysis for breakout identification Divergence Detection: ON for reversal warnings Trend Strength Change Threshold: 12% (more sensitive)
Visual Settings: Table Size: Normal Show all trend analysis components Trend Cloud Transparency: 89% (default)
Trading Approach: Wait for clear trend strength above 65% before entering Use momentum squeeze breakouts for early entries Hold positions through medium strength phases Exit on REDUCE signals or strength below 40%
Setup 3: Swing Trading Configuration (1-4 hour charts)
Settings Optimization: Momentum Smoothing: 4 (smoother for higher timeframe) Divergence Sensitivity: 7 (less sensitive, higher quality signals) Enhanced Momentum Analysis: ON Early Weakness Alerts: ON (important for swing trades)
Visual Settings: Table Size: Normal or Large Focus on trend strength and direction components Enable all visual features for comprehensive analysis
Trading Approach: Require trend strength above 70% for new positions Hold through temporary strength dips if above 50% Use divergence signals for early exit warnings Focus on major trend changes for position adjustments
Setup 4: Position Trading Configuration (4H-Daily charts)
Settings Optimization: Momentum Smoothing: 5 (maximum smoothing) Divergence Sensitivity: 10 (only high-quality divergences) Strength Change Threshold: 20% (major changes only) Focus on trend direction and strength alerts
Visual Settings: Table Size: Large (detailed analysis) Clean visual setup focusing on major components Minimal clutter for long-term perspective
Trading Approach: Only enter on very strong trends (80%+ strength) Hold through significant strength fluctuations Focus on major trend direction changes Use weekly/monthly trend alignment for confirmation
Setup 5: Multi-Asset Analysis Configuration
For Forex Pairs: Standard settings work well due to 24-hour markets Pay attention to session-based strength changes Use momentum squeeze for breakout trading Enable all alert types for continuous monitoring
For Cryptocurrency: Reduce momentum smoothing (2-3) due to high volatility Increase divergence sensitivity (3-4) for early warnings Focus on strength changes above 20% threshold Use squeeze analysis for breakout opportunities
For Stock Indices: Standard settings appropriate for most indices Enable early weakness alerts for risk management Consider market hours for signal validity Use higher timeframes for better signal quality
Visual Components
Trend Analysis Table Trend Strength : Percentage with visual strength bar Trend Signal : Current position recommendation Risk Zone : STRONG/MEDIUM/WEAK classification Alignment : Trend line agreement analysis Distance : Price proximity to trend lines Momentum : Current momentum direction and strength
Trend Lines and Clouds Colored Clouds : Green for bullish trends, red for bearish trends Cloud Intensity : Opacity reflects trend strength Dynamic Colors : Automatically adjust based on trend direction
Momentum Squeeze Visualization Yellow Highlights : Above and below price during squeeze periods Squeeze Indication : Identifies low-volatility consolidation Breakout Preparation : Visual cue for potential explosive moves
Alert System
Trading Signal Alerts ADD LONG : Strong bullish trend confirmed ADD SHORT : Strong bearish trend confirmed REDUCE : Trend weakness detected, position reduction recommended HOLD : Maintain current positions, no change needed
Trend Analysis Alerts Strength Increase : Trend gaining momentum Strength Decrease : Trend losing momentum Early Weakness : Warning of potential trend deterioration Trend Direction Change : Major trend shift detected
Technical Alerts Bullish Divergence : Price falling but momentum rising Bearish Divergence : Price rising but momentum falling Momentum Squeeze Start : Volatility contraction beginning Momentum Squeeze End : Breakout from low volatility period Trend Line Cross : Price crossing above/below trend lines
Setting Up Alerts Enable desired alert types in indicator settings Create TradingView alerts using "Fundur - Trend Lines" as source Configure notification methods (email, SMS, app notifications) Test alerts with paper trading before live implementation Adjust alert frequency settings to avoid spam
Best Practices
Trend Strength Interpretation Above 75% : High confidence trades, full position sizes 50-75% : Moderate confidence, reduced positions Below 50% : Low confidence, minimal or no positions Rapid Changes : Pay attention to sudden strength shifts
Signal Management Don't Chase : Wait for clear signals rather than predicting Confirm with Price Action : Use chart patterns for additional confirmation Respect Risk Zones : Adjust position sizes based on trend classification Monitor Alignment : Strong alignment increases signal reliability
Multi-Timeframe Integration Higher Timeframe Bias : Use daily/weekly for overall trend direction Lower Timeframe Entries : Use hourly/15min for precise entry timing Confirmation Requirement : Ensure alignment between timeframes Conflict Resolution : Higher timeframe takes precedence
Common Mistakes to Avoid
Signal Misinterpretation Ignoring Trend Strength : Don't trade weak signals (below 60%) Fighting the Trend : Don't go against strong trend directions Overreliance on Single Component : Consider all analysis factors Impatience : Wait for clear STRONG trend classification
Risk Management Errors Fixed Position Sizes : Adjust sizes based on trend strength Ignoring REDUCE Signals : Take profits when indicator suggests No Stop Losses : Always use stops beyond trend lines Overleveraging Weak Signals : Use smaller positions in MEDIUM zones
Technical Analysis Errors Ignoring Divergences : Pay attention to momentum warnings Missing Squeeze Opportunities : Watch for breakout setups Poor Timeframe Selection : Match timeframe to trading style Alert Fatigue : Don't enable too many alerts simultaneously
Advanced Techniques
Divergence Trading Early Reversal Detection : Use divergences to anticipate trend changes Confirmation Required : Wait for trend strength decline confirmation Tight Risk Management : Use smaller positions for counter-trend trades Quick Exits : Take profits rapidly on divergence trades
Momentum Squeeze Strategies Breakout Preparation : Position before squeeze resolution Direction Bias : Use trend direction for breakout direction Volume Confirmation : Combine with volume analysis when possible False Breakout Protection : Use tight stops for failed breakouts
Multi-Component Analysis Alignment Priority : Perfect alignment (100%) provides highest confidence Distance Consideration : Closer to trend lines = higher probability Momentum Confirmation : Rising momentum supports trend direction Squeeze Integration : High squeeze factor increases breakout potential
Dynamic Position Management Scaling In : Add to positions as trend strength increases Scaling Out : Reduce positions as trend strength decreases Stop Trailing : Move stops with Fast Trend Line progression Profit Optimization : Use strength peaks for profit-taking timing
Conclusion
The Fundur - Trend Lines indicator represents a sophisticated approach to trend analysis, combining adaptive trend line technology with comprehensive strength measurement and intelligent signal generation. By quantifying trend strength through multiple analytical components, this indicator provides traders with objective, data-driven insights for making informed trading decisions.
The indicator's strength lies in its ability to adapt to changing market conditions while providing clear, actionable signals. The comprehensive trend strength analysis removes guesswork from trend trading, allowing traders to size positions appropriately and manage risk effectively based on quantified market conditions.
Success with the Trend Lines indicator comes from understanding that trend strength is dynamic and requires continuous monitoring. The 0-100% strength scale provides an objective framework for position management, while the multi-component analysis ensures robust signal generation across different market conditions.
Remember that this indicator works best when combined with proper risk management, position sizing, and market context awareness. Start with conservative settings and smaller position sizes while learning the indicator's behavior in different market environments. The comprehensive alert system helps maintain awareness of changing conditions, but successful trading still requires discipline and adherence to your trading plan.
For optimal results, practice with the indicator across different timeframes and market conditions, always prioritizing risk management over profit potential, and maintaining realistic expectations about market behavior and indicator performance.

Option CalculatorOption Calculator – Comprehensive Feature Guide
The aiTrendview Option Calculator is a feature-rich options trading dashboard built using Pine Script, designed for real-time market interpretation and strategy selection. It integrates Black-Scholes-based pricing models with dynamic market inputs to help traders evaluate directional bias, volatility, risk, and potential profitability in a structured, intuitive format. The tool supports both beginner and experienced options traders in making data-driven decisions.
Core Inputs and Pricing Foundations
Users can input the strike price, days to expiration, implied volatility (IV), interest rate, and option type (call or put). These values feed directly into calculations for the option's theoretical price, Greeks, and expected move. For example:
• Strike Price helps define moneyness, impacting delta and risk/reward balance.
• Days to Expiry determines the speed of time decay (theta).
• Risk-Free Rate adjusts for time value and interest rate impact (rho).
• Implied Volatility affects premium pricing and vega exposure.
• Option Type sets the directional foundation for strategy analysis.
Live Market Data Integration
The script pulls current underlying price, price change, and volume comparison against a moving average (e.g., current volume vs. 20-day average). This helps identify unusual trading activity or volume spikes. Volatility readings are also incorporated using ATR or external volatility indexes to enhance the realism of IV assessments.
Greek Calculations
The dashboard provides visual and numerical values for all five major Greeks:
• Delta shows directional sensitivity and is plotted with a visual bar.
• Gamma represents the rate of delta change, especially critical near-the-money.
• Theta measures time decay and is most impactful in the final weeks before expiration.
• Vega tracks sensitivity to volatility shifts, crucial for premium-selling strategies.
• Rho reflects sensitivity to interest rates, primarily relevant in long-dated options.
Each Greek is calculated based on real-time inputs, providing a statistical framework for assessing risk and return.
Market Sentiment & Risk Environment
A sentiment scoring system interprets the put-call ratio (PCR), volume trends, and price momentum (e.g., RSI). IV levels are color-coded (e.g., low, medium, high) to identify whether options are relatively cheap or expensive. These values support better timing decisions and help identify whether to be a buyer or seller of premium.
Strategy Recommendation Engine
The script dynamically evaluates six core strategies based on current data:
1. Long Call
2. Short Put
3. Long Put
4. Bull Call Spread
5. Long Straddle
6. Iron Butterfly
Each strategy is assigned a confidence score (0–100%) and updated in real-time. This system is designed to match the appropriate strategy to market conditions such as trend, volatility, and time to expiration.
Risk-Adjusted Trading Insights
The dashboard helps traders evaluate whether to initiate trades, reduce exposure, or wait:
• High Confidence (80%+): Favorable environment; standard sizing recommended.
• Moderate Confidence (60–80%): Trade with caution and reduced risk.
• Low Confidence (<60%): Consider avoiding the trade or waiting for better setup.
It also supports risk mitigation through defined-risk strategies and provides guidance on stop-loss, profit targets, and time-based exits (e.g., managing options with <21 days to expiry).
Real-Time Monitoring
The script continuously tracks:
• Changes in Greeks as price, volatility, or time evolve.
• Profit probability estimates using expected move and breakeven pricing.
• Volume activity and IV rank to spot institutional behavior.
This empowers traders to manage trades proactively, adjust exposure, or lock in profits based on changing market conditions.
Practical Use Case Flow
Step 1: Input Setup
Enter option-specific parameters (strike, expiry days, IV, etc.) and let the dashboard auto-calculate risk metrics.
Step 2: Analyze Market
Use sentiment analysis, IV level, and volume data to understand the environment.
Step 3: Select Strategy
Rely on the confidence score and recommendation engine to choose a suitable options strategy.
Step 4: Manage Risk
Apply size rules based on signal strength, adjust based on exposure, and set alerts if needed.
Step 5: Monitor Outcomes
Track Greeks, probability, and progress metrics to stay informed throughout the trade.
Trading Environment Adaptation
• Low IV: Favor long premium strategies (e.g., long straddles, long calls).
• High IV: Favor premium selling strategies (e.g., iron condors, credit spreads).
• Bullish Markets: Focus on call-based trades or bullish spreads.
• Sideways Markets: Use neutral setups like iron butterflies or calendar spreads.
Position sizing and stop-loss logic are aligned with industry practices (e.g., risk no more than 2% per trade, take profit at 50%, and cut losses at double the premium received).
Dashboard Interpretation Guide
• Green: High confidence strategy, favourable IV, and strong volume confirmation.
• Yellow: Mixed signals or moderate conviction – proceed with caution.
• Red: Low confidence, poor conditions – better to wait for clearer opportunities.
Disclaimer from aiTrendview
This script is intended for educational and informational use only. It does not offer financial advice or trading signals, nor does it guarantee results. aiTrendview and its affiliates are not responsible for any financial loss or decision made using this tool. Options trading involves substantial risk and is not suitable for all investors. Past performance of any strategy or metric does not guarantee future results. Users are encouraged to consult with a certified financial advisor and conduct independent research before making trading decisions.

Breakout Range Signal with Quality Analysis [Dova Lazarus]📌 Breakout Range Signal with Quality Analysis
🎓 Training-focused indicator for breakout logic, SL & TP behavior and signal quality assessment
🔷 PURPOSE
This tool identifies breakout candles from a calculated channel range and visually simulates entries, stop losses, and take profits, providing live and historical performance metrics.
⚙️ MAIN SETTINGS
1️⃣ Channel Setup
channel_length = 10 → how many candles are averaged to form channel boundaries
channel_multiplier = 0.0 → adds expansion above/below the base channel
channel_smoothing_type = SMA → smoothing method for high/low averaging
📊 The channel consists of two moving averages: one from highs, the other from lows. When expanded (via multiplier), it creates a buffer range for breakout validation.
2️⃣ Signal Detection
Body > Channel % = 50 → a breakout candle's body must exceed 150% of the channel width
Signal Mode:
• Weak → every valid breakout candle is highlighted
• Strong → only the first signal in a sequence is shown (helps reduce noise)
🟦 Bullish signals (blue):
• Candle opens inside the channel
• Closes above the channel
• Body is large enough
• Optional: confirms with trend (if enabled)
🟨 Bearish signals (yellow):
• Candle opens inside the channel
• Closes below the channel
• Body is large enough
• Optional: confirms with trend
3️⃣ Trend Filter (optional)
Enabled via checkbox
Uses a higher timeframe MA to filter signals
Bullish signals are allowed only if price is below the trend MA
Bearish signals only if price is above it
⏱️ trend_timeframe = 1D (typically set higher than the chart's timeframe)
🟢 Trend line is plotted if enabled
🎯 ENTRY, STOP LOSS & TAKE PROFIT LOGIC
SL and TP are based on channel width, not fixed pip/tick size:
📍 Entry Price = close of the breakout candle
🛑 Stop Loss:
• Bullish → below the lower channel border (minus offset)
• Bearish → above the upper channel border (plus offset)
🎯 Take Profit:
• Bullish → entry + channel width × profit multiplier
• Bearish → entry − channel width × profit multiplier
You can control:
Profit Target Multiplier (e.g., 1.0 → TP = 1×channel width)
Stop Loss Target Multiplier (e.g., 0.5 → SL = 0.5×channel width)
Signals to Show = how many historical SL/TP setups to display
📈 Lines and labels ("TP", "SL") are drawn on the chart for clarity.
🧪 QUALITY ANALYSIS MODULE
If enabled, the indicator will:
Track each new signal (entry, SL, TP)
Analyze outcomes:
• Win = TP hit before SL
• Loss = SL hit before TP
• Expired = signal unresolved after N bars
Display statistics in a table (top-right corner):
📋 Table fields:
✅ Overall win rate
📈 Bullish win rate
📉 Bearish win rate
🔢 Total signals
🕓 Pending (still active trades)
Maximum bars to wait for outcome is customizable (max_bars_to_analyze).
📐 VISUALIZATION TOOLS
TP / SL lines per signal
Labels “TP” and “SL”
Optional channel lines and trendline for better context
Colored bars for valid signals (blue/yellow)
📌 BEST USE CASES
Understand how breakout signals are formed
Learn SL/TP logic based on dynamic range
Test how volatility affects trade outcomes
Use as a visual simulation of trade behavior over time

Risk Guardian Pro📊 Risk Guardian Pro - Complete Script Summary
🎯 Overview
Risk Guardian Pro is a comprehensive Pine Script indicator for advanced trading risk management. It provides real-time position sizing, risk calculation, fee tracking, and profit/loss analysis with intelligent profit stop detection.
⚙️ Settings Sections
1. Account Settings
2. Risk Management
3. Stop Loss Settings
4. Trading Fees Settings
5. Display Settings
6. Table Row Toggles
7. Position Settings
🧮 Core Calculations
Risk Analysis
Position Risk
Risk Percentage
Risk:Reward Ratio
Fee Calculations
Trading Fee: Position Size × Leverage × Trading Fee %
Funding Rate: Full Margin × Funding Rate % × 8-Hour Periods
Total Fees: Trading Fee + Accumulated Funding Fees
P&L Calculations
Gross P&L: Position Size × Leverage × Price Movement / Entry Price
Net P&L: Gross P&L - Total Fees
Adjusted Risk/Reward: All targets include fee impact
🎨 Visual Display System
Risk Management Table
Header: "RISK GUARDIAN PRO" with version info
Status Bar: Position direction + Risk heat level with color coding
Main Metrics (11 configurable rows):
Account Balance: Total trading capital
Position Size: Trade allocation with size warnings
Risk %: Percentage at risk with progress bars
Risk:Reward: Current ratio with quality indicators
Stop Loss: Exit price with profit stop intelligence
Take Profit: Target price for profits
Trading Fee: One-time entry cost
Funding Rate: 8-hour accumulation with auto-timer
Total Fees: Complete cost breakdown
Potential Loss: Maximum risk including fees
Potential Win: Profit target minus fees
Chart Elements
Entry Line: Blue horizontal line at entry price
Stop Loss Line: Red line (turns green for profit stops)
Take Profit Line: Green horizontal line
Live P&L Plot: Real-time profit/loss line
Price Labels
Entry Label: "ENTRY" - Blue box
Stop Label: "STOP or "PROFIT STOP"
"PROFITSTOP" - Red/Green
Target Label: "TARGET" - Green box
Live P&L Label: "NET P&L" - Dynamic colour
🧠 Intelligent Features
Profit Stop Detection
Automatically detects when stop loss moves into profit territory:
Long Position: Stop above entry price
Short Position: Stop below entry price
Smart Transformations:
Status → "PROFIT SECURED" 🔒
Stop Loss → "Profit Stop" (green)
Risk % → "Secured Profit %"
Risk:Reward → "Secured:Additional"
Chart elements turn green
Risk Heat Levels
LOW: <2% risk (Green indicators)
MODERATE: 2-3% risk (Yellow indicators)
HIGH: >3% risk (Red indicators)
PROFIT SECURED: Stop in profit (Dark green)
Dynamic Color Coding
Table borders change based on risk level
Position size warnings for oversized trades
Progress bars show risk proximity to limits
All elements adapt to profit stop status
⏰ Time & Fee Management
Automatic Fee Accumulation
Set trade entry time using calendar picker
Funding fees automatically increase every 8 hours
Real-time progression as chart time advances
Visual feedback shows elapsed time and periods
Fee Impact Integration
All P&L calculations include fee deductions
Risk calculations add fee costs to potential loss
Take profit targets account for fee impact
Breakeven point automatically adjusts for fees
🚨 Alert System
Risk Alerts
High Risk: When risk exceeds 3% of capital
High Fees: When fees exceed 10% of position risk
Long Hold: Position held over 10 days
Extended Trade: Trade duration review reminder
Profit Alerts
Profit Secured: Stop loss moved to profit territory
🎛️ Customization Options
Visual Customization
2 Currency options with proper symbols
9 Table positions around chart
4 Size options for table and labels
200-bar range for label positioning
Progress bar toggles for risk visualization
Data Display Control
11 Individual row toggles for table content
Percentage displays in chart labels
Emoji options for visual enhancement
Tooltip information on hover
💡 Key Benefits
Professional Risk Management
✅ Comprehensive fee tracking with real-time accumulation
✅ Intelligent profit stop detection with visual adaptation
✅ Multi-method stop loss (ATR, percentage, manual)
✅ Advanced R:R calculations with fee impact
User Experience
✅ Date/time picker for precise entry timing
✅ Real-time updates as market moves
✅ Visual risk indicators with progress bars
✅ Extensive customization for personal preferences
Trading Integration
✅ Works with any timeframe and instrument
✅ Suitable for long-term use on charts
✅ Accurate fee modeling for realistic P&L
✅ Professional alert system for risk management
🎯 Perfect For
Active traders needing precise risk management
Position traders with long-term holds
Leveraged trading with fee-conscious strategies
Professional risk assessment and portfolio management
Risk Guardian Pro V2.5 represents a complete, professional-grade risk management solution that adapts intelligently to your trading style while providing comprehensive oversight of costs, risks, and profit potential.

All SMAs Bullish/Bearish Screener (Enhanced)All SMAs Bullish/Bearish Screener Enhanced: Uncover High-Conviction Trend Alignments with Confidence
Description:
Are you ready to elevate your trading from mere guesswork to precise, data-driven decisions? The "All SMAs Bullish/Bearish Screener Enhanced" is not just another indicator; it's a sophisticated, yet user-friendly, trend-following powerhouse designed to cut through market noise and pinpoint high-probability trading opportunities. Built on the foundational strength of comprehensive Moving Average confluence and fortified with critical confirmation signals from Momentum, Volume, and Relative Strength, this script empowers you to identify truly robust trends and manage your trades with unparalleled clarity.
The Power of Multi-Factor Confluence: Beyond Simple Averages
In the unpredictable world of financial markets, true strength or weakness is rarely an isolated event. It's the harmonious alignment of multiple technical factors that signals a high-conviction move. While our original "All SMAs Bullish/Bearish Screener" intelligently identified stocks where price was consistently above or below a full spectrum of Simple Moving Averages (5, 10, 20, 50, 100, 200), this Enhanced version takes it a crucial step further.
We've integrated a powerful three-pronged confirmation system to filter out weaker signals and highlight only the most compelling setups:
Momentum (Rate of Change - ROC): A strong trend isn't just about price direction; it's about the speed and intensity of that movement. Positive momentum confirms that buyers are still aggressively pushing price higher (for bullish signals), while negative momentum validates selling pressure (for bearish signals).
Volume: No trend is truly trustworthy without the backing of smart money. Above-average volume accompanying an "All SMAs" alignment signifies strong institutional participation and conviction behind the move. It separates genuine trend starts from speculative whims.
Relative Strength Index (RSI): This versatile oscillator ensures the trend isn't just "there," but that it's developing healthily. We use RSI to confirm a bullish bias (above 50) or a bearish bias (below 50), adding another layer of confidence to the direction.
When the price aligns above ALL six critical SMAs, and is simultaneously confirmed by robust positive momentum, healthy volume, and a bullish RSI bias, you have an exceptionally strong "STRONGLY BULLISH" signal. This confluence often precedes sustained upward moves, signaling prime accumulation phases. Conversely, a "STRONGLY BEARISH" signal, where price is below ALL SMAs with negative momentum, confirming volume, and a bearish RSI bias, indicates powerful distribution and potential for significant downside.
How to Use This Enhanced Screener:
Add to Chart: Go to TradingView's Pine Editor, paste the script, and click "Add to Chart."
Customize Parameters: Fine-tune the lengths of your SMAs, RSI, Momentum, and Volume averages via the indicator's settings. Experiment to find what best suits your trading style and the assets you trade.
Choose Your Timeframe Wisely:
Daily (1D) and 4-Hour (240 min) are highly recommended. These timeframes cut through intraday noise and provide more reliable, actionable signals for swing and position trading.
Shorter timeframes (e.g., 15min, 60min) can be used by advanced day traders for very short-term entries, but be aware of increased volatility and noise.
Visual Confirmation:
Green/Red Triangles: Appear on your chart, indicating confirmed bullish or bearish signals.
Background Color: The chart background will subtly turn lime green for "STRONGLY BULLISH" and red for "STRONGLY BEARISH" conditions.
On-Chart Status Table: A clear table displays the current signal status ("STRONGLY BULLISH/BEARISH," or "SMAs Mixed") for immediate feedback.
Set Up Alerts (Your Primary Screener Tool): This is the game-changer! Create custom alerts on TradingView based on the "Confirmed Bullish Trade" and "Confirmed Bearish Trade" conditions. Receive instant notifications (email, pop-up, mobile) for any stock in your watchlist that meets these stringent criteria. This allows you to scan the entire market effortlessly and act decisively.
Strategic Stop-Loss Placement: The Trader's Lifeline
Even the most robust signals can fail. Protecting your capital is paramount. For this trend-following strategy, your stop-loss should be placed where the underlying trend structure is broken.
For a "STRONGLY BULLISH" Trade: Place your stop-loss just below the most recent significant swing low (higher low). This is the last point where buyers stepped in to support the price. If price breaks below this, your bullish thesis is invalidated.
For a "STRONGLY BEARISH" Trade: Place your stop-loss just above the most recent significant swing high (lower high). If price breaks above this, your bearish thesis is invalidated.
Alternatively, consider placing your stop-loss just below the 20-period SMA (for bullish trades) or above the 20-period SMA (for bearish trades). A significant close beyond this intermediate-term average often indicates a critical shift in momentum. Always ensure your chosen stop-loss adheres to your pre-defined risk per trade (e.g., 1-2% of capital).
Disciplined Profit Booking: Maximizing Gains
Just as important as knowing when you're wrong is knowing when to take profits.
Trailing Stop-Loss: As your trade moves into profit, trail your stop-loss upwards (for longs) or downwards (for shorts). You can trail it using:
Previous Swing Lows/Highs: Move your stop to just below each new higher low (for longs) or just above each new lower high (for shorts).
A Moving Average (e.g., 10-period or 20-period SMA): If price closes below your chosen trailing SMA, exit. This allows you to ride the trend while protecting accumulated profits.
Target Levels: Identify potential resistance levels (for longs) or support levels (for shorts) using pivot points, previous highs/lows, or Fibonacci extensions. Consider taking partial profits at these levels and letting the rest run with a trailing stop.
Loss of Confluence: If the "STRONGLY BULLISH/BEARISH" condition ceases to be met (e.g., RSI crosses below 50, or volume drops significantly), this can be a signal to reduce or exit your position, even if your stop-loss hasn't been hit.
The "All SMAs Bullish/Bearish Screener Enhanced" is your comprehensive partner in navigating the markets. By combining robust trend identification with critical confirmation signals and disciplined risk management, you're equipped to make smarter, more confident trading decisions. Add it to your favorites and unlock a new level of precision in your trading journey!
#PineScript #TradingView #SMA #MovingAverage #TrendFollowing #StockScreener #TechnicalAnalysis #Bullish #Bearish #QQQ #Momentum #Volume #RSI #SPY #TradingStrategy #Enhanced #Signals #Analysis #DayTrading #SwingTrading

True Market Structure [Advanced Liquidity Hunter] v1True Market Structure v1
📌 Table of Contents
1. Introduction
2. Core Concepts
3. Indicator Components
4. Configuration
5. Signal Interpretation
6. Trading Strategies
7. Risk Management
8. FAQ
________________________________________
🎯 Introduction
What is True Market Structure?
True Market Structure is an advanced technical analysis indicator that reveals hidden market mechanisms. Based on Smart Money Concepts (SMC) and ICT (Inner Circle Trader) methodology, it identifies where large financial institutions hunt retail traders' stop losses.
Who is this indicator for?
• ✅ Beginners - Intuitive visualizations and clear signals
• ✅ Intermediate - Deeper market structure analysis
• ✅ Advanced - Full parameter control and advanced strategies
Key Benefits
• 🔍 Sees the invisible - Hidden liquidity levels
• 🎯 Precise signals - Based on real data
• ⚡ Real-time - Instant analysis
• 🛡️ Capital protection - Warns against traps
💡 Pro Tip: Start with 15M timeframe! That's where most action happens - stop hunts every few candles, retail traps, liquidity battles. It's the best "microscope" to understand how the market really works.
________________________________________
📚 Core Concepts
Smart Money vs Retail Money
Smart Money:
• Banks, hedge funds, large institutions
• Create market moves, don't follow them
• Exploit retail predictability
Retail Money:
• Individual traders
• Often act emotionally
• Place stop losses at predictable levels
Liquidity
Liquidity refers to areas where many orders are waiting:
• Stop losses above highs (shorts)
• Stop losses below lows (longs)
• Orders at round numbers
Key principle: Smart Money needs liquidity to enter/exit large positions. That's why they "hunt" stop losses first, then make the real move.
________________________________________
🔧 Indicator Components
1. 💧 Liquidity Pools
What is it?
• Price levels tested multiple times
• Stop loss accumulation areas
• Displayed as blue horizontal lines
How to read?
• LIQ HIGH x15 = Level tested 15 times from above
• LIQ LOW x8 = Level tested 8 times from below
• Higher number = stronger zone
Significance:
• Price magnet
• High probability of reaction
• Smart Money target
2. 🎣 Stop Hunts
What is it?
• Candles with long wicks
• Brief penetrations of important levels
• Marked with purple labels
Types:
• STOP HUNT ⬆ - Upward hunt (shorts' stop losses)
• STOP HUNT ⬇ - Downward hunt (longs' stop losses)
Characteristics:
• Long wick (minimum 2x larger than body)
• Wick must also be larger than 0.5 ATR (default)
• Breaks recent high/low from lookback period
• Quick price return
3. 🪤 Trapped Traders
What is it?
• Areas where retail got trapped
• Failed breakouts that didn't hold
• Colored rectangles on chart
Trap types:
• 🔴 TRAPPED LONGS - Buyers caught at top
• 🟢 TRAPPED SHORTS - Sellers caught at bottom
Mechanism:
1. Important level break
2. Retail enters breakout direction
3. Price returns leaving them at loss
4. Stop losses get activated
4. 🎪 Inducement Levels
What is it?
• "Too obvious" support/resistance
• Levels respected minimum 3 times
• Orange dashed lines
Why is it a trap?
• Look like perfect trading spots
• Attract retail traders' attention
• Smart Money uses them to collect liquidity
Example:
• 100,000 level on BTC - round number
• 3 bounces = "strong support"
• Retail buys, Smart Money sells to them
5. ⏰ Kill Zones
What is it?
• Highest Smart Money activity periods
• Red background on chart
• Maximum manipulation time
Default Kill Zones:
• 🌆 London Open (08:00-09:00 UTC)
• 🏙️ NY Open (13:00-14:00 UTC)
• 🌃 Midnight (00:00-01:00 UTC)
Trading Sessions (chart background):
• 🌏 Asian (00:00-08:00 UTC) - Gray background
• 🇬🇧 London (08:00-16:00 UTC) - Blue background
• 🇺🇸 New York (13:00-21:00 UTC) - Orange background
Note: London and New York sessions overlap (13:00-16:00 UTC) - this is the highest liquidity period!
6. 🎯 Smart Money Signals
What is it?
• Potential institutional entry points
• Large labels with 🎯 emoji
• Appear after stop hunts
Conditions:
1. Stop hunt in one direction
2. High volume (2x average)
3. In Kill Zone
4. Direction reversal
7. 📊 Market Analysis Table
The table displays 9 rows with key information:
1. Session - Current trading session (ASIA/LONDON/NEW YORK/CLOSED)
2. Kill Zone - Zone status (🔴 ACTIVE / ✅ SAFE)
3. Liquidity Pools - Number of liquidity zones found
4. Inducement Levels - Number of bait levels
5. Traps (50 bars) - Number of traps in last 50 bars
6. Market Bias - Market direction:
o BULLISH 📈 (close > SMA50 and EMA21)
o BEARISH 📉 (close < SMA50 and EMA21)
o NEUTRAL ➡️ (other cases)
7. Volume - Volume status:
o 🔥 EXTREME (>2x average)
o ⬆️ HIGH (>1.5x average)
o NORMAL (>average)
o ⬇️ LOW (3 traps)
o ⚠️ CHOPPY (>5 traps)
o 👀 WATCH LIQUIDITY (>3 liquidity zones)
o ✓ NORMAL (other)
________________________________________
⚙️ Configuration
Step 1: Basic Configuration
Where to find settings:
• Method 1: Click the ⚙️ (gear) icon next to indicator name on chart
• Method 2: Double-click any indicator line/label
• Method 3: Right-click → "Settings" on indicator name
🌍 Timezone Setting
UTC Offset: Your timezone
Examples:
- London: 0 (winter) or +1 (summer)
- New York: -5 (winter) or -4 (summer)
- Tokyo: +9
🎚️ Sensitivity Adjustment
For beginners - Default settings:
• Lookback Period: 30
• Detection Sensitivity: 0.3
• Min. Touches: 2
For different timeframes:
• 15M: Sensitivity 0.2-0.3, Lookback 20-30
• 1H: Sensitivity 0.3-0.4, Lookback 30-40
• 4H: Sensitivity 0.4-0.5, Lookback 40-50
For different instruments:
• Forex Majors (EUR/USD): Sensitivity 0.1-0.2
• Indices (S&P500;): Sensitivity 0.2-0.4
• Crypto (BTC): Sensitivity 0.4-0.8
• Stocks: Sensitivity 0.3-0.5
Step 2: Advanced Configuration
🔧 Liquidity Zones Parameters
• Min. Touches (1-5): Less = more signals
• Lookback (20-200): More = further levels
• Max Zones (1-10): Display quantity control
🎣 Stop Hunt Parameters
• Wick/Body Ratio (1-5): Lower = more signals
• Min. Wick Size (0.1-2 ATR): Filters small wicks
🎯 Smart Money Analysis
• Require Kill Zone: Enable for fewer signals
• Volume Multiplier: Higher = only big moves
________________________________________
📖 Signal Interpretation
Note: Most examples are shown on 15M timeframe, because that's where you can best see all market manipulations in action!
Signal Importance Hierarchy
1. 🎯 Smart Money Signal - Strongest signal
2. 🪤 Trapped Traders - High reliability
3. 🎣 Stop Hunt - Medium reliability
4. 💧 Liquidity Touch - Needs confirmation
Interpretation Examples
Scenario 1: "Liquidity Grab"
You see: LIQ HIGH x20 at 100,000
+ Stop Hunt ⬆
+ Volume spike
= Likely decline
Scenario 2: "Trap and Reverse"
You see: TRAPPED LONGS
+ Kill Zone Active
+ SM SHORT 🎯
= Strong short signal
Scenario 3: "Inducement Break"
You see: Inducement Level break
+ No volume
+ Status: NORMAL
= Likely trap, wait
Colors and Their Meaning
• 🔵 Blue - Liquidity (neutral)
• 🟠 Orange - Caution, possible trap
• 🔴 Red - Negative signal / long trap
• 🟢 Green - Positive signal / short trap
• 🟣 Purple - Stop hunt (neutral, wait for reaction)
________________________________________
💡 Trading Strategies
Strategy 1: "Liquidity Sweep" (For Beginners)
Assumptions:
• Trade only with trend
• Wait for liquidity collection
• Enter on return
Best timeframe for learning: 15M - you'll see all manipulation stages in real-time!
Steps:
1. Identify trend (Market Bias in table)
2. Find nearest liquidity zone aligned with trend
3. Wait for price to touch and bounce
4. Enter after confirming candle
5. Stop loss beyond liquidity zone
6. Take profit at next zone
Example:
• Trend: BULLISH
• Liquidity at 100,000 (support)
• Price drops to 99,950 (stop hunt)
• Returns above 100,000
• LONG with SL 99,900, TP 101,000
Strategy 2: "Kill Zone Hunter" (Intermediate)
Assumptions:
• Trade only in Kill Zones
• Exploit stop hunts
• Aggressive entries
Ideal timeframe: 15M - in Kill Zones on 15M you'll see exactly every Smart Money move!
Steps:
1. Wait for Kill Zone (red background)
2. Watch first 15-30 minutes
3. Look for stop hunt
4. Enter immediately after stop hunt
5. Tight stop loss (0.5 ATR)
6. Scale position with profit
Tips:
• London Open - often stop hunt down, then rise
• NY Open - often tests Asian High/Low
• Midnight - position resets, false moves
Strategy 3: "Smart Money Follow" (Advanced)
Assumptions:
• Ignore minor signals
• Wait only for SM signals
• Larger positions, fewer trades
Steps:
1. Status must show HIGH RISK or WATCH LIQUIDITY
2. Wait for stop hunt series (minimum 2)
3. Watch Trapped Traders
4. Enter only on SM signal 🎯
5. Stop loss beyond last extreme
6. Hold position until opposite SM signal
Position Management:
• 1/3 position at signal
• 1/3 after direction confirmation
• 1/3 after breaking last high/low
________________________________________
🛡️ Risk Management
Basic Rules
1. Never place stop loss at obvious level
o Add 5-10 pips buffer
o Avoid round numbers
o Check where Liquidity Pools are
2. Reduce position in Kill Zones
o 50% of normal size
o Or wait until they end
3. Avoid trading at HIGH RISK status
o Unless experienced
o Then reverse logic - look for traps
Stop Loss - Where to Place?
❌ Bad places:
• Exactly below/above candle
• At Inducement Levels
• At round numbers
• Where Liquidity Pools visible
✅ Good places:
• Beyond last stop hunt
• Behind Trapped Traders zone
• Minimum 1.5 ATR from entry
• Where SM would lose significantly
Position Sizing
Safe position formula:
Risk per trade = 1-2% of capital
Position size = Risk / (Stop Loss in pips × Pip value)
Modifiers:
• Kill Zone active: × 0.5
• After SM signal: × 1.5
• HIGH RISK status: × 0.3
• With trend: × 1.2
________________________________________
❓ FAQ
General Questions
Q: Indicator shows nothing, what to do? A: Check in settings:
1. Reduce "Min. Touches" to 1
2. Increase "Detection Sensitivity"
3. Enable "Debug Mode" to see statistics
4. Ensure proper timeframe (15M+)
5. On 15M sometimes wait a few candles for first signal
Tip for 15M: If you don't see signals on 15M, enable Debug Mode. If it shows Liq=0, reduce "Min. Touches" to 1 and increase "Liquidity Lookback" to 100.
Q: Too many signals, I'm lost A:
1. Increase requirements (min. touches, respects)
2. Disable some components
3. Trade only strongest signals (SM 🎯)
Q: Which timeframe is best? A:
• 15M - PERFECT FOR LEARNING! Many signals, shows all manipulations, great for beginners
• 30M - Good balance, less noise than 15M
• 1H - Medium-term trading, clear setups
• 4H - Fewer signals but bigger moves, for patient traders
• 1D - Only major levels, position trading
💡 For beginners: Start with 15M! That's where you'll see how the market really works - stop hunts, traps, false breakouts. Only after understanding the mechanics, move to higher timeframes.
Technical Questions
Q: What does "x15" mean at LIQ? A: Number of level touches. Higher = stronger level.
Q: Why are Kill Zones red? A: High risk periods - most manipulation.
Q: What does Debug Mode show? A: When "Show Debug Info" is enabled, a label appears above the last candle with:
• Liq=X - number of Liquidity Pools found
• Ind=X - number of Inducement Levels found
• HighLvl=X - number of highs stored in memory
• LowLvl=X - number of lows stored in memory
This helps understand why sometimes no signals appear (e.g., when Liq=0).
Trading Questions
Q: Can I use only this indicator? A: Yes, but better combined with:
• Trend analysis
• Support/resistance
• Volume
Q: Does it work on all markets? A: Best on liquid ones:
• ✅ Major Forex pairs
• ✅ Main indices
• ✅ BTC, ETH
• ⚠️ Less liquid altcoins
• ❌ Exotic pairs, small caps
Q: How to remove indicator from chart? A:
• Method 1: Click X next to indicator name
• Method 2: Right-click on name → "Remove"
• Method 3: In indicators panel (left side) find and click trash icon
Q: Can I use multiple copies of the indicator? A: Yes! You can add the indicator multiple times with different settings (e.g., one for liquidity, another for stop hunts only).
Q: How much can I earn? A: Indicator doesn't guarantee profit. It's an analysis tool, not a trading system. Your results depend on:
• Discipline
• Risk management
• Experience
• Market conditions
________________________________________
🎯 Quick Start - Checklist
Pro Tip: After adding the indicator, click the star ⭐ to add to favorites - you'll have quick access in the future!
For Beginners:
• After adding indicator, set your UTC offset in settings
• Start on 15M timeframe (where you'll see the most action!)
• Observe for a week without trading
• Learn to recognize each signal type
• Practice on 15M, then try 1H
• Start with "Liquidity Sweep" strategy
• Max 1% risk per trade
• Keep trading journal
First Steps:
1. Days 1-3: Observe and learn signals
2. Days 4-7: Mark potential entries (no trading)
3. Week 2: Demo trading with small positions
4. Week 3+: Real trading with strict risk management
________________________________________
💬 Support
• Questions & Suggestions: Comments section under the indicator
• Bug Reports: Describe issue in comments with timeframe and instrument
• Updates: Click "Follow" to receive notifications
• Examples: Regular trading idea publications with usage examples
💡 Community: Share your setups in comments - let's help each other!
________________________________________
⚖️ Disclaimer
This indicator is an educational and analytical tool. It does not constitute investment advice. Trading involves risk of capital loss. Always conduct your own analysis and apply appropriate risk management. Historical results do not guarantee future profits.

OptionHawk1. What makes the script original?
• Unique concept: It integrates a Keltner based custom supertrend with a multi-EMA energy visualization, ATR based multi target management, and on chart options (CALL/PUT) trade signals—creating a toolkit not found in typical public scripts.
• Innovative use: Instead of off the shelf indicators, it reinvents them:
• Keltner bands used as dynamic Supertrend triggers.
• Fifteen EMAs layered for “energy” zones (bullish/bearish heatmaps).
• ATR dynamically scales multi-TP levels and stop loss.
These are creatively fused into a unified signal and automation engine.
________________________________________
2. What value does it provide to traders?
• Clear entries & exits: Labels for entry price/time, five TP levels, and SL structure eliminate guesswork.
• Visualization & automation: Real-time bar coloring and energy overlays allow quick momentum reads.
• Targeted to common pain points: Many traders struggle with manual TP/SL and entry timing—this automates that process.
• Ready for real use: Just plug into intraday (e.g., 5 min) or swing setups; no manual calculations. Signals are actionable out of the box.
________________________________________
3. Why invite only (worth paying)?
• Proprietary fusion: Public indicators like Supertrend or EMA are common—but your layered use, ATR based scaling, and label logic are exclusive.
• Auto-generated options format: Unique labeling for CALL/PUT, with graphical on chart signals, isn’t offered freely elsewhere.
• Time-saver & edge-provider: Saves traders hours of configuration and enhances consistency—worth the subscription cost over piecing together mash ups.
________________________________________
4. How does it work?
• Signal backbone: Custom supertrend uses Keltner bands crossing with close for direction, filtered by trend direction EMAs.
• Multi time logic: Trend defined by crossover of price over dynamic SMA thresholds built from ATR.
• Energy bar-colors/EMAs: 15 fast EMAs color-coded green/red to instantly show momentum.
• Entry logic: “Bull” when close crosses above supertrend; “Bear” when crosses below.
• Risk management: SL set at previous bar; up to 5 ATR scaled targets (or percentage based).
• Options formatted alerts: CALL/PUT labels with ₹¬currency values, embedded timestamp, SL/TP all printed on the chart.
________________________________________
5. How should traders use it?
• Best markets & timeframes: Ideal for intraday / low timeframe (1 15m) setups and 1 hour swing trades in equities, indices, options.
• Conditions: Works best in trending or volatility driven sessions—visible via Keltner bands and EMA energy alignment.
• Recommended combo: Use alongside volume filters or broader cycles; when supertrend & energy EMAs align, validation is stronger.
________________________________________
6. Proof of effectiveness?
• On chart visuals: Entry/exit labels, confirmed labels, TP and SL markers make past hits obvious.
• Real trade examples: Highlighted both bull & bear setups with full profit realization or SL hits.
• Performance is paint tested: Easy to showcase historic signals across multiple tickers.
• Data-backed: Users can export chart data to calculate win rate and avg return per trade.
________________________________________
Summary Pitch:
OptionHawk offers a holistic, execution-ready trading tool:
1. Proprietary blend of Keltner-supertrend and layered EMAs—beyond standard scripts.
2. Automates entries, multi-tier targets, SL, and options-format labels.
3. Visual energy overlays for quick momentum readings.
4. Use-tested in intraday and swing markets.
5. Installs on chart and works immediately—no setup complexity.
It's not a public indicator package; it's a self-contained, plug and play trade catalyst—worth subscribing for active traders seeking clarity, speed, and structure in their decision-making.
6. While OptionHawk is designed for clarity and structure, no script can predict the market. Always use with discretion and proper risk management.
---------------------------------------------------------------------------------------------------------------------
OptionHawk: A Comprehensive Trend-Following & Volatility-Adaptive Trading System
The "OptionHawk" script is a sophisticated trading tool designed to provide clear, actionable signals for options trading by combining multiple technical indicators and custom logic. It aims to offer a holistic view of market conditions, identifying trend direction, momentum, and potential entry/exit points with dynamic stop-loss and take-profit levels.
________________________________________
1. Why These Specific Indicators and Code Elements?
The "OptionHawk" script is a strategic fusion of the Supertrend indicator (modified with Keltner Channels), a multi-EMA "Energy" ribbon, dynamic trend lines (based on SMA and ATR), a 100-period Trend Filter EMA, and comprehensive trade management logic (SL/TP). My reason and motivation for this mashup stem from a desire to create a robust system that accounts for various market aspects often overlooked by individual indicators:
• Supertrend with Keltner Channels: The standard Supertrend is effective for trend identification but can sometimes generate whipsaws in volatile or ranging markets. By integrating Keltner Channels into the Supertrend calculation, the volatility measure becomes more adaptive, using the (high - low) range within the Keltner Channel for its ATR-like component. This aims to create a more responsive yet less prone-to-false-signals Supertrend.
• Multi-EMA "Energy" Ribbon: This visually striking element, composed of 15 EMAs, provides a quick glance at short-to-medium term momentum and potential support/resistance zones. When these EMAs are stacked and moving in one direction, it indicates strong "energy" behind the trend, reinforcing the signals from other indicators.
• Dynamic Trend Lines (SMA + ATR): These lines offer a visual representation of support and resistance that adapts to market volatility. Unlike static trend lines, their ATR-based offset ensures they remain relevant across different market conditions and asset classes, providing context for price action relative to the underlying trend.
• 100-Period Trend Filter EMA: A longer-period EMA acts as a higher-timeframe trend filter. This is crucial for confirming the direction identified by the faster-acting Supertrend, helping to avoid trades against the prevailing broader trend.
• Comprehensive Trade Management Logic: The script integrates automated calculation and display of stop-loss (SL) and multiple take-profit (TP) levels, along with trade confirmation and "TP Hit" labels. This is critical for practical trading, providing immediate, calculated risk-reward parameters that individual indicators typically don't offer.
This combination is driven by the need for a multi-faceted approach to trading that goes beyond simple signal generation to include trend confirmation, volatility adaptation, and essential risk management.
________________________________________
2. What Problem or Need Does This Mashup Solve?
This mashup addresses several critical gaps that existing individual indicators often fail to fill:
• Reliable Trend Identification in Volatile Markets: While Supertrend is good, it can be late or whipsaw. Integrating Keltner Channels helps it adapt to changing volatility, providing more reliable trend signals.
• Confirmation of Signals: A common pitfall of relying on a single indicator is false signals. "OptionHawk" uses the multi-EMA "Energy" ribbon and the 100-period EMA to confirm the trend identified by the Keltner-Supertrend, reducing false entries.
• Dynamic Support/Resistance & Trend Context: Static support and resistance levels can quickly become irrelevant. The dynamic SMA + ATR trend lines provide continually adjusting zones that reflect the current market's true support and resistance, giving traders a better understanding of price action within the trend.
• Integrated Risk and Reward Management: Most indicators just give entry signals. This script goes a significant step further by automatically calculating and displaying clear stop-loss and up to five take-profit levels (either ATR-based or percentage-based). This is a vital component for structured trading, allowing traders to pre-define their risk and reward for each trade.
• Visual Clarity and Actionable Information: Instead of requiring traders to layer multiple indicators manually, "OptionHawk" integrates them into a single, cohesive display with intuitive bar coloring, shape plots, and informative labels. This reduces cognitive load and presents actionable information directly on the chart.
In essence, "OptionHawk" provides a more comprehensive, adaptive, and actionable trading framework than relying on isolated indicators.
________________________________________
3. How Do the Components Work Together?
The various components of "OptionHawk" interact in a synergistic and often sequential manner to generate signals and manage trades:
• Keltner-Supertrend as the Primary Signal Generator: The supertrend function, enhanced by keltner_channel, is the core of the system. It identifies potential trend reversals and continuation signals (bullish/bearish crosses of the supertrendLine). The sensitivity and factor inputs directly influence how closely the Supertrend follows price and its responsiveness to volatility.
• Multi-EMA "Energy" Ribbon for Momentum and Confirmation: The 15 EMAs (from ema1 to ema15) are plotted to provide a visual representation of short-term momentum. When the price is above these EMAs and they are spread out and pointing upwards, it suggests strong bullish "energy." Conversely, when price is below them and they are pointing downwards, it indicates bearish "energy." This ribbon serves as a simultaneous visual confirmation for the Supertrend signals; a buy signal from Supertrend is stronger if the EMA ribbon is also indicating upward momentum.
• Dynamic Trend Lines for Context and Confirmation: The sma_high and sma_low lines, incorporating ATR, act as dynamic support and resistance. The trend variable, determined by price crossing these lines, provides an overarching directional bias. This component works conditionally with the Supertrend; a bullish Supertrend signal is more potent if the price is also above the sma_high (indicating an uptrend).
• 100-Period Trend Filter EMA for Macro Trend Confirmation: The ema100 acts as a macro trend filter. Supertrend signals are typically considered valid if they align with the direction of the ema100. For example, a "BUY" signal from the Keltner-Supertrend is ideally taken only if the price is also above the ema100, signifying that the smaller trend aligns with the larger trend. This is a conditional filter.
• Trade Confirmation and SL/TP Logic (Sequential and Conditional):
• Once a bull or bear signal is generated by the Keltner-Supertrend, the tradeSignalCall or tradeSignalPut is set to true.
• A confirmation step then occurs for a "BUY" signal, the script checks if the close of the next bar is higher than the entry bar's close. For a "SELL" signal, it checks if the close of the next bar is lower. This is a sequential confirmation step aimed at filtering out weak signals.
• Upon a confirmed signal, the stop-loss (SL) is immediately set based on the previous bar's low (for calls) or high (for puts).
• Multiple take-profit (TP) levels are calculated and stored in arrays. These can be based on a fixed percentage or dynamic ATR multiples, based on user input.
• The TP HIT logic continuously monitors price action simultaneously against these pre-defined target levels, displaying labels when a target is reached. The SL HIT logic similarly monitors for a stop-loss breach.
In summary, the Supertrend generates the initial signal, which is then confirmed by the dynamic trend lines and the 100-period EMA, and visually reinforced by the EMA "Energy" ribbon. The trade management logic then takes over, calculating and displaying vital risk-reward parameters.
________________________________________
4. What is the Purpose of the Mashup Beyond Simply Merging Code?
The purpose of "OptionHawk" extends far beyond merely combining different indicator codes; it's about creating a structured and informed decision-making process for options trading. The key strategic insights and functionalities added by combining these elements are:
• Enhanced Signal Reliability and Reduced Noise: By requiring multiple indicators to align (e.g., Keltner-Supertrend signal confirmed by EMA trend filter and dynamic trend lines), the script aims to filter out false signals and whipsaws that commonly plague individual indicators. This leads to higher-probability trade setups.
• Adaptive Risk Management: The integration of ATR into both the Supertrend calculation and the dynamic stop-loss/take-profit levels makes the entire system adaptive to current market volatility. This means stop-losses and targets are not static but expand or contract with the market's price swings, promoting more realistic risk management.
• Clear Trade Entry and Exit Framework: The script provides a complete trading plan with each signal: a clear entry point, a precise stop-loss, and multiple cascading take-profit levels. This holistic approach empowers traders to manage their trades effectively from initiation to conclusion, rather than just identifying a potential entry.
• Visual Confirmation of Market Strength: The "Energy" ribbon and dynamic trend lines provide an immediate visual understanding of the market's momentum and underlying trend strength, helping traders gauge conviction behind a signal.
• Improved Backtesting and Analysis: By combining these elements into one script, traders can more easily backtest a comprehensive strategy rather than trying to manually combine signals from multiple overlaying indicators, leading to more accurate strategy analysis.
• Suitability for Options Trading: Options contracts are highly sensitive to price movement and volatility. This script's focus on confirmed trend identification, dynamic volatility adaptation, and precise risk management makes it particularly well-suited for the nuanced demands of options trading, where timing and defined risk are paramount.
________________________________________
5. What New Functionality or Insight Does Your Script Offer?
"OptionHawk" offers several new functionalities and insights that significantly enhance decision-making, improve accuracy, and provide clearer signals and better timing for traders:
• "Smart" Supertrend: By basing the Supertrend's volatility component on the Keltner Channel's range instead of a simple ATR, the Supertrend becomes more sensitive to price action within its typical bounds while still adapting to broader market volatility. This can lead to earlier and more relevant trend change signals.
• Multi-Confirmation System: The script doesn't just provide a signal; it layers multiple confirmations (Keltner-Supertrend, multi-EMA "Energy" coloration, dynamic trend lines, and the 100-period EMA). This multi-layered validation significantly improves the accuracy of signals by reducing the likelihood of false positives.
• Automated and Dynamic Risk-Reward Display: This is a major functionality enhancement. The automatic calculation and clear display of stop-loss and five distinct take-profit levels (based on either ATR or percentage) directly on the chart, along with "TP HIT" and "SL HIT" labels, streamline the trading process. Traders no longer need to manually calculate these crucial levels, leading to enhanced decision-making and better risk management.
• Visual Trend "Energy" and Momentum: The vibrant coloring of the multi-EMA ribbon based on price relative to the EMA provides an intuitive and immediate visual cue for market momentum and "energy." This offers an insight into the strength of the current move, which isn't available from single EMA plots.
• Post-Signal Confirmation: The "Confirmation" label appearing on the bar after a signal, if the price continues in the signaled direction, adds an extra layer of real-time validation. This helps to improve signal timing by waiting for initial follow-through.
• Streamlined Options Trading Planning: For options traders, having clear entry prices, stop-losses, and multiple target levels directly annotated on the chart is invaluable. It helps in quickly assessing potential premium movements and managing positions effectively.
In essence, "OptionHawk" transitions from a collection of indicators to a semi-automated trading assistant, providing a comprehensive, visually rich, and dynamically adaptive framework for making more informed and disciplined trading decisions.
----------------------------------------------------------------------------------------------------------------
Performance & Claims
1. What is the claimed performance of the script or strategy?
Answer: The script does not claim any specific performance metrics (e.g., win rate, profit factor, percentage gains). It's an indicator designed to identify potential buy/sell signals and target/stop-loss levels. The labels it generates ("BUY CALL," "BUY PUT," "TP HIT," "SL HIT") are informational based on its internal logic, not a representation of actual trading outcomes.
2. Is there any proof or backtesting to support this claim?
Answer: No, the provided code does not include any backtesting functionality or historical performance proof. As an indicator, it simply overlays visual signals on the chart. To obtain backtesting results, the logic would need to be implemented as a Pine Script strategy with entry/exit rules and commission/slippage considerations.
3. Are there any unrealistic or exaggerated performance expectations being made?
Answer: The script itself does not make any performance expectations. It avoids quantitative claims. However, if this script were presented to users with implied promises of profit based solely on the visual signals, that would be unrealistic.
4. Have you clearly stated the limitations of the performance data (e.g., “based on backtesting only”)?
Answer: There is no statement of performance data or its limitations because the script doesn't generate performance data.
5. Do you include a disclaimer that past results do not guarantee future performance?
Answer: No, the script does not include any disclaimers about past or future performance. This is typically found in accompanying documentation or marketing materials for a trading system, not within the indicator's code itself.
________________________________________
Evidence & Transparency
6. How are your performance results measured (e.g., profit factor, win rate, Sharpe ratio)?
Answer: Performance results are not measured by this script. It's an indicator.
7. Are these results reproducible by others using the same script and settings?
Answer: The visual signals and calculated levels (Supertrend line, EMAs, target/SL levels) generated by the script are reproducible on TradingView when applied to the same instrument, timeframe, and with the same input settings. However, the actual trading results (profit/loss) are not generated or reproducible by this indicator.
8. Do you include enough data (charts, equity curves, trade logs) to support your claims?
Answer: No, the script does not include or generate equity curves or trade logs. It provides visual labels on the chart, which can be seen as a form of "data" to support the signal generation, but not the performance claims (as none are made by the code).
________________________________________
Future Expectations
9. Are you making any predictions about future market performance?
Answer: No, the script does not make any explicit predictions about future market performance. Its signals are based on historical price action and indicator calculations.
10. Have you stated clearly that the future is fundamentally uncertain?
Answer: No, the script does not contain any statements about the uncertainty of the future.
11. Are forward-looking statements presented with caution and appropriate language?
Answer: The script does not contain any forward-looking statements beyond the visual signals it generates based on real-time data.
________________________________________
Risk & Disclosure
12. Have you disclosed the risks associated with using your script or strategy?
Answer: No, the script does not include any risk disclosures. This is typically found in external documentation.
13. Do you explain that trading involves potential loss as well as gain?
Answer: No, the script does not contain any explanation about the potential for loss in trading.
________________________________________
Honesty & Integrity
14. Have you avoided hype words like “guaranteed,” “foolproof,” or “no losses”?
Answer: Yes, the script itself avoids these hype words. The language used within the code is technical and describes the indicator's logic.
15. Is your language grounded and realistic rather than promotional?
Answer: Yes, the language within the provided Pine Script code is grounded and realistic as it pertains to the technical implementation of an indicator.
16. Are you leaving out any important details that might mislead users (e.g., selective performance snapshots)?
Answer: From the perspective of the code itself, no, it's not "leaving out" performance details because it's not designed to generate them. However, if this indicator were to be presented as a "strategy" that implies profitability without accompanying disclaimers, backtesting results, and risk disclosures, then that external presentation could be misleading. The script focuses on signal generation and visual representation.
⚠️ Disclaimer:
This indicator is for informational and educational purposes only. It does not guarantee any future results or performance. All trading involves risk. Please assess your own risk tolerance and consult a licensed financial advisor if needed. Past performance does not indicate future returns.

Palgo Trading - Palgo🎯THE PALGO INDICATOR
The "Palgo Trading - Palgo" indicator, developed by PALGOTRADING is a sophisticated technical analysis tool designed to identify potential buy and sell signals by combining trend analysis with momentum and optional AI-driven sentiment assessment. This indicator provides a clear visual representation of potential trading opportunities directly on the price chart.
At its core, the Palgo indicator synthesizes information from well-established technical analysis concepts with statistical functions, and has optional AI Integration for social analysis of the asset using external data :
Supertrend: This indicator identifies the prevailing trend direction. A positive Supertrend value suggests an upward trend, while a negative value indicates a downward trend. The Palgo indicator utilizes a Supertrend with a customizable multiplier and a user-configurable Average True Range (ATR) length (defaulting to 21).
🛜Signal Generation Logic
The indicator generates buy and sell signals based on a calculated "final direction" value. This value is derived by combining the Supertrend direction and a modified RSI. The modification involves scaling the RSI output to a range of -0.5 to 0.5 and then further adjusting it.
The buy and sell conditions are as follows:
Buy Signal: A buy signal is triggered when the "final direction" crosses above a positive activation threshold while the current signal is not already bullish. Upon signal generation, a "Buy" label (colored green) appears below the bar, and initial Take Profit (TP) and Stop Loss (SL) levels are calculated and stored.
Sell Signal: Conversely, a sell signal is triggered when the "final direction" crosses below a negative activation threshold while the current signal is not already bearish. A "Sell" label (colored red) is plotted above the bar, and corresponding TP and SL levels are determined.
✅ Optimized Take-Profit / Stop-Loss
The Take-Profit (TP) & Stop-Loss (SL) signals are optimized with Kernel Density Estimation (KDE), the script uses KDE activated by gaussian function on previous pivot points and trains the model, then tries to estimate new pivot points early, to determine new TP / SL levels for the current signal. Kernel Density Estimation takes values of the previous confirmed pivots' RSI values, body size & more factors to determine their role. This indicator can generate up to 5 TP signals per signal.
📈 Signal Trail
Palgo also includes a "Signal Trail" that visually shows the market's momentum. This trail is like a dynamic line that follows the price.
When the market is in an uptrend and looking strong, you'll see a green trail.
When it's in a downtrend and looking weak, you'll see a red trail.
This trail helps you see if the market is currently aligned with Palgo's bullish (buy) or bearish (sell) signal. It also acts as a visual guide for potential support or resistance levels.
📊Backtesting Dashboard
The Palgo indicator includes an optional Backtesting Dashboard to help you understand its historical performance. This dashboard appears directly on your chart and provides a quick summary of how the indicator's signals have performed in the past.
Here's what you'll see on the dashboard:
Sensitivity: This shows the specific "Sensitivity" setting you've chosen for the indicator. This setting influences how often signals are generated.
Wins: This number tells you how many trades initiated by the Palgo indicator historically ended in profit (reached a Take-Profit target or closed profitably when the signal reversed).
Loss: This number indicates how many trades historically ended in a loss (hit the Stop-Loss).
Winrate: This is a very important metric, displayed as a percentage. It shows you the proportion of winning trades compared to the total number of trades (Wins / (Wins + Loss)). A higher winrate generally suggests a more effective strategy.
This dashboard is a valuable tool for reviewing the indicator's effectiveness with different settings and helping you make informed decisions about its use in your trading.
🤖AI Integration (Optional):
A unique feature of the Palgo indicator is the optional integration of Artificial Intelligence (AI) sentiment analysis. When the "Use AI" input is enabled, the indicator incorporates two additional user-defined inputs:
Impression Change %: This input represents the percentage change in overall market sentiment as assessed by an external AI.
Positivity Change: This input reflects the change in positive sentiment, also provided by an AI.
These AI inputs are combined to create an "AI Score," which then influences the "final direction" calculation. A positive AI Score amplifies the bullish signals and dampens bearish signals, while a negative AI Score has the opposite effect.
❓Why PALGO ?
All-in-One Analysis: Palgo combines trend, momentum, and advanced statistical analysis into one easy-to-use tool, giving you a complete picture without needing multiple indicators.
Dynamic Profit & Loss Management: Unlike many tools with fixed targets, Palgo's smart profit and stop-loss system adapts to the market using KDE. This helps you potentially capture more gains and limit losses effectively.
Optional AI Insights: For an extra edge, Palgo can tap into Artificial Intelligence (AI) to gauge overall market mood. If the AI sees a lot of positive buzz, it can strengthen buy signals; if it's negative, it can reinforce sell signals. This helps you trade with a better understanding of the market's pulse.
Clear and Customizable: Palgo is designed to be very visual. It changes the color of the price bars, adds clear "Buy" or "Sell" labels, and marks your profit and stop-loss points. You can also change the colors to suit your preference.
Palgo aims to be a comprehensive and adaptable trading tool, giving you clearer insights.
⚙️Visualizations and Customization
The Palgo indicator offers several visual cues to aid traders:
Bar Coloring: The price bars are colored green when the indicator identifies a bullish signal and red during a bearish signal.
Signal Labels: Clear "Buy" and "Sell" labels are plotted at the signal generation points.
Take Profit and Stop Loss Markers: Distinct shapes and labels indicate when the price reaches the calculated TP and SL levels.
Style Options: Users can customize the colors for bullish and bearish bars, text, and TP/SL markers within the indicator's settings.
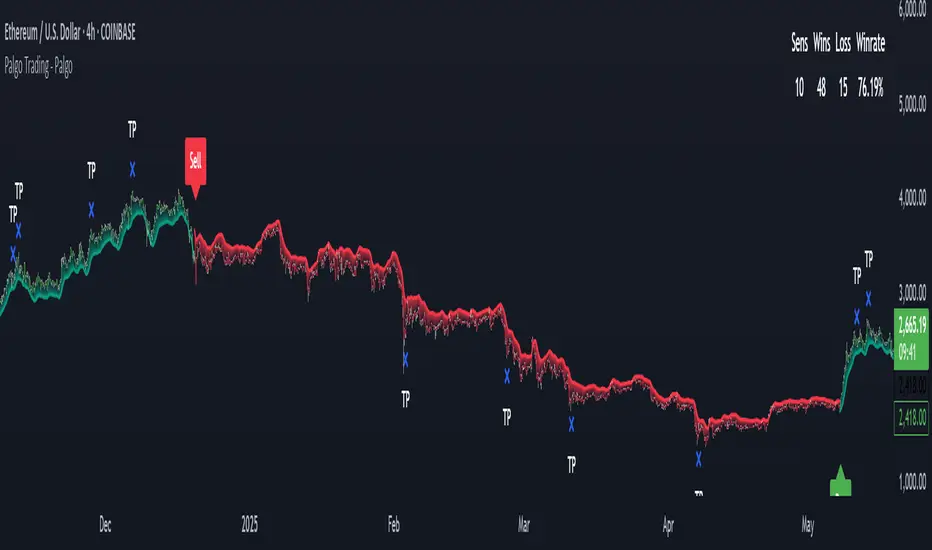
AQPRO Pattern Map
📝 INTRODUCTION
AQPRO Pattern Map is a comprehensive trading tool designed to automate the detection of 27 most popular candlestick patterns across any financial asset, making it a powerful tool for traders who use strategies, which are based on candlestick patterns.
This indicator not only identifies candlestick patterns but also incorporates multi-timeframe (MTF) analysis , risk management tools like Take-Profit (TP) and Stop-Loss (SL) , and labeled visual cues for effortless chart reading. Below is the complete list of patterns it supports:
📜 Patterns scanned by the indicator:
One-candle patterns:
Hammer;
Shooting Star;
Marubozu (Bullish/Bearish);
Doji.
Two-candle patterns:
Belt Hold (Bullish/Bearish);
Engulfing (Bullish/Bearish);
Harami (Bullish/Bearish);
Harami Cross (Bullish/Bearish);
Kicker (Bullish/Bearish);
Window (Rising/Falling Gap);
Piercing Line / Dark Cloud Cover.
Three-candle patterns:
Outside Up / Down Bar;
Inside Up / Down Bar;
Morning Star / Evening Star;
Three White Soldiers / Three Black Crows;
Advance Block / Descent Block;
Tasuki Gap (Upside/Downside);
Side-by-Side White Lines.
Multi-candle patterns:
Rising One / Falling One;
Rising Two / Falling Two;
Rising Three / Falling Three;
Rising Four / Falling Four;
Rising Five / Falling Five;
Breakaway Two / Three / Four / Five (Bullish/Bearish);
Fakey (Bullish/Bearish).
With this tool, traders can visually and systematically track key candlestick setups across multiple timeframes simultaneously, making it an all-in-one solution for identifying actionable patterns.
🎯 PURPOSE OF USAGE
The primary goal of the "AQPRO Pattern Map" is to equip traders with a highly efficient way of identifying significant candlestick patterns across different timeframes, making the decision-making process stronger in a sense of both quality and quantity of presented information.
Specifically, this indicator addresses the following needs:
Automation of pattern detection.
Nobody likes searching for patterns on the chart "by hand", because it takes too much time and mental energy. With this screener you can forget about this problem: automatic scanning for 27 of the most commonly used patterns will save your tens, if not hundreds of hours of time, so you can focus on what really matters;
Multi-timeframe (MTF) analysis.
This one is one of the most unique features of this indicator, because after conducting product research in library of open-source scripts alike this screener, almost none of reviewed indicators had MTF analysis feature embedded in them. This feature is important for the simplest of reasons: you see candlestick data from other timeframes without jumping from one timeframe to another . Needless to say how much time it will save for traders over the years of trading. See description below to learn more on exact functionality of our MTF analysis;
Risk management automation.
Humans tend to overestimate risk, when matters are about earning money from "financially-dangerous" activities and trading is no exception. To help traders better understand what they risk, we implemented a simple, yet effective way of displaying levels of risk for each pattern. For each new pattern on the chart you will be able see automatic creation of Take-Profit (TP) and Stop-Loss (SL) levels. It involves creation and displaying of lines and labels, representing each level at its exact coordinates. This elevates visual perception of risk for fellow traders and avoid excessive risk in many cases;
Simplicity in data visualization.
Charts, which are cluttered with pointless visual noise, presented as 'additional confirmation analysis', don't foster insights and are not worth a dime . We understand this issue very well and we designed our indicator with the solution to this problem in mind. Every bit of information, that you will see on your chart, will make sense both technically and visually — no more wasting time cleaning mess on your charts.
By addressing the needs, described above, this indicator will be a useful tool for any trader, who employs principles of candlestick pattern analysis, because most important pains of this kind of analysis are efficiently handled by our indicator.
⚙️ SETTINGS OVERVIEW
Customization options of our indicator are quite extensive, because flexibility in such indicator is in the top of most important qualities. Let's review each group of settings deeper:
📊 Patterns: One-Candle
This group allows you to enable or disable specific onep -candle candlestick patterns.
Toggle on/off switch for Hammer, Shooting Star, Marubozu, and Doji .
📊 Patterns: Two-Candle
This group allows you to enable or disable specific two -candle candlestick patterns.
Toggle on/off switch for Belt Hold, Engulfing, Harami & Harami Cross, Kicker, Window, Piercing Line & Dark Cloud Cover .
📊 Patterns: Three-Candle
This group allows you to enable or disable specific three -candle candlestick patterns.
Toggle on/off switch for Morning Star & Evening Star, Three White Soldiers, Three Black Crows, Advance Block & Descent Block, Tasuki Gap, Side-by-Side Gap (Bullish), Squeeze .
📊 Patterns: Multi-Candle
This group allows you to enable or disable specific multi -candle (3 or more candle) candlestick patterns.
Toggle on/off switch for Rising/Falling sequences, Breakaway patterns, and Fakey .
📊 MTF Settings
These settings allow you to use the Multi-Timeframe Screener to display patterns from additional timeframes.
"Use MTF Screener" — toggles the addition of MTF Screener to main dashboard ( described in 'Visual Settings' ). If enabled, adds section of MTF Screener below main dashboard
* List of four timeframes — your personal list to choose your timeframe, which will be used to get data about latest patterns. Default list of timeframes includes timeframes like 15min, 30min 1hr, 4hr .
* The detected patterns from these timeframes will be displayed in the MTF Dashboard on the chart.
🛡️ Risk Settings
As was described above, risk settings in our indicator will control appearance of TP and SL labels and lines, which appear for each new trade. Here you can customize the most essential parameters.
"Show TP/SL" — toggles the visibility of Take-Profit (TP) and Stop-Loss (SL) values for the most recent pattern.
"Risk-to-Reward Ratio (R:R)" — defines your desired risk/reward ratio for the TP and SL calculations. The more this parameter is, the further the TP from entry level will be.
🎨 Visual Settings
In this group of settings you can fine-tune the visual appearance of the indicator to fit your preferences.
IMPORTANT: colour parameters from this group of settings affect ONLY colours in the dashboard.
"Use info dashboard" — if enabled, shows dashboard in the top right corner of the chart, which displays latest pattern's TP and SL alongside with this pattern's trade status: '⏳' - TP or SL have not been reached yet, '✋' - TP or SL have already been reached already, refrain from taking the trade.
"Bullish Pattern" — defines the color for bullish patterns.
"Bearish Pattern" — defines the color for bearish patterns.
"Neutral Pattern" — specify the color for neutral patterns like Doji.
"Frame Width" — adjusts the thickness of frames highlighting detected patterns on the chart.
📈 APPLICATION GUIDE
The way of application of this indicator is pretty straightforward, because trading methodologies based on candlestick patterns were developed decades ago and haven't changed much since then. However, we find it necessary to explain the most essential ways of application in this section.
Let's start with the basics — how you will your chart look when you load the indicator for the first time:
By default we have 5 main visual data "blocks":
Bullish patterns;
Bearish patterns;
Risk visualization;
Main Dashboard;
MTF Screener.
Let's review each of these groups one by one.
BULLISH & BEARISH PATTERNS
Patterns are displayed as up/down labels, which are styled in corresponding to trend colours. Each patterns has its own unique emoji to help traders easily navigate between patterns.
Also by default each pattern has its custom frame, inside of which resides candle (or multiple candles) of the pattern iself. These frames are made with purpose to show each pattern in a very clear way on the chart, because huge number of public scripts usually only show simple label of such patterns and don't highlight the pattern itself on the chart. To remove frames you can set "Frame Width" parameter to 0 in 'Visual Settings' group in the settings.
You can see the examples of frame on the screenshot below:
RISK VISUALIZATION (TP & SL)
Displaying Take-Profits and Stop-Losses in our indicator on the chart works quite simple: for each new trade indicator creates new pairs of lines and labels for TP and SL, while lines & labels from previous trade are erased for aesthetics purposes. Each label shows price coordinates, so that each trader would be able to grap the numbers in seconds.
See the visual showcase of TP & SL visualization on the screenshot below:
Also, whenever TP or SL of the current trade is reached, drawing of both TP and SL stops . When the TP is reached, additional '✅' emoji on the TP price is shown as confirmation of Take-Profit.
However, while TP or SL has not been reached, TP&SL labels and lines will be prolonged until one of them will be reached or new signals will come.
See the visual showcase of TP & SL stopping being visualized & TP on the screenshot below:
MAIN DASHBOARD
Main dashboard is displayed in the top right corner of the chart and it shows the data of latest pattern, that occurred on the current asset and current timeframe: pattern's name, TP, SL and trade status. Depending on bullishness or bearishness of the pattern, dashboard is colour in respective colour.
Also on the right of side TP and SL data block there is a so called trade status. It is basically an indication of wether or not latest pattern's trade is still active or not:
If TP or SL of the pattern have not been reached yet, trade is considered active and is marked with '⏳' emoji;
If TP or SL of the pattern have already been reached, trade is considered inactive and is marked with '✋' emoji.
See the visual showcase of dashboard on the screenshot below:
MTF Screener
MTF Screener is displayed right below the main dashboard and its has distinctive 'MTF Patterns' header row on the top, painted in gray colour to make sure that every traders understand he is looking at.
This screener shows the timeframe and name of patterns from four other timeframes, which trader can customize in the settings to his liking. This will help trader get more insights on global sentiment of other timeframes, which improves trading results overall if applied correctly.
In the future MTF Screener will be expanded to have more data in it, like TP and SL, age of pattern and etc.
See the visual showcase of the MTF Screener on the screenshot below:
Features, explained above, make this indicator quite versatile and suitable for incorporation in any trading strategy, which uses candlestick patterns. They are simple, yet insightful, and traders, which use similar strategies everyday, will truly appreciate the benefits of this indicator when they will set up this indicator for the first time on their chart.
🔔 ALERTS
This indicator employs alerts for an event when new pattern occurs. While creating the alert below 'Condition' field choose 'any alert() function call' .
When this alert is triggered, it will generate this kind of message:
string msg_template = "EXCHANGE:ASSET, TIMEFRAME: BULLISH_OR_BEARISH pattern PATTERN_NAME was found."
string msg_example = "BINANCE:BTCUSDT, 15m: bullish pattern 'Hammer' was found."
📌 NOTES
This indicator is most effective when used in combination with other technical analysis tools such as trendlines, moving averages, support/resistance levels or any other indicator-type tool. We strongly recommend using this indicator as confirmation indicator for your main trading strategy, not as primary source of signals;
If you want to trade directly by these patterns, make sure to use proper risk management techniques of your own and use TP&SL visualization on the chart to always have a clue about your current position;
If you lost track of visual components on the chart, look at the main dashboard to see text summary of data from latest pattern. Also don't forget to look at MTF Screener to have more context about MTF sentiment, because it is increases your understandings of MTF price trend and improves your decision-making process.
🏁 AFTERWORD
AQPRO Pattern Map was built to help traders automate candlestick pattern searching routine, improve chart readability and enhance perception of current potential risks, which may come from trading from a specific pattern. Indicator's main dashboard and MTF screener eliminate the need for constantly checking other timeframe for global sentiment, helping traders save even more time and fostering improved decision making.
This indicator will work in great conjunction with any other trading strategy as confirmation tool for entry decision. Using this indicator as primary source of signals is not recommended due to unstable nature of trading patterns.
ℹ️ If you have questions about this or any other our indicator, please leave it in the comments.

Breakout Patterns Detector: Triangle & Wedge [Splirus]This indicator identifies Breakout Patterns such as Ascending Triangles , Descending Triangles , Symmetric Triangles , Ascending Wedges , and Descending Wedges , using candlestick charts and Trendlines. It provides visual cues, stop-loss (SL), and take-profit (TP) levels, alongside a detailed dashboard to evaluate performance. The indicator supports two alert modes: Manual Mode for trader notifications and Bot Mode for automated trading signals.
To achieve optimal results, users are encouraged to experiment with indicator parameters and analyze the dashboard summary to find the perfect configuration for each timeframe, pair, and market condition.
Pattern Identification
The indicator detects the following breakout patterns based on pivot highs and lows:
Ascending Triangle : Flat upper trendline, rising lower trendline.
Descending Triangle : Flat lower trendline, declining upper trendline.
Symmetric Triangle : Converging trendlines with similar slopes (within a user-defined threshold).
Ascending Wedge : Both trendlines slope upward, converging.
Descending Wedge : Both trendlines slope downward, converging.
Patterns are identified using configurable left and right bars for small and big patterns, with slope thresholds normalized by ATR. A trend confirmation filter ensures breakouts align with market direction, and users can adjust breakout confirmation bars to validate signals.
The goal is to fine-tune these settings to suit specific timeframes and pairs, as each combination may require a unique setup for optimal performance.
Stop-Loss Calculation
Stop-loss levels are calculated dynamically based on pattern type and breakout direction:
Symmetric Triangle : SL is set at the first pivot of the opposite trendline, adjusted by a buffer percentage.
Ascending/Descending Triangle : SL is placed at the breakout trendline’s price, plus the buffer.
Ascending/Descending Wedge : SL is set at the second pivot of the opposite trendline, adjusted by the buffer.
The indicator calculates leverage based on a user-defined risk tolerance percentage. Users should adjust the SL buffer and risk tolerance to balance risk and reward, monitoring the dashboard to assess how these settings impact performance across different timeframes and pairs.
Take-Profit Calculation
Three take-profit levels ( TP1 , TP2 , TP3 ) are calculated using pattern height and user-defined multipliers:
For Ascending/Descending Triangles, height is the difference between the max and min prices within the pattern.
For Symmetric Triangles and Wedges, height is the vertical distance between trendlines at the pattern’s start.
TP levels are set as:
TP1 = Breakout price ± (Height × TP1 Multiplier).
TP2 = Breakout price ± (Height × TP2 Multiplier).
TP3 = Breakout price ± (Height × TP3 Multiplier, with a 1.5x adjustment for Wedges).
Experiment with TP multipliers to optimize the risk-reward ratio, using the dashboard to evaluate TP hit rates and overall profitability for each configuration.
Symmetric Triangle:
Ascending/Descending Wedge:
Ascending/Descending Triangles:
Finding the Perfect Configuration
The indicator’s dashboard provides a comprehensive summary of performance metrics, including total trades, TP1/TP2/TP3 hits, SL hits, profit/loss percentages, and win rates for bullish, bearish, and combined trades. These metrics are crucial for identifying the ideal parameter settings:
Timeframe and Pair Variability : Each timeframe (e.g., 15m, 30min, 1H, 4H, Daily) and pair (e.g., BTC/USD, EUR/USD) behaves differently. Adjust parameters like left/right bars, minimum pattern length, and breakout confirmation bars to match the volatility and trend characteristics of the chosen pair and timeframe.
Parameter Tuning : Modify slope thresholds, trend confirmation filters, and bars inside the pattern to filter out false breakouts. For example, a higher breakout confirmation bar setting may reduce signals but increase reliability on longer timeframes.
Dashboard Analysis : Focus on the dashboard’s win rate, profit/loss ratio, and TP/SL hit frequencies. A “Perfect” win rate (>66%) or high TP hit rate indicates a strong configuration. If the SL hit rate is high, consider tightening the trend confirmation filter or increasing the SL buffer.
Iterative Testing : Test different combinations of settings (e.g., small vs. big patterns, aggressive vs. conservative breakout confirmation) and compare dashboard results over time. The goal is to find a balance where the indicator consistently delivers high win rates and profitability for your specific trading setup.
Alert Modes
The indicator supports two alert modes to suit different trading styles:
Manual Mode : Generates alerts for breakouts with entry price, SL, TP1/TP2/TP3, and leverage, tailored for Crypto or Forex markets. Use this mode to manually evaluate signals while refining configurations.
Bot Mode : Sends automated trading signals. To avoid conflicts, Bot Mode ensures no short position alert is triggered while a long position is active, and vice versa. This mode is ideal once you’ve identified an optimal configuration via the dashboard.
Additional Features
Historical Patterns : Displays past trendlines with customizable transparency and extension, helping users analyze how patterns performed under different settings.
Customizable Settings : Adjust pattern size, breakout confirmation, trend filters, and visual preferences (colors, dashboard location) to match your trading style.
Market Compatibility : Supports Crypto and Forex markets across all timeframes, but requires careful tuning for each market type.
Usage Notes
Start with default settings and monitor the dashboard to establish a baseline performance for your chosen timeframe and pair.
Gradually adjust one parameter at a time (e.g., left/right bars, TP multipliers) and compare dashboard results to identify improvements.
Use historical pattern analysis to understand how past breakouts performed under different configurations, guiding your optimization process.
Once a high win rate and profitability are achieved, consider automating trades with Bot Mode for consistent execution.
Disclaimer
This indicator is intended for educational purposes only and should not be considered financial advice. Trading involves significant risk, and past performance is not indicative of future results. Users are strongly advised to thoroughly test and validate the indicator’s signals in a demo environment before using it in live trading. The author is not responsible for any financial losses incurred while using this indicator. Always conduct your own research and consult with a qualified financial advisor before making trading decisions.

Another EMA trend indicator"Another EMA Trend Indicator" is a dynamic trend-following tool. Blending customizable Moving Averages (EMA or SMA) with an automated, visualized trade management system. It identifies bullish and bearish trend shifts based on short- and long-term MA crossovers, dynamically calculates optimal entry points, stop-losses, and take-profits, and visually manages trades on the chart with optional clouds, lines, and labels.
Main Features:
Moving Average Trend Detection:
Choice between EMA (Exponential Moving Average) or SMA (Simple Moving Average).
Two customizable lengths: a short MA and a long MA.
Detects bullish and bearish switches based on MA crossover events.
Entry, SL, and TP Calculation:
Entries are calculated dynamically after a signal using a combination of historical candle high/low analysis and a risk divider.
Stop-loss and take-profit levels are automatically set based on the trend's recent volatility and user-defined risk parameters.
Supports fixed or dynamic profit targets.
Risk Management Settings:
Define minimum and maximum acceptable profit percentages.
Set maximum stop-loss distance and apply a stop-loss multiplier for added flexibility.
Limit maximum trade duration to avoid endless open trades.
Trade Visualization:
Optional debug mode to display:
Entry, stop-loss, and take-profit lines.
Buy/sell signals via shapes on the chart.
Trend cloud between short and long MAs.
Historical trend levels for better visualization.
Dynamic Statistics Panel:
Real-time display of:
First trade date.
Total number of trades.
Number of profitable and losing trades.
Average and maximum trade duration.
Win rate and average profit/loss percentages.
Inputs:
MA Type: Choose between "EMA" or "SMA."
Short/Long MA Length: Customize lengths to control sensitivity.
Source: Apply to typical price values like hl2.
Risk Settings:
Minimum, maximum, and fixed profit percentages.
Stop-loss settings and risk dividers.
Trade Behavior Settings:
Max trade length.
Visualization Toggles:
Show/hide debug labels, lines, clouds.
Use Case:
This indicator is ideal for trend-following traders who prefer a semi-automated trading framework. It helps maintain consistency in entries and exits while visualizing important trend dynamics and trade health directly on the chart.
Best suited for swing trading crypto coins.

AI Trend Momentum SniperThe AI Trend Momentum Sniper is a powerful technical analysis tool designed for day trading. This strategy combines multiple momentum and trend indicators to identify high-probability entry and exit points. The indicator utilizes a combination of Supertrend, MACD, RSI, ATR (Average True Range), and On-Balance Volume (OBV) to generate real-time signals for buy and sell opportunities.
Key Features:
Supertrend for detecting market direction (bullish or bearish).
MACD for momentum confirmation, highlighting changes in market momentum.
RSI to filter out overbought/oversold conditions and ensure high-quality trades.
ATR as a volatility filter to adjust for changing market conditions.
OBV (On-Balance Volume) to confirm volume strength and trend validity.
Dynamic Stop-Loss & Take-Profit based on ATR to manage risk and lock profits.
This indicator is tailored for intraday traders looking for quick market moves, especially in volatile and high liquidity assets like Bitcoin (BTC) and Ethereum (ETH). It helps traders capture short-term trends with efficient risk management tools.
How to Apply:
Set Your Chart: Apply the AI Trend Momentum Sniper to a 5-minute (M5) or 15-minute (M15) chart for optimal performance.
Buy Signal: When the indicator generates a green arrow below the bar, it indicates a buy signal based on positive trend and momentum alignment.
Sell Signal: A red arrow above the bar signals a sell condition when the trend and momentum shift bearish.
Stop-Loss and Take-Profit: The indicator automatically calculates dynamic stop-loss and take-profit levels based on the ATR value for each trade, ensuring proper risk management.
Alerts: Set up custom alerts for buy or sell signals, and get notified instantly when opportunities arise.
Best Markets for Use:
BTC/USDT, ETH/USDT – High liquidity and volatility.
Major altcoins with sufficient volume.
Avoid using it on low-liquidity assets where price action may become erratic.
Timeframes:
This indicator is best suited for lower timeframes (5-minute to 15-minute charts) to capture quick price movements in trending markets.

Original Gann Swing Chart Rules [AlgoFuego]🔵 Original Gann Swing Chart Rules
An advanced indicator built on W.D. Gann’s original rules, enhanced with innovative mechanical trend-following methods.
🔹 Description
This indicator functions by balancing short-term adaptability with long-term trend analysis.
The indicator incorporates Gann’s principles alongside mechanical trend-following techniques to offer a structured method for analyzing trends and detecting potential market reversals.
Golden Rule: Non-trend bars are excluded from analysis, and each new bar is compared with the previous trend bar, it highlights significant swing points with greater clarity.
🔸 The core concept behind the golden rule on which this indicator is built.
The person watching the tide coming, wanting to pinpoint the exact spot that signals the high tide, places a stick in the sand at the points where the incoming waves reach until the stick reaches a position where the waves no longer rise, and eventually recedes enough to show that the tide has shifted.
This method is effective for monitoring and identifying tides and floods in the stock market.
🔸Rule 1: The trend bar is everything.
→It is a bar that forms a new high, low, or both.
🔸Rule 2: The professional traders track new highs and lows.
🔸Rule 3: The hidden bar is nothing.
→It is a bar that does not form a new high, low, or both.
🔸Rule 4: The sea has a wavy nature, and the market as well.
🔸Rule 5: The slope is the immediate direction of the swing.
Downward slope
→The downslope is the descending slope of a swing, shows a decline, reflecting a bearish price trend.
Upward slope
→The upslope is the ascending slope of a swing, shows an incline, reflecting a bullish price trend.
🔸Rule 6: The start and end of the movement are the swing points.
→The lowest or highest price of the last bar in the direction of the slope represents the swing point after the slopes direction changes.
Valley
→It is the lowest price of the last bar in a downslope before the market turns to a upslope.
End=> Downward slope and Start=> Upward slope
Peak
→It is the highest price of the last bar in a upslope before the market turns to an downslope.
End=> Upward slope and Start=> Downward slope
🔸Rule 7: The Golden Rule: Ignore all no-trend bars and compare the new bar with the previous trend bar.
→Applying the golden rule in upward slope
→Applying the golden rule in downward slope
🔸 Related content: Personal words of W.D Gann from the book Wall Street Stock Selector.
→"This was only one month's reaction the same as March 1925. The market held in a dull narrow range for about 2 months while accumulation was taking place and in June the main trend turned up again."
→The beginning of the main trend and the formation of the Valley.
→The beginning of the main trend and the formation of the Peak.
🔸 Rule 8: The Closing Price of the Bar to Understand Movement Direction.
Sequence is important
→ Downward bar
→ Upward bar
🔸 Outside Bar Rules
→Explanation of rules and calculations.
🔸 How does a trend start?
Upward trend
Trend change from Downward to Upward.
Prices must take out the nearest 'Peak' and the Trend was previously Downward.
A breakout above the previous peak signals a bullish reversal.
→ Model 1 - Dropping Valley Reversal
The market forms a dropping valley, followed by a breakout above the previous peak.
→ Model 2 - Equal Valley Reversal
The market forms an equal valley, followed by a breakout above the previous peak.
→ Model 3 - Rising Valley Reversal
The market forms a rising valley, followed by a breakout above the previous peak.
Downward trend
Trend change from Upward to Downward.
Prices must take out the nearest ‘Valley' and the Trend was previously Upward.
A breakdown below the previous valley signals a bearish reversal.
→ Model 1 - Rising Peak Reversal
The market forms a rising peak, followed by a breakdown below the previous valley.
→ Model 2 - Equal Peak Reversal
The market forms an equal peak, followed by a breakdown below the previous valley.
→ Model 3 - Dropping Peak Reversal
The market forms a dropping peak, followed by a breakdown below the previous valley.
🔸 The fractal nature of markets
Rising wave
→ The rising wave is the entire bull market between turning points
High point : When the Main trend turns from upward to downward, the peak of the primary trend is formed.
Dropping wave
→ The Dropping wave is the entire bear market between turning points.
Low point : When the Main trend turns from downward to upward, the primary trend valley is formed.
Fractal nature application.
Everything in one picture.
🔹 Features
Strict adherence to the rules: Follows the Original Gann Swing Chart Rules to detect swing points.
Fractal analysis: Uses trend bars and fractal analysis to identify swing points.
Robust functionality: Engineered to handle complex market conditions with advanced logic.
Custom alerts: Alerts for peak/valley completion, main and primary trend reversals & continuations.
Golden rule application: Filters out non-trend bars by comparing only with the last trend bar.
Reversal & trend detection: Applies eight outside bar rules to detect trend reversals and continuations.
Dynamic customization: Fully customizable settings.
🔹 Settings overview
Fine-tune the indicator to match your unique trading strategy by adjusting trend settings, customizing alerts, and modifying visualization options.
1. Main trend settings
Hide/Show Main trend options: Instantly hide all main trend options (alerts remain separate).
Main trendline display & alerts: Toggle trendline visibility and set alerts for peaks and valleys.
Trendline customization: Adjust styles, colors, and slopes for upward/downward trends.
Peaks & Valleys markers: Show/hide points and customize their color and size.
Opposite Main trend turning points: Enable alerts and modify style, width, color, and offset.
Breakout/Breakdown points: Set alerts and customize their appearance.
2. Primary trend settings
Hide/Show primary trend options: Instantly hide all primary trend options (alerts remain separate).
Primary trendline display & alerts: Toggle trendline visibility and set alerts for peaks and valleys.
Trendline customization: Adjust styles, colors, and slopes for upward/downward trends.
Peaks & Valleys markers: Show/hide points and customize their color and size.
Opposite primary trend turning points: Enable alerts and modify style, width, color, and offset.
Breakout/Breakdown points: Set alerts and customize their appearance.
3. Additional options
Tooltips display: Control tooltip visibility for labels and languages.
Candle/Bar coloring: Customize candle and bar colors based on algorithm-selected trends.
🔸 Additional features
🔹Custom reading of bars.
The arrow represents the direction of the slope, the dot is the type of trend, and the line is the closing price.
🔹 Advanced Moving Average Activator
The Advanced Moving Average Activator, this setting calculates the average closing prices of trend bars only, which are the only bars considered by Gann.
The advantage of this method is that it helps avoid hidden bars that are not accounted for, making the difference more evident in a ranging market. The values are updated only when new highs or lows occur.
Additionally, you can set alerts when the price closes above or below the moving average.
🔹 Bar Counter
After a trend change, you can see exactly when the shift occurred and customize the type of trend you want to track.
For example, by conducting your own research on the assets you trade, based on historical data, you might discover valuable insights, such as the primary trend possibly lasting longer than 20 bars!
You can use these insights to refine your trading strategy and make more data-driven decisions.
🔹 How to use
Step 1: Configure the settings and choose your trading approach
Adjust the indicator settings to match your trading style and market conditions.
Effectively using the indicator starts with selecting your preferred trading style.
You can trade in alignment with the primary trend, capitalize on market reversals, or take advantage of breakouts.
Trading with the primary trend: Best for traders who prefer longer-term positions with higher stability.
Trading reversals: Ideal for those looking to enter at potential turning points but requires additional confirmation.
Trading breakouts: Suitable for traders targeting strong price movements after key level breakouts.
Adapting to market volatility: Monitor changing volatility and adjust your strategy accordingly for optimal results.
Step 2: Analyze the chart
Apply the indicator to your TradingView chart and interpret swing signals for informed decisions.
Carefully study the chart patterns to detect subtle signals.
Check if similar signals worked well in past market conditions.
Use multi-timeframe analysis for a broader perspective.
Step 3: Trade with the primary trend
Utilize trend direction to align trades with prevailing market movements.
Always trade in the direction of the primary trend.
Confirm the trend direction using multiple indicators or by relying on the primary trend as confirmation!.
Avoid trading against strong market momentum.
Step 4: Identify entry signals
Use indicator signals to identify ideal trade entry points.
Look for confirmation before entering a trade.
Wait for clear signals to avoid false entries.
Practice on a demo account to build confidence in your entry strategy.
Step 5: Apply risk management
Define stop-loss and take-profit levels to protect your capital effectively.
Set stop-loss orders at strategic levels to limit potential losses.
Risk only a small percentage of your capital per trade.
Adjust risk levels based on your overall portfolio performance.
Step 6: Confirm with trend analysis
Validate trends using additional indicators for a higher probability of success.
Use complementary tools to confirm trend direction.
Monitor trend changes to adjust your strategy promptly.
Keep an eye on volume indicators for added confirmation.
Step 7: Execute the trade
Enter trades based on confirmed signals and predefined strategy rules.
Ensure all your criteria are met before executing a trade.
Stay disciplined and stick to your strategy.
Review market conditions right before execution.
Step 8: Monitor the trade
Track trade performance and make adjustments as necessary.
Keep an eye on market conditions throughout the trade.
Be ready to adjust your strategy if unexpected events occur.
Use trailing stops to secure profits while allowing for gains.
Step 9: Implement exit strategy
Close trades strategically based on your pre-established exit plan.
Plan your exit strategy in advance and adhere to it.
Consider partial exits to secure profits along the way.
Avoid emotional decisions when closing trades.
Step 10: Review performance
Analyze past trades to continuously refine and improve your strategy.
Regularly review and document your trades for insights.
Identify patterns in both your successes and mistakes.
Update your strategy based on comprehensive performance reviews.
🔹 Disclosure
While this script is useful and provides insight into market tops, bottoms, and trend trading, it's critical to understand that past performance is not necessarily indicative of future results and there are many more factors that go into being a profitable trader.
