Aggresive Scalper/Swing Crypto StrategyThis is a simple yet very efficient scalper long strategy adapted for low timeframes for crypto. Can also be used with bigger timeframes as a swinger.
Its main components are:
Price oscillator swing
Vortex
Risk management for TP/SL
Rules for entry
We calculate the difference between the oscillator from the lowest low and the highest high. If the difference is positive, its a long potential. If its negative we exit from the long trade.
At the same time we check that the we have a crossover between the VIP vortex with the VIM vortex part.
Lastly we check that the current candle is bigger the second previous high.
Rules for exit
If we reach the take profit or the stop loss.
If we have a negative difference betwee LL and HH and VIP vortex crossunder with VIM vortex .
In this example I aimed for a 1:10 risk reward ratio, meaing that for every dollar lost, we will gain 10 when we win. Thus having a 10% minimum win rate will give us a profit over many trades.
If you have any questions, let me know !
In den Scripts nach "swing" suchen

EMA+RSI Pump & Drop Swing Sniper (SL+TP) - StrategyThis is the strategy version of the 'EMA-RSI-Pump-Drop-Swing-Sniper-With-Alerts':
Some additions with this strategy:
~Added Stop loss & Take profit control. In Settings > Inputs if the Stop Loss is at .051 that means it's 5.1% and the Take Profit at .096 is 9.6%. If you wish to remove the TP and SL just change the value to 1.00 and it would be the same as it being 100% TP and SL which is likely to never be hit.
~Added Backtesting by changing the month/date/year in Settings > Inputs
~Added a 2nd EMA line to assist with the long entry signals. I only use this for long entry & exits, though you could use the long exits as Short entries too. I just personally don't do short trading on Bitcoin.
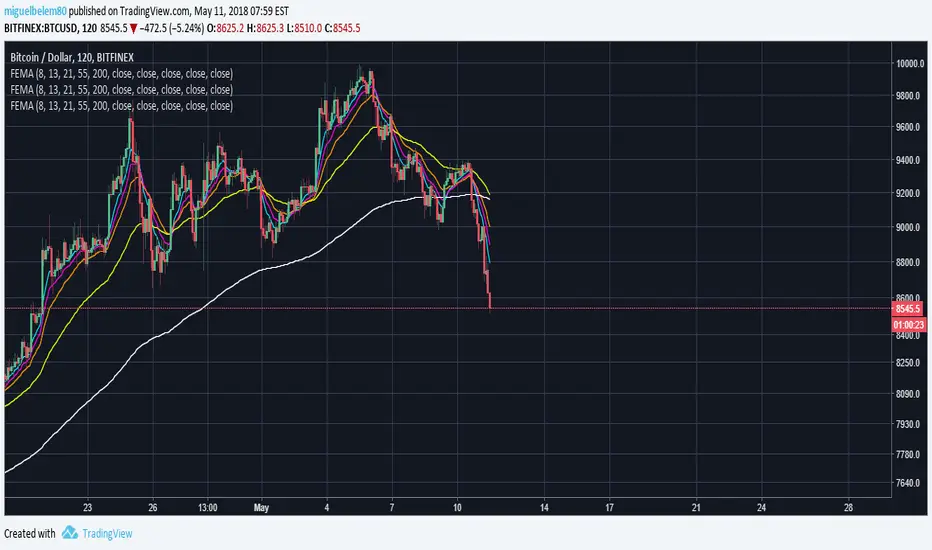
This is using an EMA and RSI with slightly modified settings to give good entry and exit points while looking at Bitcoin. I use this on a 1-hour and 4-hour chart and with other indicators to find good positions to enter a trade or exit if things are turning red.
It's important to know this strategy was made as a request by another user that was using the indicator version. I don't use this as a trading strategy by itself, I use the visuals it gives as a confirmation with other indicators to find the best possible entry and exit positions.
If you click on the EMA line it will color the bars of the chart based on if they are above or below the EMA - This is just visually helpful for me to see the active trend.
Make sure you hover over or click on the EMA line to see the colors of the candles change - it's not visible by default or without doing this.

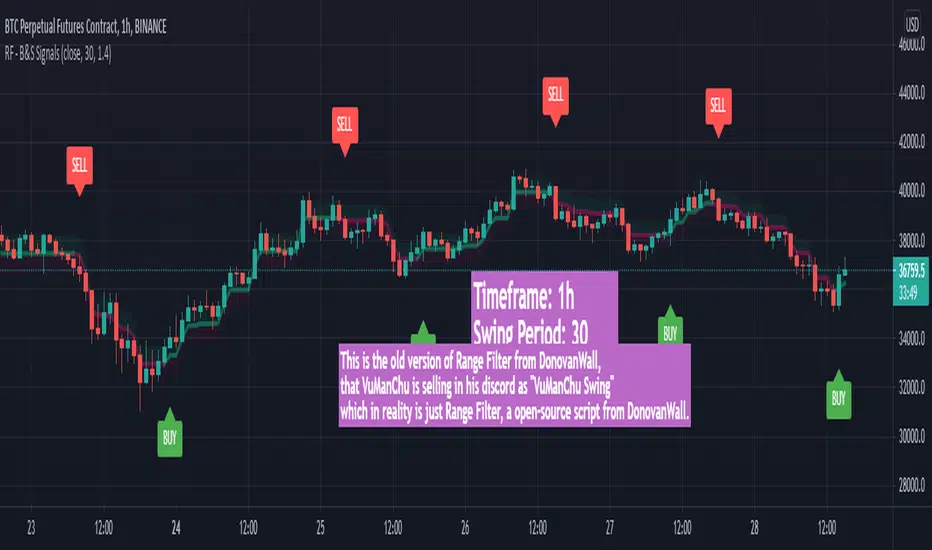
VuManChu Swing FreeThis is the old version of Range Filter from DonovanWall, that VuManChu is selling in his discord as "VuManChu Swing" which in reality is just Range Filter, a open-source script from DonovanWall.
Gann Circle Swing LevelsThis indicator is based on W. D. Gann's Square of 9 Chart and can be interpreted as the Gann Circle / Gann Wheel / 360 Degree Circle Chart or Square of the Circle Chart.
Spiral arrangement of numbers on the Square of 9 chart creates a very unique square root relationship amongst the numbers on the chart. If you take any number on the Square of 9 chart, take the square root of the number, then add 2 to the root and re-square it, resulting in one full 360 degree cycle (i.e. a 360 degree Circle) out from the center of the chart.
For example,
the square root of 121 = 11,
11 + 2 = 13,
and the square of 13 = 169
The number 169 is one full 360 degree cycle out (with reference to 121) from the center of the Square of 9 chart.
Similarly, if you take any number on the Square of 9 chart, take the square root of the number, then subtract 2 from the root and re-square it, resulting in one full 360 degree inward rotation towards the center of the chart.
For example,
the square root of 565 = 23.77,
23.77 - 2 = 21.77,
and the square of 21.77 = 473.93 (approximately equal to 474, which is directly below 565 on the Square of 9 chart)
The number 474 is one full 360 degree inward rotation (with reference to 565) towards the center of the chart.
How to Use this Indicator ?
This indicator is useful for finding coordinate squares on the Gann Circle that are making hard aspects to a previous position (such as a significant top or bottom) on the circle.
Input :
Swing Point (Significant price point, such as a top or a bottom)
Low / High ? (Is it a bottom or a top)
Number of Gann Levels (Number of Gann Cycles to be projected)
Output :
Gann Support or Resistance Levels (color coded as follows) :
Swing High or Swing Low (BLUE)
Support levels calculated with reference to the Swing High (RED)
Resistance levels calculated with reference to the Swing Low (LIME)

Simple and efficient swing RSI systemHello there,
I am glad to bring you another simple and efficient algorithm.
Its made purely from RSI which can be used directly or inversed. Its suited for swing trading 15 min chart or more minimum.
Can be adapted to all types of financial markets.
Rules for entry are easy : First we have the stop loss and take profits levels. Based on SL , we have the risk % of our equity, where the minimum lot we can trade its setted on 0.1 lots , can be modified tho.
For entries, we have the overbought and oversold levels.
Whenever we cross one of them we enter the trade . We close the trade whenever we reach sl/tp or inverse crosses.
Although its has a low win rate, its a very good system to catch big trends, so there you can recover all the small losses that you had in a untrend market .
Aswell it requires a lot of patience, since a position can be kept for weeks, even months.
Hope you enjoyed it .

[LunaOwl] Swing Filter作品: 擺盪濾波器 (Swing Filter)
This is a Swing Filter, the function is to remind you that you do not need to trade during the neutral period, only buy or long when the series is higher than the high-level you set, when the series is lower than the low-level you set, you need to short or hedge. Hope your to use it happily. In a larger time frame, the length can be set smaller, the default value is 100.
這是一個擺盪濾波器,它的功能是提醒您在中性時期不用交易,僅在市場高水平的時候買進持有或做多,當來到低水平時需要做空或對沖。希望使用愉快。此外,在較大的時間框架,期數設定小一點,預設是100。

[RS]Swing Charts V0 Trend Counter V0EXPERIMENTAL:
wave counting using swing charts, use at your own discretion.


Swing High Low ZigZag v3.0 BajaSwing High/Low Pivot - Designed to help easily spot peaks and bottoms for quicker drawing of trendlines and other drawings as well as alerts without needing to zoom in a whole lot.

swinglibraryLibrary "swinglibrary"
This library is for calculating non-repainting swings for further calculation on them.
These swings can later be drawn, but drawing is not part of this library, only the calculation.
What do I need to use the library?
You better include the following constants into your script using this library:
int SWING_NO_ACTION = 0
int SWING_FLIP = 1
int SWING_FLIP_NEW_SWING = 2
int SWING_FLIP_UPDATED = 3
int RELATION_HIGHER = 1
int RELATION_EQUAL = 0
int RELATION_LOWER = -1
Choosing the function, that fits your needs
This library contains 4 functions for calculating swings, the difference between them are the data you get for every swing point and additional average values for length and duration:
swings()
swingsR()
swingsL()
swingsLDR()
The naming scheme of these functions is the following:
The base version swings() is only for the swings containing the following swingPoint type:
swingPoint
Fields:
x (integer) : bar index
y (float) : price
hilo (integer) 1 -> high, -1 -> low
and the return type:
swingReturn
Fields:
swings (array) : array of the last x swing points
newSwingHigh (integer) : flag to detect changes for swing highs see constants (SWING_NO_ACTION, SWING_FLIP_NEW_SWING, SWING_FLIP_UPDATED)
newSwingLow (integer) : flag to detect changes for swing lows see constants (SWING_NO_ACTION, SWING_FLIP_NEW_SWING, SWING_FLIP_UPDATED)
The R in swingsR() stands for relation where the previously shown types do also contain the relation between the swings of the same swing type (highs and lows respectively).
The same goes for L in swingsL() for length containing the price difference between the current and previous swing point in ticks.
And in the following version swingsLDR() there is also the duration between the current and previous point included.
The parameters for the other functions and type definitions include only the ones, that are needed, the "full" version of the function is described here:
swingsLDR(swingSize, dtbStrength, init, SWING_HISTORY_NUM)
Parameters:
swingSize (int) This parameter defines the size of the swings to look after, meaning higher values will lead to bigger swings
dtbStrength (int) Value between 0 and 100 is a factor (%) to the ATR that is used to calculate equal highs/lows (double tops / bottoms).
Higher values will result in a higher tolerance of price difference between the swings.
init (bool) This value is usually set to false on default.
It has a special use case, where we need to reduce memory usage and calculation time on the script using this library by start calculating at x bars back instead of the beginning of the chart.
In this case, we set init = true on the first bar we start calculating the swings on to perform the correct initialization.
SWING_HISTORY_NUM (int) This is the max number of swings that are stored in the array, so only the last SWING_HISTORY_NUM swings are stored in the array to reduce the memory usage.
New ones remove the oldest ones like in a ring buffer.
This is also influencing the average duration and average swing length.
swingPointLDR
Fields:
x (integer) : bar index
y (float) : price
hilo (integer) : 1 -> high, -1 -> low
length (float) : price difference to the previous swing point in ticks
duration (integer) : duration difference to the previous swing point in number of bars
relation (integer) : see constants RELATION_HIGHER, RELATION_EQUAL, RELATION_LOWER: reelation to the previous swing points of the same type (previous high or previous low respectively)
swingReturnLDR
Fields:
swings (array) : array of the last x swing points
newSwingHigh (integer) : flag to detect changes for swing highs see constants (SWING_NO_ACTION, SWING_FLIP_NEW_SWING, SWING_FLIP_UPDATED)
newSwingLow (integer) : flag to detect changes for swing lows see constants (SWING_NO_ACTION, SWING_FLIP_NEW_SWING, SWING_FLIP_UPDATED)
avSwLength (float) : average swing length for the last x swings (depending on the max number of swings)
avSwingDuration (float) : average swing duration for the last x swings (depending on the max number of swings)
Swing IdentifierThe "Swing Identifier" is a custom Pine Script indicator designed for use in the TradingView platform. It serves to visually identify and mark swing highs and swing lows on a trading chart, which are key concepts in technical analysis. This script is comprehensive and customizable, making it a useful tool for traders looking to pinpoint potential trend reversals and support or resistance areas.
**Key Features of the 'Swing Identifier' Indicator:**
1. **Swing Range Input:**
- This input determines the number of bars to the left and right of the current bar that the script will examine to identify a swing high or low. A larger value will look for swings over a broader range, potentially identifying more significant swings but at the expense of sensitivity.
2. **Swing Strength Input:**
- The swing strength is set as a percentage and is used to filter out insignificant price movements. A swing high or low is only considered valid if the percentage change from the last swing is greater than this input value. This feature helps in avoiding false signals in sideways or less volatile markets.
3. **Use Wicks Option:**
- Users can choose whether to consider the wicks of the candles or just the closing prices in identifying swings. This feature adds flexibility, allowing the script to be tailored to different trading styles and strategies.
4. **Line Color Customization:**
- The color of the lines marking the swings can be customized, enhancing the visual appeal and readability of the chart.
**Operational Mechanics:**
1. **Identification of Swing Highs and Lows:**
- The script uses the `ta.pivothigh` and `ta.pivotlow` functions to identify swing highs and lows. Whether it uses the high/low of the candles or their closing prices is determined by the user's choice in the "Use Wicks" option.
2. **Drawing and Updating Lines:**
- When a new swing high or low is identified, and it meets the percentage change criteria from the previous swing, a line is drawn from the last swing low to the current high (or vice versa). If a new swing high (or low) is identified that is higher (or lower) than the previous one, the old line is deleted, and a new line is drawn.
3. **Swing Update Logic:**
- The script maintains a toggle mechanism to look alternatively for highs and lows. This ensures that it sequentially identifies a high and then a low (or vice versa), which aligns with how actual market swings behave.
**Usage in Trading:**
1. **Identifying Trend Reversals:**
- By marking swing highs and lows, the script helps traders identify potential trend reversals. A break of a swing low in an uptrend or a swing high in a downtrend could signal a change in the prevailing trend.
2. **Support and Resistance:**
- Swing highs and lows often act as levels of support and resistance. Traders can use these levels for setting entry or exit points, stop losses, and take profit orders.
3. **Customization for Strategy:**
- The customizable nature of the script allows traders to adjust the parameters according to their trading strategy, time frame, and asset volatility.
In summary, the "Swing Identifier" is a versatile and customizable tool that aids in visually identifying crucial price swing points, thereby assisting traders in making informed decisions based on technical analysis principles.

Swing PointsEnglish:
The indicator shows the fractals where stop-losses may be located and can be used to trade from their taking.
You can adjust the length of the fractal (the number of bars with which it is surrounded on both sides, to confirm the validity).
You can also display lines from fractal points for clarity.
To keep the chart clean, you can enable deletion of already taken fractals.
Example of use with deleted fractals and without lines:
Русский:
Индикатор показывает фракталы где могут находиться стоп-лоссы и его можно использовать для торговли от их снятия.
Можно настраивать длину фрактала (количество баров, которыми он окружен с обеих сторон, для подтверждения валидности).
Так же можно выводить линии от фрактальных точек для наглядности.
Для сохранения чистоты графика можно включить удаление уже снятых фракталов.
Пример использования с удалением снятых фракталов и без линий:
Swing Failure Signals [AlgoAlpha]🟠 OVERVIEW
This script detects swing failure patterns by tracking how price interacts with recent swing highs and lows, then confirming those sweeps with a change in candle behavior. The goal is to highlight areas where price briefly breaks a key level, fails to continue, and then shifts direction. These events often occur around liquidity runs, where stops are triggered before price reverses. The script draws levels, colors bars, and prints clear markers to help visualize where these failures occur and when they are confirmed.
🟠 CONCEPTS
The logic starts with pivot-based swing detection. Recent swing highs and lows are stored and monitored. When price trades beyond one of these levels within a defined historical window, it is treated as a sweep. A sweep alone is not enough. The script then waits for a Change in State of Delivery (CISD), which is defined by a shift in candle structure that shows follow-through in the opposite direction. A tolerance filter measures how far price traveled beyond the level relative to the reaction that followed. If the reaction is strong enough and happens within a limited number of bars, the sweep is validated as a swing failure. In short: the swing defines the reference, the sweep shows intent, and the CISD confirms acceptance or rejection.
🟠 FEATURES
Sweep detection with a maximum lookback to avoid outdated levels
CISD confirmation using candle structure and price expansion
Alert conditions for bullish and bearish swing failures
🟠 USAGE
Setup : Add the script to your chart. It works on any market and timeframe. Lower timeframes highlight intraday liquidity runs, while higher timeframes show structural failures. Start with the default inputs before adjusting.
Read the chart : A bullish swing failure occurs when price sweeps a prior low, then reverses and confirms with a bullish CISD. A bearish swing failure is the opposite, sweeping a prior high and confirming with a bearish CISD. Dashed lines mark the swept swing. Solid lines mark the CISD level. Bars are colored while the SFP state is active.
Settings that matter : Increasing Pivot Detection Length finds more significant swings but fewer signals. Reducing Max Pivot Point Edge limits how far back sweeps are allowed, keeping signals more current. The Patience setting controls how many bars are allowed for confirmation after a sweep. The Trend Noise Filter raises or lowers how strong the reaction must be to qualify as a valid failure.

Swing-Based VWAPSwing-Based VWAP
Summary:
The "Swing-Based VWAP" indicator enhances traditional VWAP calculations by incorporating swing-based logic. It dynamically adapts to market conditions by identifying key swing highs and lows and calculating VWAP levels around these pivot points. This makes it a versatile tool for traders seeking actionable price insights.
Explanation:
What is Swing-Based VWAP?
The Swing-Based VWAP is a modified version of the Volume-Weighted Average Price (VWAP). It calculates VWAP not only for a chosen timeframe (e.g., session, week) but also adapts dynamically to market swings. By identifying swing highs and lows, it offers more precise levels for potential price action.
Unique Features:
1. Dynamic Swing Integration:
- Uses pivot points to determine significant price levels.
- Calculates VWAP based on these points to adapt to market trends.
2. User-Friendly Settings:
- Includes options to hide VWAP on higher timeframes for chart clarity.
- Flexible swing size input for adjusting sensitivity.
How to Use:
1. Configuring Swing Settings:
- Use the "Swing Setting" input to determine the sensitivity of swing detection.
- Higher values identify broader swings, while smaller values capture more granular movements.
2. Enabling/Disabling VWAP:
- Toggle VWAP visibility using the "Use VWAP" option.
- The "Hide VWAP on 1D or Above" setting lets you control visibility on higher timeframes.
3. Anchor Period:
- Select your preferred anchoring period (e.g., session, week) to match your trading style.
4. Adjusting the Data Source:
- Use the "Source" input to select the price source (default: HLC3).
5. Visualizing Swing-Based VWAP:
- The script plots a dynamic VWAP line based on detected swing points.
- This line highlights average price levels weighted by volume and swing pivots.
Contrarian Market Structure BreakMarket Structure Break application was inspired and adapted from Market Structure Oscillator indicator developed by Lux Algo. So much credit to their work.
This indicator pairs nicely with the Contrarian 100 MA and can be located here:
Indicator Description: Contrarian Market Structure BreakOverview
The "Contrarian Market Structure Break" indicator is a versatile tool tailored for traders seeking to identify potential reversal opportunities by analyzing market structure across multiple timeframes. Built on Institutional Concepts of Structure (ICT), this indicator detects Break of Structure (BOS) and Change of Character (CHoCH) patterns across short-term, intermediate-term, and long-term swings, plotting them with customizable lines and labels. It generates contrarian buy and sell signals when price breaks key swing levels, with a unique "Blue Dot Tracker" to monitor consecutive buy signals for trend confirmation. Optimized for the daily timeframe, this indicator is adaptable to other timeframes with proper testing, making it ideal for traders of forex, stocks, or cryptocurrencies.
How It Works
The indicator combines three key components to provide a comprehensive view of market dynamics: Multi-Timeframe Market Structure Analysis: It identifies swing highs and lows across short-term, intermediate-term, and long-term periods, plotting BOS (continuation) and CHoCH (reversal) events with customizable line styles and labels.
Contrarian Signal Generation: Buy and sell signals are triggered when the price crosses below swing lows (buy) or above swing highs (sell), indicating potential reversals in overextended markets.
Blue Dot Tracker: A unique feature that counts consecutive buy signals ("blue dots") and highlights a "Hold Investment" state with a yellow background when three or more buy signals occur, suggesting a potential trend continuation.
Signals are visualized as small circles below (buy) or above (sell) price bars, and a table in the bottom-right corner displays the blue dot count and recommended action (Hold or Flip Investment), enhancing decision-making clarity.
Mathematical Concepts Swing Detection: The indicator identifies swing highs and lows by comparing price patterns over three bars, ensuring robust detection of pivot points. A swing high occurs when the middle bar’s high is higher than the surrounding bars, and a swing low occurs when the middle bar’s low is lower.
Market Structure Logic: BOS is detected when the price breaks a prior swing high (bullish) or low (bearish) in the direction of the current trend, while CHoCH signals a potential reversal when the price breaks a swing level against the trend. These are calculated across three timeframes for a multi-dimensional perspective.
Blue Dot Tracker: This feature counts consecutive buy signals and tracks the entry price. If three or more buy signals occur without a sell signal, the indicator enters a "Hold Investment" state, marked by a yellow background, until the price exceeds the entry price or a sell signal occurs.
Entry and Exit Rules Buy Signal (Blue Dot Below Bar): Triggered when the closing price crosses below a swing low on either the intermediate-term or long-term timeframe, suggesting an oversold condition and potential reversal upward. Short-term signals can be enabled but are disabled by default to reduce noise.
Sell Signal (White Dot Above Bar): Triggered when the closing price crosses above a swing high on either the intermediate-term or long-term timeframe, indicating an overbought condition and potential reversal downward.
Blue Dot Tracker Logic: After a buy signal, the indicator increments a blue dot counter and records the entry price. If three or more consecutive buy signals occur (blueDotCount ≥ 3), the indicator enters a "Hold Investment" state, highlighted with a yellow background, suggesting a potential trend continuation. The "Hold Investment" state ends when the price exceeds the entry price or a sell signal occurs, resetting the counter.
Exit Rules: Traders can exit buy positions when a sell signal appears, the price exceeds the entry price during a "Hold Investment" state, or based on additional confirmation from BOS/CHoCH patterns or other technical analysis tools. Always use proper risk management.
Recommended Usage
The indicator is optimized for the daily timeframe, where it effectively captures significant reversal and continuation patterns in trending or ranging markets. It can be adapted to other timeframes (e.g., 1H, 4H, 15M) with careful testing of settings, particularly enabling/disabling short-term structure analysis to suit market conditions. Backtesting is recommended to optimize performance for your chosen asset and timeframe.
Customization Options Market Structure Display: Toggle short-term, intermediate-term, and long-term structures on or off, with customizable line styles (solid, dashed, dotted) and colors for bullish and bearish breaks.
Labels: Enable or disable BOS/CHoCH labels for each timeframe to reduce chart clutter.
Signal Visibility: Hide buy/sell signals if desired for a cleaner chart.
Blue Dot Tracker: Monitor the blue dot count and action (Hold or Flip Investment) via the table display, which is fully customizable in terms of position and appearance.
Why Use This Indicator?
The "Contrarian Market Structure Break" indicator offers a robust framework for identifying high-probability reversal and continuation setups using ICT principles. Its multi-timeframe analysis, clear signal visualization, and innovative Blue Dot Tracker provide traders with actionable insights into market dynamics. Whether you're a swing trader or a day trader, this indicator’s flexibility and intuitive design make it a valuable addition to your trading arsenal.
Note for TradingView Moderators
This script complies with TradingView's House Rules by providing an educational and transparent description without performance claims or guarantees. It is designed to assist traders in technical analysis and should be used alongside proper risk management and personal research. The code is original, well-documented, and includes customizable inputs and clear visual outputs to enhance the user experience.
Tips for Users:
Backtest thoroughly on your chosen asset and timeframe to validate signal reliability. Combine with other indicators or price action analysis for confirmation of entries and exits. Adjust timeframe settings and enable/disable short-term structures to match market volatility and your trading style.
Hope the "Contrarian Market Structure Break" indicator enhances your trading strategy and helps you navigate the markets with confidence! Happy trading!

SWING DELTAThis will show the price change between the high/low of each candlestick as an oscillator with configurable options to show Long/Short or both.

Swing HL**摆动点标注(Swing HL)**
本指标用于在价格图表上标示摆动高点与摆动低点,以辅助用户观察价格结构、波段节奏及潜在支撑/阻力区域。标注以圆点形式叠加在主图上,可通过参数灵活控制显示周期、敏感度及视觉样式,适合作为价格结构分析的辅助工具。
### 参数及用法说明
1. **最小显示时间框架(minSwingTf)**
* 用途:设定摆动点开始显示的最小周期。
* 当前图表周期小于该设置时,不显示任何摆动标注。
* 建议:
* 做中短线结构分析时,可设置为 240 分钟或更高;
* 若需要在更小周期观察结构,可适当降低该参数。
2. **left / right(leftBars / rightBars)**
* 用途:共同控制摆动高点、低点识别的“严格程度”和频率。
* 调整建议:
* 数值较小:标注更频繁,适合关注细节波动、短线结构;
* 数值较大:只保留更明显的摆动点,适合观察中期或波段结构;
* 当图表上摆动点过多、显得拥挤时,可适当增大这两个参数。
3. **标注颜色(dotColor)**
* 用途:设置摆动点圆标的颜色。
* 建议根据图表背景及主图颜色进行调整,以保证摆动点清晰可见但不过于抢眼。
4. **线宽(dotWidth)**
* 用途:控制圆点标注的线宽,从而影响圆点的视觉大小。
* 当需要在高密度数据或缩放较小时保持清晰,可适当增大该数值。
### 使用建议
* 可将本指标作为结构辅助层叠加在任何交易系统之上,用于直观划分价格的波段高低点。
* 进行多周期分析时,可在较大周期(如 4H、日线)上利用本指标确认整体结构,再配合小周期执行入场与风控。
* 当摆动点过多时,可通过提高 `minSwingTf` 或增加 `left` / `right` 参数,使结构标注更加简洁清晰。
* 本指标仅提供价格摆动结构的可视化标注,不直接构成完整的交易信号或策略规则,建议与个人既有分析方法结合使用。
---
**Swing HL – Swing High/Low Marker**
This indicator marks swing highs and swing lows on the price chart to assist in reading price structure, swing rhythm, and potential support/resistance zones. Markers are plotted as dots on the main chart, and display behavior can be fully controlled via user inputs such as minimum timeframe, sensitivity, and visual style. It is designed to serve as a structural overlay for discretionary or systematic analysis.
### Inputs and Usage
1. **Minimum Display Timeframe (minSwingTf)**
* Purpose: Defines the minimum timeframe on which swing markers will be shown.
* When the current chart timeframe is below this setting, all swing markers are hidden.
* Guidance:
* For swing or position-style structure analysis, consider using 4H or higher;
* For intraday structural work, you may lower this value as needed.
2. **left / right (leftBars / rightBars)**
* Purpose: Jointly control how strict and how frequent swing highs and lows are marked.
* Tuning:
* Smaller values: More frequent swings, suitable for detailed, lower-timeframe structure;
* Larger values: Only more pronounced swings are kept, suitable for higher-level trend and swing mapping;
* If the chart becomes crowded with markers, increasing these values will simplify the structure.
3. **Marker Color (dotColor)**
* Purpose: Sets the color of the swing markers.
* It is recommended to choose a color that contrasts with the background and main price plot while remaining visually unobtrusive.
4. **Line Width (dotWidth)**
* Purpose: Controls the line width of the dot markers, effectively adjusting their perceived size.
* On dense charts or when zoomed out, a larger value can help maintain readability.
### Practical Notes
* Use this indicator as a structural overlay to highlight swing highs and lows alongside your existing trading tools and methods.
* In multi-timeframe workflows, it can help outline the main structure on higher timeframes (e.g., 4H, Daily), which you then refine on lower timeframes for execution.
* If too many swing points appear, either increase `minSwingTf` or raise the `left` / `right` values to obtain a cleaner structural view.
* The script is intended as a visualization aid for price swings; it does not, by itself, define entry, exit, or risk management rules and should be integrated into a broader analytical framework.

Swing High/Low ExtensionsSwing High/Low — Extensions (2 Plots + Drawings + Touch Signal)
What it does
This indicator finds Swing Highs/Lows using a symmetric length (same bars left & right), then creates horizontal extension levels that run to the right and stop at the first price touch (“extend until future intersection”).
It outputs:
Two plots showing the most recent active High/Low extension (great for alerts & strategy logic).
Line drawings for every detected swing (historical levels stay on the chart and end at the touch bar).
A hidden TouchSignal used to color bars and trigger alerts without distorting the price scale.
The design mirrors Sierra Chart’s “Swing High and Low” with “Extend Swings Until Future Intersection”, but implemented natively in Pine.
How it determines swings
Uses ta.pivothigh() / ta.pivotlow() with length bars left and right.
A swing is confirmed only after there are length bars to the right of the center.
How extensions/lines end
High extensions end when High ≥ level.
Low extensions end when Low ≤ level.
The corresponding line drawing is frozen on the touch bar; the most recent active line continues to extend each new bar.
Inputs
Swing Strength (Bars Left = Right) – symmetric pivot length.
Offset as Percentage – 1 = +1%; positive values push levels outward (High up / Low down), negative pull them inward.
Draw “Extend…Until Future Intersection” Lines – toggle line drawings on/off.
Line Width (Plots + Drawings) – thickness for plots and drawings.
HighExt Color / LowExt Color – colors for the two plots and drawings.
Touch Color – color to paint bars on the touch bar (doesn’t affect scale).
HighExt/LowExt Line Style – choose line style (Solid/Dashed/Dotted) for drawings.
Color Bars on Touch? – enable/disable bar coloring.
Bar Color on High Touch / Low Touch – separate bar colors for each side.
Bar Color Transparency (0..100) – opacity for the bar painting.
Plots
HighExt – latest active high extension only.
LowExt – latest active low extension only.
(Internally there is also a hidden “TouchSignal” plot used for bar coloring & alerts; it’s not displayed to keep the chart scale clean.)
Alerts
Three built-in alertconditions:
Any Extension Touched — triggers when either side is hit.
High Extension Touched — only high level touch.
Low Extension Touched — only low level touch.
Create alerts from the indicator’s “More” (⋯) menu → Add alert → choose one of the conditions.
Styling
Drawings use your selected style (Solid/Dashed/Dotted), color, and width.
Existing historical lines adopt new styles when the script recalculates.
Bar coloring highlights the exact touch candle; disable it if you prefer clean candles.
Notes & tips
Scale-safe: the TouchSignal is hidden (display=none), so it won’t distort the Y-axis.
Performance: TradingView limits scripts to ~500 line objects; this script uses max_lines_count=500. If you hit the cap on long histories, either increase timeframe or disable drawings and rely on the two plots + alerts.
Works on any symbol/timeframe; levels are rounded to the instrument’s minimum tick.
Intended use
For discretionary levels, alerting, and rule-based entries that react to first touch of recent swing extensions. Not financial advice—use at your own risk.

Swing High/Low with Liquidity Sweeps🧠 Overview
This indicator identifies swing highs and swing lows based on user-defined candle lengths and checks for liquidity sweeps—situations where the price breaks a previous swing level but then closes back inside, indicating a potential false breakout or stop hunt. It also supports visual labeling and alerts for these events.
⚙️ Inputs
Swing Length (must be odd number ≥ 3):
Determines how many candles are used to identify swing highs/lows. The central candle must be higher or lower than all neighbors within the range.
Example: If swingLength = 5, the central candle must be higher/lower than the 2 candles on both sides.
Sweep Lookback (bars):
Defines how many bars to look back for possible liquidity sweeps.
Show Swing Labels (checkbox):
Optionally display labels on the chart when a swing high or low is detected.
Show Sweep Labels (checkbox):
Optionally display labels on the chart when a liquidity sweep occurs.
🕯️ Swing Detection Logic
A Swing High is detected when the high of the central candle is greater than the highs of all candles around it (as per the defined length).
A Swing Low is detected when the low of the central candle is lower than the lows of surrounding candles.
Swing labels are placed slightly above (for highs) or below (for lows) the candle.
💧 Liquidity Sweep Logic
A Sweep High is triggered if:
The current high breaks above a previously detected swing high,
And then the candle closes below that swing high,
Within the configured lookback window.
A Sweep Low is triggered if:
The current low breaks below a previous swing low,
And then closes above it,
Within the lookback window.
These are often seen as stop hunts or fake breakouts.
🔔 Alerts
Sweep High Alert: Triggered when a sweep above a swing high occurs.
Sweep Low Alert: Triggered when a sweep below a swing low occurs.
You can use these to set up TradingView alerts to notify you of potential liquidity grabs.
📊 Use Cases
Identifying market structure shifts.
Spotting fake breakouts and potential reversals.
Assisting in smart money concepts and liquidity-based trading.
Supporting entry timing in trend continuation or reversal strategies.

Swing High/Low (ZigZag) [ChartPrime]Swing High/Low (ZigZag) Indicator
The Swing High/Low (ZigZag) Indicator is a versatile tool for identifying and visualizing price swings, swing highs, and swing lows. It dynamically plots levels for significant price points while connecting them with a ZigZag line, enabling traders to analyze market structure and trends with precision.
⯁ KEY FEATURES
Swing Highs and Lows Detection
Accurately detects and marks swing highs and lows, providing a clear structure of market movements.
Real-Time ZigZag Line
Connects swing points with a dynamic ZigZag line for a visual representation of price trends.
Customizable Swing Sensitivity
Swing length input allows traders to adjust the sensitivity of swing detection to match their preferred market conditions.
Swing Levels with Shadows
Option to display swing levels with extended shadows for better visibility and market analysis.
Broken Levels Marking
Tracks and visually updates levels as dashed lines when broken, providing insights into shifts in market structure.
Swing Direction Display
At the top-right corner, the indicator displays the current swing direction (up or down) with a directional arrow for quick reference.
Interactive Labels
Marks swing levels with labels, showing the price of swing highs and lows for added clarity.
Dynamic Market Structure Analysis
Automatically adjusts ZigZag lines and levels as the market evolves, ensuring real-time updates for accurate trading decisions.
⯁ HOW TO USE
Analyze Market Trends
Use the ZigZag line and swing levels to identify the overall direction and structure of the market.
Spot Significant Price Points
Swing highs and lows act as potential support and resistance levels for trading opportunities.
Adjust Swing Sensitivity
Modify the swing length setting to match your trading strategy, whether scalping, day trading, or swing trading.
Monitor Broken Levels
Use the dashed lines of broken levels to identify changes in market dynamics and potential breakout or breakdown zones.
Plan Entries and Exits
Leverage swing levels and direction to determine optimal entry, stop-loss, and take-profit points.
⯁ CONCLUSION
The Swing High/Low (ZigZag) Indicator is a powerful tool for traders seeking to visualize price swings and market structure. Its real-time updates, customizable settings, and dynamic swing direction make it an invaluable resource for technical analysis and decision-making.
