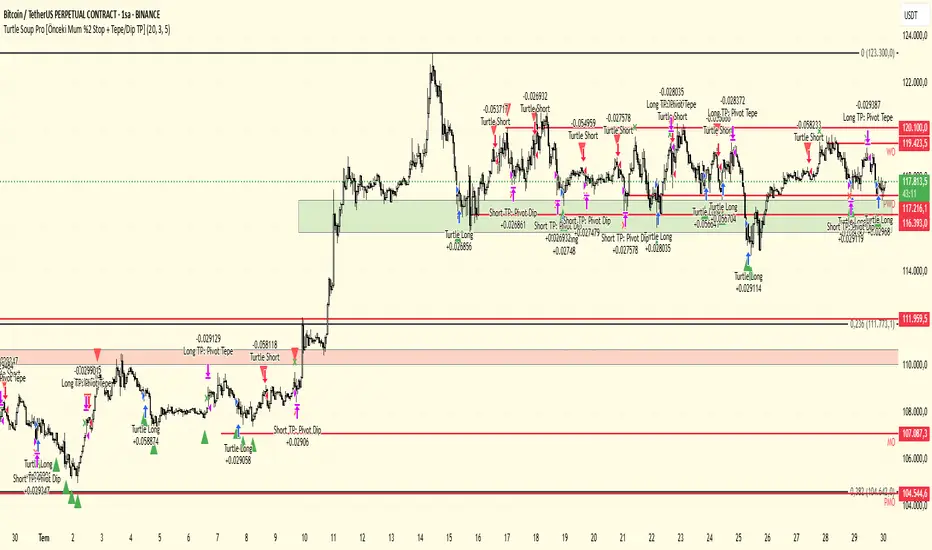
Turtle Soup Pro (meminkrt)Turtle Soup Pro Strategy - Explained
The Turtle Soup Pro strategy is a reversal-based trading system inspired by the original
Turtle Soup setup.
It is designed to identify potential false breakouts near significant highs or lows, using
price action and
optional volume confirmation (OBV).
Core Concept
------------
The strategy looks for fake breakouts beyond the highest or lowest price over the past
20 candles.
If price temporarily breaches this key level and then closes back within range, the
strategy treats it
as a potential trap and generates a trade signal in the opposite direction.
Long Entry Criteria
-------------------
- Price briefly drops below the lowest low of the past 20 bars.
- The candle closes back above that low (indicating a fake breakdown).
- (Optional) Volume confirmation is used through On-Balance Volume (OBV) to confirm
bullish momentum.
Short Entry Criteria
--------------------
- Price temporarily spikes above the highest high of the past 20 bars.
- The candle closes back below that high (indicating a fake breakout).
- (Optional) OBV confirmation supports bearish momentum.
Stop Loss Logic
---------------
- Instead of using the signal candle's low/high, the strategy references the previous
candle's wick.
- A stop is triggered if price moves 2% beyond the previous candle's low (for long) or
high (for short).
- This stop condition must occur within the next 5 candles after entry.
Take-Profit Conditions
----------------------
- For long trades: the strategy exits the position if price reaches the most recent pivot
high.
- For short trades: it exits once the most recent pivot low is hit.
Visual Feedback
---------------
- The chart displays entry points with up/down triangles.
- Exit points (either by stop or profit target) are marked with small X symbols.
Customization
-------------
The strategy includes adjustable parameters for:
- Lookback period (default: 20 bars)
- Use of OBV confirmation
- Pivot sensitivity (number of candles used to define swing highs/lows)
- Maximum number of candles to allow for stop condition (default: 5)
This strategy is well-suited for traders looking to exploit fake-out scenarios in
range-bound or overly stretched markets,
with clear stop and profit mechanisms built around recent price structure
In den Scripts nach "swing high low" suchen
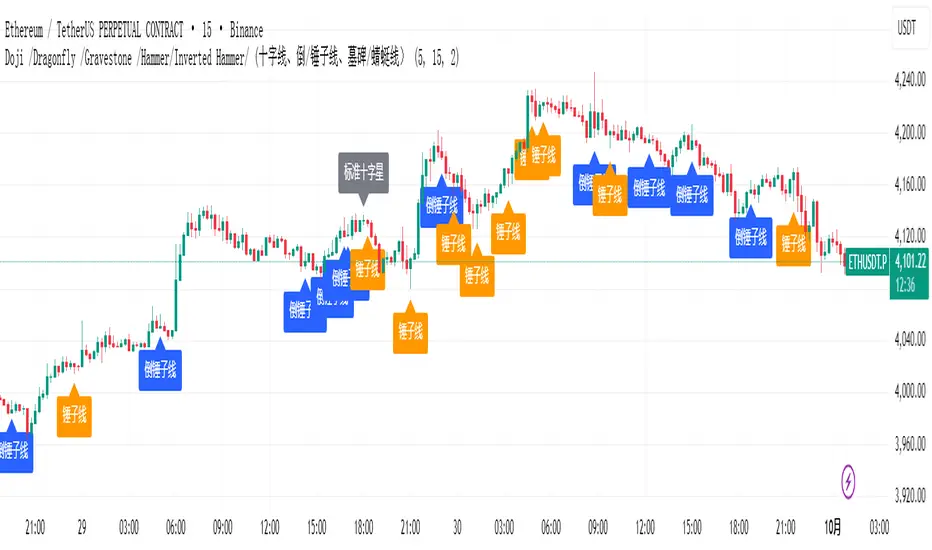
Doji /Dragonfly /Gravestone /Hammer/Inverted Hammer/ ## 策略介绍
量子K线形态识别引擎是一款基于高级模式识别算法的专业K线形态检测工具,专门用于精准识别锤子线、倒锤子线及各类十字星等关键反转形态,为交易者提供可靠的市场转折信号。
## 核心算法原理
### 智能形态量化分析
系统通过量子级几何关系计算,精确测量K线的实体比例、影线长度和相对位置,实现传统K线形态的数字化和标准化识别。
### 多维度形态验证
采用多重参数阈值验证机制,确保每个识别出的形态都符合严格的技术定义,避免主观判断导致的误识别。
## 实战应用指南
### 图表分析方法
**📊 关键反转形态识别**
锤子线特征:
→ 长下影线,短实体或没有实体
→ 出现在下降趋势底部
→ 下影线至少是实体长度的2倍
倒锤子线特征:
→ 长上影线,短实体
→ 出现在下降趋势底部
→ 上影线至少是实体长度的2倍
十字星家族:
标准十字星:上下影线接近相等,实体极小
蜻蜓十字:长下影线,几乎没有上影线
墓碑十字:长上影线,几乎没有下影线
**🎯 交易信号解读**
- **锤子线/蜻蜓十字**:潜在底部反转信号,考虑做多机会
- **倒锤子线/墓碑十字**:潜在顶部反转信号,考虑做空机会
- **标准十字星**:市场犹豫不决,可能预示趋势转折
### 交易决策流程
**反转交易策略**
1. 在明确趋势中发现反转形态
2. 等待形态确认后的入场信号
3. 将形态极端点作为止损参考
4. 目标看向前一个摆动高低点
**确认验证方法**
```pinescript
高可靠性形态特征:
1. 形态出现在关键支撑阻力位
2. 伴随成交量放大确认
3. 多个时间框架出现共振信号
4. 后续K线确认反转动力
策略优势
✅ 精准的形态识别算法,避免主观误判
✅ 实时的视觉标签提示,快速定位关键K线
✅ 完整的形态分类体系,覆盖主要反转信号
✅ 严格的技术标准验证,确保信号质量
## 策略介绍内容(英文)
```markoding
## Strategy Introduction
The Quantum Candlestick Pattern Recognition Engine is a professional candlestick pattern detection tool based on advanced pattern recognition algorithms, specifically designed to accurately identify key reversal patterns such as Hammers, Inverted Hammers, and various Doji formations, providing traders with reliable market turning signals.
## Core Algorithm Principle
### Intelligent Pattern Quantitative Analysis
The system uses quantum-level geometric relationship calculations to precisely measure candle body ratios, shadow lengths, and relative positions, achieving digital and standardized recognition of traditional candlestick patterns.
### Multi-Dimensional Pattern Verification
Employs multiple parameter threshold verification mechanisms to ensure each identified pattern meets strict technical definitions, avoiding misidentification due to subjective judgment.
## Practical Application Guide
### Chart Analysis Method
**📊 Key Reversal Pattern Identification**
Hammer Characteristics:
→ Long lower shadow, short or no body
→ Appears at bottom of downtrend
→ Lower shadow at least 2 times body length
Inverted Hammer Characteristics:
→ Long upper shadow, short body
→ Appears at bottom of downtrend
→ Upper shadow at least 2 times body length
Doji Family:
Standard Doji: Nearly equal upper/lower shadows, minimal body
Dragonfly Doji: Long lower shadow, almost no upper shadow
Gravestone Doji: Long upper shadow, almost no lower shadow
**🎯 Trading Signal Interpretation**
- **Hammer/Dragonfly Doji**: Potential bottom reversal signal, consider long opportunities
- **Inverted Hammer/Gravestone Doji**: Potential top reversal signal, consider short opportunities
- **Standard Doji**: Market indecision, may indicate trend reversal
### Trading Decision Process
**Reversal Trading Strategy**
1. Identify reversal patterns within clear trends
2. Wait for confirmation signals after pattern formation
3. Use pattern extremes as stop-loss references
4. Target previous swing highs/lows
**Confirmation Validation Method**
```pinescript
High-reliability pattern characteristics:
1. Pattern appears at key support/resistance levels
2. Confirmed with volume expansion
3. Multiple timeframe resonance signals
4. Subsequent candles confirm reversal momentum
Strategy Advantages
✅ Accurate pattern recognition algorithms avoid subjective misjudgment
✅ Real-time visual label prompts quickly locate key candles
✅ Complete pattern classification system covers major reversal signals
✅ Strict technical standard verification ensures signal quality
ScalpDaddyPREMIUM OPTIONS TRADING, PRESENTS:
ScalpDaddy, is a visual toolkit that helps you see where price is likely to react: liquidity pools, market structure shifts, daily/premarket levels, Fibonacci retracements/targets, and a compact multi‑timeframe status table.
It is designed for discretionary traders. Use it to plan, not to predict. No signals are “buy/sell”; they’re context.
Quick Start
Add to chart → keep defaults.
Watch the MTF table on the right: it tells you which timeframes are sitting in buy‑side (“BSL”), sell‑side (“SSL”), or both liquidity areas.
Turn on “Fibonacci Levels” and “Levels: Day & Premarket” to frame the day.
Wait for price to interact with a level (liquidity box, PMH/PML/HOD/LOD, or Fibonacci zone), then use your own trade plan for entries/exits.
Set alerts only after you’ve chosen the timeframes and features you care about (see Alerts).
What You’ll See
Liquidity Pools (boxes): Areas around clustered swing highs/lows where stops often sit. Boxes expand to the right until fully broken. Gray = inactive/hidden, colored = active. When broken, they can fade or recolor (your choice).
Market Structure (MSS/BOS): Optional labels and dotted lines to show shifts and break‑of‑structure. Useful for trend context and anchoring Fibs.
Day & Premarket Levels: Lines for PMH/PML and the official daily HOD/LOD (today, previous day, and optional 2nd previous). Labels like “PMH”, “HOD” keep it beginner‑friendly. Note: these levels intentionally show on minute charts up to 4h to avoid clutter.
Fibonacci Suite: Auto‑anchors from market structure or ZigZag swings, plus simple “Today Range” and “Previous Day Range” modes. Plots key retracements (38/50/62 highlighted) and optional targets. OTE zone (62–78.6) can be softly shaded for clarity. You can overlay a higher‑timeframe Fib for confluence.
MTF Liquidity + Momentum Table: Eight rows (customizable timeframes). Each row shows:
Liquidity status: BSL, SSL, or Both (price touching/straddling that TF’s pool/line).
RSI/ADX heat cell: a simple emoji/colour cue for momentum and stretch on that TF.
How To Use It (Beginner‑Friendly Flow)
Frame the Session
Turn on “Levels: Day & Premarket”. PMH/PML and HOD/LOD give you clean reference lines for the session narrative.
If you trade US stocks, keep Premarket Session at 04:00–09:30 (exchange time). Adjust if your venue differs.
Read the Table
Look for clusters: several lower TFs all showing SSL (for dip‑buy setups) or BSL (for fade setups). “Both” means price is straddling both sides and may be choppy—slow down there.
Use the RSI/ADX cell as a nudge, not a command. “Heat” hints where momentum is; warnings hint at potential exhaustion or churn.
Add Fibonacci Context
Start with “Auto (MSS)” so anchors follow structure. If swings feel too small/too big, try “ZigZag” or the Day/Prev Day options.
The OTE shade highlights the classic pullback area. Targets can help you plan partials.
Optional: turn on “Show Secondary Anchor” with a higher TF to see confluence.
Focus Your Chart
Leave “History Mode” on “Present” for speed; switch to “Full History” only when you need a full backtest view.
If the chart looks busy, hide labels first, then reduce which modules are shown.
Alerts
Built‑in Conditions (set from TradingView’s Alerts panel):
“BSL touch (any timeframe)” and “SSL touch (any timeframe)” fire when any selected TF in the table touches its pool/line.
“Fibonacci touch” fires when price reaches one of your plotted Fib levels within your chosen tolerance.
Direction Filter
“Bullish Only” focuses on sell‑side liquidity touches (SSL) that can fuel upward moves.
“Bearish Only” focuses on buy‑side liquidity touches (BSL) that can fuel downward moves.
Tips
Pick your timeframes first, then create the alert.
If you want stricter Fib alerts, lower the “Alert Tolerance %”. Choose “Close” vs “High/Low Range” depending on how strict you are about confirmation.
Key Settings To Tweak
History Mode: “Present” = faster and draws recent context; “Full History” = full chart.
Liquidity
“Show Broken Pools/Lines” to keep invalidated pools visible in a different colour, or hide them to reduce noise.
“# Visible Liq. boxes” limits clutter in one direction.
Day & Premarket Levels
“Use Group Colors” for a clean palette, or customize each line colour.
Line Style/Width/Extend to fit your chart theme.
Fibonacci Levels
Anchor Mode: Auto (structure), ZigZag, Today Range, or Previous Day Range.
“Min Leg Size (ATR multiples)” filters out tiny swings so your Fib doesn’t keep redrawing on noise.
“Highlight Levels Inside Liquidity Pools” thickens lines that overlap a live pool—easy confluence.
“Day Bias ATR Cushion” gently widens the day’s mid‑zone so bias doesn’t flip on tiny moves.
MTF Liquidity Alerts
Choose your 8 timeframes, how many zones to keep visible per TF, and whether touches use Close only or the full bar range.
Troubleshooting
“I don’t see PMH/PML or HOD/LOD.” Use minute charts up to 240 min (4h). Levels are intentionally limited to those to keep charts clean and fast.
“My chart feels slow.” Keep History Mode = Present, reduce visible liquidity boxes, and hide labels you don’t need.
“Fibonacci keeps moving.” Increase “Min Leg Size (ATR)” or use the Day/Prev Day anchor modes for steadier legs.
Good Practices
Plan first, execute second: wait for the candle close on your chosen TF if you want confirmation.
Confluence beats single‑signal: pool + day level + Fib + acceptable momentum is better than any one alone.
Record and review: keep screenshots and notes; small tweaks to tolerance and visibility can meaningfully improve clarity.
Notes & Limits
The tool avoids look‑ahead and uses confirmed data where appropriate, but anything based on live bars can update as a bar forms.
Max lookback is limited for performance; very old lines may be trimmed automatically.
Works across markets; premarket session times are exchange‑based—adjust for your venue.
Disclaimer
For education only. Not financial advice. Markets carry risk. You are responsible for your trades and settings.

VWAP Confluência 3x VWAP Confluence 3x — Daily · Weekly · Anchored
Purpose
A pragmatic VWAP suite for execution and risk management. It plots three institutional reference lines: Daily VWAP, Weekly VWAP, and an Anchored VWAP (AVWAP) starting from a user-defined event (news, earnings, session open, swing high/low).
Why it matters
VWAP is the market’s “fair price” weighted by where volume actually traded. Confluence across timeframes and events turns noisy charts into actionable bias and clean levels.
What it does
Daily VWAP — resets each trading day; intraday “fair value.”
Weekly VWAP — resets each week; swing context and larger player defense.
Anchored VWAP — starts at a precise timestamp you set (e.g., news release).
Price source toggle — Typical Price
(
𝐻
+
𝐿
+
𝐶
)
/
3
(H+L+C)/3 or Close.
Visibility switches — enable/disable each line independently.
Anchor marker — labels the first bar of the AVWAP.
Inputs
Show Daily VWAP (on/off)
Show Weekly VWAP (on/off)
Show Anchored VWAP (on/off)
Price Source: Typical (H+L+C)/3 or Close
Anchor Time: timestamp of your event (uses the chart/exchange timezone)
How to anchor to a news event
Find the exact release time as shown in your chart’s timezone.
Open the indicator settings → set Anchor Time to that minute.
The AVWAP begins at that bar and accumulates forward.
Playbook (examples, not signals)
Strong long bias: price above Daily and Weekly VWAP; AVWAP reclaimed after news.
Strong short bias: price below Daily and Weekly; AVWAP reject after news.
Mean-revert zones: price stretches far from the active VWAPs and snaps back; size around VWAP with tight risk.
Targets: opposite VWAP, prior day/week highs/lows, or liquidity pools near AVWAP.
Best used with
Session highs/lows, liquidity sweeps, volume profile, and time-of-day filters.
Notes & limitations
Works best on markets with reliable volume (equities, futures, liquid crypto). FX spot uses synthetic volume—interpret accordingly.
Anchor Time respects the chart’s timezone. Convert news times before setting.
This is an indicator, not a backtestable strategy. No trade advice.
Disclaimer
For educational purposes only. Trading involves risk. Do your own research and manage risk responsibly.

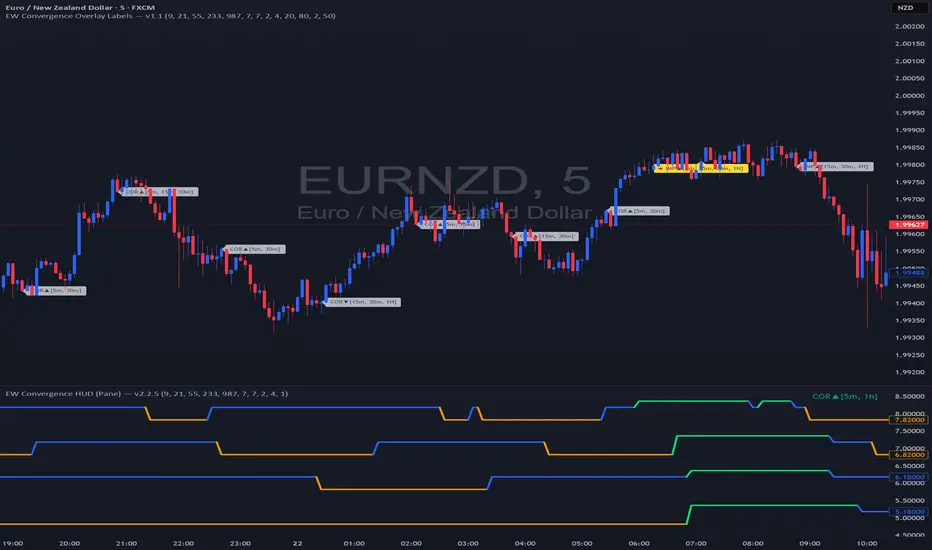
EW Convergence HUD (Pane) — v2.2.5📖 Description
The EW Convergence Suite is a dual-component Elliott-Wave inspired tool designed to help traders spot multi-timeframe convergence points — the places where waves across different timeframes terminate together and trend changes often ignite.
It contains two parts:
🔹 HUD (Pane)
Lives in the lower pane, one horizontal row per timeframe (1m → 1M).
Colors represent phase classification:
Lime = Impulse Up (+2)
Red = Impulse Down (−2)
Teal = Corrective Up (+1)
Orange = Corrective Down (−1)
Gray = Neutral/Unclear
Rows shift slightly up/down depending on impulse vs. corrective, so you can see transitions as diagonal “jumps.”
HUD ticker (top-right) shows current convergence state:
Example: IMP▲ = impulse up alignment on 3 TFs.
Example: ★ COR▼ = 4 TF corrective down alignment (special event).
🔹 Overlay Labels (on price chart)
Prints labels directly on the chart when convergence events meet your thresholds.
Shows which phases and which TFs are aligned at that moment.
Optional pivot confirmation:
Early mode → labels fire as soon as TFs align (onlyOnPivot=false).
Confirmed mode → labels fire only when convergence + a fresh pivot confirmation occur (onlyOnPivot=true + pivot lines on).
Can also draw multi-TF pivot lines to visually connect swing highs/lows across your chosen timeframes.
⚙️ Inputs & Customization
Timeframe Toggles → select which TFs to include in the convergence counts.
EMA Trend Stack (9/21/55/233/987 by default) → defines trend alignment for impulse vs. corrective classification.
Pivot left/right → sensitivity of swing highs/lows (2/2 = fast, 5/5 = smoother, 10/10+ = major swings).
MinN / SpecialN → thresholds for convergence events (regular vs. ★ special highlight).
Label Controls →
Only on pivot confirmations
Only on confirmed bars
Only when content changes
Minimum bar gap between labels
Wave Line Controls → toggle pivot-connecting lines per TF, with adjustable opacity and max lines stored.
🎯 How to Use
Scan the HUD for clusters of rows with the same color/phase. Flat plateaus across multiple TFs = strong alignment.
Wait for convergence counts (MinN or SpecialN) to be reached. HUD ticker will show IMP▲ or COR▼ with the TF list.
Watch the Overlay Labels on the price chart for where that convergence “hits” — optionally tied to fresh pivot confirmations.
Best practice:
Use lower TFs (1m/5m/15m) as entry triggers.
Use higher TFs (1h/4h/1D) as bias anchors.
Look for termination zones where both HUD alignment and Overlay labels agree.
🔑 Why it works
This indicator combines objective pivot detection with EMA-based trend structure to classify legs as impulsive or corrective. By watching multiple TFs simultaneously, it highlights the rare and powerful moments where waves across scales converge. These are often the cleanest points for entry, exit, or scaling.
Impulse convergence → continuation or breakout potential.
Corrective convergence → likely end of a pullback and resumption of higher-TF trend.
Pivot-gated mode → confirmation that the move is not just alignment, but a structural turn.
✅ Notes
This script does not attempt to count Elliott Waves strictly (1-2-3-4-5, A-B-C). Instead it provides a framework for convergence and context, letting you apply your own EW interpretation on top.
Works best when combined with your own risk management rules (stops, partials, capital buffer).
Default EMAs (9/21/55/233/987) and pivot lookbacks (3/3) are optimized for intraday trading; adjust for your style (scalp, swing, position).
⚡ Bottom line:
The EW Convergence Suite is like having a multi-timeframe radar + price-level marker that alerts you when Elliott-style phases across several TFs line up. It cuts through noise and helps you focus on the moments of real structural confluence.

Structure From Start – MTF (body-close BOS)Displays higher-timeframe market structure from a chosen start date using body-close BOS logic, with trend state, guard levels, and BOS markers plotted on your current chart.
Multi-Timeframe Market Structure with Body-Close BOS Logic
This indicator tracks market structure from a chosen start date on a higher-timeframe (HTF) of your choice, then displays it on your current chart for intraday context.
It detects swing highs/lows using pivot logic, confirms Break of Structure (BOS) only when a candle closes beyond the swing level (body-close rule), and maintains the “valid swing” level that invalidates the current bias.
Key Features:
• Works on any HTF you select (e.g., H1, H4) while you operate on lower TFs like M5 or M1.
• Start reading structure from any date/time you choose for focused backtesting or scenario analysis.
• Highlights trend state (long/short/neutral) with background colors.
• Plots the active “guard” level (valid swing high/low) that would flip bias if broken.
• Marks BOS events directly on your trading TF, updating only when the HTF candle closes.
Ideal for combining a clear higher-timeframe bias with lower-timeframe execution, without manually tracking HTF structure changes during live markets.

Hann Window FIR Filter Ribbon [BigBeluga]🔵 OVERVIEW
The Hann Window FIR Filter Ribbon is a trend-following visualization tool based on a family of FIR filters using the Hann window function. It plots a smooth and dynamic ribbon formed by six Hann filters of progressively increasing length. Gradient coloring and filled bands reveal trend direction and compression/expansion behavior. When short-term trend shifts occur (via filter crossover), it automatically anchors visual support/resistance zones at the nearest swing highs or lows.
🔵 CONCEPTS
Hann FIR Filter: A finite impulse response filter that uses a Hann (cosine-based) window for weighting past price values, resulting in a non-lag, ultra-smooth output.
hannFilter(length)=>
var float hann = na // Final filter output
float filt = 0
float coef = 0
for i = 1 to length
weight = 1 - math.cos(2 * math.pi * i / (length + 1))
filt += price * weight
coef += weight
hann := coef != 0 ? filt / coef : na
Ribbon Stack: The indicator plots 6 Hann FIR filters with increasing lengths, creating a smooth "ribbon" that adapts to price shifts and visually encodes volatility.
Gradient Coloring: Line colors and fill opacity between layers are dynamically adjusted based on the distance between the filters, showing momentum expansion or contraction.
Dynamic Swing Zones: When the shortest filter crosses its nearest neighbor, a swing high/low is located, and a triangle-style level is anchored and projected to the right.
Self-Extending Levels: These dynamic levels persist and extend until invalidated or replaced by a new opposite trend break.
🔵 FEATURES
Plots 6 Hann FIR filters with increasing lengths (controlled by Ribbon Size input).
Automatically colors each filter and the fill between them with smooth gradient transitions.
Detects trend shifts via filter crossover and anchors visual resistance (red) or support (green) zones.
Support/resistance zones are triangle-style bands built around recent swing highs/lows.
Levels auto-extend right and adapt in real time until invalidated by price action.
Ribbon responds smoothly to price and shows contraction or expansion behavior clearly.
No lag in crossover detection thanks to FIR architecture.
Adjustable sensitivity via Length and Ribbon Size inputs.
🔵 HOW TO USE
Use the ribbon gradient as a visual trend strength and smooth direction cue.
Watch for crossover of shortest filters as early trend change signals.
Monitor support/resistance zones as potential high-probability reaction points.
Combine with other tools like momentum or volume to confirm trend breaks.
Adjust ribbon thickness and length to suit your trading timeframe and volatility preference.
🔵 CONCLUSION
Hann Window FIR Filter Ribbon blends digital signal processing with trading logic to deliver a visually refined, non-lagging trend tool. The adaptive ribbon offers insight into momentum compression and release, while swing-based levels give structure to potential reversals. Ideal for traders who seek smooth trend detection with intelligent, auto-adaptive zone plotting.

CVD Divergence & Volume ProfileThis Pine Script indicator, named "CVD Divergence & Volume Profile," is designed to identify potential trading opportunities by combining Cumulative Volume Delta (CVD) divergence with Volume Profile levels and an optional Simple Moving Average (SMA) trend filter. It plots signals directly on the price chart.
Here's a breakdown of what each component does and how to potentially trade with it:
1. Cumulative Volume Delta (CVD) Divergence
What it does: CVD measures the cumulative difference between buying and selling volume. A rising CVD indicates more buying pressure, while a falling CVD indicates more selling pressure. Divergence occurs when the price action contradicts the CVD's direction, suggesting a potential shift in momentum or trend reversal.
Bearish Divergence: The price makes a higher high, but the CVD makes a lower high (or fails to make a new high). This suggests that despite the price increasing, the underlying buying pressure is weakening.
Bullish Divergence: The price makes a lower low, but the CVD makes a higher low (or fails to make a new low). This suggests that despite the price decreasing, the underlying selling pressure is weakening.
Visualization:
Red triangle pointing down on the chart indicates a Bearish Divergence signal.
Green triangle pointing up on the chart indicates a Bullish Divergence signal.
2. Volume Profile Levels (VAH, VAL, POC)
What it does: The indicator calculates simplified Volume Profile levels over a user-defined vp_range (number of candles). These levels represent areas where significant trading activity has occurred:
VAH (Value Area High): The upper boundary of the "Value Area," where 70% of the volume traded.
VAL (Value Area Low): The lower boundary of the "Value Area," where 70% of the volume traded.
POC (Point of Control): The price level within the vp_range where the most volume was traded.
Significance: These levels often act as significant support and resistance zones.
Visualization:
Orange lines for VAH and VAL.
Yellow line for POC.
Zone Proximity (zone_thresh): The indicator only generates divergence signals if the current close price is within a specified percentage zone_thresh of either VAH, VAL, or POC. This filters signals to areas of high liquidity and potential turning points.
3. Trend Filter (SMA)
What it does: This is an optional filter (use_trend_filter) that uses a Simple Moving Average (sma_period, default 200).
Significance: It helps ensure that divergence signals are traded in alignment with the broader market trend, potentially increasing their reliability.
For long signals (bullish divergence), the price (close) must be above the SMA (indicating an uptrend).
For short signals (bearish divergence), the price (close) must be below the SMA (indicating a downtrend).
Visualization: A blue line on the chart representing the SMA.
How to Trade with It (Potential Strategies)
The indicator aims to provide high-probability entry points by combining multiple confirming factors. Here's how you might interpret and trade the signals:
Identify Divergence: Look for the triangle signals on your chart (red for bearish, green for bullish).
Confirm Proximity to Volume Profile Levels: The signal itself confirms that the price is near a significant Volume Profile level (VAH, VAL, or POC). These are areas where price often reacts.
Bullish Signal (Green Triangle): This suggests buying momentum is returning after a price decline, especially when the price is near VAL or POC, which might act as support.
Bearish Signal (Red Triangle): This suggests selling momentum is increasing after a price rally, especially when the price is near VAH or POC, which might act as resistance.
Check Trend Alignment (SMA Filter):
For a long trade: You would ideally want to see a green triangle (bullish divergence) while the price is above the blue SMA line. This indicates a bullish divergence confirming a potential bounce within an existing uptrend.
For a short trade: You would ideally want to see a red triangle (bearish divergence) while the price is below the blue SMA line. This indicates a bearish divergence confirming a potential rejection within an existing downtrend.
Entry and Exit Considerations:
Entry: Consider entering a trade on the candle where the signal appears, or on the subsequent candle for confirmation.
Stop Loss: For a long trade, a logical stop-loss could be placed below the lowest point of the divergence, or below the VAL/POC if the signal occurred near it. For a short trade, above the highest point of the divergence or VAH/POC.
Take Profit: Targets could be set at the opposite Volume Profile level, previous swing highs/lows, or using a fixed risk-reward ratio.
Example Trading Scenario:
Long Trade: You see a green triangle (bullish divergence) printed on the chart. You notice the price is currently at the VAL (orange line). You check the blue SMA line and confirm that the price is above it (uptrend). This confluence of factors (bullish divergence, support at VAL, and uptrend) provides a strong potential long entry signal. You might enter, place your stop loss just below VAL, and target VAH or the next resistance level.
Short Trade: You see a red triangle (bearish divergence). The price is at the VAH (orange line). The price is also below the blue SMA line (downtrend). This suggests a potential short entry. You might enter, place your stop loss just above VAH, and target VAL or the next support level.

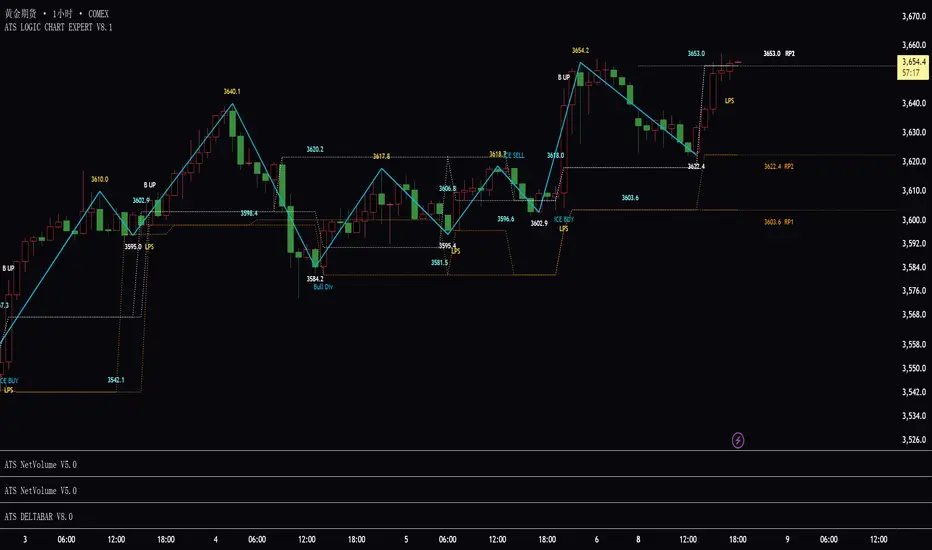
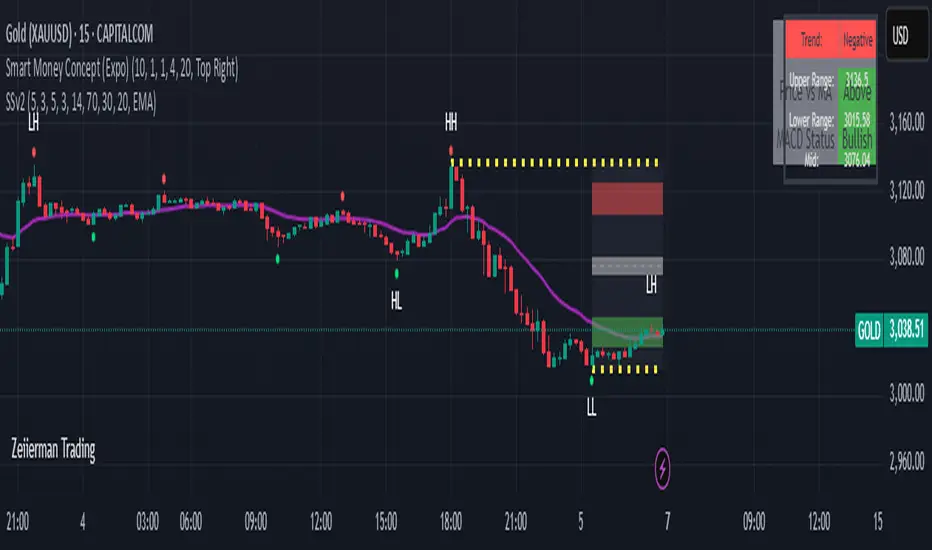
ATS LOGIC CHART EXPERT V5.0### **ATS Logic Chart Expert V5.0**
#### **Wyckoff-Inspired Automated Trend & Structure Analysis Tool**
---
### **🔹 Overview**
**ATS Logic Chart Expert V5.0** is an advanced Wyckoff-based charting indicator designed for automated trend analysis, support/resistance mapping, and breakout signal generation. It intelligently plots key price structure lines and identifies high-probability reversal signals using the Wyckoff accumulation/distribution model (LPS/LPSY), making it ideal for both swing traders and trend followers.
---
### **🔹 Key Features**
#### **1️⃣ Automated Price Structure Lines**
- **Smart detection of swing highs/lows** with auto-plotting of critical support/resistance
- **White Dashed Line (Resistance)** – Formed by prior downtrends, marks potential breakout zones
- **Red Dashed Line (Support)** – Derived from uptrends, signals breakdown risks
- **Up/Down Triangle Markers** – Highlight key pivot points for manual S/R refinement
#### **2️⃣ Wyckoff LPS/LPSY Signal Engine**
| **Signal** | **Trigger Condition** | **Market Implication** |
|------------|----------------------|-----------------------|
| **LPS (Last Point of Support)** | Break above white resistance (confirms accumulation) | Bullish trend initiation |
| **CVG LPS (Covered LPS)** | Retest & second breakout | Stronger bullish confirmation |
| **LPSY (Last Point of Supply)** | Breakdown below red support (confirms distribution) | Bearish trend initiation |
| **CVG LPSY (Covered LPSY)** | Pullback & second breakdown | Stronger bearish confirmation |
#### **3️⃣ Breakout Signals (BK1/SK1)**
- **BK1 (Breakout 1)** – First close above white resistance, early long opportunity
- **SK1 (Short Kill 1)** – First close below red support, early short opportunity
- **Optimized for momentum traders** to capture initial trend acceleration
---
### **🔹 Signal Logic Deep Dive**
#### **📈 Bullish Scenario (LPS / BK1)**
1. **Accumulation Phase**: Price consolidates near lows, forming a base
2. **Breakout**: Price breaches white resistance → triggers **LPS** or **BK1**
3. **Retest Reinforcement**: Successful retest & rebound → confirms **CVG LPS**
#### **📉 Bearish Scenario (LPSY / SK1)**
1. **Distribution Phase**: Price churns near highs, creating topping patterns
2. **Breakdown**: Price cracks red support → triggers **LPSY** or **SK1**
3. **Pullback Reinforcement**: Failed rebound → confirms **CVG LPSY**
---
### **🔹 Practical Applications**
✅ **Trend Trading**: Ride LPS/LPSY-confirmed trends
✅ **Reversal Trading**: Fade extremes with BK1/SK1 early alerts
✅ **S/R Trading**: Use auto-plotted lines for limit orders
---
### **🔹 Customization Tips**
- **Adjust sensitivity**: Modify swing point detection periods per asset volatility
- **Signal filters**: Combine with moving averages/volume for fewer false breaks
---
### **🔹 Conclusion**
**ATS Logic Chart Expert V5.0** delivers:
- **Hands-free structure mapping** (no manual drawing)
- **Institutional-grade reversal signals** (Wyckoff LPS/LPSY)
- **First-mover advantage** (BK1/SK1 early entries)
> ⚠️ **Risk Note**: Always use stop-losses. Backtest for optimal settings in ranging markets.
---
**Ideal For**:
• Wyckoff method practitioners
• Price action traders
• Breakout strategy enthusiasts
Order Block with BoSHere’s a professional and concise description you can use for publishing your **TradingView script** titled **"Order Block with BoS"**:
---
### 📌 **Description for TradingView Publication:**
**"Order Block with Break of Structure (BoS)"** is a powerful price action-based indicator designed to identify potential reversal zones and momentum shifts using **Order Block** detection combined with **Break of Structure (BoS)** confirmation.
### 🔍 **Key Features:**
* **Order Block Detection**: Highlights bullish and bearish order blocks using precise candle structure logic.
* **Break of Structure (BoS)**: Confirms structural breaks above swing highs or below swing lows to validate potential trend continuation or reversal.
* **Dynamic ATR Filter**: Uses a 14-period ATR with dynamic thresholds to confirm significant moves, filtering out weak breakouts.
* **Visual Aids**:
* Color-coded **boxes** to mark detected Order Blocks.
* **Arrows** at BoS confirmation points when ATR confirms strong momentum.
* Optional **dashed BoS lines** to show where price broke structure.
### ⚙️ **Customizable Inputs**:
* `Swing Length`: Defines the sensitivity of swing high/low detection.
* `Show Break of Structure`: Toggle on/off BoS confirmation lines.
* `Candle Lookback`: Number of historical candles to consider.
This indicator is ideal for traders who incorporate **smart money concepts**, **market structure analysis**, or **institutional order flow** strategies.
---
Would you like me to help write the **strategy** version of this or translate the description into another language for international audiences?

Fractal Wave MarkerFractal Wave Marker is an indicator that processes relative extremes of fluctuating prices within 2 periodical aspects. The special labeling system detects and visually marks multi-scale turning points, letting you visualize fractal echoes within unfolding cycles dynamically.
What This Indicator Does
Identifies major and minor swing highs/lows based on adjustable period.
Uses Phi in power exponent to compute a higher-degree swing filter.
Labels of higher degree appear only after confirmed base swings — no phantom levels, no hindsight bias. What you see is what the market has validated.
Swing points unfold in a structured, alternating rhythm . No two consecutive pivots share the same hierarchical degree!
Inspired by the Fractal Market Hypothesis, this script visualizes the principle that market behavior repeats across time scales, revealing structured narrative of "random walk". This inherent sequencing ensures fractal consistency across timeframes. "Fractal echoes" demonstrate how smaller price swings can proportionally mirror larger ones in both structure and timing, allowing traders to anticipate movements by recursive patterns. Cycle Transitions highlight critical inflection points where minor pivots flip polarity such as a series of lower highs progress into higher highs—signaling the birth of a new macro trend. A dense dense clusters of swing points can indicate Liquidity Zones, acting as footprints of institutional accumulation or distribution where price action validates supply and demand imbalances.
Visualization of nested cycles within macro trend anchors - a main feature specifically designed for the chartists who prioritize working with complex wave oscillations their analysis.

Sahid Strategy v2This script identifies potential buy/sell signals using:
Pivot Points - Detects swing highs/lows (price reversals)
Confirmation Filters - Reduces false signals using:
RSI (momentum)
Moving Average (trend direction)
Optional MACD (trend confirmation)
Key Features
Signal Type Trigger Conditions
BUY - Price makes a swing low (pivot)
Copy
- RSI ≤ 30 (oversold)
- Price above trend MA
- MACD bullish (optional) |
| SELL | - Price makes a swing high (pivot)
- RSI ≥ 70 (overbought)
- Price below trend MA
- MACD bearish (optional) |
Visual Signals
Green "BUY" labels below price bars
Red "SELL" labels above price bars
Purple trend line (20-period EMA/SMA)
Orange/blue circles showing raw pivot points
Optional Tools
Debug Table (top-right): Shows real-time:
RSI value
Price vs MA position
MACD status
Alerts - Triggers audible/visual notifications
Customization
Adjust in settings:
Pivot sensitivity (left/right bars)
RSI levels (30/70 by default)
MA type/length (20-period EMA/SMA)
Toggle MACD filter on/off
Best For: Swing trading in trending markets (1H-4H timeframes). Signals appear faster than classic pivot strategies but still require confirmation from other analysis tools.
Vmoon Trend TableVmoon Trend Table Indicator
The **Vmoon Trend Table Indicator** is a powerful tool designed for traders who want to track trends across multiple timeframes and identify key pivot points that signal trend changes. This indicator provides a visual representation of trends in different timeframes through a convenient table, which can be positioned either at the top or bottom of the chart. It is particularly useful for those who prefer trading with the trend and need to monitor higher timeframes for stronger signals.
#### Key Features:
1. **Multi-Timeframe Trend Detection**:
- The indicator analyzes up to four different timeframes simultaneously, allowing traders to observe trends from shorter to longer timeframes.
- The user can select which timeframes to monitor, making it adaptable to various trading strategies.
2. **Pivot Point Analysis**:
- The Vmoon Trend Table identifies trends based on pivot points, which are defined by higher highs and higher lows for uptrends, and lower highs and lower lows for downtrends.
- Users can customize the lookback period to define these pivot points, offering control over the sensitivity of trend detection.
- A choice between using the high/low or close price for pivot calculations is available, allowing further customization.
3. **Visual Representation**:
- The indicator provides a table showing the current trend direction (uptrend or downtrend) for each selected timeframe.
- Trends are visually indicated by up or down arrows, colored appropriately to represent bullish or bearish trends.
- The table can be positioned at the top or bottom of the chart, based on user preference.
4. **Support and Resistance Levels**:
- The indicator can display support and resistance lines based on the most recent swing high/low points for each timeframe.
- These lines help traders visualize critical levels where trends might change, enabling better decision-making.
5. **Historical Pivot Points**:
- Users can toggle the visibility of historical pivot points on the chart, aiding in the evaluation of trend consistency and the placement of these points.
6. **Optimized Performance**:
- The script is optimized to reduce the number of security calls, ensuring it runs efficiently even when tracking multiple timeframes.
- Revisions have focused on improving speed and allowing users to reposition the information table according to their needs.
#### How to Use:
1. **Set Timeframes**: Choose the timeframes that you want to monitor for trends. The indicator supports up to four different timeframes.
2. **Define Pivot Points**: Adjust the lookback period to define how pivot points (highs/lows) are calculated. Select whether to use high/low or close prices for this calculation.
3. **Monitor the Trend Table**: Observe the trend direction indicated in the table. Use this information to confirm the overall trend before making trading decisions.
4. **Watch Support/Resistance Levels**: If enabled, use the support and resistance levels drawn from higher timeframe pivots to anticipate potential trend reversals.
5. **Fine-Tune Settings**: Customize the indicator's display, such as repositioning the trend table, adjusting line widths, or changing colors, to fit your trading style.

Support and Resistance Signals MTF [LuxAlgo]The Support and Resistance Signals MTF indicator aims to identify undoubtedly one of the key concepts of technical analysis Support and Resistance Levels and more importantly, the script aims to capture and highlight major price action movements, such as Breakouts , Tests of the Zones , Retests of the Zones , and Rejections .
The script supports Multi-TimeFrame (MTF) functionality allowing users to analyze and observe the Support and Resistance Levels/Zones and their associated Signals from a higher timeframe perspective.
This script is an extended version of our previously published Support-and-Resistance-Levels-with-Breaks script from 2020.
Identification of key support and resistance levels/zones is an essential ingredient to successful technical analysis.
🔶 USAGE
Support and resistance are key concepts that help traders understand, analyze and act on chart patterns in the financial markets. Support describes a price level where a downtrend pauses due to demand for an asset increasing, while resistance refers to a level where an uptrend reverses as a sell-off happens.
The creation of support and resistance levels comes as a result of an initial imbalance of supply/demand, which forms what we know as a swing high or swing low. This script starts its processing using the swing highs/lows. Swing Highs/Lows are levels that many of the market participants use as a historical reference to place their trading orders (buy, sell, stop loss), as a result, those price levels potentially become and serve as key support and resistance levels.
One of the important features of the script is the signals it provides. The script follows the major price movements and highlights them on the chart.
🔹 Breakouts (non-repaint)
A breakout is a price moving outside a defined support or resistance level, the significance of the breakout can be measured by examining the volume. This script is not filtering them based on volume but provides volume information for the bar where the breakout takes place.
🔹 Retests
Retest is a case where the price action breaches a zone and then revisits the level breached.
🔹 Tests
Test is a case where the price action touches the support or resistance zones.
🔹 Rejections
Rejections are pin bar patterns with high trading volume.
Finally, Multi TimeFrame (MTF) functionality allows users to analyze and observe the Support and Resistance Levels/Zones and their associated Signals from a higher timeframe perspective.
🔶 SETTINGS
The script takes into account user-defined parameters to detect and highlight the zones, levels, and signals.
🔹 Support & Resistance Settings
Detection Timeframe: Set the indicator resolution, the users may examine higher timeframe detection on their chart timeframe.
Detection Length: Swing levels detection length
Check Previous Historical S&R Level: enables the script to check the previous historical levels.
🔹 Signals
Breakouts: Toggles the visibility of the Breakouts, enables customization of the color and the size of the visuals
Tests: Toggles the visibility of the Tests, enables customization of the color and the size of the visuals
Retests: Toggles the visibility of the Retests, enables customization of the color and the size of the visuals
Rejections: Toggles the visibility of the Rejections, enables customization of the color and the size of the visuals
🔹 Others
Sentiment Profile: Toggles the visibility of the Sentiment Profiles
Bullish Nodes: Color option for Bullish Nodes
Bearish Nodes: Color option for Bearish Nodes
🔶 RELATED SCRIPTS
Support-and-Resistance-Levels-with-Breaks
Buyside-Sellside-Liquidity
Liquidity-Levels-Voids

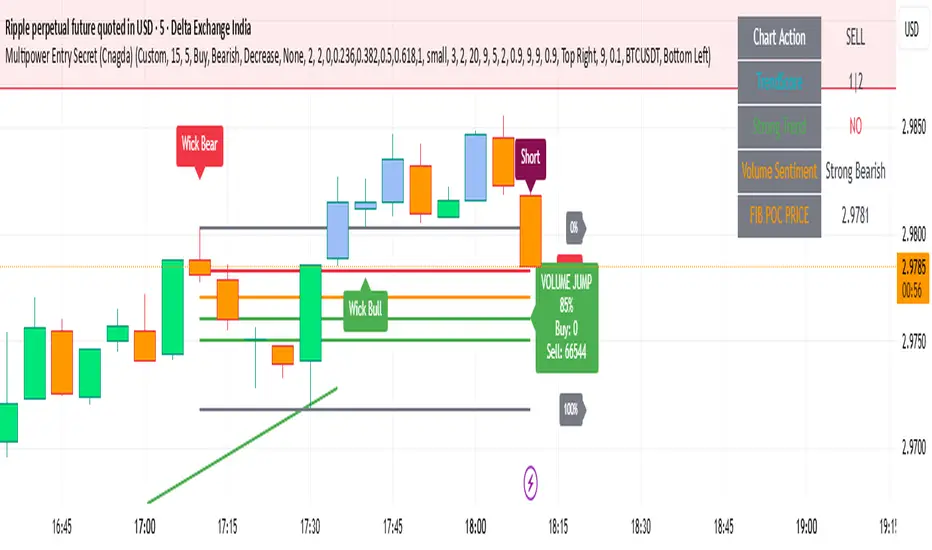
Multipower Entry SecretMultipower Entry Secret indicator is designed to be the ultimate trading companion for traders of all skill levels—especially those who struggle with decision-making due to unclear or overwhelming signals. Unlike conventional trading systems cluttered with too many lines and confusing alerts, this indicator provides a clear, adaptive, and actionable guide for market entries and exits.
Key Points:
Clear Buy/Sell/Wait Signals:
The script dynamically analyzes price action, candle patterns, volume, trend strength, and higher time frame context. This means it gives you “Buy,” “Sell,” or “Wait” signals based on real, meaningful market information—filtering out the noise and weak trades.
Multi-Timeframe Adaptive Analysis:
It synchronizes signals between higher and current timeframes, ensuring you get the most reliable direction—reducing the risk of getting caught in fake moves or sudden reversals.
Automatic Support, Resistance & Liquidity Zones:
Key levels like support, resistance, and liquidity zones are auto-detected and displayed directly on the chart, helping you make precise decisions without manual drawing.
Real-Time Dashboard:
All relevant information, such as trend strength, market intent, volume sentiment, and the reason behind each signal, is neatly summarized in a dashboard—making monitoring effortless and intuitive.
Customizable & Beginner-Friendly:
Whether you’re a newcomer wanting straightforward guidance or a professional needing advanced customization, the indicator offers flexible options to adjust analysis depth, timeframes, sensitivity, and more.
Visual & Clutter-Free:
The design ensures that your chart remains clean and readable, showing only the most important information. This minimizes mental overload and allows for instant decision-making.
Who Will Benefit?
Beginners who want to learn trading logic, avoid common traps, and see the exact reason behind every signal.
Advanced traders who require adaptive multi-timeframe analytics, fast execution, and stress-free monitoring.
Anyone who wants to save screen time, reduce analysis paralysis, and have more confidence in every trade they take.
1. No Indicator Clutter
Intent:
Many traders get confused by charts filled with too many indicators and signals. This often leads to hesitation, missed trades, or taking random, risky trades.
In this Indicator:
You get a clean and clutter-free chart. Only the most important buy/sell/wait signals and relevant support/resistance/liquidity levels are shown. These update automatically, removing the “overload” and keeping your focus sharp, so your decision-making is faster and stress-free.
2. Exact Entry Guide
Intent:
Traders often struggle with entry timing, leading to FOMO (fear of missing out) or getting trapped in sudden market reversals.
In this Indicator:
The system uses powerful adaptive logic to filter out weak signals and only highlight the strongest market moves. This not only prevents you from entering late or on noise, but also helps avoid losses from false breakouts or whipsaws. You get actionable suggestions—when to enter, when to hold back—so your entries are high-conviction and disciplined.
3. HTF+LTF Logic: Multitimeframe Sync Analysis
Intent:
Most losing trades happen when you act only on the short-term chart, ignoring the bigger market trend.
In this Indicator:
Signals are based on both the current chart timeframe (LTF) and a higher (HTF, like hourly/daily) timeframe. The indicator synchronizes trend direction, momentum, and structure across both levels, quickly adapting to show you when both are aligned. This filtering results in “only trade with the bigger trend”—dramatically increasing your win rate and market confidence.
4. Auto Support/Resistance & Liquidity Zones
Intent:
Drawing support/resistance and liquidity zones manually is time-consuming and error-prone, especially for beginners.
In this Indicator:
The system automatically identifies and plots the most crucial support/resistance levels and liquidity zones on your chart. This is based on adaptive, real-time price and volume analysis. These zones highlight where major institutional activity, trap setups, or real breakouts/reversals are most likely, removing guesswork and giving you a clear reference for entries, exits, and stop placements.
5. Clear Action/Direction
Intent:
Traders need certainty—what does the market want right now? Most indicators are vague.
In this Indicator:
Your dashboard always displays in plain words (like “BUY”, “SELL”, or “WAIT”) what action makes sense in the current market phase. Whether it’s a bull trap, volume spike, wick reversal, or exhaustion—it’s interpreted and explained clearly. No more confusion—just direct, real-time advice.
6. For Everyone (Beginner to Pro)
Intent:
Most advanced indicators are overwhelming for new traders; simple ones lack depth for professionals.
In this Indicator:
It is simple enough for a beginner—just add it to the chart and instantly see what action to consider. At the same time, it includes advanced adaptive analysis, multi-timeframe logic, and customizable settings so professional traders can fine-tune it for their strategies.
7. Ideal Usage and User Benefits
Instant Decision Support:
Whenever you’re unsure about a trade, just look at the indicator’s suggestion for clarity.
Entry Learning:
Beginners get real-time “practice” by not only seeing signals, but also the reason behind them—improving your chart reading and market understanding.
Screen Time & Stress Reduction:
Clear, relevant information only; no noise, less fatigue, faster decisions.
Makes Trading Confident & Simple:
The smart dashboard splits actionable levels (HTF, LTF, action) so you never miss a move, avoid traps, and stay aligned with high-probability trades.
8. Advanced Input Settings (Smart Customization)
Explained with Examples:
Enable Wick Analysis:
Finds candles with strong upper/lower wicks (signs of rejection/buying/selling force), alerting you to hidden reversals and protecting from FOMO entries.
Enable Absorption:
Detects when heavy order flow from one side is “absorbed” by the other (shows where institutional buyers/sellers are likely active, helps spot fake breakouts).
Enable Unusual Breakout:
Highlights real breakouts—large volatility plus high volume—so you catch genuine moves and avoid random spikes.
Enable Range/Expansion:
Smartly flags sudden range expansions—when the market goes from quiet to volatile—so you can act at the start of real trends.
Trend Bar Lookback:
Adjusts how many bars/candles are used in trend calculations. Short (fast trades, more signals), long (more reliability, fewer whipsaws).
Bull/Bear Bars for Strong Trend Min:
Sets how many candles in a row must support a trend before calling it “strong”—prevents flipping signals, keeps you disciplined.
Volume MA Length:
Lets you adjust how many bars back volume is averaged—fine-tune for your asset and trading style for best volume signals.
Swing Lookback Bars:
Set how many bars to use for swing high/low detection—short (quick swing levels), long (stronger support/resistance).
HTF (Bias Window):
Decide which higher timeframe the indicator should use for big-picture market mood. Adjustable for any style (scalp, swing, position).
Adaptive Lookback (HTF):
Choose how much HTF history is used for detecting major extremes/zones. Quick adjust for more/less sensitivity.
Show Support/Resistance, Liquidity Zones, Trendlines:
Toggle them on/off instantly per your needs—keeps your chart relevant and tailored.
9. Live Dashboard Sections Explained
Intent HTF:
Shows if the bigger timeframe currently has a Bullish, Bearish, or Neutral (“Chop”) intent, based on strict volume/price body calculations. Instant clarity—no more guessing on trend bias.
HTF Bias:
Clear message about which side (buy/sell/sideways) controls the market on the higher timeframe, so you always trade with the “big money.”
Chart Action:
The central action for the current bar—Whether to Buy, Sell, or Wait—calculated from all indicator logic, not just one rule.
TrendScore Long/Short:
See how many candles in your chosen window were bullish or bearish, at a glance. Instantly gauge market momentum.
Reason (WHY):
Every time a signal appears, the “reason” cell tells you the primary logic (breakout, wick, strong trend, etc.) behind it. Full transparency and learning—never trade blindly.
Strong Trend:
Shows if the market is currently in a powerful trend or not—helping you avoid choppy, risky entries.
HTF Vol/Body:
Displays current higher timeframe volume and candle body %—helping spot when big players are active for higher probability trades.
Volume Sentiment:
A real-time analysis of market psychology (strong bullish/bearish, neutral)—making your decision-making much more confident.
10. Smart and User-Friendly Design
Multi-timeframe Adaptive:
All calculations can now be drawn from your choice of higher or current timeframe, ensuring signals are filtered by larger market context.
Flexible Table Position:
You can set the live dashboard/summary anywhere on the chart for best visibility.
Refined Zone Visualization:
Liquidity and order blocks are visually highlighted, auto-tuning for your settings and always cleaning up to stay clutter-free.
Multi-Lingual & Beginner Accessible:
With Hindi and simple English support, descriptions and settings are accessible for a wide audience—anyone can start using powerful trading logic with zero language barrier.
Efficient Labels & Clear Reasoning:
Signal labels and reasons are shown/removed dynamically so your chart stays informative, not messy.
Every detail of this indicator is designed to make trading both simpler and smarter—helping you avoid the common pitfalls, learn real price action, stay in sync with the market’s true mood, and act with discipline for higher consistency and confidence.
This indicator makes professional-grade market analysis accessible to everyone. It’s your trusted assistant for making smarter, faster, and more profitable trading decisions—providing not just signals, but also the “why” behind every action. With auto-adaptive logic, clear visuals, and strong focus on real trading needs, it lets you focus on capturing the moves that matter—every single time.
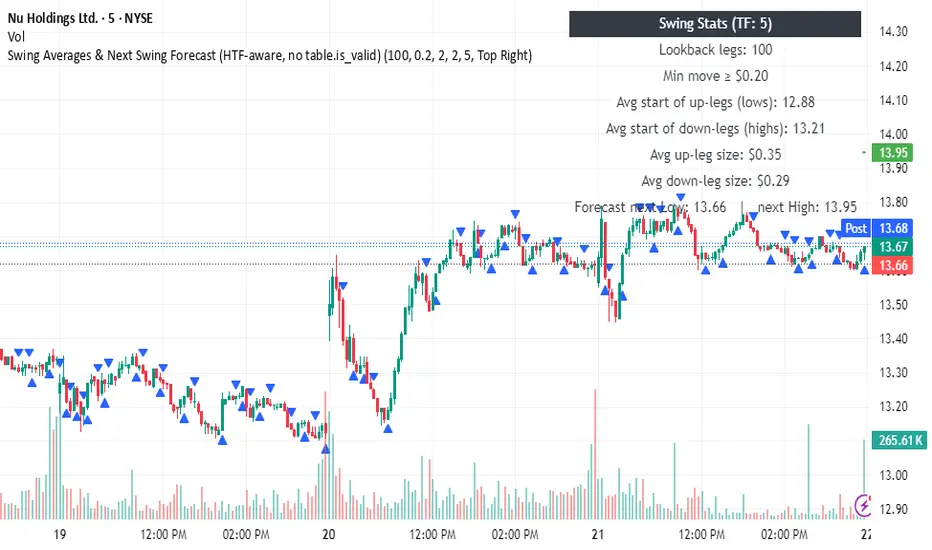
Swing Averages & Next Swing Forecast Swing Averages & Next Swing Forecast
What it does:
Finds confirmed swing highs/lows, keeps only “significant” legs (default ≥ $0.10), then computes average up/down leg sizes and projects the next swing low and next swing high. Optionally runs calculations on a higher timeframe (HTF) while plotting on your current chart.
Typical Sweeps: Pivot high/low boxes. Grade sweeps, Handles/PipsTool to show typical pip-grade/ handle-grade sweep distance above pivot highs and pivot lows
-In consolidation/ranging periods (i.e. most of the time); Highs/Lows may by swept by fairly consistent distances in typical stop raids.
-Idea is from ICT teaching on typical Pip-grade sweeps in FX (10,20,30pips). Designed to work on FX, Indices, Commodities, Bitcoin.
-Above chart shows S&P; sweeping below and then above by 5 handles.
///inputs///
~choose sweep distance handles ($) or pips: will auto-calculate depending on the asset: FX= pips; Indices/stocks/commodities = handles ($)
--(2,5,10,20,30,50,100, 500, 1000)
~choose pivot lookback: larger number for more significant swing highs/lows
~choose number of historical boxes to display
~toggle on/off Pivot high boxes and Pivot low boxes independently
~extend boxes fully to the right (default is not extend)
~toggle on/off text
~text & box formatting options
Bitcoin, hourly chart; Pivot lookback = 15; $100 sweep boxes:
Eur/Usd; 15m chart; Pivot lookback = 30; 10pip sweep boxes; Boxes extended fully to the right:

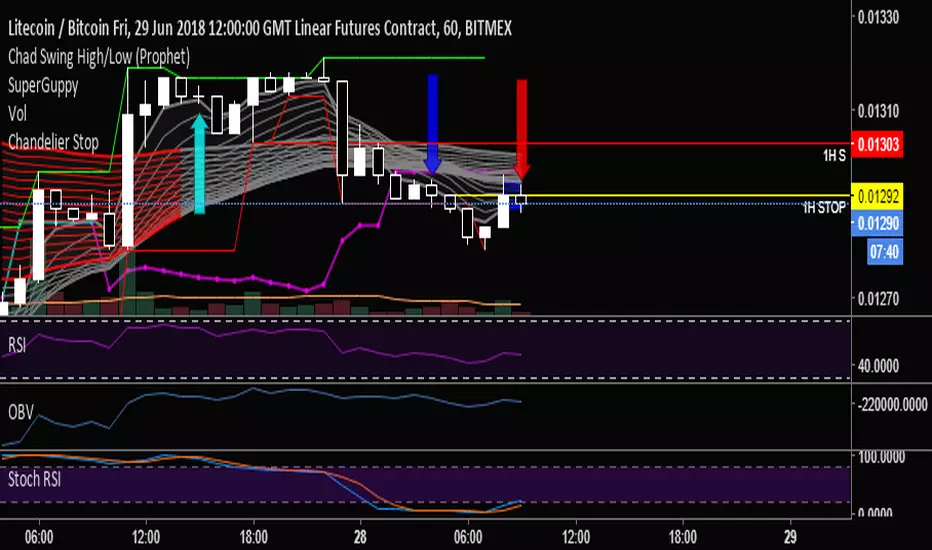
Chad Swing High/Low (Prophet)Marks swing highs and lows (e.g: a high with a lower high on either side), to simplify counting CBLs.
Colby Cheese VWAP Setup [v1.0]🧀 Colby Cheese VWAP Setup
A tribute to Colby’s structural clarity, refined for sniper-grade entries.
🧭 Strategy Overview
This setup blends CHoCH (Change of Character) detection with VWAP deviation bands, EMA stack bias, delta/CVD conviction, and FRVP-based entry zones. It’s designed for traders who value narratable structure, directional conviction, and modular clarity.
🔍 Core Modules
• CHoCH Detection: Identifies structural breaks using swing highs/lows from local or 3-minute feeds.
• VWAP Bands: Dynamic support/resistance zones based on VWAP ± standard deviation.
• EMA Stack Bias: Confirms directional bias using 13/35/50 EMA alignment.
• Delta/CVD Filter: Measures volume aggression and cumulative conviction.
• Strongest Imbalance Logic: Scores recent bars for directional strength using delta, CVD, and price change.
• Engulfing Confirmation (optional): Adds candle strength validation post-CHoCH.
• FRVP Entry Zones: Pullback entries based on recent range extremes—directionally aware.
• Visual Aids: CHoCH lines, candle coloring, entry labels, and optional stop loss markers.
🎯 Trade Logic
• Bullish CHoCH:
• Trigger: Price closes above last swing high
• Filters: Strong body, volume, delta, optional engulfing
• Bias: EMA stack bullish
• Entry: Pullback to bottom of FRVP range
• Visual: Green CHoCH line + “Enter” label
• Bearish CHoCH:
• Trigger: Price closes below last swing low
• Filters: Strong body, volume, delta, optional engulfing
• Bias: EMA stack bearish
• Entry: Pullback to top of FRVP range
• Visual: Red CHoCH line + “Enter” label
🛠 Notes for Overlay Builders
• All modules are toggleable for clarity and experimentation.
• CHoCH logic is atomic and timestamped—ideal for audit trails.
• FRVP zones are now directionally aware (thanks to David’s refinement).
• Imbalance scoring is reversible and narratable—perfect for diagnostic overlays.

CNagda Anchor2EntryCNagda Anchor2Entry Pine Script v6 overlay indicator pulls higher-timeframe (HTF) signal events to define anchor high/low levels and then projects visual entry labels on the lower-timeframe (LTF). It also draws auto-oriented Fibonacci retracement/extension levels for context, but it does not execute orders, stops, or targets—only visual guidance.
Inputs
Key inputs include Lookback Length for HTF scanning and a Signal Timeframe used with request.security to import HTF events onto the active chart.
Entry behavior can be set to “Confirm only” or “Wait candle,” trade side can be restricted to Buy/Sell/Both, and individual strategies (Buy WAIT/S1; Sell REV/S1/S2/S3) can be toggled.
HTF logic
The script defines WAIT/BUY setup and confirmation, SELL reversal on breaking the WAIT BUY low, and several volume/candle-based patterns (Sell S1/S2/S3, Buy S1).
It captures the associated highs/lows at those events with ta.valuewhen and imports them via request.security to form anchors (anc_hi/anc_lo) and “new trigger” booleans that gate label creation on the LTF.
Flip entries
When enabled, “Flip entries” generate contrarian labels based on breaking or confirming HTF anchors: crossing above anc_hi can trigger a flip-to-sell label, and crossing below anc_lo can trigger a flip-to-buy label.
The flip mode supports Immediate (on cross) or Confirm (on sustained break) to control how strict the trigger is.
Fibonacci drawing
User-specified Fib levels are parsed from a string, safely converted to floats, and drawn as dotted horizontal lines only when they fall inside an approximate visible viewport. Orientation (up or down) is decided automatically from pending signal direction and a simple context score (candle bias, trend, and price vs. mid), with efficient redraw/clear guards to avoid clutter.
Dynamic anchors
If HTF anchors are missing or too far from current price (checked with an ATR-based threshold), the script falls back to local swing highs/lows to keep the reference range relevant. This dynamic switch helps Fib levels and labels remain close to current market structure without manual intervention.
Signal labels
Labels are created only on confirmed bars to avoid repainting noise, with one “latest” label kept by deleting the previous one. The script places BUY/SELL labels for WAIT/CONFIRM, direct HTF patterns (Buy S1, Sell S1/S2/S3), and contrarian flip events, offset slightly from highs/lows with clear coloring and configurable sizes.
Visual context
Bars are softly colored (lime tint for bullish, orange tint for bearish) for quick context, and everything renders as an overlay on the price chart. Fib labels include a Δ readout (distance from current close), and line extension length, label sizes, and viewport padding are adjustable.
How to use
Set the Signal Timeframe and Lookback Length to establish which HTF structures and ranges will drive the anchors and entry conditions. Choose entry flow (Wait vs Confirm), enable Flip if contrarian triggers are desired, select the trade side, toggle strategies, and customize Fibonacci levels plus dynamic-anchor fallback for practical on-chart guidance.
Notes
This is a visual decision-support tool; it does not place trades, stops, or targets and should be validated on charts before live use. It is written for Pine Script v6 and relies heavily on request.security for HTF-to-LTF transfer of signals and anchors.

Gann Fan Strategy [KedarArc Quant]Description
A single-concept, rule-based strategy that trades around a programmatic Gann Fan.
It anchors to a swing (or a manual point), builds 1×1 and related fan lines numerically, and triggers entries when price interacts with the 1×1 (breakout or bounce). Management is done entirely with the fan structure (next/previous line) plus optional ATR trailing.
What TV indicators are used
* Pivots: `ta.pivothigh/ta.pivotlow` to confirm swing highs/lows for anchor selection.
* ATR: `ta.atr` only to scale the 1×1 slope (optional) and for an optional trailing stop.
* EMA: `ta.ema` as a trend filter (e.g., only long above the EMA, short below).
No RSI/MACD/Stoch/Heikin/etc. The logic is one coherent framework: Gann price–time geometry, with ATR as a scale and EMA as a risk filter.
How it works
1. Anchor
* Auto: chooses the most recent *confirmed* pivot (you control Left/Right).
* Manual: set a price and bar index and the fan will hold that point (no re-anchoring).
* Optional Re-anchor when a newer pivot confirms.
2. 1×1 Slope (numeric, not cosmetic)
* ATR mode: `1×1 = ATR(Length) × Multiplier` (adapts to volatility).
* Fixed mode: `ticks per bar` (constant slope).
Because slope is numeric, it doesn’t change with chart zoom, unlike the drawing tool.
3. Fan Lines
Builds classic ratios around the 1×1: 1/8, 1/4, 1/3, 1/2, 1/1, 2/1, 3/1, 4/1, 8/1.
4. Signals
* Breakout: cross of price over/under the 1×1 in the EMA-aligned direction.
* Bounce (optional): touch + reversal across the 1×1 to reduce whipsaw.
5. Exits & Risk
* Take-profit at the next fan line; Stop at the previous fan line.
* If a level is missing (right after re-anchor), a fallback Risk-Reward (RR) is used.
* Optional ATR trailing stop.
Why this is unique
* True numeric fan: The 1×1 slope is calculated from ATR or fixed ticks—not from screen geometry—so it is scale-invariant and reproducible across users/timeframes.
* Deterministic anchor logic: Uses confirmed pivots (with your L/R settings). No look-ahead; anchors update only when the right bars complete.
* Fan-native trade management: Both entries and exits come from the fan structure itself (with a minimal ATR/EMA assist), keeping the method pure.
* Two entry archetypes: Breakout for momentum days; Bounce for range days—switchable without changing the core model.
* Manual mode: Lock a session’s bias by anchoring to a chosen swing (e.g., day’s first major low/high) and keep the fan constant all day.
Inputs (quick guide)
* Auto Anchor (Left/Right): pivot sensitivity. Higher values = fewer, stronger anchors.
* Re-anchor: refresh to newer pivots as they confirm.
* Manual Anchor Price / Bar Index: fixes the fan (turn Auto off).
* Scale 1×1 by ATR: on = adaptive; off = use ticks per bar.
* ATR Length / ATR Multiplier: controls adaptive slope; start around 14 / 0.25–0.35.
* Ticks per bar: exact fixed slope (match a hand-drawn fan by computing slope ÷ mintick).
* EMA Trend Filter: e.g., 50–100; trades only in EMA direction.
* Use Bounce: require touch + reverse across 1×1 (helps in chop).
* TP/SL at fan lines; Fallback RR for missing levels; ATR Trailing Stop optional.
* Transparency/Plot EMA: visual preferences.
Tips
* Range days: larger pivots (L/R 8–12), Bounce ON, ATR Multiplier \~0.30–0.40, EMA 100.
* Trend days: L/R 5–6, Breakout, Multiplier \~0.20–0.30, EMA 50, ATR trail 1.0–1.5.
* Match the TV Gann Fan drawing: turn ATR scale OFF, set ticks per bar = `(Δprice between anchor and 1×1 target) / (bars) / mintick`.
Repainting & testing notes
* Pivots require Right bars to confirm; anchors are set after confirmation (no look-ahead).
* Signals use the current bar close with TradingView strategy mechanics; real-time vs. bar-close can differ slightly, as with any strategy.
* Re-anchoring legitimately moves the structure when new pivots confirm—by design.
⚠️ Disclaimer
This script is provided for educational purposes only.
Past performance does not guarantee future results.
Trading involves risk, and users should exercise caution and use proper risk management when applying this strategy.

Dow Theory - Low timeframe Linear Regression Channel🔍 Dow Theory - Minor Trend: Linear Regression Channel for Low Timeframes
Catch Every Move. No Smoothing. No Delay. Pure Price Action.
This indicator redefines how you analyze minor trends on low timeframes by applying Dow Theory principles without relying on traditional smoothing techniques like moving averages. Instead, it maps trends using pure candle high and low points, capturing even the smallest structural shifts with surgical precision.
🧠 What Makes It Special?
Unlike traditional linear regression channels that smooth price across fixed windows (which often fail during high volatility or abrupt moves), this tool is built to react instantly, adapting to the true pulse of the market—the candle’s own highs and lows. The result: no lag, no distortion, and no compromise during fast, slow, wide, or tight market phases.
🧩 Core Functionalities:
Minor Trend Mapping: Automatically identifies and draws channels using candle-by-candle pivot detection (not swing highs/lows).
Adaptive Channel Drawing: Draws real-time parallel channels as soon as a valid trend structure is detected—uptrend, downtrend, or sideway range.
Break Detection Logic: Highlights when price breaks above or below the current channel to anticipate trend shifts.
Sideway Detection: Dynamically tracks contraction phases using overlapping pivot structures.
No Repainting: All lines are fixed and historical; what you see is what really happened.
Fully Customizable:
Change trendline colors for bullish, bearish, or sideway zones.
Adjustable line width and style (solid, dashed, dotted).
Toggle on/off channel lines for clarity.
💡 Why Use This?
If you’re tired of average-based indicators that get whipsawed in volatile markets, this is your surgical tool for clarity. Whether you’re scalping, building entry logic, or looking to automate setups—this indicator gives you the raw market structure in its cleanest, most responsive form.
ENJOY!
