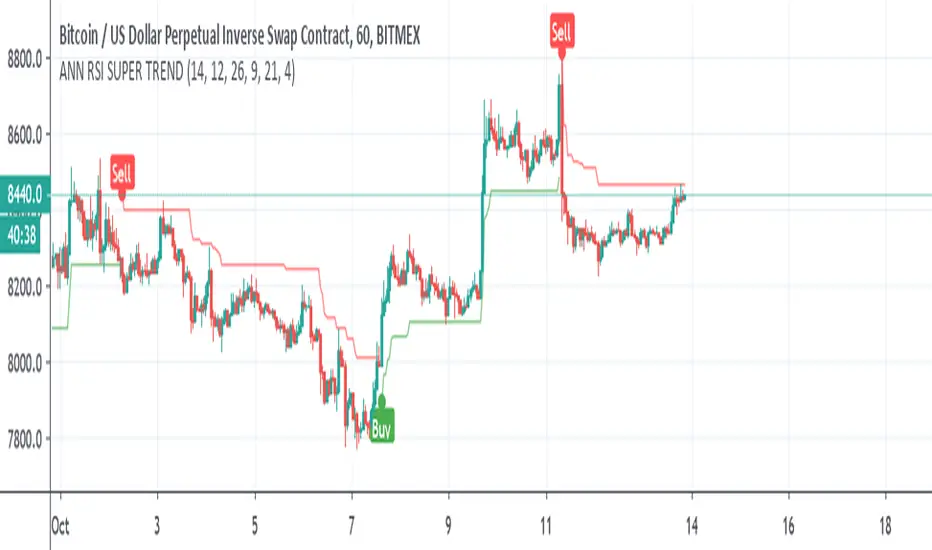
ANN RSI SUPER TRENDSo I was bored and I made this Hybrid
ANN taken from
and alex super trend ,
instead of normal ATR for the supertrend I use RSI and the ANN combination
alerts included
In den Scripts nach "supertrend" suchen
Trade ManagerHello everyone
Hoped you had a great weekend and are ready for what's coming this week
I'll never fail to satisfy my audience on TradingView and I'll start by sharing some heavy stuff.... Imagine the most amazing thing you had in your life. You got it ? now multiply this good feeling by 100 !!! OK... now I have a tool that is beyond that litteraly. Don't believe me, here's the Trade Manager ladies and gentlemen, I could barely contain my excitement this weekend to share it with the community
I wasn't sure of sharing it but you guys did a great job with my other indicators giving me constructive feedback to improve them. Also, those helping me with such feedback usually get the indicator for a lifetime access for free.
Please read this educational post I published for you before proceeding further : How-to-set-an-indicator-to-work-with-the-Trade-manager/
From here you normally connected the data source of your own indicator to the Trade Manager. If not, here's a reminder of the article mentionned above
Step 1 - Update your indicator
Somewhere in the code you'll have a LONG and a SHORT condition. If not, please go back to study trading for noobs (I'm kidding !!!)
So it should look to something similar
macrossover = crossover(MA1, MA2)
macrossunder = crossunder(MA1, MA2)
What you will need to add at the very end of your script is a Signal plot that will be captured by the Trade Manager. This will give us :
// Signal plot to be used as external
// if crossover, sends 1, otherwise sends -1
Signal = macrossover ? 1 : macrossunder ? -1 : na
plot(Signal, title="Signal")
The Trade Manager engines expects to receive 1 for a bullishg signal and -1 for bearish .
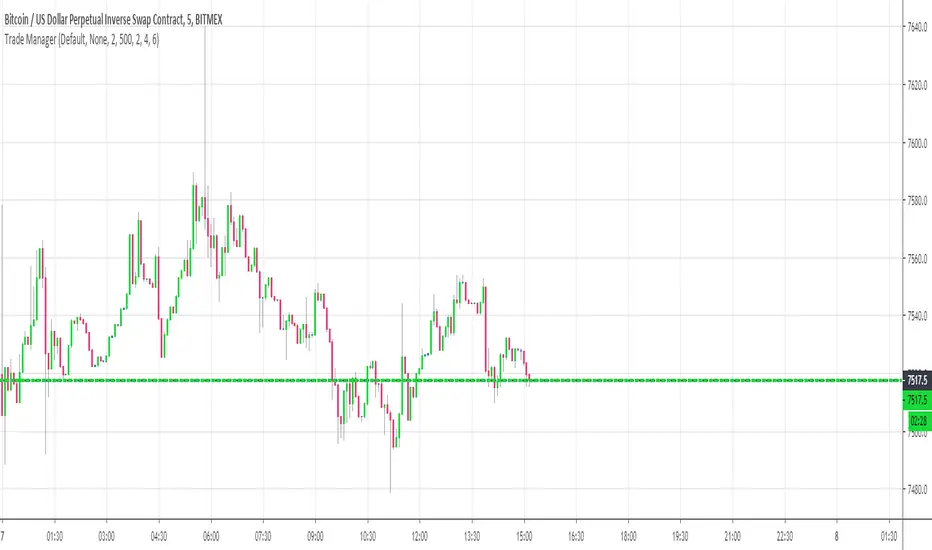
Step 2 - Add the Trade Manager to your chart and select the right Data Source
I feel the questions coming so I prefer to anticipate :) When you add the Trade Manager to your chart, nothing will be displayed. THIS IS NORMAL because you'll have to select the Data Source to be "Signal"
Remember our Signal variable from the Two MM Cross from before, now we'll capture it and.....drumb rolll...... that's from that moment that your life became even more AWESOME
The Engine will capture the last signal from the MM cross or any indicator actually and will update the Stop Loss, Take Profit levels based on the parameters you set on the Trade Manager
Now I'll cover the different parameters of the tool
It should be straightforward but better to explain everything here
+Label lines : if unchecked, no SL/TPs/... will be displayed
+Show indicators : This does nothing. Tradingview doesn't give the possibility to set Labels on an UI so we have to use this hack with a useless checkbox
+Show PnL Panel : Will show a Panel at the right of your chart with the PnL updated for the last position only. In a future version, I'll make it work to list maybe the previous N positions defined by the user
+Show Stop Loss Signal : Will display the stop loss label. You have the choice between three options :
++Percentage : Will set the SL at a percent distance from the price
++Fixed : SL fixed at a static price
++SuperTrend : Trailing stop loss based on Supertrend
'll add many more options this week for sure
+Take Profit 1,2,3 : Visually define the three Take Profit levels
Please note that once a Take profit level is reached, it will magically disappear. This is to be expected
This indicator is a first draft of what I believe is such a great tool because can be connected to any indicator. I confess that I tried it only with a few... if you find any that's not working with the Trade manager, please let me know and I'll have a look (for free)
I'm so excited to share it with all of you and that's the best possible way I could ever dreamt of to start the week with my TradingView community
Wishing you all the best and a pleasant experience with my work
David
Strategy Builder Crypto (Single Trend/Plots)Hi everyone
Big program for the daily indicator
This one will be free on trial only for a week because it has an immense value and required quite a lot of work. For more info to use it long-term, please DM me
That out of the way, let's dive right in...
This is a huge upgrade from that script Ultimate-Algorithm-Builder-Single-Trend
The Tradingview non-pro users will appreciate it because it allows to add the selected subsequent indicators as well. The Pro users too will likely like this feature equally, what the H*** I'm saying :)
This indicator will transform you into what I was in the past... into a quant trader. You'll build your own trading algorithm in a few clicks only
Which timeframe and which assets ?
Short answer : ALL and ALL
You'll have to define the configuration of the tool based on your capital, psychology. For custom configuration of the tool, please DM me directly so that we can discuss further
But a few words of advices anyway :
the bigger the timeframe, the lower the inputs (and vice-versa)
Think about how much $$ you want to make per trade and define your entries from there
Think about how much $$ you can afford to lose per trade and define the supertrend from there
...
Your golden configuration might not work for all assets.
You might have to create some tweaks - for instance you found a great config for BTCUSD but it's not working for ETHUSD, then you can create a copy of your BTCUSD chart and set a new config for ETHUSD
What are the indicators inside :
This fantastic tool that I personally use for my trading detects convergence between the following indicators :
Overlay - meaning if the price close above/below a moving average
Trend Signal - to detect if the the DOW law is broken and predict a possible reversal - en.wikipedia.org/wiki/Dow_theory
In other words, it detects if the higher highs or lower lows sequence is broken
MACD or MACD Zero Lag
MA Cross - Cross of moving averages
Ichimoku - if the price closes below/above the cloud
Supertrend - used to detect polarity zones
TSI Shadow -
Pullback
You'll also have the possibility to define a pullback on a given MA. That means basically that you'll get a convergence and it will only display a signal when it will pullback first
This will reduce your losses in case of invalidation and maximize your gains as it will enter the trade in a better position.
You can define your pullback either based an absolute value or based on a percent distance from the MA
+Example:
Pullback value = 100 means I want a 100 pip/USD distance between the MA pullback and the candle
Pullback percent = 2 means I want a 2% distance between the MA pullback and the candle
The percent option is more generic in my opinion but I let the other available for those who might like it
That's it ?
Almost....You can also setup alerts on the indicator signals so that you won't have to stay days in front of the chart to wait for a signal.
You receive the alert, you check real quick if we're not in front of a support/resistance, if no then take the trade. if yes, I advice waiting for a big pullback - better to be safe than sorry in trading
What If you want a custom version ?
Here are a few custom ideas I could add just for you :
re-enter everytime there is a convergence. So far the indicator is only taking the first convergence. This would give more entries
add the resistances/supports (fibo, pivot)
add the take profit targets and trailing stop loss
..
Please hit me up directly so we can discuss further. Any custom dev will require quite some time so it won't be free
Enjoy that one as I really think it will improve your analyst skills and trading and hopefully make you a few gains (which will make me very happy as I want to help most of you to at least not losing your capital)
Dave

Noro's SILA v1.2Noro's SILA v1.2 - these are 5 trend indicators in 1, for the sake of better accuracy.
Added:
1) Settings
2) Arrows
Noro's SILA v1.2 uses 5 trend indicators:
1) SuperTrend
2) DI Plus-Minus
3) WOW trend indicator (my idea)
4) BarColor indicator (my idea)
5) BestMA (or "BMA") indicator (my idea)
The user can switch-off any indicator from 5 to achieve big accuracy.
How does it work?
Each indicator from 5 defines a trend in own way. If two indicators report that there will be a uptrend, and three others the indicator report that there will be a downtrend - it is downtrend (a red background).
For an example
Now SuperTrend = uptrend = +1
Now DI Plus-Minus = downtrend = -1
Now WOW trend indicator = downtrend = -1
Now BarColor indicator = downtrend = -1
Now BestMA (or "BMA") indicator = uptrend = +1
Sum = + 1 - 1 - 1 - 1 + 1 = -1 = downtrend
If sum > 0 = uptrend
Sensivity
The user himself chooses what there will be a sensitivity (in settings).
If sensivity = 3:
sum > or = 3 - uptrend
sum < or = -3 - downtrend
sum > -3 and < 3 - NA-color of background
Trendlines
3 lower trendlines (blue plots) is "sum+3"
5 upper trendlines is "sum-5"
etc
Settings:
1) sensivity - you see above
2) distance - distance between the price and lines (for convenience)

VWMA Strategy Signals - Daily OptimizedVWMA Strategy Signals using RSI, Supertrend, EMA and VWMA on the Daily charts.

VWMA Strategy Signals - Daily OptimizedVWMA, RSI, SUPERTREND, EMA INDICATOR buy sell signals optimized for the daily charts


Tamil - Dynamic Top/Bottom Range with EMATamil – Dynamic Top/Bottom Range with EMA is an all-in-one trend + targets indicator designed for intraday and swing trading. It combines a clean EMA crossover entry signal, automatic take-profit levels, dynamic support/resistance range lines, and a multi-timeframe dashboard to quickly confirm trend strength across multiple timeframes.
What it shows on the chart
• 5 EMAs (14 / 21 / 55 / 100 / 200) with fully customizable colors to visualize short-term vs long-term trend.
• BUY / SELL signals based on EMA14 crossing EMA21:
• Buy Signal: EMA14 crosses above EMA21
• Sell Signal: EMA14 crosses below EMA21
• Auto Take-Profit levels (TP1 / TP2 / TP3) for every new signal:
• TPs are calculated by percentage move from the signal candle close
• Separate TP percentages for Buy and Sell
• Plots dashed TP lines and prints labels with exact price levels
• Includes alerts for Buy/Sell + each TP hit
• Dynamic Range Lines
• Plots rolling Resistance (highest high) and Support (lowest low) using a configurable lookback
Multi-Timeframe Dashboard (Table)
A compact table shows key confirmation signals across:
1m, 5m, 15m, 1H, 4H, 1D, 1W
• RSI value
• Stochastic value
• Supertrend direction (Buy/Sell/Neutral)
• SMA trend bias (Buy/Sell/Neutral)
with heat-map style coloring for faster reading.
Alerts Included
• Buy Signal / Sell Signal
• TP1 / TP2 / TP3 reached (Buy & Sell)
Note: This is an indicator (not a strategy/backtest). Use proper risk management and confirm signals with your own trade plan.


SS Critical Advanced Swing Trading Decision Matrix
📊 How to Use the SS Critical Advanced Swing Trading Decision Matrix Indicator
Installation & Setup
Adding to TradingView
Open TradingView and Click "Add to Chart"
The indicator will load with the dashboard on your selected position
Recommended Timeframes
Daily charts: Primary timeframe for swing trading signals
4-hour charts: For fine-tuning entry/exit points
Weekly charts: For confirming long-term trends
Interpreting the Decision Matrix Scores
Final Score Ranges
Component Breakdown
Trend (25%): MA alignment + SuperTrend direction + ADX strength
Momentum (30%): RSI + MACD + Stochastic + ROC + MFI
Volume (20%): Volume surge + MFI confirmation
Volatility (15%): Bollinger Bands position + ATR
Oscillators (10%): CCI + Williams %R + ADX
Trading Signals
BUY Signal
Triggers when Final Score crosses above 65
Confirms bullish momentum building
Enter within 1-2 bars of signal for best results
SELL Signal
Triggers when Final Score drops below 35
Indicates bearish pressure intensifying
Exit or consider shorting opportunities
Signal Quality Validation
Check Previous Close score for trend confirmation
Higher previous score = stronger continuation
Diverging scores = potential reversal or consolidation
Customisation for Your Strategy
Adjusting Signal Weights
Trending Markets: Increase Trend Weight to 30-35%
Volatile Markets: Increase Volatility Weight to 20-25%
Low Volume Stocks: Decrease Volume Weight to 10-15%
High Volume Stocks: Increase Volume Weight to 25-30%
Parameter Optimization
Fast MA (9): For aggressive entries, reduce to 5-7
Slow MA (50/200): For longer holds, keep standard
RSI Length (14): Increase to 21 for smoother signals
Profit Target: Set based on stock volatility (6-7% default)
Best Practices
Entry Strategy
Wait for score ≥ 65 (STRONG or EXCELLENT)
Confirm trend on higher timeframe (weekly)
Check volume is above average
Enter on price pullback or breakout
Exit Strategy
Target: Achieve 6-7% profit within timeframe
Stop-loss: When score drops below 50 (MODERATE)
Trailing stop: Move to breakeven at 3% profit
Risk Management
Never risk more than 2% of capital per trade
Use position sizing based on signal quality:
EXCELLENT: 100% of planned position
STRONG: 75% of planned position
MODERATE: 25% or skip
Avoiding False Signals
Use multiple timeframe confirmation (daily + weekly)
Avoid trading during low volume periods
Check fundamentals for stocks with EXCELLENT scores
Don't overtrade - wait for quality setups
Dashboard Interpretation
Current Bar Section
Shows real-time analysis of ongoing candle
Component scores color-coded (Green/Yellow/Red)
Weighted column shows actual contribution to final score
Previous Close Section
Displays confirmed signal from last closed bar
Use for backtesting and strategy validation
Compare with current to spot trend changes
Alerts Setup
Create alerts for Buy/Sell signals
Set notifications for EXCELLENT quality signals
Combine with price alerts for automated monitoring
Practical Example
EXCELLENT Signal (Score 85)
All 5 components show green (>60 points)
Strong uptrend with high volume
Action: Enter full position, target 6-7% in 5 -15 days
WEAK Signal (Score 40)
Mixed indicators, declining momentum
Action: Avoid new entries, monitor existing positions
Pro Tip: Backtest this indicator on your favorite stocks using historical data before live trading. Adjust weights and parameters based on which components work best for your specific market/timeframe.
© Dr Shantanu Samanta - This indicator combines proven swing trading indicators into a single decision matrix for clearer trade execution.
For Educational purposes only

Call-Put Cross Strike Match [Pro]📊 Call-Put Cross Strike Match - Professional Options Trading Indicator
Advanced NSE Options Analysis with AI-Powered Trading Signals & Dynamic Display
🎯 Overview
The Call-Put Cross Strike Match is an institutional-grade options analysis tool designed exclusively for NSE NIFTY and BANKNIFTY traders. Built on Pine Script v6, this indicator combines sophisticated cross-strike matching algorithms with intelligent trading signal generation to identify optimal options trading opportunities in real-time.
What makes it unique:
Analyzes 25 call-put combinations simultaneously
Generates actionable BUY/SELL signals using professional strategies
Fully customizable display with 9 table positions and 6 size options
Simplified setup with semi-automatic ATM detection
Clean, clutter-free interface with only essential information
Perfect for intraday scalpers, premium sellers, and positional options traders.
✨ Key Features
1. 🔍 Advanced Cross-Strike Matching Algorithm
The indicator calculates price differences for all 25 combinations (5 call strikes × 5 put strikes) and identifies the best matches based on put-call parity.
How it works:
Compares each call option price with every put option price
Calculates absolute difference: |Call - Put |
Ranks all 25 combinations from lowest to highest difference
Highlights top 3 or top 5 matches with visual checkmarks
Visual indicators:
✓✓ (Double check) = Best match (lowest price difference)
✓ (Single check) = Good matches (top 3 or top 5)
Empty cells = No match (significant price difference)
Why this matters:
When Call ≈ Put at same strike, it indicates fair pricing and synthetic position opportunities. The indicator automatically finds these opportunities across different strike combinations.
2. 🎯 Intelligent Trading Signals (Last Column)
The indicator generates professional trading recommendations based on Call-Put price difference analysis:
Signal Types:
BUY CE - Long call opportunity (bullish)
SELL CE - Short call opportunity (premium selling)
BUY PE - Long put opportunity (bearish/hedge)
SELL PE - Short put opportunity (premium selling)
BULL - Moderate bullish bias
BEAR - Moderate bearish bias
ATM - Neutral market (near parity)
NEUTRAL - No clear bias
Color-Coded for Quick Decisions:
🟩 Green = Long opportunities (BUY CE, BULL)
🟥 Red = Short call opportunities (SELL CE)
🟧 Orange = Long put opportunities (BUY PE)
🟫 Maroon = Short put opportunities (SELL PE)
⬛ Gray = Neutral zones (ATM, NEUTRAL)
3. 🤖 Three Professional Signal Modes
SMART Mode (Recommended) 🎯
Context-aware institutional strategy that considers strike position relative to spot price.
Signal Logic:
text
OTM Call Expensive (C-P > threshold, Strike > Spot):
→ SELL CE (Premium selling opportunity)
ITM Call Underpriced (C-P > threshold, Strike < Spot):
→ BUY CE (Synthetic long opportunity)
OTM Put Expensive (C-P < -threshold, Strike < Spot):
→ SELL PE (Premium selling opportunity)
ITM Put Underpriced (C-P < -threshold, Strike > Spot):
→ BUY PE (Protection or synthetic short)
Near Parity (|C-P| < threshold/4):
→ ATM (Neutral market, straddle/strangle zone)
Moderate Imbalance:
→ BULL or BEAR (Directional bias without extreme pricing)
Best for: Professional traders, option writers, synthetic position builders
MOMENTUM Mode 📈
Trend-following strategy that rides market momentum.
Signal Logic:
text
Calls Expensive (C-P > threshold):
→ BUY CE (Follow bullish momentum)
Puts Expensive (C-P < -threshold):
→ BUY PE (Follow bearish momentum)
Near Parity:
→ NEUTRAL (No clear trend)
Best for: Intraday scalpers, directional traders, swing traders
MEAN REVERSION Mode 🔄
Counter-trend strategy focused on premium selling.
Signal Logic:
text
Calls Overpriced (C-P > threshold):
→ SELL CE (Collect inflated premium)
Puts Overpriced (C-P < -threshold):
→ SELL PE (Collect inflated premium)
Near Parity:
→ ATM (Fair value, no edge)
Best for: Option writers, theta decay strategies, credit spread traders
4. 🎨 Fully Customizable Display
Dynamic Table Positioning (9 Options):
Top: left, center, right
Middle: left, center, right
Bottom: left, center, right
Choose position based on your chart layout and other indicators.
Dynamic Table Sizing (6 Options):
Auto - Adapts to content
Tiny - Minimal space (for cluttered charts)
Small - Default, best balance
Normal - Medium size (1080p monitors)
Large - Big text (4K monitors)
Huge - Maximum size (presentations)
Text scales intelligently:
Headers, data, and checkmarks adjust proportionally
Checkmarks remain visible even in tiny mode
Info row stays readable at all sizes
5. ⚙️ Simplified Input System
Auto Mode (Recommended):
Enter just 5 strikes once at market open - used for both calls and puts.
Example for NIFTY at 25,900:
text
Strike 1: 25850 (ATM - 100)
Strike 2: 25900 (ATM - 50)
Strike 3: 25950 (ATM)
Strike 4: 26000 (ATM + 50)
Strike 5: 26050 (ATM + 100)
Manual Mode (Advanced):
Enter separate call and put strikes for cross-strike arbitrage analysis.
Why this matters:
50% fewer inputs compared to traditional indicators
One-time setup at market open
Rarely needs updating (only if market moves 100+ points)
6. 🎛️ Semi-Automatic ATM Detection
The indicator automatically:
Detects current NIFTY/BANKNIFTY spot price
Calculates ATM strike (rounded to nearest 50 or 100)
Marks ATM strikes with *ATM in the table
Displays ATM and spot price in info box
No manual recalculation needed!
7. 📊 Clean Information Display
Main Table (Top/Middle/Bottom):
CE \ PE matrix showing all strike combinations
Checkmarks (✓✓ and ✓) highlighting best matches
SIGNAL column with color-coded trading recommendations
Best Match footer showing optimal combination
Info row displaying symbol, signal mode, and spot price
Info Box (Bottom Left):
Symbol (NIFTY/BANKNIFTY)
Signal Mode (Smart/Momentum/Mean Reversion)
Current Spot Price
Detected ATM Strike
Best Matched Call Strike
Best Matched Put Strike
Match Difference
C-P value for best match
📋 Quick Setup Guide (3 Steps)
Step 1: Add Indicator
Open NIFTY or BANKNIFTY chart on TradingView
Add "Call-Put Cross Strike Match " from indicators
Step 2: Configure Basic Settings
text
Symbol Detection: Auto (reads from chart)
Expiry Date: 251219 (format: YYMMDD for 19-Dec-2025)
Strike Mode: Auto
Strike Interval: 50 (for NIFTY) or 100 (for BANKNIFTY)
Step 3: Enter Strikes
At market open (9:15 AM), check current price and enter 5 strikes:
text
Example: NIFTY at 25,937
Strike 1: 25850 (ATM - 100)
Strike 2: 25900 (ATM - 50)
Strike 3: 25950 (ATM) ← Rounded to nearest 50
Strike 4: 26000 (ATM + 50)
Strike 5: 26050 (ATM + 100)
That's it! The indicator handles everything else automatically.
💡 Real-World Use Cases
1. 📉 Premium Selling (Mean Reversion Mode)
Scenario: Looking for overpriced options to write
How to use:
Set Signal Mode to "Mean Reversion"
Set Threshold: 30 (NIFTY) or 75 (BANKNIFTY)
Look for SELL CE or SELL PE signals with ✓ or ✓✓
Sell naked options or credit spreads at those strikes
Target 30-50% profit or 3-5 days theta decay
Perfect for: Credit spreads, iron condors, covered calls, naked puts
2. 📈 Directional Trading (Momentum Mode)
Scenario: Scalping intraday moves
How to use:
Set Signal Mode to "Momentum"
Set Threshold: 15 (aggressive) or 25 (conservative)
BUY CE signal + ✓✓ = Long call entry
Enter with tight stop (20% of premium)
Target 30-50% gain within 1-2 hours
Perfect for: Intraday scalping, swing trading, trend following
3. 🔄 Synthetic Positions (Smart Mode)
Scenario: Building synthetic long/short with defined risk
How to use:
Set Signal Mode to "Smart"
Look for BUY CE at ITM strike + SELL PE at OTM strike
Both should have ✓ indicator (good parity)
Creates synthetic long position
Lower capital than buying futures
Perfect for: Professional traders, arbitrage, capital efficiency
4. ⚖️ ATM Strategy Optimization (Smart Mode)
Scenario: Finding optimal strikes for straddle/strangle
How to use:
Identify strike marked *ATM
Check if signal shows ATM (balanced market)
If BULL/BEAR → Market has directional bias, adjust accordingly
✓✓ indicates best matched strike for neutral strategies
Perfect for: Volatility trading, earnings plays, event trading
5. 🛡️ Hedging Optimization (Smart Mode)
Scenario: Protecting long equity positions
How to use:
Look for BUY PE signals (protection signals)
Avoid strikes with SELL PE (expensive hedges)
✓✓ shows best value for hedge entry
Optimize hedge timing and strike selection
Perfect for: Portfolio hedging, risk management, protective puts
⚙️ Settings Guide
Symbol Settings
Symbol Detection: Auto (recommended) or Manual
Manual Symbol: NIFTY or BANKNIFTY
Expiry Date: Format YYMMDD (e.g., 251219 = 19-Dec-2025)
Update every Thursday after 3:30 PM for next week's expiry
Strike Settings
Strike Mode: Auto (recommended) or Manual
Strike Interval:
50 for NIFTY
100 for BANKNIFTY
Trading Signals
Signal Mode: Smart / Momentum / Mean Reversion
Smart: Professional institutional strategy (default)
Momentum: Trend-following for scalpers
Mean Reversion: Premium selling for writers
Signal Threshold: Sensitivity in points
NIFTY Recommendations:
Conservative: 30-40 points (fewer, higher quality signals)
Balanced: 20-25 points (default)
Aggressive: 10-15 points (more signals, more noise)
BANKNIFTY Recommendations:
Conservative: 75-100 points
Balanced: 50-60 points (default)
Aggressive: 30-40 points
Algorithm Settings
Matching Mode:
Top 3: Shows 3 best matches (cleaner display)
Top 5: Shows 5 best matches (more opportunities)
Display Settings
Show Matching Table: Enable/disable main table
Table Position: Choose from 9 positions
top_right (default) - Doesn't block price action
middle_right - Centered vertical view
bottom_right - If top is crowded
Table Size: Choose from 6 sizes
small (default) - Best for most users
normal - For 1080p/4K monitors
tiny - If you have many indicators
📊 Understanding The Table
Table Layout Example:
text
CE \ PE | 25950 | 25900 | 25850 | 26000 | 26050 | SIGNAL
---------|-------|-------|-------|-------|-------|--------
25850 | | | | | | SELL PE
25900*ATM| | ✓ | | | | ATM
25950 | ✓✓ | | | | | BULL
26000 | | | | ✓ | | BUY CE
26050 | | | | | | SELL CE
---------|-------|-------|-------|-------|-------|--------
Best Match: 25950 / 25950 (0.25)
Info: NIFTY | Smart | Spot:25881.9
Reading the Table:
Rows (Left): Call option strike prices
Columns (Top): Put option strike prices
Cells: Checkmarks where Call ≈ Put
✓✓: Best match (minimum price difference)
✓: Good matches (top 3 or 5)
Empty: Prices too different (no match)
*ATM: Automatically detected at-the-money strike
SIGNAL Column: Actionable trading recommendation for each call strike
Info Box Metrics:
Symbol: Currently analyzed index
Signal Mode: Active strategy
Spot: Current underlying price
ATM: Calculated at-the-money strike
Best Call: Matched call strike
Best Put: Matched put strike
Match Diff: Price difference (lower = better)
C-P (Best): Call minus Put for best match
📈 Best Practices
Strike Selection & Maintenance
At Market Open (9:15 AM):
Check current price (e.g., NIFTY at 25,937)
Round to nearest interval (25,950 for 50 interval)
Enter 5 strikes: -100, -50, 0, +50, +100 from ATM
Update Frequency:
Usually no update needed entire day
Update only if market moves 100+ points from initial ATM
Typically 0-2 updates per trading session
Signal Interpretation by Confidence Level
High Confidence (✓✓ + Signal):
Best match indicator present
Strongest signal quality
Highest probability setup
Medium Confidence (✓ + Signal):
Good match present
Reliable signal
Acceptable risk/reward
Low Confidence (Signal without ✓):
No match indicator
Strike far from parity
Requires additional confirmation
Risk Management Rules
Never trade signals blindly. Always:
✅ Confirm with price action and support/resistance
✅ Check overall market trend (NIFTY/BANKNIFTY direction)
✅ Consider time decay (theta) for your position
✅ Monitor IV changes (implied volatility)
✅ Use proper position sizing (1-2% risk per trade)
✅ Set stop losses (20-30% of premium for longs)
✅ Have profit targets (30-50% for scalps)
Timeframe Selection
Intraday Trading:
Use 5-minute or 15-minute chart
Momentum or Smart mode
Lower threshold (aggressive)
Quick entries and exits
Positional Trading:
Use hourly or daily chart
Smart or Mean Reversion mode
Higher threshold (conservative)
Swing trade positions
Combining with Other Tools
Recommended complements:
Support/resistance levels (horizontal lines)
Trend indicators (EMA 20/50, SuperTrend)
Volume analysis (confirm breakouts)
India VIX (volatility context)
Option chain data (open interest)
🎓 Strategy Examples
Strategy 1: Professional Premium Selling
text
Mode: Mean Reversion
Threshold: 30 (NIFTY) / 75 (BANKNIFTY)
Timeframe: Daily
Rules:
1. Wait for SELL CE or SELL PE signal
2. Verify strike has ✓ or ✓✓ (good parity)
3. Check if OTM (Strike away from spot)
4. Sell option or create credit spread
5. Target: 30-50% profit or 3-5 days theta
6. Stop: If signal changes to BUY
Position: Naked short or credit spreads
Risk: Define with spreads or capital allocation
Strategy 2: Intraday Momentum Scalping
text
Mode: Momentum
Threshold: 15 (aggressive)
Timeframe: 5-minute
Rules:
1. Wait for BUY CE signal + ✓✓
2. Enter long call immediately
3. Stop loss: 20% of premium paid
4. Target 1: 30% gain (partial exit)
5. Target 2: 50% gain (full exit)
6. Exit if signal changes or 2 hours pass
Position: Long calls or long puts only
Risk: 1-2% of capital per trade
Strategy 3: Synthetic Long Position
text
Mode: Smart
Threshold: 25 (NIFTY) / 60 (BANKNIFTY)
Timeframe: Hourly
Rules:
1. Identify BUY CE signal at ITM strike
2. Identify SELL PE signal at OTM strike
3. Both should have ✓ indicator
4. Buy ITM call + Sell OTM put = Synthetic Long
5. Lower capital than futures
6. Defined risk (width of strikes)
Position: Call debit + Put credit
Risk: Net debit paid (defined risk)
Strategy 4: ATM Straddle Entry
text
Mode: Smart
Threshold: 20 (default)
Timeframe: Daily
Rules:
1. Find strike marked *ATM
2. Check signal shows "ATM" (neutral)
3. Verify ✓✓ at that strike
4. Sell ATM call + Sell ATM put
5. Collect maximum premium
6. Exit at 30% profit or before expiry
Position: Short straddle or iron condor
Risk: Use defined risk (iron condor recommended)
🔔 Important Notes
Data Accuracy
Indicator uses TradingView's NSE options data feed
Always verify prices independently before trading
Ensure market is open (9:15 AM - 3:30 PM IST)
Check for "-" in cells indicating missing data
Expiry Management
Update expiry date every week on Thursday post-closing
Format: YYMMDD (6 digits)
Weekly expiry: Every Thursday
Monthly expiry: Last Thursday of month
Strike Format
NIFTY: Multiples of 50 (25850, 25900, 25950...)
BANKNIFTY: Multiples of 100 (51800, 51900, 52000...)
Wrong strikes = No data in table
Performance Optimization
Indicator updates every bar close
No lag or performance issues
Works on all timeframes (1m to 1D)
Maximum 5 calls + 5 puts = 10 security calls (within limits)
⚠️ Disclaimer
Trading options involves substantial risk of loss and is not suitable for all investors. This indicator is provided for educational and informational purposes only. It does not constitute financial advice, investment advice, or trading advice.
Important disclaimers:
Options can expire worthless, resulting in 100% loss
Past performance of signals is not indicative of future results
Accuracy depends on TradingView's NSE data feed
Signals are mathematical analysis, not predictions
You are solely responsible for your trading decisions
The developer is not liable for any trading losses incurred while using this indicator.
Before trading, ensure you understand:
Options Greeks (Delta, Gamma, Theta, Vega, Rho)
Implied volatility and its impact
Time decay and expiration risks
Assignment risk for short positions
Liquidity and slippage considerations
Margin requirements and capital needs
Always:
Use proper risk management (1-2% per trade)
Trade with capital you can afford to lose
Paper trade before live trading
Consult with a licensed financial advisor
Start with small position sizes
Never risk more than you can afford to lose
📊 Technical Specifications
Platform: TradingView Pine Script v6
Exchanges: NSE (National Stock Exchange of India)
Instruments: NIFTY, BANKNIFTY options
Timeframes: All (1m, 5m, 15m, 1h, 1D)
Strikes Analyzed: 5 calls × 5 puts = 25 combinations
Security Calls: 10 (5 calls + 5 puts)
Table Positions: 9 (all corners and centers)
Table Sizes: 6 (auto to huge)
Signal Modes: 3 (Smart, Momentum, Mean Reversion)
Performance: Optimized, minimal lag
🎯 Who Should Use This?
✅ Perfect For:
Options Traders: Intraday and positional
Premium Sellers: Option writers and theta strategists
Arbitrage Traders: Synthetic position builders
Straddle/Strangle Traders: ATM strategy traders
Professional Traders: Institutional-grade analysis
Volatility Traders: IV imbalance exploiters
Scalpers: Quick intraday moves
❌ Not Suitable For:
Stock options traders (NSE index-specific)
Equity-only traders (requires options knowledge)
International markets (NSE format only)
Complete beginners (requires basic options understanding)
💬 FAQ
Q: Why manual strike entry? Why not fully automatic?
A: Pine Script's type system limits fully automatic strike generation from live data. However, setup takes just 30 seconds once at market open, and the indicator handles all analysis automatically throughout the day.
Q: How often should I update strikes?
A: Rarely! Only when market moves 100+ points from initial ATM. Usually 0-2 times per day, even in volatile markets.
Q: Which Signal Mode is best?
A: Smart mode (default) for professional trading. Use Momentum for intraday scalping, Mean Reversion for premium selling.
Q: Can I use this for stock options?
A: No. The indicator is designed specifically for NSE index options (NIFTY and BANKNIFTY) with NSE format.
Q: Does it work on mobile?
A: Yes, but table display is optimized for desktop/tablet screens. Use "tiny" or "small" size on mobile.
Q: What if I see "-" in cells?
A: Check expiry format (YYMMDD), verify strikes match NSE strikes, and ensure market is open.
Q: What's the difference between ✓✓ and ✓?
A: ✓✓ = Best match (lowest price difference), highest quality. ✓ = Good matches (top 3-5), reliable quality.
Q: Can I backtest this indicator?
A: The indicator shows live analysis. For backtesting options strategies, you'll need historical options data and separate backtesting tools.
Q: What does the info box show?
A: Bottom-left box shows key metrics: symbol, signal mode, spot price, ATM strike, best matched strikes, match difference, and C-P value.
Q: Why no chart plotting?
A: v1.0 focuses on clean table display with maximum information density. Chart plotting may be added in future versions based on user feedback.
🙏 Credits
Developed by a professional options trader for the Indian trading community. Inspired by institutional trading desks and market makers who use call-put parity for daily trading decisions.
Found This Helpful?
⭐ Rate 5 stars if it improved your trading
💬 Comment with your strategy results
🔔 Follow for updates and new indicators
📢 Share with fellow options traders
Feature Requests
Continuous improvement based on trader feedback. Suggest features in comments!
Planned Features (v2.0):
Multi-expiry comparison
Greeks display (Delta, Theta, Vega)
Historical signal performance stats
Custom signal formulas
Export to CSV functionality
🏷️ Tags for Search
#Options #OptionsTrading #NIFTY #BANKNIFTY #NSE #India #OptionChain #CallPut #PutCallParity #Straddle #Strangle #ATM #TradingSignals #OptionsStrategy #PremiumSelling #OptionsScanner #Derivatives #IntradayTrading #VolatilityTrading #Arbitrage #SyntheticPosition #OptionsGreeks #OptionsSelling #OptionsWriting #IndianStockMarket #NSEOptions #OptionsAnalysis #TechnicalAnalysis #AlgoTrading #QuantTrading #ProfessionalTrading #TradingIndicator #PineScript #TradingView
📝 Version History
v1.0 (Current - Dec 2025)
Pine Script v6 implementation
Cross-strike matching (5×5 matrix, 25 combinations)
Three signal modes (Smart, Momentum, Mean Reversion)
Trading signal generation with color coding
Dynamic table positioning (9 positions)
Dynamic table sizing (6 sizes)
Intelligent text scaling
Semi-automatic ATM detection
Auto symbol detection
Simplified input system (50% fewer inputs in Auto mode)
Clean information display
Info box with key metrics
NSE NIFTY & BANKNIFTY support
Start trading smarter with institutional-grade options analysis! 📈💰🚀
Disclaimer: Options trading is subject to market risk. Please read all scheme-related documents carefully before investing.

True Three Soldiers Method (TTSM) - Breakout ConfirmationIndicator Overview
True Three Soldiers Method (TTSM) - Made in China is a quantifiable evolution beyond traditional candlestick pattern recognition. It replaces subjective visual analysis with an objective, data-driven momentum system featuring smart breakout confirmation.
Core Innovation: Beyond Traditional Pattern Recognition
Traditional three-soldier patterns merely check for three consecutive bullish/bearish candles. TTSM goes much deeper:
Dual Signal System: It identifies both single-candle and three-candle momentum signals, providing earlier warnings of potential trend changes.
Quantifiable Strength Metrics: Each signal must meet customizable thresholds for both absolute price movement (percentage change) and relative efficiency (close-to-open distance relative to total range).
Breakout Confirmation Logic: The real innovation lies in the "True Signal" mechanism. Preliminary signals are tracked, and only when price breaks above the highest high of recent bullish signals (or below the lowest low of recent bearish signals) does it trigger a confirmed entry signal. This eliminates false breakouts and ensures you're trading with confirmed momentum.
Absolute Strength: Quantifies momentum via percentage price change.
Relative Strength: Measures candlestick efficiency (close-to-open vs. total range).
True Signal Validation: A "True" entry signal triggers only after price confirms momentum by breaking above/below a cluster of recent preliminary signals, filtering out false moves.
Dual-Layer Signal System
Key Features
🔴 Amber Signals (Preparation): Single-candle or three-candle patterns that meet strength criteria. These indicate potential momentum building and can be used for preparation or light positioning.
🟢 Green Signals (True Breakout): Triggered only when price breaks above/below the recent signal cluster extremes. These represent confirmed momentum and are ideal for main entries.
🎚 Fully Customizable: Every parameter—absolute/relative strength thresholds, lookback periods, and average calculations—can be adjusted to match your trading style and market conditions.
📊 Clear Visual Feedback: Color-coded labels and reference lines make signal identification instant and intuitive.
Parameter Customization Guide
All parameters are organized in intuitive groups:
Strength Thresholds: Adjust absolute (%) and relative (%) strength requirements for both long and short signals.
First Signal Thresholds: Special thresholds for when a signal is the first in the lookback period.
Lookback & Averages: Control how many bars are considered for signal tracking and moving averages.
Strategic Application
Preparation Signals: Use amber signals to prepare for potential moves, set alerts, or enter with smaller positions.
True Signals: Green/red "True" signals indicate confirmed momentum—ideal for main entries with proper risk management.
Combination Strategy: Pair TTSM with trend indicators (like Supertrend) for higher probability trades—only take True Signals in the direction of the main trend.

MA20 ATR Trend Failure FilterA volatility-adaptive filter designed to identify early trend invalidation.
This indicator combines a 20-period Moving Average (MA20) with Average True Range (ATR) to dynamically define a lower volatility boundary.
When price closes below this boundary, it signals that the current trend is no longer valid and risk is increasing.
Core Concept(核心思想)
MA defines the trend baseline
ATR measures current market volatility
MA − k × ATR forms a dynamic risk threshold
A close below this threshold = trend failure
👉 中文补充:
这不是反转指标,而是趋势失效过滤器,用于避免在趋势已经被破坏后继续持仓或加仓。
How It Works
Calculate MA20 as the trend reference
Calculate ATR(14) as volatility proxy
Build adaptive bands:
Upper Band = MA20 + k × ATR
Lower Band = MA20 − k × ATR
If close < Lower Band, trend is considered failed
The ATR multiplier k automatically adjusts the tolerance based on volatility, avoiding rigid fixed-percentage rules.
Visual Elements
Yellow line: MA20
Green band: MA20 + k × ATR
Red band: MA20 − k × ATR (key risk boundary)
Red triangle + “FAIL” label: Trend failure signal
Optional background shading to highlight risk zones
Typical Use Cases
Trend-following strategies (exit / reduce exposure)
Breakout strategies (filter false continuation)
Risk management overlay (non-intrusive, no repaint)
Combine with HMA, SuperTrend, structure-based entries
👉 中文补充:
非常适合作为**“不该再拿”的客观判断条件**,而不是频繁交易信号。
Why This Indicator
Volatility-adaptive (ATR-based)
No future data, no repaint
Simple logic, strong risk control
Works across stocks, crypto, futures, indices
This tool is designed to answer one question only:
Is the current trend still valid?
Parameters
MA Length (default: 20)
ATR Length (default: 14)
ATR Multiplier k (default: 0.8)
Lower k → stricter risk control
Higher k → more tolerance, fewer false signals SSE:600595

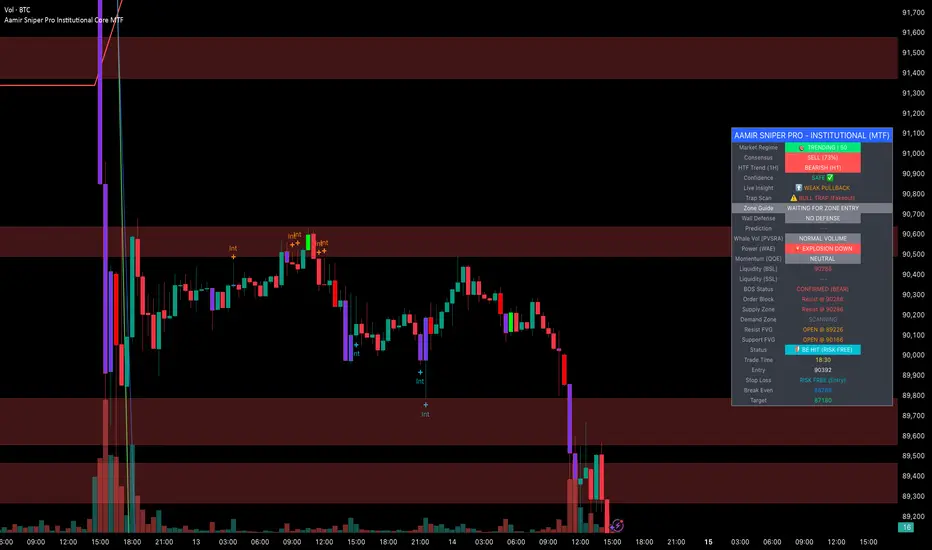
Aamir Sniper Pro Institutional Core MTFConcept & Utility: This script is a comprehensive "Multi-Factor Confluence System" designed to filter out market noise by requiring agreement between Trend, Momentum, Volatility, and Market Structure before generating a signal.
Many traders struggle with false signals generated by single indicators. This script solves that problem by using a Consensus Engine. Instead of relying on just one moving average or oscillator, this script aggregates data from over 20 different technical methods. It then applies strict filters (WAE, ADX, and MTF) to ensure that trades are only suggested during high-probability market conditions.
How the Components Work Together:
1. The Consensus Engine (The Core Logic): At the heart of the script is a voting system. It calculates the slope and direction of:
Fast/Slow EMAs, SMAs, WMAs, and Hull MA.
Ichimoku Cloud (Baseline/Conversion line).
SuperTrend and Parabolic SAR.
Oscillators (RSI, Stochastic, CCI).
Result: It generates a "Consensus Score" (0-100%). A signal is ONLY considered if the Bullish or Bearish score exceeds the user-defined threshold (Default: 70%).
2. The Filtering Layers (Why this is not just a mashup): A high consensus score alone is not enough. The script validates the signal through three mandatory filters:
Volatility Filter (WAE): Uses Waddah Attar Explosion logic to ensure there is enough volume/power to sustain the move.
Regime Filter (ADX): Checks the Average Directional Index. If the market is choppy (ADX < 25), the signal is blocked to prevent whipsaws.
MTF Filter: Checks the trend on a Higher Timeframe (Default: 1 Hour). It forces the user to trade only in the direction of the dominant trend.
3. Structural Context (SR Zones): We have integrated Dynamic Support & Resistance Zones based on Pivot Points.
Purpose: This provides immediate structural context. Even if the Consensus Engine gives a "BUY" signal, the trader can see if price is currently sitting at a "Resistance Box." This visual aid prevents buying into supply or selling into demand.
4. Institutional Volume (PVSRA): Candles are colored based on Volume Spread Analysis (PVSRA) concepts.
Purple/Blue Candles: Indicate "Whale Activity" (Volume > 200% of average). This helps confirm if institutional money is backing the move identified by the Consensus Engine.
5. Momentum Confirmation (QQE): The Qualitative Quantitative Estimation (QQE) is displayed on the dashboard to confirm short-term momentum direction, acting as the final trigger.
Features:
Sniper Mode: Option to wait for a candle retest before entry.
Dashboard: Displays the live Consensus Score, Market Regime, and Trend Status.
Risk Management: Auto-calculates SL/TP based on Swing High/Low or ATR.
Credits & Attribution:
WAE Logic: Adapted from the work of Waddah Attar.
PVSRA: Volume concepts adapted from the Traderathome/PVSRA community.
QQE: Adapted from standard open-source logic.
SR Zones: Logic derived from standard Pivot Point calculations.
TrendSurfer Pro
TrendSurfer Pro 🚀 - Advanced Multi-Signal Trading Indicator
TrendSurfer Pro is a comprehensive all-in-one trading system that combines multiple proprietary algorithms and technical indicators to identify high-probability trading opportunities across all timeframes.
**Key Features:**
🔹 **Master Trend System** - Identifies major trend reversals using a combination of EMAs, RSI, and custom filters
🔹 **Smart Money Analysis** - Order Blocks detection with Z-Score impulse identification and rejection signals
🔹 **Session-Based Trading** - Tokyo, London, and New York session analysis with automatic breakout/rejection detection
🔹 **IFVG Detection** - Institutional Fair Value Gap identification for precision entries
🔹 **Multi-Timeframe Signals** - Triangle signals with volume analysis and VWAP proximity filtering
🔹 **KCandle/Boost System** - Advanced engulfing pattern detection with golden area projections
🔹 **CCI Signals** - Commodity Channel Index crosses with MACD confirmation filter
🔹 **Take Profit System** 🎯 - Advanced exit system combining 8 technical indicators (RSI, MACD, Stochastic, Bollinger Bands, Supertrend, CCI, EMA Cross, Price Action) with customizable confirmation requirements
**Unique Advantages:**
✅ Yellow Box Filter - Proprietary reversal zone detection
✅ Time Filters - Trade only during your preferred hours
✅ VWAP Integration - All signals respect price position relative to VWAP
✅ Customizable Alerts - Get notified for every signal type
✅ Visual Dashboard - Real-time trend confirmation table
Perfect for day traders, swing traders, and scalpers seeking precise entries and optimal exits! 🚀

S&R + EMA ToolkitThis script is a market-structure toolkit that combines several indicators into a single view to help understand where price is, where it may react, and what the current trend context is.
EMAs (12, 26, 50, 200)
Help define short-, medium-, and long-term trend context and momentum alignment.
Support & Resistance Channels
Help identify key price zones where the market has historically reacted (areas of acceptance, rejection, and consolidation).
Supertrend
Helps confirm directional bias and trend persistence.
Oversold / Overbought RSI Zones (external source)
Help identify market conditions rather than timing entries.
SB-VDEMA + PivotsBest use - Intraday Scalping ( 1 Mt, 3 Mts, 5 Mts )
Uses Volatility weighted DEMA for smoother and reliable signals.
One can use dynamic colour coding of VWDEMA for entering call or puts. VWAP and Henkin ashi Supertrend is also there but, i think VWDEMA is quite enogh for decision making.

GIX-Treid-2Timeframes: M15 – H1 (and higher)
An advanced SuperTrend, more stable and more intelligent, based on statistical calculations, not market noise.
It calculates a statistical moving average, significantly smoother than EMA or SMA.
It builds an adaptive channel around this average, using fixed pip/tick steps (not a classic ATR).
The trend changes only when price breaks the channel, not on minor fluctuations.
The main line moves in discrete steps, not continuously → no repaint and no whipsawing.
Line color indicates direction:
Green = bullish trend
Red = bearish trend

MTF Dashboard Pro v4 Institutional EditionMTF Dashboard Pro v4 – 2026
Institutional Multi-Timeframe Bias Engine
A high-performance, professional-grade multi-timeframe dashboard designed for scalpers, intraday traders, and institutional smart-money practitioners.
Version 4 introduces a cleaner architecture, faster execution, and improved signal alignment across all major trend, momentum, and confirmation tools.
Core Features
Multi-Timeframe EMA Trend (9/21) – Fast intraday trend detection
200-MA System with Threshold Logic – Dynamic positional bias
Daily VWAP Engine (Optional Reset)
SuperTrend Engine with Corrected Direction Model
RSI, MACD, ADX, Alligator, Stochastic – Momentum + Confirmation suite
PH/PL Bias (Previous Day High/Low) – Institutional liquidity context
11-Signal Institutional Bias Score
Bias Classification: Strong Bull → Strong Bear
Multi-TF Alerts for Strong Bull / Strong Bear
Optimized HUD Table – Lightweight, fast, and resource-efficient
Who Is This For?
Scalpers, intraday traders, swing traders, and SMC/ICT-based traders who need:
Clear multi-timeframe alignment
Instant trend + momentum confirmation
Market structure bias
Liquidity context (PH/PL)
A single, clean, real-time dashboard
The indicator is designed to support high-speed decision making in volatile conditions and institutional trading environments.
Developed by - Sachin Yashwant Thakare
Author: Sachin Yashwant Thakare
Edition: 2026 Premium Release
Rights: © 2026 All Rights Reserved

Variance Ratio & Efficiency Ratio (Quant Lab)1️⃣ Variance Ratio (VR)
Formula:
VR ≈ Var(q-step returns) / (q × Var(1-step returns))
Interpretation:
• VR ≈ 1 → The market is like a random walk; neither trend nor mean-reversion is dominant.
• VR > 1 → Trend behavior is dominant.
• Trend-following systems (EMA, Supertrend, breakout) work better.
• VR < 1 → Mean-reversion is dominant.
• Range/reversal strategies (Z-score, Bollinger fade, RSI reversal) work better.
In short:
• VR > 1 → Trending market
• VR < 1 → Mean-reverting market
This tells you:
“Should I build a trend system or a mean-reversion system for this instrument?”
⸻
2️⃣ Efficiency Ratio (ER)
Formula logic:
ER = |Close_now – Close_n-bars-ago| / Σ|Close_i – Close_{i+1}|
In other words:
• Numerator → Net movement over N bars
• Denominator → Total noise over N bars
Interpretation:
• ER ≈ 1 → The price has moved in almost a straight line in one direction.
→ The trend is very efficient, noise is low.
• ER ≈ 0 → The price has fluctuated a lot but hasn't gone anywhere definitively.
→ A complete noise/range market.
This tells you:
“How clear is the trend in this last N bars, and how much noise is there?”
⸻
🔥 The intelligence provided by both together:
• VR > 1 and ER is high (0.6–1.0) →
➜ Strong, high-quality trend. Golden age for trend-following.
• VR > 1 but ER is low (0.2–0.4) →
➜ Trend exists but there is a lot of noise, many fake movements. • VR < 1 and ER is low →
➜ Net range / sideways market. Ideal for mean-reversion.


MTF Dashboard Pro v2.3 © 2025 - Sachin ThakareMTF Dashboard Pro v2.3 — A premium multi-timeframe market dashboard created for professional traders.
Features include:
• MTF EMA Trend (9/21)
• MTF 200 MA System with Threshold Logic
• Session-based VWAP (Daily Reset)
• SuperTrend (Corrected Direction Engine)
• RSI / MACD / ADX / Alligator
• Stochastic (Correct Pine Signature)
• Daily PDH / PDL Bias
• 11-Signal Institutional Bias Score
• Trend Strength Classification (Strong Bull → Strong Bear)
• Multi-TF Alerts for Strong Bull / Strong Bear
• Optimized Table Engine & Enhanced Performance
Designed for Scalping, intraday, swing, and high-precision market bias evaluation across 3m → 1M timeframes.
Built & optimized by Sachin Thakare (2025 Edition).
