Smart Buy/Sell Signal IndicatorOverview
The Smart Buy/Sell Signal Indicator is a multi-factor trading tool that i ntegrates Supertrend, Bollinger Bands, RSI, ADX, and Moving Averages to generate high-probability buy and sell signals. Unlike simple crossover-based strategies, this indicator leverages multiple layers of confirmation to reduce false signals and improve trade execution accuracy.
This indicator is designed for trend-following traders, scalpers, and swing traders, helping them identify key reversal points and momentum shifts with precise breakout conditions.
How It Works
The Smart Buy/Sell Signal Indicator filters out weak trade signals by combining trend, volatility, momentum, and strength indicators in the following manner:
✅ Supertrend-Based Trend Filtering:
• The script checks if the price is above or below the Supertrend level before confirming a buy or sell signal.
• Buy signals occur below the Supertrend Down level, confirming support.
• Sell signals occur above the Supertrend Up level, confirming resistance.
✅ Bollinger Bands for Overbought & Oversold Conditions:
• Buy signals are confirmed when price touches the Bollinger Lower Band (suggesting oversold conditions).
• Sell signals are confirmed when price touches the Bollinger Upper Band (suggesting overbought conditions).
• This ensures that trades occur at high-probability reversal zones, rather than random price action.
✅ RSI Momentum Confirmation:
• Buy trades trigger when RSI is below 50 (indicating strength building from an oversold region).
• Sell trades trigger when RSI is above 50 (indicating weakness forming in an overbought region).
• This ensures signals are momentum-backed and not counter-trend moves.
✅ ADX Strength Confirmation:
• The script filters signals using the ADX (Average Directional Index) to ensure that only trades with sufficient market strength are executed.
• If the ADX value is below a threshold (default: 15), the signal is ignored to prevent false breakouts in choppy markets.
✅ Confirmation Moving Average (MA) for Trend Validation:
• The script applies an additional confirmation filter using a Moving Average (SMA/EMA).
• Buy signals trigger only when the price is above the MA, aligning with trend direction.
• Sell signals trigger only when the price is below the MA, ensuring alignment with the broader market structure.
✅ Trade Cooldown Mechanism (Minimum Bars Between Signals):
• To avoid frequent signals in sideways markets, a cooldown period is implemented.
• Default: 5 bars between signals (adjustable).
• Prevents rapid consecutive trades, reducing false entries.
Key Features
✔️ Supertrend & Moving Average Confirmation – Ensures trades are taken only in the correct trend direction.
✔️ Bollinger Bands Integration – Helps identify high-probability reversal zones.
✔️ ADX Strength Filtering – Ensures trades are only executed when the market has enough strength.
✔️ Momentum-Based RSI Filtering – Avoids counter-trend trades and confirms directional strength.
✔️ Trade Cooldown Mechanism – Reduces overtrading and noise in sideways markets.
✔️ Webhook Alerts for Automation – Auto-execute trades or receive real-time notifications.
✔️ Customizable Inputs – Adjustable thresholds, EMA/SMA length, ADX filter, cooldown period for flexibility.
✔️ Works Across Multiple Timeframes – Suitable for scalping (5m, 15m), swing trading (1H, 4H), and position trading (Daily).
How to Use
📌 Scalping & Intraday Trading:
• Use on 5m, 15m, or 30m timeframes.
• Look for Bollinger Band touch + RSI confirmation + Supertrend support/resistance validation before entering trades.
📌 Swing Trading:
• Use on 1H or 4H timeframes.
• Enter only when ADX is strong and price aligns with Supertrend direction.
📌 Webhook Automation:
• Set up TradingView Alerts to auto-execute trades via Webhook-compatible platforms.
Why This Combination?
This indicator is not just a simple moving average crossover tool.
It is designed to filter out weak breakouts and only execute trades that have:
✅ Trend confirmation (Supertrend + Moving Average)
✅ Volatility filtering (Bollinger Bands for overbought/oversold confirmation)
✅ Momentum validation (RSI threshold filtering)
✅ Market strength requirement (ADX ensures sufficient momentum)
This multi-layered approach ensures that only the highest-quality setups are executed, improving both win rate and reliability.
Why It’s Worth Using?
🚀 Reduces False Breakouts – Avoids weak breakouts by requiring ADX confirmation.
🚀 Works in All Market Conditions – Trend-following logic for trending markets, volatility-based entries for reversals.
🚀 Customizable to Any Trading Style – Adjustable parameters for trend, momentum, and strength filtering.
🚀 Seamless Webhook Automation – Execute trades automatically with TradingView alerts.
🚀 Ready to trade smarter?
✅ Add the Smart Buy/Sell Signal Indicator to your TradingView chart today! 🎯🔥
In den Scripts nach "supertrend" suchen

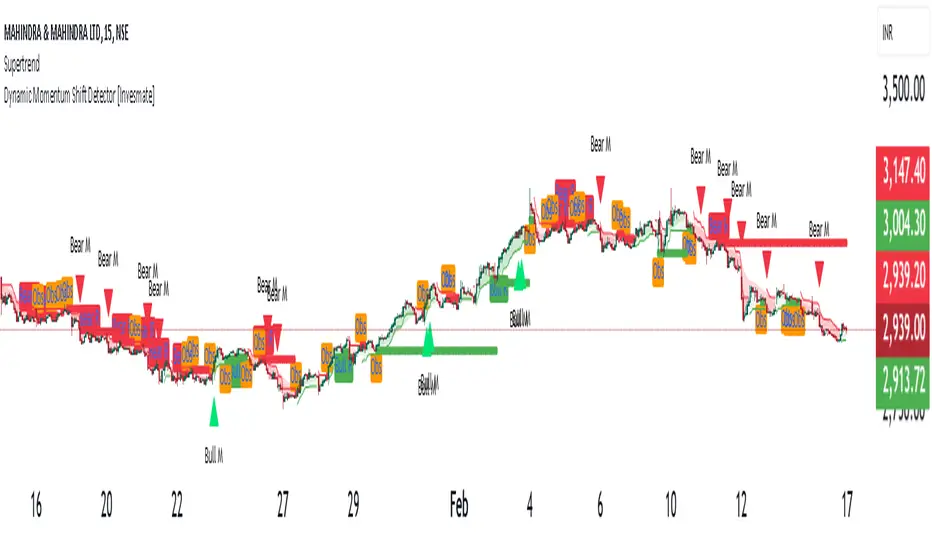
Dynamic Momentum Shift Detector [Invesmate]Dynamic Momentum Shift Detector
Overview
The Dynamic Momentum Shift Detector is an advanced trend-following and momentum-based indicator designed to help traders identify high-probability trading opportunities. It combines RSI-based momentum detection, Supertrend confirmation, and EMA sentiment tracking to provide reliable buy and sell signals.
This indicator is useful for traders who rely on price action and momentum shifts to make informed trading decisions. The goal is to capture early trend reversals while filtering false signals using multiple confirmations.
Key Features & Unique Aspects
RSI (2-Period) for Momentum Detection
Uses an extremely short 2-period RSI to detect overbought (75) and oversold (25) conditions.
Buy Signal: RSI crosses above 25 and price is above the Supertrend line.
Sell Signal: RSI crosses below 75 and price is below the Supertrend line.
Supertrend for Trend Confirmation
A Supertrend (ATR 20, Factor 2) is used to validate the overall market trend.
Prevents false breakouts by ensuring buy signals occur above the Supertrend line and sell signals occur below it.
21-EMA Sentiment Filter
A 21-period Exponential Moving Average (EMA) acts as a market sentiment indicator.
Background color changes for quick visual cues:
Green Fill: Price is above EMA (bullish sentiment).
Red Fill: Price is below EMA (bearish sentiment).
Refined Buy/Sell Confirmation Criteria
To eliminate weak signals, additional price action conditions are applied:
Buy Confirmation: Higher high, bullish close, and strong candle body (>40% of range).
Sell Confirmation: Lower low, bearish close, and strong candle body (>40% of range).
Persistent Buy/Sell Levels
Displays persistent buy and sell levels (green/red dots) on the chart.
These remain active until invalidated by price action.
Bull & Bear Momentum (RSI-8 for Strong Reversals)
Bull M (Green Triangle): RSI (8) crosses above 72 with a strong bullish candle (>60% body).
Bear M (Red Triangle): RSI (8) crosses below 27 with a strong bearish candle (>60% body).
How to Use the Indicator
Buy Setup:
✅ Look for a green "Bull R" signal when:
RSI crosses above 25.
Price is above Supertrend & EMA 21.
Additional confirmation from bullish candle structure.
Sell Setup:
✅ Look for a red "Bear R" signal when:
RSI crosses below 75.
Price is below Supertrend & EMA 21.
Additional confirmation from bearish candle structure.
Observation Signals:
⚠️ "Obs Buy" (Orange Label) → Possible buy setup, but missing confirmation.
⚠️ "Obs Sell" (Orange Label) → Possible sell setup, but missing confirmation.
Momentum Reversal Markers (Strong Buy/Sell Signals)
🔺 "Bull M" (Green Triangle) → Strong bullish momentum shift detected.
🔻 "Bear M" (Red Triangle) → Strong bearish momentum shift detected.
Why This Indicator is Unique & Valuable
✔ Combines multiple indicators (RSI, Supertrend, EMA) with a structured approach.
✔ Avoids false signals by requiring confirmation from price action.
✔ Provides persistent support/resistance levels to track active trades.
✔ Visually clean and easy to use with minimal chart clutter.
This indicator is suitable for swing traders, intraday traders, and positional traders who want high-probability setups with clear trend direction.
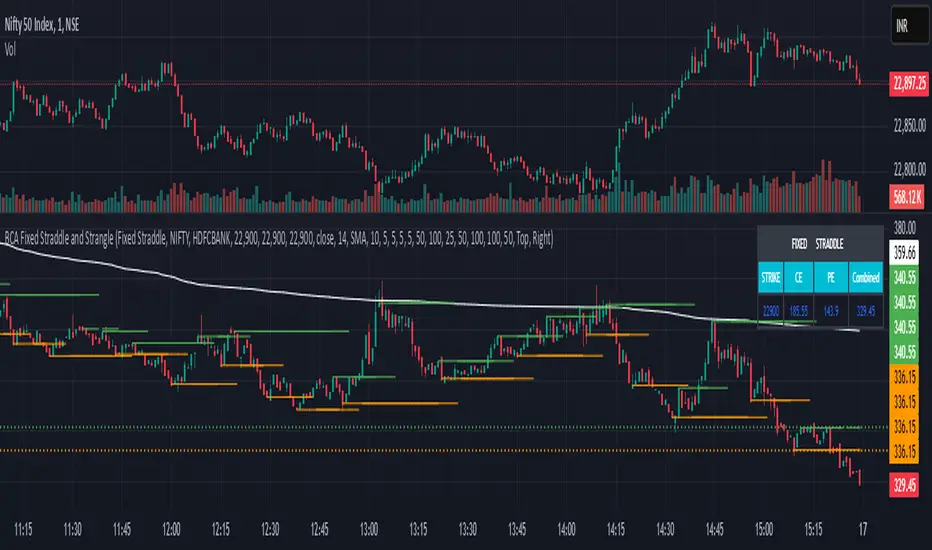
Fixed Straddle with dynamic Res/Sup [BlueChip Algos]Fixed Straddle/Strangle with Dynamic Resistance and Support indicator is designed for options traders focusing on combined straddle and strangle premiums of particular strikes (without rolling). This script offers dynamic charting capabilities with integrated technical indicators, making it a valuable tool for traders in the Indian options market.
About the Indicator
This indicator allows traders to analyze straddle and strangle positions using pre-set strike prices. It dynamically plots resistance and support levels based on price movements using swing HIGHs and LOWs, plots potential stop-loss levels using ATR Stop Loss combined with other customizable indicators like Moving Averages, SuperTrend and VWAP
Features
Straddle and Strangle Analysis: Users can analyze options straddle or custom strangle positions by specifying the exact strike prices for both CE (Call) and PE (Put) options. Please note that one needs to give required strike in all 3 fields mandatorily (Fixes staddle, CE and PE) irrespective of whether you select straddle or strangle in the dropdown.
Dynamic Resistance and Support: The script dynamically adjusts support and resistance levels based on price movements, providing insights into potential price reversal points.
Comprehensive Indicator Suite: Includes popular indicators like Moving Averages, SuperTrend, ATR Stop Loss, and VWAP, each customizable to fit the trader's strategy.
Input Parameters
Chart Type: Choose between "Fixed Straddle" and "Fixed Strangle" for the analysis.
Symbol Selection: Select from various Indian indices such as NIFTY, BANKNIFTY, MIDCAP, FINNIFTY, SENSEX, BANKEX, or input a custom symbol.
Strike Prices: Set the exact strike prices for the fixed straddle or strangle analysis. Note to enter value in all 3 strike fields irrespective of straddle or strangle selection.
Expiry Date: Select the expiry date for the options.
Indicator Settings: Customize each indicator’s parameters, including Moving Averages, SuperTrend, ATR Stop Loss, VWAP, and Swing High/Low levels.
Understanding the Indicator
1. Dynamic Resistance and Support Levels using swing H/Ls
Purpose: This indicator identifies significant swing highs and lows, which are key levels for potential price reversals or continuation.
Parameters:
Swing Length: Number of bars used to confirm swing highs and lows.
How It Works: The Swing High/Low Levels are plotted based on past price action, marking the areas where the price has previously reversed, helping traders set their stop-loss or take-profit levels.
2. VWAP (Volume Weighted Average Price)
Purpose: VWAP provides the average price weighted by volume over a specified period. It is widely used by traders to identify the true average price of a security.
How It Works: VWAP is plotted as a line on the chart, which helps in understanding the price direction in relation to the day's volume-weighted average price.
3. ATR Stop Loss
Purpose: The ATR Stop Loss dynamically adjusts stop-loss levels based on the market’s volatility, calculated through the ATR.
Parameters:
ATR Period: Number of periods over which ATR is calculated.
Multiplier: Factor that determines the distance of the stop-loss from the current price.
How It Works: This indicator adjusts the stop-loss level to protect against large market swings, moving closer or further away based on the ATR value.
4. Moving Average (MA)
Purpose: The Moving Average smooths price data to help identify trends and reversals. It is useful for understanding the overall market direction.
Parameters:
MA Source: Data source for the Moving Average calculation (e.g., Close price).
MA Length: The number of periods used to calculate the Moving Average.
MA Smoothing: The type of smoothing applied, such as SMA, EMA, WMA, or RMA.
5. SuperTrend
Purpose: SuperTrend is a trend-following indicator that helps traders identify the prevailing market trend and potential entry/exit points.
Parameters:
Factor: The multiplier applied to the ATR (Average True Range) for calculating the SuperTrend bands.
ATR Period: The number of periods used for calculating the ATR.
How It Works: The SuperTrend line acts as a support or resistance level. A price above the SuperTrend line indicates a bullish trend, while a price below it indicates a bearish trend.
Golden Swing StrategyBuying Conditions
RSI should be 50 or above
Stochastic %K should be above %D
Day Low Should be below SuperTrend
SuperTrend should remain green before & EOD
SuperTrend should be below Mid Bollinger
Buy next day at open or within 0.5xATR(previous day) of SuperTrend with 1.1ATR SL & 2.2 ATR target
Selling Conditions
RSI should be 50 or below.
Stochastic %K should be below %D
Day high Should be above SuperTrend
SuperTrend should remain Red before & EOD
SuperTrend should be above Mid Bollinger
Sell next day at open or within 0.5xATR (previous day) of SuperTrend with 1.1xATR SL & 2.2x ATR target

BO(strategy)The indicator is easy to use and gives an accurate reading about an ongoing trend. It is constructed with two parameters, namely period and multiplier. The default values used while constructing a superindicator are 10 for average true range or trading period and three for its multiplier.
The average true range (ATR) plays an important role in 'Supertrend' as the indicator uses ATR to calculate its value. The ATR indicator signals the degree of price volatility .
The buy and sell signals are generated when the indicator starts plotting either on top of the closing price or below the closing price. A buy signal is generated when the ‘Supertrend’ closes above the price and a sell signal is generated when it closes below the closing price.
It also suggests that the trend is shifting from descending mode to ascending mode. Contrary to this, when a ‘Supertrend’ closes above the price, it generates a sell signal as the colour of the indicator changes into red.
A ‘Supertrend’ indicator can be used on equities, futures or forex, or even crypto markets and also on daily, weekly and hourly charts as well, but generally, it fails in a sideways-moving market.
Chỉ báo rất dễ sử dụng và đưa ra đọc chính xác về một xu hướng đang diễn ra. Nó được xây dựng với hai tham số, đó là thời gian và số nhân. Các giá trị mặc định được sử dụng trong khi xây dựng một siêu máy tính là 10 cho phạm vi trung bình hoặc thời gian giao dịch trung bình và ba cho hệ số nhân của nó.
Phạm vi trung bình thực (ATR) đóng vai trò quan trọng trong 'Supertrend' khi chỉ báo sử dụng ATR để tính giá trị của nó. Chỉ báo ATR báo hiệu mức độ biến động giá.
Các tín hiệu mua và bán được tạo ra khi chỉ báo bắt đầu âm mưu trên đỉnh của giá đóng cửa hoặc thấp hơn giá đóng cửa. Tín hiệu mua được tạo khi ‘Supertrend giá đóng cửa trên giá và tín hiệu bán được tạo khi đóng cửa dưới giá đóng cửa.
Nó cũng gợi ý rằng xu hướng đang chuyển từ chế độ giảm dần sang chế độ tăng dần. Trái ngược với điều này, khi ‘Supertrend giá đóng cửa trên giá, nó sẽ tạo ra tín hiệu bán khi màu của chỉ báo chuyển sang màu đỏ.
Chỉ báo Sup Supertrend xông có thể được sử dụng trên các cổ phiếu, tương lai hoặc ngoại hối, hoặc thậm chí là thị trường tiền điện tử và cả trên các biểu đồ hàng ngày, hàng tuần và hàng giờ, nhưng nói chung, nó thất bại trong một thị trường đi ngang.

Multitime ATRMulti-Timeframe Supertrend (Multitime ATR) Indicator Description
This indicator, written in Pine Script v5, is a Multi-Timeframe (MTF) Supertrend tool. It provides a multi-faceted market analysis by simultaneously displaying the Supertrend lines from the current chart timeframe and three higher timeframes: the 1-Hour (1H), 4-Hour (4H), and 1-Day (1D).
📌 Key Features and Characteristics
Multi-Timeframe Display:
It overlays the Supertrend lines from the current timeframe, 1H, 4H, and 1D onto a single chart, totaling four timeframes.
By visualizing the higher timeframe trend lines (uptrends as support, downtrends as resistance), traders can determine where the price action on the current chart stands within the context of the larger, dominant trends.
Supertrend Logic:
The Supertrend calculation utilizes the Average True Range (ATR), based on a user-specified ATR Period and ATR Multiplier.
The Change ATR Calculation Method? input allows switching the ATR calculation between the standard ta.atr (EMA-based/smoothed) and ta.sma(ta.tr, Periods) (SMA-based) methods.
Visual Aids:
Trend Lines: Uptrend lines (support) and downtrend lines (resistance) for each timeframe are plotted with different colors and line weights (e.g., Main: Green/Red, 1H: Blue tones, 4H: Purple tones, 1D: Green/Dark Red tones).
Highlighter: A background coloring feature visually highlights the area between the price and the Supertrend lines according to the trend direction for each timeframe, making the trend immediately obvious. This can be controlled collectively by the Master Highlighter setting.
Trend Change Marks: Small circle plots (●) indicate the exact points of trend reversal for each higher timeframe, clearly signaling a shift.
Warning and Break Signals:
The indicator plots signal labels on the chart when the current price breaks (or nearly breaks) a higher timeframe trend line.
Warning (⚠️): Plotted when the price closes below an uptrend line.
Break (⚡): Plotted when the price closes above a downtrend line.
These signals are designed to reset after a certain period (coded as 3,600,000 milliseconds = 1 hour) to prevent continuous noise from repetitive breaks.
Alert Functionality:
In addition to the current timeframe's Buy/Sell signals, the indicator features robust alerts for the Warning/Break signals across the 1H, 4H, and 1D timeframes, ensuring that critical trend changes are not missed.
🛠️ Customization Options
The indicator's settings allow for detailed customization of the following parameters for each timeframe (Main, 1H, 4H, 1D) individually:
ATR Period (ATR Period)
ATR Multiplier (ATR Multiplier)
Visibility toggles for trend lines, signals, and highlighters.
Furthermore, the Master Control section enables simultaneous control over the display of the Highlighter, Signals, Up Trend Lines, and Down Trend Lines across all timeframes.
This indicator serves as a powerful tool for finding more reliable entry and exit points by integrating multi-timeframe trend analysis, which helps reduce false signals often encountered in single-timeframe trading.
Would you like me to elaborate on a specific section of the code, such as the request.security function or the signal logic?

Advanced Trading System - [WOLONG X DBG]Advanced Multi-Timeframe Trading System
Overview
This technical analysis indicator combines multiple established methodologies to provide traders with market insights across various timeframes. The system integrates SuperTrend analysis, moving average clouds, MACD-based candle coloring, RSI analysis, and multi-timeframe trend detection to suggest potential entry and exit opportunities for both swing and day trading approaches.
Methodology
The indicator employs a multi-layered analytical approach based on established technical analysis principles:
Core Signal Generation
SuperTrend Engine: Utilizes adaptive SuperTrend calculations with customizable sensitivity (1-20) combined with SMA confirmation filters to identify potential trend changes and continuations
Braid Filter System: Implements moving average filtering using multiple MA types (McGinley Dynamic, EMA, DEMA, TEMA, Hull, Jurik, FRAMA) with percentage-based strength filtering to help reduce false signals
Multi-Timeframe Analysis: Analyzes trend conditions across 10 different timeframes (1-minute to Daily) using EMA-based trend detection for broader market context
Advanced Features
MACD Candle Coloring: Applies dynamic 4-level candle coloring system based on MACD histogram momentum and signal line relationships for visual trend strength assessment
RSI Analysis: Identifies potential reversal areas using RSI oversold/overbought conditions with SuperTrend confirmation
Take Profit Analysis: Features dual-mode TP detection using statistical slope analysis and Parabolic SAR integration for exit timing analysis
Key Components
Signal Types
Primary Signals: Green ▲ for potential long entries, Red ▼ for potential short entries with trend and SMA alignment
Reversal Signals: Small circular indicators for RSI-based counter-trend possibilities
Take Profit Markers: X-cross symbols indicating statistical TP analysis zones
Pullback Signals: Purple arrows for potential trend continuation entries using Parabolic SAR
Visual Elements
8-Layer MA Cloud: Customizable moving average cloud system with 3 color themes for trend visualization
Real-Time Dashboard: Multi-timeframe trend analysis table showing bullish/bearish status across all timeframes
Dynamic Candle Colors: 4-intensity MACD-based coloring system (ranging from light to strong trend colors)
Entry/SL/TP Labels: Automatic calculation and display of suggested entry points, stop losses, and multiple take profit levels
Usage Instructions
Basic Configuration
Sensitivity Setting: Start with default value 6
Increase (7-15) for more frequent signals in volatile markets
Decrease (3-5) for higher quality signals in trending markets
MA Filter Type: McGinley Dynamic recommended for smoother signals
Filter Strength: Set to 80% for balanced filtering, adjust based on market conditions
Signal Interpretation
Long Entry: Green ▲ suggests when price crosses above SuperTrend with bullish SMA alignment
Short Entry: Red ▼ suggests when price crosses below SuperTrend with bearish SMA alignment
Reversal Opportunities: Small circles indicate RSI-based counter-trend analysis
Take Profit Zones: X-crosses mark statistical TP areas based on slope analysis
Dashboard Analysis
Green Cells: Bullish trend detected on that timeframe
Red Cells: Bearish trend detected on that timeframe
Multi-Timeframe Confluence: Look for alignment across multiple timeframes for stronger signal confirmation
Risk Management Features
Automatic Calculations
ATR-Based Stop Loss: Dynamic stop loss calculation using ATR multiplier (default 1.9x)
Multiple Take Profit Levels: Three TP targets with 1:1, 1:2, and 1:3 risk-reward ratios
Position Sizing Guidance: Entry labels display suggested price levels for order placement
Confirmation Requirements
Trend Alignment: Requires SuperTrend and SMA confirmation before signal generation
Filter Validation: Braid filter must show sufficient strength before signals activate
Multi-Timeframe Context: Dashboard provides broader market context for decision making
Optimal Settings
Timeframe Recommendations
Scalping: 1M-5M charts with sensitivity 8-12
Day Trading: 15M-1H charts with sensitivity 6-8
Swing Trading: 4H-Daily charts with sensitivity 4-6
Market Conditions
Trending Markets: Reduce sensitivity, increase filter strength
Ranging Markets: Increase sensitivity, enable reversal signals
High Volatility: Adjust ATR risk factor to 2.0-2.5
Advanced Features
Customization Options
MA Cloud Periods: 8 customizable periods for cloud layers (default: 2,6,11,18,21,24,28,34)
Color Themes: Three professional color schemes plus transparent option
Dashboard Position: 9 positioning options with 4 size settings
Signal Filtering: Individual toggle controls for each signal type
Technical Specifications
Moving Average Types: 21 different MA calculations including advanced types (Jurik, FRAMA, VIDA, CMA)
Pullback Detection: Parabolic SAR with customizable start, increment, and maximum values
Statistical Analysis: Linear regression slope calculation for trend-based TP analysis
Important Limitations
Lagging Nature: Some signals may appear after potential entry points due to confirmation requirements
Ranging Markets: May produce false signals during extended sideways price action
High Volatility: Requires parameter adjustment during news events or unusual market conditions
Computational Load: Multiple timeframe analysis may impact performance on slower devices
No Guarantee: All signals are suggestions based on technical analysis and may be incorrect
Educational Disclaimers
This indicator is designed for educational and analytical purposes only. It represents a technical analysis tool based on mathematical calculations of historical price data and should not be considered as financial advice or trading recommendations.
Risk Warning: Trading involves substantial risk of loss and is not suitable for all investors. Past performance of any trading system or methodology is not necessarily indicative of future results. The high degree of leverage can work against you as well as for you.
Important Notes:
Always conduct your own analysis before making trading decisions
Use appropriate position sizing and risk management strategies
Never risk more than you can afford to lose
Consider your investment objectives, experience level, and risk tolerance
Seek advice from qualified financial professionals when needed
Performance Disclaimer: Backtesting results do not guarantee future performance. Market conditions change constantly, and what worked in the past may not work in the future. Always paper trade new strategies before risking real capital.

Better Pivot Points [LuminoAlgo]Overview
The Better Pivot Points indicator is an advanced trend analysis tool that combines Supertrend methodology with automated pivot point identification and zigzag visualization. This indicator helps traders identify significant price turning points and visualize market structure through dynamic pivot labeling and connecting lines.
How It Works
This indicator utilizes a Supertrend-based algorithm to detect meaningful pivot points in price action. Unlike traditional pivot point indicators that rely on fixed time periods, this tool dynamically identifies pivots based on trend changes, providing more relevant and timely signals.
The algorithm tracks trend changes using ATR-based Supertrend crossovers to determine when significant highs and lows have formed. When a trend reversal is detected, the indicator marks the pivot point and draws connecting lines to visualize price flow and market structure progression.
Key Features
• Dynamic Pivot Detection: Automatically identifies high and low pivot points using Supertrend crossovers
• Market Structure Labeling: Labels pivots as HH (Higher High), LH (Lower High), HL (Higher Low), or LL (Lower Low)
• Zigzag Visualization: Connects pivot points with customizable lines to clearly show price flow and market structure
• Color-Coded Analysis: Uses distinct colors to indicate bullish trends (green), bearish trends (red), and neutral conditions (yellow)
• Customizable Parameters: Adjustable ATR period, factor, line width, and line style
Input Settings
• ATR Length: Controls the sensitivity of the Supertrend calculation (default: 21)
• Factor: Multiplier for the ATR-based Supertrend bands (default: 2.0)
• Zigzag Line Width: Customize the thickness of connecting lines (1-4)
• Zigzag Line Style: Choose between Solid, Dashed, or Dotted line styles
What Makes This Original
This indicator combines several analytical concepts into a cohesive tool that differentiates it from standard pivot point indicators:
1. Uses Supertrend crossovers as the trigger for pivot detection rather than traditional high/low lookback periods
2. Automatically categorizes market structure using HH/LH/HL/LL labeling system based on pivot relationships
3. Provides real-time zigzag visualization with intelligent color coding that reflects trend direction
4. Integrates trend direction analysis with structural pivot identification in a single comprehensive tool
The underlying calculations use custom logic for tracking trend states, validating pivot points, and determining appropriate color coding based on market structure analysis.
How to Use
1. Trend Identification: Green lines indicate bullish market structure, red lines show bearish structure, yellow indicates transitional periods
2. Support/Resistance: Pivot points often act as future support and resistance levels for price action
3. Market Structure Analysis: HH and HL patterns suggest uptrends, while LH and LL patterns indicate downtrends
4. Entry/Exit Planning: Use pivot points and trend changes to plan potential trade entries and exits
Important Limitations and Warnings
• This indicator is a technical analysis tool and should not be used as the sole basis for trading decisions
• Pivot points are identified after price moves occur, meaning this indicator has inherent lag and cannot predict future pivots
• False signals can occur during ranging or choppy market conditions where trends are unclear
• Past performance of any indicator does not guarantee future results or trading success
• The indicator works best in clearly trending markets and may produce less reliable signals in sideways price action
• This tool requires interpretation and should be combined with other forms of analysis
• Always use proper risk management and position sizing strategies when trading
Why This Script Is Protected
This indicator uses proprietary algorithms for pivot detection timing, trend state management, and market structure analysis that represent original research and development. The specific logic for pivot validation, color-coding methodology, and structural relationship calculations contains unique approaches that differentiate it from standard pivot point indicators available in the public library.
Disclaimer
This indicator is for educational and analysis purposes only and does not constitute investment advice. Trading involves substantial risk and is not suitable for all investors. Past results are not indicative of future performance. The future is fundamentally unknowable and past results in no way guarantee future performance. Always conduct your own research and consider your risk tolerance before making any trading decisions.

NY HIGH LOW BREAKNY HIGH LOW BREAK: A New York Session Breakout Strategy
The "NY HIGH LOW BREAK" indicator is a powerful TradingView script designed to identify and capitalize on breakout opportunities during the New York trading session. This strategy focuses on the initial price action of the New York market open, looking for clear breaches of the high or low established within the first 30 minutes. It's particularly suited for intraday traders who seek to capture momentum-driven moves.
Strategy Logic
The core of the "NY HIGH LOW BREAK" strategy revolves around these key components:
New York Session Opening Range Identification:
The script first identifies the opening range of the New York session. This is defined by the high and low prices established during the first 30 minutes of the New York trading session (from 7:01 AM GMT-4 to 7:31 AM GMT-4).
These crucial levels are then extended forward on the chart as horizontal lines, serving as potential support and resistance zones.
Breakout Signal Generation:
Long Signal: A buy signal is generated when the price breaks above the high of the New York opening range. Specifically, it looks for a candle whose open and close are both above the highLinePrice, and importantly, the previous candle's open was below and close was above the highLinePrice. This indicates a strong upward momentum confirming the breakout.
Short Signal: Conversely, a sell signal is generated when the price breaks below the low of the New York opening range. It looks for a candle whose open and close are both below the lowLinePrice, and the previous candle's open was above and close was below the lowLinePrice. This suggests strong downward momentum confirming the breakdown.
Supertrend Filter (Implicit/Future Enhancement):
While the supertrend and direction variables are present in the code, they are not actively used in the current signal generation logic. This suggests a potential future enhancement where the Supertrend indicator could be incorporated as a trend filter to confirm breakout directions, adding an extra layer of confluence to the signals. For example, only taking long breakouts when Supertrend indicates an uptrend, and short breakouts when Supertrend indicates a downtrend.
Second Candle Confirmation (Possible Future Enhancement):
The close_sec_candle function and openSEC, closeSEC variables indicate an attempt to capture the open and close of a "second candle" (30 minutes after the initial New York open). Currently, closeSEC is used in a specific condition for signal_way but not directly in the primary longSignal or shortSignal logic. This also suggests a potential future refinement where the price action of this second candle could be used for further confirmation or specific entry criteria.
Time-Based Filtering:
Signals are only considered valid within a specific trading window from 8:00 AM GMT-4 to 8:00 AM GMT-4 + 16 * 30 minutes (which is 480 minutes, or 8 hours) on 1-minute and 5-minute timeframes. This ensures that trades are taken during the most active and volatile periods of the New York session, avoiding late-session chop.
The script also highlights the New York session and lunch hours using background colors, providing visual context to the trading day.
Key Features
Automated New York Open Range Detection: The script automatically identifies and plots the high and low of the first 30 minutes of the New York trading session.
Clear Breakout Signals: Visually distinct "BUY" and "SELL" labels appear on the chart when a breakout occurs, making it easy to spot trading opportunities.
Timeframe Adaptability: While optimized for 1-minute and 5-minute timeframes for signal generation, the opening range lines can be displayed on various timeframes.
Customizable Risk-to-Reward (RR): The rr input allows users to define their preferred risk-to-reward ratio for potential trades, although it's not directly implemented in the current signal or trade management logic. This could be used by traders for manual trade management.
Visual Session and Lunch Highlights: The script colors the background to clearly delineate the New York trading session and the lunch break, helping traders understand the market context.
How to Use
Apply the Indicator: Add the "NY HIGH LOW BREAK" indicator to your chart on TradingView.
Select a Relevant Timeframe: For optimal signal generation, use 1-minute or 5-minute timeframes.
Observe the Opening Range: The green and red lines represent the high and low of the first 30 minutes of the New York session.
Look for Breakouts: Wait for price to decisively break above the green line (for a buy) or below the red line (for a sell).
Confirm Signals: The "BUY" or "SELL" labels will appear on the chart when the breakout conditions are met within the active trading window.
Implement Your Risk Management: Use your preferred risk management techniques, including stop-loss and take-profit levels, in conjunction with the signals generated. The rr input can guide your manual risk-to-reward calculations.
Potential Enhancements & Considerations
Supertrend Confirmation: Integrating the supertrend variable to filter signals would significantly enhance the strategy's robustness by aligning trades with the prevailing trend.
Stop-Loss and Take-Profit Automation: The rr input currently serves as a manual guide. Future versions could integrate automated stop-loss and take-profit placement based on this ratio, potentially using ATR for dynamic sizing.
Volume Confirmation: Adding a volume filter to confirm breakouts would ensure that only high-conviction moves are traded.
Backtesting and Optimization: Thorough backtesting across various assets and market conditions is crucial to determine the optimal settings and profitability of this strategy.
Session Times: The current session times are hardcoded. Making these user-definable inputs would allow for greater flexibility across different time zones and trading preferences.
The "NY HIGH LOW BREAK" is a straightforward yet effective strategy for capturing initial New York session momentum. By focusing on clear breakout levels, it aims to provide timely and actionable trading signals for intraday traders.

Band-Zigzag Based Trend FollowerWe defined new method to derive zigzag last month - which is called Channel-Based-Zigzag . This script is an example of one of the use case of this method.
🎲 Trend Following
Defining a trend following method is simple. Basic rule of trend following is Buy High and Sell Low (Yes, you heard it right). To explain further - methodology involve finding an established trend which is flying high and join the trend with proper risk and optimal stop. Once you get into the trade, you will not exit unless there is change in the trend. Or in other words, the parameters which you used to define trend has reversed and the trend is not valid anymore.
Few examples are:
🎯 Using bands
When price breaks out of upper bands (example, Bollinger Band, Keltener Channel, or Donchian Channel), with a pre determined length and multiplier, we can consider the trend to be bullish and similarly when price breaks down the lower band, we can consider the trend to be bearish.
Here are few examples where I have used bands for identifying trend
Band-Based-Supertrend
Donchian-Channel-Trend-Filter
🎯 Using Pivots
Simple logic using zigzag or pivot points is that when price starts making higher highs and higher lows, we can consider this as uptrend. And when price starts making lower highs and lower lows, we can consider this as downtrend. There are few supertrend implementations I have published in the past based on zigzags and pivot points.
Adoptive-Supertrend-Pivots
Zigzag-Supertrend
Drawbacks of both of these methods is that there will be too many fluctuations in both cases unless we increase the reference length. And if we increase the reference length, we will have higher drawdown.
🎲 Band Based Zigzag Method
Band Based Zigzag will help overcome these issues by combining both the methods.
Here we use bands to define our pivot high and pivot low - this makes sure that we are identifying trend only on breakouts as pivots are only formed on breakouts.
Our method also includes pivot ratio to cross over 1.0 to be able to consider it as trend. This means, we are waiting for price also to make new high high or lower low before making the decision on trend. But, this helps us ignore smaller pivot movements due to the usage of bands.
I have also implemented few tricks such as sticky bands (Bands will not contract unless there is breakout) and Adaptive Bands (Band will not expand unless price is moving in the direction of band). This makes the trend following method very robust.
To avoid fakeouts, we also use percentB of high/low in comparison with price retracement to define breakout.
🎲 The indicator
The output of indicator is simple and intuitive to understand.
🎯 Trend Criteria
Uptrend when last confirmed pivot is pivot high and has higher retracement ratio than PercentB of High. Else, considered as downtrend.
Downtrend when last confirmed pivot is pivot low and has higher retracement ratio than PercentB of High. Else, considered as uptrend.
🎯 Settings
Settings allow you to select the band type and parameters used for calculating zigzag and then trend. Also has few options to hide the display.

Tamil | Trend Signal Dashboard for trading“Tamil | Trend Signal in Dashboard” is a multi-confirmation trend and signal tool that combines Supertrend, RSI/ADX trend strength, and dual QQE into one clean dashboard on the chart. It only prints STRONG BUY / STRONG SELL when all components align, and it also gives clear, rule-based exit signals.
⸻
What it uses
• RSI + ADX + ATR trend block
• ADX (with custom length & threshold) to measure trend strength
• +DI / –DI to define bullish or bearish direction
• Optional session filter so signals only appear in your trading window
• Custom Supertrend
• ATR-based bands with adjustable period & multiplier
• Plots trend line on chart and shows Buy/Sell flip labels when Supertrend reverses
• Dual QQE MOD engine
• Two QQE/RSI streams (primary & secondary)
• Bollinger bands around QQE line to confirm true momentum breakouts
• Defines QQE Bullish / Bearish states
• Secondary RSI Histogram logic
• Tracks RSI distance from the 50 line
• Detects “peak & decline” on the histogram for momentum-based exits
⸻
Signals & Exits
• Entry
• Strong Buy: Supertrend bullish + strong ADX + DI bullish + QQE bullish
• Strong Sell: Supertrend bearish + strong ADX + DI bearish + QQE bearish
• Background is softly colored green/red while alignment is active
• Exit (configurable)
• Alignment lost (trend components no longer agree), and/or
• First peak-and-decline in the secondary RSI histogram
• Shows Exit Buy / Exit Sell markers and fires dedicated alerts
⸻
Dashboard & Alerts
A compact table in the top-right shows live status of:
• Supertrend
• ADX value & strength check
• Direction from DI
• QQE state
• Secondary RSI histogram slope
• Overall Alignment and current Signal (Hold / Strong Buy / Strong Sell / Exit)

区间顶底|超级趋势|增强版[彩虹EMA]中文介绍 (English description follows)
【脚本概述】 本指标是一个多功能的综合交易系统,旨在通过结合趋势跟踪、动量反转、关键支撑阻力位以及成交量分析,为交易者提供高胜率的决策辅助。它将多个复杂的分析模块融合在一个简洁的图表中,适合日内交易及波段交易。
【核心功能与计算逻辑】
1. 智能支撑与阻力区间 (Support & Resistance Zones)
· 原理:基于自定义长度(默认130周期)的高低点回溯,结合ATR(平均真实波幅)计算出的动态顶底区间。
· 视觉:紫色区域为阻力区(潜在卖点),绿色区域为支撑区(潜在买点)。
· 信号:当价格触及这些区域并出现反转K线结构时,会给出相应的箭头提示。
2. 超级趋势 (SuperTrend)
· 原理:基于ATR(10周期,3倍乘数)的经典趋势跟踪算法。
· 用途:作为主要的趋势过滤器。背景颜色会随趋势变化(绿色为多头趋势,红色为空头趋势),帮助交易者顺势操作。
3. EMA均线系统
· 配置:包含红、黄、白三条均线。
· 用途:用于判断长期趋势方向。当价格位于均线组上方时,主要寻找做多机会;反之则寻找做空机会。
4. 增强型RSI反转信号
· 红色倒三角 (R):RSI下穿超买线(70),提示顶部回归风险。
· 蓝色正三角 (R):RSI上穿超卖线(30),提示底部回归机会。
· 此信号仅作为辅助确认,建议结合支撑阻力位使用。
5. 爆量K线高亮 (Volume Anomalies)
· 原理:当单根K线的成交量大于过去30根K线平均成交量的2.5倍时,系统会将其判定为“爆量”。
· 视觉:K线实体会被染成明黄色,提示主力资金介入或情绪剧烈波动。
6. 多周期趋势面板 (Dashboard)
· 位置:图表右上角。
· 功能:实时监控从15分钟到日线级别的SuperTrend趋势方向以及成交量状态,帮助交易者进行多周期共振分析。
7. 🔔 智能警报过滤器 - 智能识别报警信号推送提醒
· RSI 回归警报
· 顶底区间警报
· 爆量警报
· 趋势改变警报
· EMA 远离警报
信号提醒设置:选择函数 - 选择webhook - 可通过苹果bark软件 实时手机提醒
【使用策略建议】
· 顺势交易:主要依据SuperTrend背景色和EMA均线方向操作。
· 反转交易:关注价格进入紫色/绿色区间,且同时出现RSI三角形信号或爆量黄色K线时的反转机会。
· 止损设置:建议设置在支撑阻力区间的边缘外侧。
免责声明:本脚本仅用于技术交流和辅助分析,不构成任何投资建议。市场有风险,交易需谨慎。
Overview
This indicator is a comprehensive "All-in-One" trading system designed to assist traders in making high-probability decisions by combining Trend Following, Momentum Reversal, Dynamic Support & Resistance, and Volume Analysis. It integrates multiple analysis modules into a clean chart interface, suitable for both intraday scalping and swing trading.
Core Features & Logic
1. Dynamic Support & Resistance Zones
· Logic: Automatically detects dynamic tops and bottoms based on Pivot High/Low lookback combined with ATR volatility.
· Visuals: Purple zones indicate Resistance (potential sell zones), and Green zones indicate Support (potential buy zones).
· Signals: Arrows appear when price touches these zones and shows a reversal structure.
2. Enhanced SuperTrend
· Logic: Uses a classic ATR-based trend following algorithm to filter market noise.
· Usage: Acts as the primary trend filter. The background color changes with the trend (Green for Bullish, Red for Bearish) to help traders stay on the right side of the market.
3. EMA System
· Configuration: Includes three specific EMA lines configured to identify medium to long-term trends.
· Usage: Used to determine the broader market direction. Look for long setups when price is above the EMAs, and short setups when below.
4. Enhanced RSI Reversal Signals
· Red Triangle (R): RSI crosses under the Overbought threshold, suggesting a risk of a top/pullback.
· Blue Triangle (R): RSI crosses over the Oversold threshold, suggesting a potential bottom/bounce.
· Note: These signals are best used as confirmation near Support & Resistance zones.
5. Volume Anomalies (High Vol Highlight)
· Logic: Identifies "Explosive Volume" when the current candle's volume is significantly higher than the average volume.
· Visuals: The candle body is highlighted in bright Yellow, indicating institutional activity or extreme emotional volatility.
6. Multi-Timeframe Dashboard
· Location: Top right corner of the chart.
· Function: Real-time monitoring of SuperTrend direction and Volume status across multiple timeframes, facilitating multi-timeframe confluence analysis.
7. 🔔 Smart Alerts System
Includes fully customizable alert conditions compatible with webhooks (e.g., Bark, Telegram):
· RSI Mean Reversion Alerts
· Support/Resistance Bounce Alerts
· Explosive Volume Alerts
· Trend Change Alerts
· EMA Pullback/Leaving Alerts
Strategy Recommendations
· Trend Trading: Follow the SuperTrend background color and EMA direction.
· Reversal Trading: Look for entries when price hits a Purple/Green zone AND triggers an RSI Triangle or High Volume candle.
· Stop Loss: Recommended to be placed just outside the edges of the S&R zones.
Disclaimer: This script is for educational and technical exchange purposes only and does not constitute investment advice. Trading involves risk.

Piku Pips📌 Piku Pips — Multi-Confluence Smart Signal System (EMA + Supertrend + Volume Profile + ATR Trailing + SR + RSI Climax Engine)
Piku Pips is a complete multi-confluence trading system designed for scalpers, intraday traders, and swing traders who rely on precision entries and institutional-grade confirmation layers.
This indicator combines trend, momentum, volatility, volume imbalance, structure breaks, smart money pivots, and exhaustion events—into a single unified charting system.
It does NOT repaint, supports alerts, and works across all assets (crypto, forex, indices, stocks).
🔥 What Makes This Indicator Special?
Piku Pips is built on stacked confluences instead of single-indicator signals.
Each signal is only printed when multiple conditions align, significantly increasing accuracy and reducing noise.
It includes:
✔ Trend Identification
Fast & Slow EMA cross
SuperTrend with custom ATR & factor
Parabolic SAR for micro-trend confirmation
ATR-based trailing stop engine (dual version for Buy & Sell)
✔ Momentum Confirmation
RSI Midline model
HH/LL structure detection
Bull/Bear volume imbalance model
✔ Smart Volume Analysis
Bullish vs Bearish VWMA volume
Flat-volume filters
RSI + Volume Spike + MFI exhaustion detection (Climax Module)
✔ Institutional Structure Mapping
Dynamic Support & Resistance
Automatic Zone Strength Ranking
Breakout detection with zone coloring
Pivot-based structure scanning
✔ Exhaustion + Divergence Engine (Climax Module)
RSI / Stochastic RSI hybrid
Macro trend smoothing (EMA/RMA/SMA/WMA selectable)
High-precision RSI divergence detection (HH/LH and LL/HL)
Volume spike detection
Buy Climax (potential top)
Sell Climax (potential bottom)
This module acts like a “smart momentum brain” that identifies major reversals.
🎯 Signal Logic (Simplified)
🔹 Buy Signal (Green Triangle)
Triggered when:
Fast EMA crosses above Slow EMA
Higher High structure forms
RSI > midline or crosses above it
Volume profile is bullish
SuperTrend is bullish (direction < 0)
🔹 Sell Signal (Red Triangle)
Triggered when:
Fast EMA crosses below Slow EMA
Lower Low structure forms
RSI < midline or crosses below it
Volume profile is bearish
SuperTrend is bearish (direction > 0)
🔸 Secondary ATR Signals (Orange & Maroon)
Uses Heikin-Ashi ATR trailing stop
Detects micro-shifts in trend momentum
Works excellent in scalping timeframes
🧠 Support & Resistance Engine
The script builds dynamic SR zones based on:
Pivot clustering
Channel width filtering
Strength scoring
Automated sorting and plotting
Zones:
Red tint = Resistance
Green tint = Support
Gray tint = Neutral / In-Play
Alerts trigger on clean SR breaks.
⚡ Climax Module (Exhaustion System)
This system overlays major exhaustion points:
🔻 Buy Climax
High-volume upward exhaustion → potential top.
🔺 Sell Climax
High-volume downward exhaustion → potential bottom.
🔼 RSI Divergences
Bullish divergence labeled "RSI⬆"
Bearish divergence labeled "RSI⬇"
Combined, these give early insight into possible reversals.
🛠 Inputs Overview
📌 Trend Inputs
Fast EMA Length
Slow EMA Length
SuperTrend ATR + Factor
SAR multipliers
Buy/Sell ATR trailing stop parameters
📌 Momentum Inputs
RSI length / midline
Bull/Bear volume variance filter
HH/LL confirmation
📌 Structure Inputs
Pivot sensitivity
Max SR Zones
Loopback length
Zone strength minimum
📌 Climax Module Inputs
RSI / Stochastic lengths
Smoothing method (EMA, SMA, RMA, WMA)
Macro trend slope settings
Pivot sensitivity for divergence
Volume spike multiplier
MFI thresholds
Bull/Bear RSI levels
📈 How to Use Piku Pips
Best Use-Cases:
Scalping (1m–15m)
Intraday (15m–1H)
Swing trading (4H–1D)
Crypto / Forex / Indices / Stocks
Recommended Approach
Trade in direction of EMA + Supertrend + Macro RSI regime.
Enter when Piku Buy/Sell signal aligns with the trend.
Use SR zones as targets or invalidation levels.
Watch Climax signals for tops & bottoms.
Use divergence signals for early reversals.
🔔 Alerts Included
Buy Signal
Sell Signal
ATR Buy / Sell
Buy Climax
Sell Climax
RSI Divergence (bullish & bearish)
All-Signals alert
⚠️ Disclaimer
This indicator is created for educational purposes only and does not constitute financial advice.
Trading involves risk. Do your own research and backtesting before using any tool in live markets.
Timeframe Fast EMA Slow EMA ATR Period Factor RSI Length Overbought/Oversold
5 Min 9 21 10 2 8 80 / 20
15 Min 10 25 10 2.5 10 75/25
1 Hour 20 50 14 3 12 70/30
4 Hour 21 50 14 3 14 70/30
1 Day 20 100 14 3.5 14 70/30
Please use this settings for accurate results

Institutional Sessions Volume Order Flow [SumitQuants]Institutional Sessions Volume Order Flow
🔥 Institutional Sessions Volume Order Flow — The all-in-one Pine v6 toolkit that reveals institutional volume order blocks, session structure, VWAP bands and trend ribbon so you can trade with professional conviction.
🎯 See where smart money is active. Institutional Sessions Volume Order Flow surfaces high-volume order blocks, session boxes, VWAP bands, MA ribbon and Supertrend alerts — a single overlay that turns market noise into tradable structure. ⚡📈
✨ Key Features
📦 Institutional Volume Order Blocks: Detects bullish & bearish order blocks by aggregating volume around local highs/lows and plots filled zones with volume-percent labels.
🕒 Session Boxes & Timeline: Auto session boxes for Asia/ Europe / NewYork / Sydney with merge options, open/close lines, pip/% labels and optional candle coloring.
📉 VWAP with Bands: Multi-anchor VWAP (Session/Week/Month/Quarter/Year/Earnings/Dividends/Splits) plus up to 3 configurable bands (SD or % mode) and fills.
🧭 Moving Average Ribbon: 4-MA ribbon (SMA/EMA/SMMA/WMA/VWMA) for trend structure and dynamic S/R.
⚡ Supertrend Overlay: Optional Supertrend with conditional background fill and built-in trend-change alert hooks.
🔔 Prebuilt Alerts: Supertrend flips, session opens, session new highs/lows — ready for automation or notifications.
⚙️ Deep Customization: Colors, styles, lookback, merge behaviors, band multipliers, anchor periods, session times, label sizes, and more.
🛠 Pine v6 Optimized: Modern, overlay-ready Pine Script v6 implementation suitable for intraday and multi-timeframe use.
🧠 Why Traders Buy It
🔍 Institutional context: Volume-weighted order blocks reveal where large participants acted — crucial for high-probability trade planning.
✅ Stacked confirmation: Ribbon → VWAP → order block filters noise and aligns entries with institutional flow.
🌐 Session clarity: Quickly identify which market session is driving price and volatility.
📣 Actionable alerts: Be notified exactly when setups trigger so you don’t miss transitions.
🧩 Versatile: Great for scalpers, intraday momentum traders, swing traders, prop desks and system developers.
🚀 Quick Start (3 steps)
Add Institutional Sessions Volume Order Flow to your chart (Pine v6).
Enable Order Blocks + VWAP + Supertrend to begin.
Tune session times and band/MA settings for your instrument and timeframe. Use Supertrend + ribbon alignment + zone retest for higher-probability entries. 🎛️
🧾 Technical Notes & Compatibility
📜 Pine Script v6 — compatible with TradingView’s current scripting environment.
📌 Overlay indicator — draws directly on price chart.
🔔 Alerts use alertcondition hooks for TradingView notifications.
👤 Author: Created and maintained by SumitQuants.
⚠️ Risk Disclaimer
This tool provides context and signals — not guarantees. Backtest, paper trade, and use responsible risk management. Past performance is not indicative of future results. 📉
🛒 Call to Action (CTA)
Ready to trade with institutional clarity?
👉 Buy Institutional Sessions Volume Order Flow now — or message for a demo, custom tweaks, or a bundle including backtest/strategy code. Quick support and configuration help included. 💬
Reach out to the website and Buy This Indicator in the Courses Section www.ironmindtrader.com

Phase Coherence Index (PCI) — Hilbert Prototype v0.1Phase Coherence Index (PCI) — Hilbert Prototype v0.1
✨ Concept:
The Phase Coherence Index (PCI) measures the degree of phase alignment among multiple trend components derived from band-filtered price signals.
In simpler terms, PCI quantifies how “in-sync” short, mid, and long-term market oscillations are.
A high PCI (values near 100) means the market’s cyclical components are moving together — a state of phase alignment that typically accompanies sustained, directional trends.
A low PCI (values near 0) indicates phase disorder or divergence between timeframes — often seen during transitions, chop, or volatility compression phases.
✨ How it works:
1. Multi-Band Extraction
The price series is decomposed into three frequency bands using a simple EMA-difference
bandpass filter:
Short-term band
Mid-term band
Long-term band
2. Hilbert Quadrature Approximation
For each band, a Hilbert-style quadrature signal (Q) is estimated using an Ehlers-inspired FIR kernel with coefficients h0=0.0962 and h1=0.5769.
The original bandpass (I) and its quadrature (Q) form a complex phasor that carries instantaneous phase information.
3. Phase Extraction
The arctangent of Q/I gives the phase angle (−π to π).
Each band’s phase represents the “timing” of its oscillation relative to price movement.
4. Coherence Calculation
All three band phases are converted to unit phasors (cos φ, sin φ).
The average of these phasors is taken, and the magnitude of the resulting vector defines the PCI value:
PCI = |mean_phasor| × 100
PCI = 100 → perfect phase alignment
PCI = 0 → complete phase randomness
5. Smoothing and Regime Coloring
The raw PCI is lightly smoothed by EMA to stabilize readings.
A simple SuperTrend regime filter (ATR length 5, factor 6) colors the PCI line:
Green: uptrend regime
Red: downtrend regime
Gray: low-coherence or neutral zone
✨ How to interpret PCI
High PCI (≥70):
Indicates strong phase coherence — multi-timeframe alignment, stable directional energy.
Often coincides with trend persistence or mature momentum phases.
Low PCI (≤30):
Suggests phase dispersion or regime transition — signals are desynchronized across bands.
Common near reversals, volatility compressions, or sideways congestion.
Cross-phase Transitions:
Rapid drops in PCI often precede periods of uncertainty or trend fatigue.
Rising PCI after a contraction suggests emerging order or trend formation.
✨ Visualization
PCI Line:
Displays phase coherence magnitude (0–100).
Color changes dynamically with SuperTrend regime.
Dotted Reference Levels:
70 (high coherence), 30 (low coherence), 50 (midline).
Optional Label:
When PCI is high, a text label appears indicating whether the average phase bias leans bullish or bearish.
✨ Practical Use
Combine PCI with momentum or volatility tools (e.g., RSI, ATR, DFI) to detect when multiple timeframes become synchronized.
Use PCI drops (<30) as early warnings for possible trend exhaustion or market disorder.
Use PCI rises (>70) as confirmation of trend continuation or emerging coherence.
✨ Limitations
PCI measures phase alignment, not directional bias. It should be combined with a directional filter (e.g., SuperTrend, slope, or moving average).
The Hilbert approximation is not a true analytic signal, but a real-time proxy optimized for stability.
PCI is best interpreted as a structural context indicator rather than a direct entry signal.
✨ Educational intent
This script is designed for quantitative study and visualization of phase alignment, not for direct trading advice.
It demonstrates how Hilbert-style phasors and vector averaging can reveal coherence across timescales — a foundational concept for spectral, cyclical, and structural analysis.
✨ Disclaimer
This script is provided for educational purposes only.
It does not constitute financial advice.
Trading involves risk; use at your own discretion.
© 2025 Trading Playground Labs — “Phase Coherence Index (Hilbert Prototype v0.1)
───────────────────────────────
📘 한국어 설명 (Korean translation below)
───────────────────────────────
Phase Coherence Index (PCI) — Hilbert Prototype v0.1 (한국어 설명)
✨ 개념
Phase Coherence Index (PCI) 는 여러 주기의 추세 구성 요소들 간에 위상의 정합 정도를 측정하는 지표입니다.
쉽게 말하면, 시장의 단기·중기·장기 진동(사이클)들이 서로 얼마나 “같은 박자”로 움직이는지를 수치화한 것입니다.
PCI 값이 100에 가까울수록 시장의 주기적 구성 요소들이 함께 움직이고 있다는 뜻이며,
이는 일반적으로 지속적인 방향성 추세(trend persistence) 상태를 의미합니다.
반대로 PCI 값이 0에 가까울수록 각 주기의 움직임이 서로 엇박자 상태로 흐르며,
이는 전환기(chop), 혼돈(chaos), 혹은 압축(squeeze) 상태를 반영합니다.
✨ 작동 원리
1. 다중 밴드 추출
가격 데이터를 3개의 주파수 대역으로 분리합니다.
단기 (short-term band)
중기 (mid-term band)
장기 (long-term band)
각 대역은 빠른 EMA와 느린 EMA의 차이(EMA difference)로 얻은 단순한 밴드패스로 계산됩니다.
2. Hilbert 직교 성분 근사
각 밴드에 대해 Ehlers 계열 FIR 필터를 이용한 Hilbert 근사 신호(Q)를 계산합니다.
원본 밴드패스 신호(I)와 Q를 결합하면 복소 위상(phasor) 를 구성할 수 있고,
이를 통해 각 대역의 순간 위상(instantaneous phase) 을 추정합니다.
3. 위상 계산
Q/I의 아크탄젠트 값을 구하면 위상각 φ(−π ~ π)가 도출됩니다.
이 위상은 해당 주기의 진동 타이밍을 나타냅니다.
4. 위상 정합(Phase Coherence) 계산
각 밴드의 위상을 단위 페이저 벡터 (cos φ, sin φ)로 변환합니다.
세 벡터의 평균을 구하고, 그 평균 벡터의 크기를 0~100 스케일로 변환한 값이 PCI입니다.
PCI = |평균 페이저| × 100
PCI = 100 → 완전한 위상 일치
PCI = 0 → 완전한 위상 무질서
5. 스무딩 및 추세 컬러링
계산된 PCI는 EMA로 약간 평활화되어 안정적으로 표시됩니다.
또한, SuperTrend 레짐 필터(ATR=5, Factor=6) 로 추세 방향에 따라 색이 바뀝니다:
초록색: 상승 추세
빨간색: 하락 추세
회색: 저정합 / 중립 구간
✨ 해석 방법
PCI ≥ 70 (높은 정합)
여러 타임프레임이 같은 방향으로 동기화되어 있는 상태입니다.
이는 추세 지속성, 모멘텀 유지, 구조적 안정 상태를 의미합니다.
PCI ≤ 30 (낮은 정합)
각 주기 간 위상 불일치가 심해지며, 시장이 방향을 잃거나 변곡점에 근접한 상황입니다.
보통 조정기, 변동성 축소, 횡보 국면에서 자주 나타납니다.
급격한 변동 (Phase Transition)
PCI가 급격히 하락하는 구간은 추세 피로(trend fatigue) 또는 혼돈 국면 진입의 신호일 수 있으며,
이후 PCI가 상승하기 시작하면 새로운 질서(추세 형성) 가 시작될 가능성을 의미합니다.
✨ 시각화 구성
PCI 라인:
위상 정합도의 크기(0~100)를 표시합니다.
SuperTrend 방향에 따라 색이 동적으로 변합니다.
점선 기준선:
70(높은 정합), 50(중간), 30(낮은 정합) 기준으로 시각화됩니다.
평균 위상 라벨:
PCI가 높을 때, 평균 위상의 방향이 상승(bullish) 인지 하락(bearish) 인지를 라벨로 표시합니다.
✨ 활용 방법
RSI, ATR, DFI 등 다른 모멘텀/변동성 지표와 함께 사용하면, 복수 타임프레임 동기화 구간을 탐지할 수 있습니다.
PCI 하락(30 이하)은 추세 피로 또는 혼돈 진입의 신호로, PCI 상승(70 이상)은 질서 회복 또는 추세 지속의 신호로 해석할 수 있습니다.
추세 전환, 조정, 또는 모멘텀 재편성 구간을 감지하는 데 유용합니다.
✨ 한계점
PCI는 방향성(Direction)을 직접 측정하지 않고, 구조적 정합(Alignment) 만 측정합니다. 따라서 반드시 방향 필터(SuperTrend, MA 기울기 등)와 함께 해석해야 합니다.
Hilbert 근사는 완전한 복소 해석 신호가 아니라, 실시간 안정성을 중시한 근사 모델입니다.
PCI는 진입 시그널용보다는 시장 구조 인식용 보조 지표로 적합합니다.
✨ 교육적 목적
이 스크립트는 위상 정합(phase coherence) 개념의 시각화와 정량적 연구를 위한 목적으로 설계되었습니다.
힐버트 변환 기반 위상 벡터(phasor) 와 벡터 평균화(vector averaging) 의 개념을 통해
시장의 다중 시간 구조 간 일관성(coherence)을 탐색할 수 있습니다.
✨면책
이 지표는 교육 목적으로만 제공됩니다.
투자 조언이 아니며, 모든 트레이딩 결정의 책임은 사용자에게 있습니다.
© 2025 Trading Playground Labs — Phase Coherence Index (Hilbert Prototype v0.1)
Developed for structural & spectral analysis of market phase alignment.

Directional Flow Index (DFI) — v2.4Directional Flow Index (DFI) — v2.4
✨ 1) What DFI measures (conceptual)
DFI aims to quantify directional flow —i.e., whether trading activity is skewed toward buying (supportive pressure) or selling (resistive pressure) —and then present it as a normalized oscillator that is easy to compare across symbols and timeframes. It is designed to highlight high-confidence thrusts within a prevailing trend and to detect fatigue as momentum decays.
Positive DFI (> 0) : net buy-side pressure dominates.
Negative DFI (< 0) : net sell-side pressure dominates.
Magnitude reflects intensity after de-trending and Z-score normalization.
While multiple “flow” proxies exist, this version emphasizes a True Volume Delta (TVD) workflow (default) that tallies buy vs. sell volume from a lower timeframe (LTF) inside an anchor timeframe bar, producing a more realistic per-bar delta when supported by the symbol’s data.
✨ 2) Core pipeline (how it works)
Flow construction (TVD default).
Using ta.requestVolumeDelta(LTF, Anchor), the script approximates up-volume vs. down-volume inside each anchor bar.
A per-bar delta is derived (with a reset on anchor switches to avoid jumps).
If TVD is unsupported on the symbol, DFI can fall back to synthetic proxies (e.g., Synthetic Delta Volume: (close-low)/(high-low) × vol), but TVD is the intended default.
CVD-style accumulation.
Per-bar delta is cumulatively summed into a running flow line (CVD-like), providing temporal context to the net pressure.
High-pass de-trending + smoothing.
A high-pass step (EMA-based) removes slow drifts (trend bias) from the CVD line.
A short EMA smoothing reduces noise while preserving thrust.
Z-score normalization.
The de-trended series is standardized (rolling mean/std), so DFI readings are comparable across markets/timeframes.
The Signal line is an EMA of DFI and is used for momentum cross checks.
SuperTrend (regime filter).
A lightweight SuperTrend (ATR len=5, factor=6 by default) provides up/down regime.
DFI coloring and alerts can be conditioned on the regime (optional).
Fatigue % (0–100).
Tracks energy (EMA of |DFI|) vs. peak energy (with adaptive half-life decay).
When energy stays far below the decaying peak, Fatigue% rises, suggesting momentum exhaustion.
The decay rate adapts to DFI volatility and regime alignment, so decay is faster when thrusts are misaligned with trend, slower when aligned and orderly.
Gradient highlight (confidence shading).
Histogram color transparency blends three ingredients:
DFI strength (|DFI| vs user-set bands)
Low fatigue (fresher thrusts score higher)
Regime alignment (DFI sign vs SuperTrend direction)
Result: darker bars indicate higher confidence in thrust quality; faint bars warn of weaker, stale, or misaligned pushes.
✨ 3) Interpreting the plots
DFI histogram (columns):
Green above zero for buy-side thrust, Red below zero for sell-side thrust.
Opacity encodes confidence (darker = stronger alignment & lower fatigue).
Signal (line): EMA of DFI used for momentum regime checks.
Zero line: structural reference for thrust crossovers.
Fatigue Table (optional): shows Fatigue%, SuperTrend regime, and selected Flow Method.
✨ 4) Alerts (examples)
Long Thrust: DFI crosses above zero while in Up regime.
Short Thrust: DFI crosses below zero while in Down regime.
Loss of Momentum (Up): DFI crosses below Signal while DFI > 0 (warns of weakening long thrust).
Loss of Momentum (Down): DFI crosses above Signal while DFI < 0 (warns of weakening short thrust).
✨ 5) How to set the TVD Lower TF (important)
TVD needs a sensible LTF/Anchor ratio for balanced accuracy and performance. As a rule of thumb, aim for ~30–120 LTF bars inside one anchor bar:
1h chart → 1–2m LTF (if seconds not available).
4h → 3–5m.
1D → 15–30m.
1W → 1–2h.
1M → 4h–1D.
Notes: Some symbols/exchanges do not provide seconds. Too small an LTF can be heavy/noisy; too large becomes coarse/laggy.
✨ 6) Practical usage patterns
Trend-following entries:
Look for DFI > 0 in Up regime (green) with low Fatigue%, and DFI crossing above zero or above its Signal.
Prefer darker (higher-confidence) histogram bars.
Trend-following exits / de-risking:
Rising Fatigue% toward your high threshold (e.g., 80–90) suggests exhaustion.
DFI vs Signal crosses against your position can be used to scale down.
Avoid chop:
When DFI oscillates around zero with faint bars and Fatigue% rises quickly, quality is low—be selective.
✨ 7) Inputs (summary)
Flow Method: default True Volume Delta (LTF scan); synthetic fallbacks available.
Processing: Detrend length, smoothing EMA, Z-score window, Signal EMA.
Regime: SuperTrend ATR length & factor (default 5 & 6).
Fatigue%: EMA length, base half-life, adaptive volatility coupling (enable/disable, sensitivity).
UI Highlight: strength thresholds, fatigue cap, alignment weights, opacity range.
Table: toggle Fatigue table, decimals, position.
✨ 8) Compatibility & performance notes
TVD requires supported data for the symbol; if unavailable, DFI can switch to synthetic deltas.
Smaller LTFs increase request load and may introduce noise; prefer a balanced ratio.
The indicator is designed to be self-contained; no other overlays are needed to read the outputs.
✨ 9) Limitations and good practice
This is an oscillator, not a price predictor. Extreme values can persist in strong trends.
Normalization (Z-score) makes values comparable, but distributions differ across assets/timeframes.
Always combine with risk management and position sizing; avoid interpreting any single condition as a guarantee.
✨ 10) Disclaimer
This script is for educational purposes only and does not constitute financial advice. Trading involves risk, including possible loss of principal.
---------------------------------------------------------------------------------------------------------------------
한국어 번역 / Korean version below
✨DFI란 무엇인가?
DFI는 시장의 매수·매도 우위를 Flow(흐름) 형태로 분석하여
그 에너지를 정규화된 오실레이터로 표현하는 지표입니다.
가격의 단순 변동이 아니라, “얼마나 일관성 있는 압력(Flow)이 유지되는가”를 보여줍니다.
DFI > 0: 매수세 우위 (상방 압력)
DFI < 0: 매도세 우위 (하방 압력)
값의 크기: 모멘텀의 강도 (Z-score 기반 정규화)
기본 방식인 True Volume Delta (TVD) 는 상위 봉(Anchor) 내부의 하위 타임프레임(LTF) 데이터를 스캔해
실제 매수/매도 체결량 차이를 계산합니다.
이로써 단순 가격 변화가 아닌 실제 체결 흐름의 방향성을 반영합니다.
✨DFI의 계산 과정 (개념적 흐름)
1. Flow 계산 (TVD 또는 대체 방식)
ta.requestVolumeDelta()를 사용하여 상·하위 TF간 볼륨 델타를 계산합니다.
TVD 미지원 심볼은 자동으로 Synthetic Delta Volume 등 대체 방식으로 전환됩니다.
2. 누적(CVD) 구성
Flow를 CVD처럼 누적하여 순매수/순매도 압력을 누적 추적합니다.
3. 고역통과(High-pass) 필터
누적 흐름(CVD)에서 장기 추세 성분을 제거하여 순수한 변동 에너지만 남깁니다.
4. Z-score 정규화
평균과 표준편차로 표준화해 DFI의 크기를 **일정한 스케일(0 중심)**로 만듭니다.
다른 종목·시간대 간 비교가 용이합니다.
5. SuperTrend 레짐(추세 상태) 인식
ATR 기반 ST(기본: Length=5, Factor=6)를 통해 시장이 상승/하락/중립 중 어디에 있는지를 감지합니다.
DFI 컬럼 색상 및 알림은 이 ST 방향에 따라 동작합니다
6. Fatigue% (피로도 지수)
최근 에너지 평균과 역사적 피크(감쇠)를 비교해 0~100%로 “신선도”를 표현합니다.
높을수록 피로한 상태, 낮을수록 신선한 추세.
또한 변동성과 정렬 여부에 따라 Adaptive Half-Life로 감쇠 속도가 자동 조정됩니다.
7. 그라디언트 하이라이트 (Gradient Highlight)
DFI 강도(|DFI|), Fatigue%, 레짐 정렬 상태를 종합해 히스토그램의 투명도를 연속적으로 변화시킵니다.
강하고 신선하며 정렬된 추세일수록 더 진하게 표시, 반대로 약하거나 피로한 구간은 흐리게 표시됩니다.
✨DFI 차트 해석법
DFI 히스토그램 (컬럼):
위로 향한 초록색 = 매수 우위,
아래로 향한 빨강색 = 매도 우위.
진할수록 “신뢰도 높은 흐름(Aligned + Low Fatigue)”
흐릴수록 “노이즈성 움직임 / 피로 구간”
Signal 선:
DFI의 EMA.
DFI와의 교차는 모멘텀 전환 신호로 사용.
Zero 선:
추세 전환의 기준선.
Fatigue Table:
Fatigue%, Regime, Flow Method 정보를 실시간 표시.
✨알림 조건 (Alerts)
DFI Long Thrust: 상승 레짐에서 DFI가 0 위로 돌파.
DFI Short Thrust: 하락 레짐에서 DFI가 0 아래로 돌파.
Loss of Momentum (Up): DFI>0 상태에서 Signal 아래로 하락.
Loss of Momentum (Down): DFI<0 상태에서 Signal 위로 상승.
TVD (True Volume Delta) 설정 가이드
TVD는 Anchor:LowerTF = 약 30~120배 비율이 가장 효율적입니다.
1시간봉 -> 30초~2분
4시간봉 -> 2~8분
일봉(1D) -> 12~48분
주봉(1W) -> 1~4시간
월봉(1M) -> 4시간~ 1일
참고:
일부 거래소는 초 단위를 지원하지 않습니다 → 분 단위로 대체.
너무 짧은 LTF → 과부하/노이즈,
너무 긴 LTF → 신호 지연/정밀도 저하.
✨활용 전략 예시
추세 추종 (Trend-following):
Up Regime에서 DFI>0 & Fatigue% 낮을 때 롱 신호 우선.
DFI가 Signal 위로 돌파하는 시점이 thrust 시작점.
리스크 축소 (De-risking):
Fatigue%가 80~90 이상이면 추세 과열로 간주.
DFI가 Signal을 역방향으로 교차 시 포지션 축소 고려.
횡보 회피:
DFI가 0선 부근에서 얕게 진동하며 흐릿하게 표시될 때는
방향성이 약한 구간 → 진입 회피.
✨한계 및 권장 사용법
TVD는 심볼/거래소의 지원 여부에 따라 제한될 수 있습니다.
Z-score 정규화로 수치 간 비교는 용이하지만, 자산마다 분포 특성이 달라 절대값 해석은 주의 필요.
Fatigue%는 “모멘텀 신선도” 개념이지, 반전 타이밍이 아닙니다.
리스크 관리 및 전략적 컨텍스트 안에서 사용하세요.
✨면책 (Disclaimer)
이 스크립트는 교육용 도구(Educational purpose)이며,
투자 조언(Financial advice)이 아닙니다.
모든 트레이딩에는 손실의 위험이 있으며,
DFI의 신호나 수치가 수익을 보장하지 않습니다.
✨정리
DFI는 단순한 “추세 오실레이터”가 아니라,
에너지의 흐름 + 피로도 + 레짐 정렬이라는 3요소를 결합해
“지속 가능한 방향성”을 시각적으로 표현하는 지표입니다.
즉, 단순한 ‘방향’이 아니라 “추세의 질(Quality)”을 보여주는
새로운 형태의 Flow 분석 도구입니다.

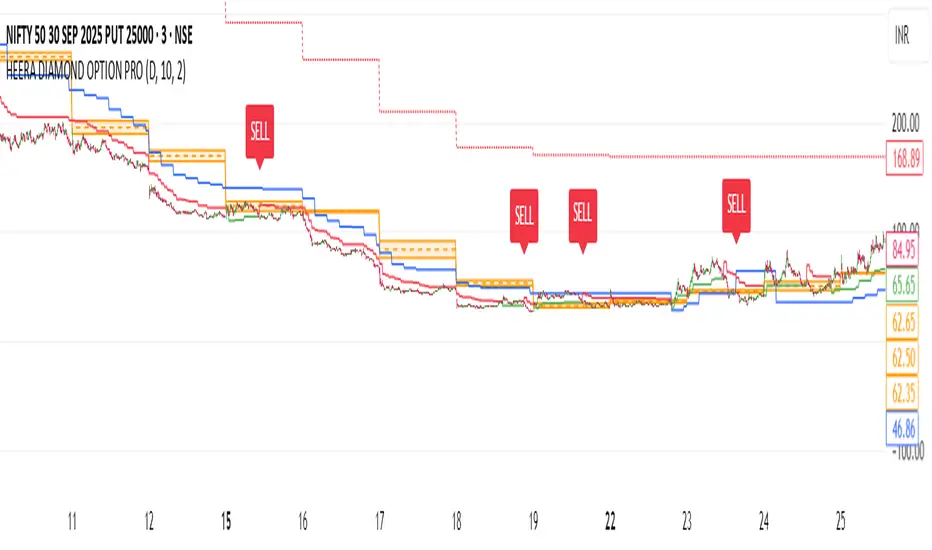
HEERA DIAMOND OPTION PROThis indicator is designed for option sellers who need trend confirmation + key intraday levels to manage risk and time entries.
It combines Daily CPR, Supertrend (10,2), and VWAP — three essential tools that help filter trades and avoid false breakouts.
⚡ Components & Role in Option Selling:
Central Pivot Range (CPR – Daily)
Defines the intraday trend bias (above bullish, below bearish).
Narrow CPR → likely trending day → avoid aggressive selling.
Wide CPR → sideways market → better for option selling (short straddle/strangle, iron condor).
Supertrend (10,2)
Provides directional bias.
For option sellers, use this as a stop-loss indicator:
Stay short OTM Calls if price trades below Supertrend (bearish).
Stay short OTM Puts if price trades above Supertrend (bullish).
VWAP (Daily Anchored)
Acts as a fair value line.
Option sellers use VWAP as a mean-reversion reference:
If price stays close to VWAP → sideways → good for selling options.
If price trends away strongly from VWAP → avoid shorting both sides (avoid straddles).
🎯 Suggested Option Selling Use:
Straddle/Strangle Selling → When price is inside CPR and close to VWAP, with Supertrend flat.
Directional Credit Spreads (Bear Call / Bull Put) → When CPR + VWAP + Supertrend align in one direction.
Avoid Selling → If CPR is narrow and market breaks strongly (high trending risk).
HD_DİNAMİK SEMBOL-SİNYAL TABLO (STrend + EMA(25/99) – v6.2HD_Dynamic Symbol–Signal Table (Short/Mid/Long) — SuperTrend + EMA(25/99) — v6.2
TL;DR
Invite-only indicator that builds a multi-symbol live signal table combining SuperTrend direction with EMA 25/99 state, across three timeframe groups: Short (5/15/30), Mid (45/60/120), Long (180/240/D).
Top 2 rows (e.g., BTC, ETH) always show the full 3×(ST, EMA) matrix; the remaining rows show the active group to stay lightweight. The table colors & texts are highly configurable, and the indicator emits clean alert messages you can route to webhooks (e.g., your bot).
1) What it does
Signal logic (per symbol & timeframe):
SuperTrend direction + EMA 25 vs 99 comparison.
Combination map:
ST=LONG & EMA=LONG → "LONG YAP"
ST=SHORT & EMA=SHORT → "SHORT YAP"
ST=SHORT & EMA=LONG → "SHORT/LONG YAP" (mixed)
ST=LONG & EMA=SHORT → "LONG/SHORT YAP" (mixed)
Timeframe groups
Short: 5/15/30
Mid: 45/60/120
Long: 180/240/D
Auto mode infers the group from the chart TF; Manual mode lets you pin a group.
Pinned priority rows: Row #1 and #2 (default BTC/ETH) always display all three TFs (ST & EMA pairs).
Dynamic list (rows 3–30): Shows only the active group for each symbol to stay fast and readable.
Implementation note: in this build the ST “up”/“down” plotting uses the SuperTrend dir sign convention where dir < 0 is rendered as Uptrend and dir > 0 as Downtrend in visuals. The table/alerts already normalize this into LONG/SHORT text.
2) Table, styling & filters
Placement & fonts: position, title/group/header/body font sizes.
Colors: per-cell/background for header rows, LONG/SHORT states, and distinct brand colors per symbol row (BTC=blue, ETH=amber, majors=greens, mid-caps=oranges, high-risk=reds, new/hyped=purple range).
Symbol column text: “Symbol only”, “Short+Symbol”, or “Short only”.
Filter: Show All / LONG YAP / SHORT YAP / SHORT/LONG YAP / LONG/SHORT YAP. (Pinned BTC/ETH still visible.)
3) Alerts & webhook messages
Per-row alerts: When the active TF for a row resolves on bar close, the indicator sends:
|symbol=|tf=|signal=
Example: HD_ST_EMA|symbol=BINANCE:BTCUSDT|tf=15|signal=LONG YAP
Configure the alert to Once per bar close and set a webhook URL if you want to forward to an execution bot.
Ready-made alertconditions (Robot block):
Select a single alarmSymbol and get four conditions: LONG YAP, SHORT YAP, SHORT/LONG YAP, LONG/SHORT YAP.
Chart-symbol conditions: Extra alertconditions for EMA LONG/SHORT and ST LONG/SHORT on the current chart symbol, if you also want single-symbol triggers.
4) Drawing package (optional)
SuperTrend line with Up/Down segments and trend-flip labels.
EMA 25/99 lines and cross labels.
Main mixed-state labels for the chart symbol can be toggled (LONG/SHORT & mixed cases).
5) Symbols & safety
Priority inputs (#1–2) for BTC/ETH; inputs #3–30 for your list (supports formats like BINANCE:BTCUSDT or BTCUSDT.P).
A basic format validator ignores obviously malformed tickers to avoid request errors.
request.security() powers all multi-TF/multi-symbol reads.
6) How to use
Add indicator to the chart.
Choose Auto (group follows chart TF) or pick Short/Mid/Long manually.
Fill your symbol list (rows 3–30). BTC & ETH are pinned at the top.
Set filter (or keep “All”).
(Optional) Adjust fonts/colors and the “Symbol column” text mode.
Turn Alert on; set alertPrefix if you need a specific route tag.
Create an alert on the indicator, Once per bar close, and (optionally) add a webhook URL.
7) Notes & limits
This is an indicator (no orders are placed). Use the alerts to trigger your own automation.
Designed for crypto symbols; works on other markets if your vendor supports the tickers/timeframes.
Table resizes dynamically to your active list; heavy watchlists may still be constrained by platform limits.
8) Disclaimer
Educational use only. Not financial advice. Past performance does not guarantee future results.
Changelog
v6.2 — Auto/Manual TF-grouping, pinned BTC/ETH tri-TF view, robust alert text format, color-coded priorities, safer symbol validation, ST/EMA flip labels, dynamic table sizing.
Türkçe Özet
Ne yapar?
Birden fazla sembol için SuperTrend + EMA(25/99) durumunu üç periyot grubunda (Kısa 5/15/30 – Orta 45/60/120 – Uzun 180/240/Günlük) tek tabloda gösterir.
BTC/ETH ilk iki satırda her zaman 3×(ST, EMA) birlikte görünür; diğer satırlar aktif gruba göre (performans için) tek grup gösterir.
Sinyal mantığı
İkisi de LONG → LONG YAP
İkisi de SHORT → SHORT YAP
Karışık → SHORT/LONG YAP veya LONG/SHORT YAP (ST/EMA’ya göre)
Alarm & Webhook
Satır bazlı alarm metni:
HD_ST_EMA|symbol=...|tf=...|signal=... (bar kapanışında).
“Robot” bölümünde tek bir sembol için 4 ayrı alertcondition hazır.
Grafikteki sembol için ayrıca EMA LONG/SHORT ve ST LONG/SHORT koşulları da var.
Kullanım
Otomatik/Elle grup seç;
Listeyi doldur (3–30);
Filtre/renk/yazı ayarla;
Alarmı aç ve Once per bar close ile kur; gerekiyorsa webhook URL ekle.
Not
Gösterge emir vermez; sinyalleri kendi köprüne/botuna yönlendirirsin. Yatırım tavsiyesi değildir.

AI-JX# AI-JX v3.0 指标技术分析文档 / Technical Analysis Documentation
## 1. 指标概述 / Indicator Overview
AI-JX v3.0 是一个集成了人工智能学习系统的高级技术分析指标,结合了传统技术指标与AI预测功能,提供多维度的市场分析和交易信号。该指标基于Heikin Ashi蜡烛图和SuperTrend技术,通过AI权重学习系统动态优化参数组合。
AI-JX v3.0 is an advanced technical analysis indicator that integrates an artificial intelligence learning system, combining traditional technical indicators with AI prediction capabilities to provide multi-dimensional market analysis and trading signals. The indicator is based on Heikin Ashi candlesticks and SuperTrend technology, dynamically optimizing parameter combinations through an AI weight learning system.
## 2. 核心信号系统 / Core Signal System
### 2.1 主要交易信号 / Main Trading Signals
#### AI智能买卖信号 / AI Smart Buy/Sell Signals
- **AI买入信号 / AI Buy Signal**: 当buyScore ≥ 70分且AI确认无假突破时触发 / Triggered when buyScore ≥ 70 and AI confirms no false breakout
- **AI卖出信号 / AI Sell Signal**: 当sellScore ≥ 70分且AI确认无假突破时触发 / Triggered when sellScore ≥ 70 and AI confirms no false breakout
- **信号特点 / Signal Features**: 基于多指标融合评分,具有较高的准确性 / Based on multi-indicator fusion scoring with high accuracy
#### 传统SuperTrend信号 / Traditional SuperTrend Signals
- **传统买入 / Traditional Buy**: 趋势从下降转为上升时触发 / Triggered when trend changes from down to up
- **传统卖出 / Traditional Sell**: 趋势从上升转为下降时触发 / Triggered when trend changes from up to down
- **显示方式 / Display Method**: 小尺寸标签,作为参考信号 / Small-sized labels as reference signals
### 2.2 预测性信号 / Predictive Signals
#### 预测强买信号 / Predictive Strong Buy Signal
**触发条件 / Trigger Conditions**:
- RSI < 35 (超卖 / Oversold)
- MACD线上穿信号线 / MACD line crosses above signal line
- 价格接近支撑位(距离<2.5%) / Price near support level (distance <2.5%)
- 成交量放大确认(>1.5倍均量) / Volume confirmation (>1.5x average volume)
- 无假突破向下 / No false breakout downward
#### 预测强空信号 / Predictive Strong Sell Signal
**触发条件 / Trigger Conditions**:
- RSI > 65 (超买 / Overbought)
- MACD线下穿信号线 / MACD line crosses below signal line
- 价格接近阻力位(距离<2.5%) / Price near resistance level (distance <2.5%)
- 成交量放大确认(>1.5倍均量) / Volume confirmation (>1.5x average volume)
- 无假突破向上 / No false breakout upward
### 2.3 背离信号 / Divergence Signals
#### 预测性看涨背离 / Predictive Bullish Divergence
- 价格创新低但RSI未创新低 / Price makes new low but RSI doesn't make new low
- 结合成交量和动量确认 / Combined with volume and momentum confirmation
- 提示潜在的反转机会 / Indicates potential reversal opportunity
#### 预测性看跌背离 / Predictive Bearish Divergence
- 价格创新高但RSI未创新高 / Price makes new high but RSI doesn't make new high
- 结合成交量和动量确认 / Combined with volume and momentum confirmation
- 提示潜在的顶部风险 / Indicates potential top risk
## 3. AI学习系统 / AI Learning System
### 3.1 参数组合策略 / Parameter Combination Strategies
#### 保守型组合 / Conservative Combination
- **适用场景 / Application Scenario**: 横盘震荡市场 / Sideways oscillating markets
- **RSI周期 / RSI Period**: 21
- **MACD参数 / MACD Parameters**: 12,26,9
- **ATR周期 / ATR Period**: 14
- **特点 / Features**: 稳定性高,信号较少但准确性好 / High stability, fewer signals but good accuracy
#### 激进型组合 / Aggressive Combination
- **适用场景 / Application Scenario**: 强趋势突破市场 / Strong trending breakout markets
- **RSI周期 / RSI Period**: 12
- **MACD参数 / MACD Parameters**: 6,21,5
- **ATR周期 / ATR Period**: 10
- **特点 / Features**: 敏感性高,信号较多但需要过滤 / High sensitivity, more signals but require filtering
#### 平衡型组合 / Balanced Combination
- **适用场景 / Application Scenario**: 通用市场环境 / General market conditions
- **RSI周期 / RSI Period**: 17
- **MACD参数 / MACD Parameters**: 10,24,7
- **ATR周期 / ATR Period**: 12
- **特点 / Features**: 平衡敏感性和稳定性 / Balances sensitivity and stability
### 3.2 权重自适应调整 / Adaptive Weight Adjustment
- **学习机制 / Learning Mechanism**: 基于历史交易表现动态调整权重 / Dynamically adjusts weights based on historical trading performance
- **最小学习交易数 / Minimum Learning Trades**: 20笔 / 20 trades
- **学习速率 / Learning Rate**: 0.1 (可调 / adjustable)
- **记忆长度 / Memory Length**: 100笔交易 / 100 trades
## 4. 市场状态识别 / Market State Recognition
### 4.1 市场模式分类 / Market Pattern Classification
- **强趋势突破 / Strong Trend Breakout**: 波动率>1.5且趋势强度>5% / Volatility >1.5 and trend strength >5%
- **横盘震荡 / Sideways Oscillation**: 波动率<0.7且趋势强度<2% / Volatility <0.7 and trend strength <2%
- **上升趋势 / Uptrend**: 20日涨幅>3% / 20-day gain >3%
- **下降趋势 / Downtrend**: 20日跌幅>3% / 20-day decline >3%
- **弱势整理 / Weak Consolidation**: 其他情况 / Other conditions
### 4.2 支撑阻力分析 / Support and Resistance Analysis
#### 动态支撑阻力 / Dynamic Support and Resistance
- **计算方式 / Calculation Method**: 基于历史高低点统计 / Based on historical high/low statistics
- **强度分级 / Strength Classification**: 强/中等/弱 (基于触及次数) / Strong/Medium/Weak (based on touch count)
- **有效性 / Validity**: 价格偏差<0.2%认定为有效触及 / Price deviation <0.2% considered valid touch
#### 斐波那契关键位 / Fibonacci Key Levels
- **23.6%回撤位 / 23.6% Retracement**
- **38.2%回撤位 / 38.2% Retracement**
- **50.0%回撤位 / 50.0% Retracement**
- **61.8%回撤位 / 61.8% Retracement**
- **78.6%回撤位 / 78.6% Retracement**
## 5. 风险控制机制 / Risk Control Mechanisms
### 5.1 假突破识别 / False Breakout Identification
#### 向上假突破 / Upward False Breakout
- 价格突破阻力位后快速回落 / Price breaks resistance then quickly falls back
- 成交量萎缩(<0.8倍均量) / Volume shrinks (<0.8x average volume)
- 自动过滤相关买入信号 / Automatically filters related buy signals
#### 向下假突破 / Downward False Breakout
- 价格跌破支撑位后快速反弹 / Price breaks support then quickly rebounds
- 成交量萎缩(<0.8倍均量) / Volume shrinks (<0.8x average volume)
- 自动过滤相关卖出信号 / Automatically filters related sell signals
### 5.2 多时间框架验证 / Multi-Timeframe Validation
- **时间框架1 / Timeframe 1**: 5分钟 / 5 minutes
- **时间框架2 / Timeframe 2**: 15分钟 / 15 minutes
- **时间框架3 / Timeframe 3**: 60分钟 / 60 minutes
- **一致性要求 / Consistency Requirement**: 三个时间框架趋势方向一致时信号更可靠 / Signals are more reliable when all three timeframes show consistent trend direction
## 6. AI预测功能 / AI Prediction Features
### 6.1 趋势预测系统 / Trend Prediction System
#### 预测评分机制 / Prediction Scoring Mechanism
- **多时间框架一致性 / Multi-Timeframe Consistency**: 30分 / 30 points
- **价格动量分析 / Price Momentum Analysis**: 25分 / 25 points
- **成交量确认 / Volume Confirmation**: 20分 / 20 points
- **支撑阻力位置 / Support/Resistance Position**: 25分 / 25 points
#### 预测结果分类 / Prediction Result Classification
- **强烈看涨 / Strong Bullish**: 评分>80 / Score >80
- **温和看涨 / Moderate Bullish**: 评分60-80 / Score 60-80
- **震荡 / Sideways**: 评分40-60 / Score 40-60
- **温和看跌 / Moderate Bearish**: 评分20-40 / Score 20-40
- **强烈看跌 / Strong Bearish**: 评分<20 / Score <20
### 6.2 智能点位识别 / Smart Level Identification
#### 最佳做多点位 / Optimal Long Entry Points
- 基于支撑位和斐波那契回撤 / Based on support levels and Fibonacci retracements
- 结合RSI超卖和MACD金叉 / Combined with RSI oversold and MACD golden cross
- 提供具体价位和置信度 / Provides specific price levels and confidence scores
#### 最佳做空点位 / Optimal Short Entry Points
- 基于阻力位和斐波那契回撤 / Based on resistance levels and Fibonacci retracements
- 结合RSI超买和MACD死叉 / Combined with RSI overbought and MACD death cross
- 提供具体价位和置信度 / Provides specific price levels and confidence scores
## 7. 使用建议 / Usage Recommendations
### 7.1 信号优先级 / Signal Priority
1. **最高优先级 / Highest Priority**: AI智能信号(评分≥70) / AI smart signals (score ≥70)
2. **高优先级 / High Priority**: 预测性信号+多时间框架确认 / Predictive signals + multi-timeframe confirmation
3. **中等优先级 / Medium Priority**: 传统SuperTrend信号 / Traditional SuperTrend signals
4. **参考级别 / Reference Level**: 背离信号和支撑阻力提示 / Divergence signals and support/resistance hints
### 7.2 参数设置建议 / Parameter Setting Recommendations
#### 新手用户 / Beginner Users
- 启用AI学习系统 / Enable AI learning system
- 使用平衡型组合 / Use balanced combination
- 关注预测性信号 / Focus on predictive signals
- 重视风险控制 / Emphasize risk control
#### 经验用户 / Experienced Users
- 根据市场环境选择组合 / Choose combinations based on market conditions
- 结合多时间框架分析 / Combine multi-timeframe analysis
- 自定义学习参数 / Customize learning parameters
- 灵活运用各类信号 / Flexibly use various signal types
### 7.3 风险提示 / Risk Warnings
- **AI学习需要时间 / AI Learning Takes Time**: 至少20笔交易后才开始有效学习 / Effective learning starts after at least 20 trades
- **市场环境变化 / Market Environment Changes**: 需要定期重新训练AI系统 / AI system needs periodic retraining
- **信号延迟 / Signal Delay**: 部分信号可能存在1-2根K线的延迟 / Some signals may have 1-2 candlestick delay
- **假信号风险 / False Signal Risk**: 震荡市场中可能产生较多假信号 / May generate more false signals in choppy markets
- **过度优化 / Over-optimization**: 避免频繁调整参数导致过拟合 / Avoid frequent parameter adjustments causing overfitting
## 8. 显示面板说明 / Display Panel Description
### 8.1 AI统计面板 / AI Statistics Panel
显示内容包括 / Display contents include:
- 风险等级和买卖评分 / Risk level and buy/sell scores
- 市场状态和波动率 / Market state and volatility
- RSI当前值 / Current RSI value
- AI趋势预测和置信度 / AI trend prediction and confidence
- 最佳入场点位 / Optimal entry points
- 交易机会评估 / Trading opportunity assessment
- AI准确率统计 / AI accuracy statistics
### 8.2 AI预测信息面板 / AI Prediction Information Panel
显示内容包括 / Display contents include:
- 趋势方向和置信度 / Trend direction and confidence
- 价格目标位 / Price target levels
- 最佳做多/做空点位 / Optimal long/short entry points
- 交易机会类型 / Trading opportunity type
- 入场时机建议 / Entry timing recommendations
- 市场情绪分析 / Market sentiment analysis
- 价格形态识别 / Price pattern recognition
## 9. 总结 / Summary
AI-JX v3.0指标通过集成多种技术分析方法和AI学习能力,为交易者提供了一个全面的市场分析工具。其核心优势在于:
The AI-JX v3.0 indicator provides traders with a comprehensive market analysis tool by integrating various technical analysis methods and AI learning capabilities. Its core advantages include:
- **智能化 / Intelligence**: AI自动学习和优化参数 / AI automatically learns and optimizes parameters
- **多维度 / Multi-dimensional**: 结合趋势、动量、支撑阻力等多个维度 / Combines trend, momentum, support/resistance and other dimensions
- **预测性 / Predictive**: 提供前瞻性的市场预测 / Provides forward-looking market predictions
- **风险控制 / Risk Control**: 内置假突破识别和多重确认机制 / Built-in false breakout identification and multiple confirmation mechanisms
建议交易者在使用时结合自身交易风格和市场环境,合理设置参数,并注意风险管理。
It is recommended that traders combine their own trading style and market environment when using this indicator, set parameters reasonably, and pay attention to risk management.
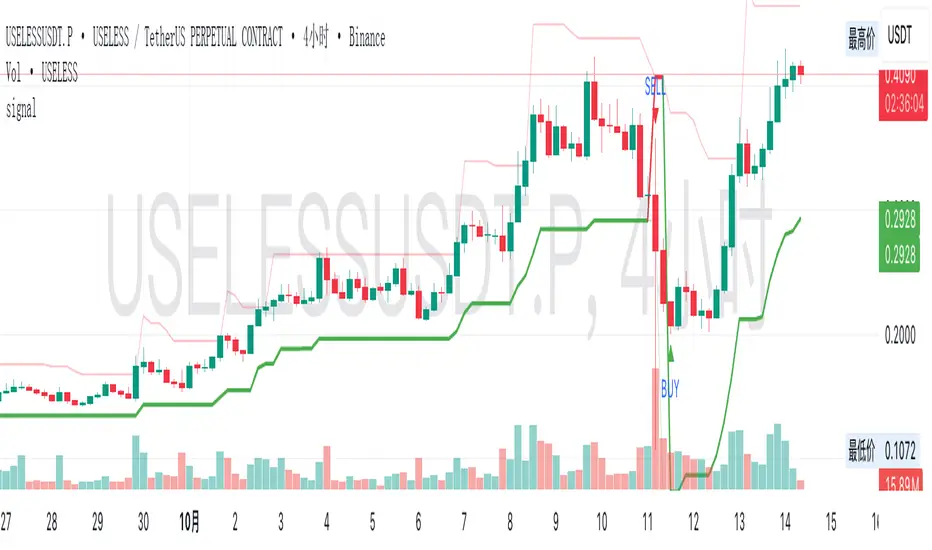
Momentum_EMABand📢 Reposting Notice
I am reposting this script because my earlier submission was hidden due to description requirements under TradingView’s House Rules. This updated version fully explains the originality, the reason for combining these indicators, and how they work together. Follow me for future updates and refinements.
🆕 Momentum EMA Band, Rule-Based System
Momentum EMA Band is not just a mashup — it is a purpose-built trading tool for intraday traders and scalpers that integrates three complementary technical concepts into a single rules-based breakout & retest framework.
Originality comes from the specific sequence and interaction of these three filters:
Supertrend → Sets directional bias.
EMA Band breakout with retest logic → Times precise entries.
ADX filter → Confirms momentum strength and avoids noise.
This system is designed to filter out weak setups and false breakouts that standalone indicators often fail to avoid.
🔧 How the Indicator Works — Combined Logic
1️⃣ EMA Price Band — Dynamic Zone Visualization
Plots upper & lower EMA bands (default: 9-period EMA).
Green Band → Price above upper EMA = bullish momentum
Red Band → Price below lower EMA = bearish pressure
Yellow Band → Price within band = neutral zone
Acts as a consolidation zone and breakout trigger level.
2️⃣ Supertrend Overlay — Reliable Trend Confirmation
ATR-based Supertrend adapts to volatility:
Green Line = Uptrend bias
Red Line = Downtrend bias
Ensures trades align with the prevailing trend.
3️⃣ ADX-Based No-Trade Zone — Choppy Market Filter
Manual ADX calculation (default: length 14).
If ADX < threshold (default: 20) and price is inside EMA Band → gray background marks low-momentum zones.
🧩 Why This Mashup Works
Supertrend confirms trend direction.
EMA Band breakout & retest validates the breakout’s strength.
ADX ensures the market has enough trend momentum.
When all align, entries are higher probability and whipsaws are reduced.
📈 Example Trade Walkthrough
Scenario: 5-minute chart, ADX threshold = 20.
Supertrend turns green → trend bias is bullish.
Price consolidates inside the yellow EMA Band.
ADX rises above 20 → trend momentum confirmed.
Price closes above the green EMA Band after retesting the band as support.
Entry triggered on candle close, stop below band, target based on risk-reward.
Exit when Supertrend flips red or ADX momentum drops.
This sequence prevents premature entries, keeps trades aligned with trend, and avoids ranging markets.
🎯 Key Features
✅ Multi-layered confirmation for precision trading
✅ Built-in no-trade zone filter
✅ Fully customizable parameters
✅ Clean visuals for quick decision-making
⚠ Disclaimer: This is Version 1. Educational purposes only. Always use with risk management.

Kalman Step Signals [AlgoAlpha]Take your trading to the next level with the Kalman Step Signals indicator by AlgoAlpha! This advanced tool combines the power of Kalman Filtering and the Supertrend indicator, offering a unique perspective on market trends and price movements. Designed for traders who seek clarity and precision in identifying trend shifts and potential trade entries, this indicator is packed with customizable features to suit your trading style.
Key Features
🔍 Kalman Filter Smoothing : Dynamically smooths price data with user-defined parameters for Alpha, Beta, and Period, optimizing responsiveness and trend clarity.
📊 Supertrend Overlay : Incorporates a classic Supertrend indicator to provide clear visual cues for trend direction and potential reversals.
🎨 Customizable Appearance : Adjust colors for bullish and bearish trends, along with optional exit bands for more nuanced analysis.
🔔 Smart Alerts : Detect key moments like trend changes or rejection entries for timely trading decisions.
📈 Advanced Visualization : Includes optional entry signals, exit bands, and rejection markers to pinpoint optimal trading opportunities.
How to Use
Add the Indicator : Add the script to your TradingView favorites. Customize inputs like Kalman parameters (Alpha, Beta, Period) and Supertrend settings (Factor, ATR Period) based on your trading strategy.
Interpret the Signals : Watch for trend direction changes using Supertrend lines and directional markers. Utilize rejection entries to identify price rejections at trendlines for precision entry points.
Set Alerts : Enable the built-in alert conditions for trend changes or rejection entries to act swiftly on trading opportunities without constant chart monitoring.
How It Works
The indicator leverages a Kalman Filter to smooth raw price data, balancing responsiveness and noise reduction using user-controlled parameters. This refined price data is then fed into a Supertrend calculation, combining ATR-based volatility analysis with dynamic upper and lower bands. The result is a clear and reliable trend-detection system. Additionally, it features rejection markers for bullish and bearish reversals when prices reject the trendline, along with exit bands to visualize potential price targets. The integration of customizable alerts ensures traders never miss critical market moves.
Add the Kalman Step Signals to your TradingView charts today and enjoy a smarter, more efficient trading experience! 🚀🌟

Auto Signal Buy/SellAuto Signal Buy/Sell with Time Filter and Dynamic ZLEMA (GMT+2) 🌟
Are you looking for an indicator that combines efficiency and simplicity while integrating advanced elements like SuperTrend, ZLEMA (Zero Lag EMA), and a MACD DEMA for clear and precise buy/sell signals? 📈 Introducing Auto Signal Buy/Sell, the ultimate indicator designed for intraday and swing traders, optimized for market hours in GMT+2.
🛠️ Key Features:
- **Advanced SuperTrend**: Follow the dominant trend with a robust SuperTrend, adjustable to your preferences (customizable multiplier and period).
- **Dynamic ZLEMA**: Get a zero-lag EMA curve with a visual signal. Additionally, the ZLEMA turns blue when it’s nearly flat, helping you easily spot market consolidation phases.
- **MACD DEMA**: An enhanced version of the traditional MACD, using the Double EMA to capture more responsive buy/sell cross signals. 📊
- **Buy/Sell Signals**: Visual arrows clearly indicate potential entry and exit points on your chart, filtered by MACD crossovers and the SuperTrend trend.
- **Smart Time Filter (GMT+2)**: This script adapts to trading hours (customizable) and only displays signals during trading hours. The background turns light blue when the market is closed, preventing confusion during inactivity periods. 🕒
⚙️ Full Customization:
- Adjustable trading hours (default 9 AM to 5 PM in GMT+2) with dynamic background indicating when markets are closed.
- Flexible settings for SuperTrend, ZLEMA, and MACD DEMA to suit any strategy.
🎯 Why Choose This Indicator?
- Optimized for maximum precision with advanced algorithms like ZLEMA and DEMA.
- Easy to use: it provides clear, visual signals directly on the chart—no need to decipher complex indicators.
- A complete intraday and swing indicator that combines trend analysis and signal filtering with precise market hours.
🚀 Boost Your Trading!
Add this indicator to your toolkit and enhance your decision-making. Thanks to its intuitive interface and clear visual signals, you can trade with confidence. 💡
Don't forget to like 👍 and comment if you find this indicator useful! Your feedback helps us continue improving such tools. 🚀
📌 How to Use:
1. Add the indicator to your chart.
2. Adjust the SuperTrend and ZLEMA settings to suit your needs.
3. Follow the buy/sell signals and watch for the light blue background outside of trading hours.
4. Trade effectively and stay in control, even during consolidation phases.
