Cyatophilum Swing Trader [ALERTSETUP]This is an indicator for swing trading which allows you to build your own strategies, backtest and alert. This version is the alertsetup which allows to create automated alerts hosted on TradingView servers that will trigger in form of emails, SMS, webhooks, notifications, and more. The backtest version can be found in my profile scripts page.
The particularity of this indicator is that it contains several indicators, including a custom one, that you can choose in a drop down list, as well as a trailing stop loss and take profit system.
The current indicators are :
CYATO AI: a custom indicator inspired by Donchian Channels that will catch each big trend and important reversal points .
The indicator has two major "bands" or channels and two minor bands. The major bands are bigger and are always displayed.
When price reaches a major band, acting as a support/resistance, it will either bounce on it or break through it. This is how "tops" and "bottoms", and breakouts are caught.
The minor bands are used to catch smaller moves inside the major bands. A combination of volume, momentum and price action is used to calculate the signals.
Advantages of this indicator: it should catch top and bottoms better than other swing trade indicators.
Cons of this indicator: Some minor moves might be ignored. Sometimes the script will catch a fakeout due to the Bands design.
Best timeframes to use it : 2H~4H
Sample:
Other indicators available:
SARMA: A combination of Parabolic Stop and Reverse and Exponential Moving Average (20 and 40) .
SAR: Regular Parabolic Stop and Reverse .
QQE: An indicator based on Quantitative Qualitative Estimation .
SUPERTREND: A reversal indicator based on Average True Range .
CHANNELS: The classic Donchian Channels .
More indicators might be added in the future.
About the signals: each entry (long & short) is calculated at bar close to avoid repainting. Exits (SL & TP) can either be intra-bar or at bar close using the Exit alert type parameter.
STOP LOSS SYSTEM
The base indicators listed above can be used with or without TP/SL.
TP and SL can be both turned on and off and configured for both directions.
The system can be configured with 3 parameters as follows:
Stop Loss Base % Price: Starting Value for LONG/SHORT stop loss
Trailing Stop % Price to Trigger First parameter related to the trailing stop loss. Percentage of price movement in the right direction required to make the stop loss line move.
Trailing Stop % Price Movement: Second parameter related to the trailing stop loss. Percentage for the stop loss trailing movement.
Another option is the "Reverse order on Stop Loss". Use this if you want the strategy to trigger a reverse order when a stop loss is hit.
TAKE PROFIT SYSTEM
The system can be configured with 2 parameters as follows:
Take Profit %: Take profit value in percentage of price.
Trailing Profit Deviation %: Percent deviation for the trailing take profit.
Combining indicators and Take Profit/Stop Loss
One thing to note is that if a reversal signal triggers during a trade, the trade will be closed before SL or TP is reached.
Indeed, the base indicators are reversal indicators, they will trigger long/short signals to follow the trend.
It is possible to use a takeprofit without stop loss, like in this example, knowing that the signal will reverse if the trade goes badly.
The base indicators settings can be changed in the "Advanced Parameters" section.
Configuration used for this snapshot:
ALERTS DEFINITION
Each alert correspond to the labels on chart.
01. LONG ENTRY (BUY) : Long alert
02. LONG STOP LOSS : Long stop loss event
03. LONG TAKE PROFIT : Long take profit event
04. SHORT ENTRY (SELL) : Short alert
05. SHORT STOP LOSS : Short stop loss event
06. SHORT TAKE PROFIT : Short take profit event
07. LONG EXIT : Long exit alert. Triggers on both Stop loss and Take Profit
08. SHORT EXIT : Short exit alert. Triggers on both Stop loss and Take Profit
09. ALL TAKE PROFITS : Long and Short Take Profits. Both directions.
10. ALL STOP LOSSES : Long and Short Stop Losses. Both directions.
11. ALL EXITS : Long and Short exits alert. Stop Loss and Take Profit both Long and Short.
Use the link below to obtain access to this indicator.
In den Scripts nach "supertrend" suchen

RinganTrend 0.4This is from SuperTrend.
But I changed manything. so now i call it ringanTrend.
now v0.4
buy at green arrow. (end of black line)
sell at red arrow. (end of blue line)
but be carefull. it may take your money.
look at the chart. left side it take trader's money often.(but small)
also i published v0.3 before
so you can use 0.3 and 0.4 at the same time.
you can change 4 value.
v0.3 setting is 4, 13, 8, 5
0.4's default setting is for shooter(maybe)
2, 4, 1, 1
you trade often in 0.4 default setting than v0.3
and i fixed small bug.
I am not sure i will make v0.5
cause ...i guess i cannot make better than this.
SuperTrend is so nice idea already!! especially for alt-coin
you can see difference.
in korean
빨간화살표에서 파세요 (파란선이 끝나는 점)
녹색화살표에서 사세요 (검은선이 끝나는 점)

S.T. TREND INDICATORIt is TREND indicator. it has 8 supertrends which can be used for different higher time frame & with different atr & multiplier.which will give better idea of varius trend like long ,medium,short & immediate trend.it also has daily & weekly vwap. and two sma with adjustable length & timeframe. source used for calculation of supertrends is 1min HA candles.yyou can use it onnormal japnees candle also.
Multi indicators tableThis is a comprehensive trading tool that presents an overview of the market in a tabular format. It consists of five distinct categories of trading indicators : Volatility, Trend, Momentum, Reversal, and Volume. Each category includes a series of indicators that are widely used in the trading communauty.
The Volatility category includes the Average True Range (ATR) and Bollinger Bands indicators. The Trend category comprises the Average Directional Index (ADX), four Exponential Moving Averages (EMAs), Aroon, Parabolic SAR, and the Supertrend. The Momentum category includes the Stochastic Relative Strength Index (StochRSI), Money Flow Index (MFI), Williams %R, Relative Strength Index (RSI), and Commodity Channel Index (CCI). The Reversal category includes Parabolic SAR, Moving Average Convergence Divergence (MACD), and PP Supertrend. Finally, the Volume category includes the Volume Exponential Moving Average (EMA) indicator.
The indicators states are easily readable, the indicator case is colored based on his actual state. A bullish color (green by default), a bearish color (red by default),
a very bullish color (dark green by default), a very bearish color (dark red by default) and a neutral color (gray by default) displayed when the indicator doesn't give us a clear signal. Some indicators do not have a very bullish or very bearish state. Concerning volatility indicators, the bullish color indicates high volatility, the bearish color indicates low volatility, and the neutral color indicates normal volatility.
Most of the indicators displayed in the table are customizable, and traders can choose to hide the categories they don't want to use. The Indicator provides a quick and easily readable view on the market and allows traders to reduce the number of indicators on their chart making it lighter and more readable.

Distance Oscillator - Support and Resistance by DGT
Prices high above the Moving Average (MA) or low below it are likely to be remedied in the future by a reverse price movement as stated in the article by Denis Alajbeg, Zoran Bubas and Dina Vasic published in International Journal of Economics, Commerce and Management
This study is the third variant that aims to present this idea, and the output of the study is presented as lines that serve as possible support and resistance levels in the future.
1st variant of the idea is presented as an centered oscillator, link to Price Distance to its MA Study , within its description you may find more about the idea and some statistical observations. Also some derivatives with MACD-X, More Than MACD and P-MACD
2nd variant of the idea are presented as colored triangle line (Volatility Colored Price/MA Line), using the same calculation methods and presented in the bottom of price chart.
Link to studies where it is included : Colored Directional Movement and Bollinger Band's Cloud , SuperTrendRange and Pivot Points vX
3rd variant (this study) as stated earlier aims to present the same idea as support and resistance levels.
Options
The users can adjust source and length of the moving average that is used as base for the distance oscillator
Signal triggering options includes length for the deviation bands, multiplier as well as smoothing of the oscillator
Line customization settings
Additionally an alert can be configured to be warned earlier to watch out for probable pullbacks or reversals
Technical details for whom interested
Calculating the price distance to the MA results in a centered oscillator lets call it Distance Oscillator (quite similar to the RSI), as shown in the blow chart
Unlike RSI, oscillations with the distance oscillator are not limited within a specific range, hence identifying overbought and oversold is not as straight forward as it is with RSI. To determine overbought and oversold levels, standard deviation of distance oscillator is calculated and bands generated with the same approach applied with Bollinger Bands.
Once we have the threshold bands then crossing those bands we may assume as important levels and draw a line, if oscillator values keeps above the threshold bands (deviation bands) the logic behind the code will update the line drawing accordingly.
To reduce noise a smoothing can be applied
Alerts :
Please note that the implementation applied here can be applied to any oscillator such as RSI, Stochastic, MFI etc even Volume (if bear candle volumes are multiplied by -1)
Disclaimer :
Trading success is all about following your trading strategy and the indicators should fit within your trading strategy, and not to be traded upon solely
The script is for informational and educational purposes only. Use of the script does not constitute professional and/or financial advice. You alone have the sole responsibility of evaluating the script output and risks associated with the use of the script. In exchange for using the script, you agree not to hold dgtrd TradingView user liable for any possible claim for damages arising from any decision you make based on use of the script
[CT] ATR Ratio MTFThis indicator is an enhanced, multi-timeframe version of the original “ATR ratio” by RafaelZioni. Huge thanks to RafaelZioni for the core concept and base logic. The script still combines an ATR-based ratio (Z-score style reading of where price sits within its recent ATR envelope) with an ATR Supertrend, but expands it into a more flexible trade-decision and visual context tool.
The ATR ratio is normalized so you can quickly see when price is pressing into extended bullish or bearish territory, while the Supertrend defines directional bias and a dynamic support-resistance trail. You can choose any higher timeframe in the settings, allowing you to run the ATR ratio and Supertrend from a larger anchor timeframe while trading on a lower chart.
Upgrades include a full Pine Script v6 rewrite, multi-timeframe support for both the ATR ratio and Supertrend, user-controlled colors for the Supertrend in bull and bear modes, and optional bar coloring so price bars automatically reflect Supertrend direction. Entry, pyramiding and take-profit logic from the original script are preserved, giving you a familiar framework with more control over timeframe, visuals and trend bias.
This indicator is designed to give you a clean directional framework that blends volatility, trend, and timing into one view. The ATR ratio side of the script shows you where price sits inside a recent ATR-based envelope. When the ATR ratio pushes up and sustains above the bullish threshold, it signals that price is trading in an extended, momentum-driven zone relative to recent volatility. When it drops and holds below the bearish threshold, it shows the opposite: sellers have pushed price down into an extended bearish zone. The optional background coloring simply makes these bullish and bearish environments easier to see at a glance.
On top of that, the Supertrend and bar colors tell you what side of the market to favor. The Supertrend is calculated from ATR on whatever timeframe you choose in the settings. If you set the MTF input to a higher timeframe, the Supertrend and ATR ratio become your higher time frame bias while you trade on a lower chart. When price is above the MTF Supertrend, the line uses your bullish color and, if bar coloring is enabled, candles adopt your bullish bar color. That is your “long only” environment: you generally look for buys when price is above the Supertrend and the ATR ratio is either turning up from neutral or already in a bullish zone. When price is below the MTF Supertrend, the line uses your bearish color and candles can shift to your bearish bar color; that is where you focus on shorts, especially when the ATR ratio is rolling over or holding in the bearish zone.
The built-in long and short conditions are meant as signal prompts, not rigid rules. Long signals fire when the ATR ratio crosses up through a positive level while the Supertrend is bullish. Short signals fire when the ATR ratio crosses down through a negative level while the Supertrend is bearish. The script tracks how many longs or shorts have been taken in sequence (pyramiding) and will only allow a new signal up to the limit you set, so you can control how aggressively you stack positions in a trend. The take-profit logic then watches the percentage move from your last entry and flags “TP” when that move has reached your take-profit percent, helping you standardize exits instead of eyeballing them bar by bar.
In practice you typically start by choosing your anchor timeframe for the MTF setting, for example a 1-hour or 4-hour Supertrend and ATR ratio while watching a 5-minute or 15-minute chart. You then use the Supertrend direction and bar colors as your bias filter, only taking signals in the direction of the trend, and you use the ATR ratio behavior to judge whether you are entering into strength, fading an extreme, or trading inside a neutral consolidation. Over time this gives you a consistent way to answer three questions on every chart: which side am I allowed to trade, how extended is price within its recent volatility, and where are my structured entries and exits based on that framework.

Pulsar Trading System-LITE📡 Pulsar Trading System
OVERVIEW
Pulsar is a comprehensive breakout trading system that combines dynamic support/resistance detection, trend filtering, and volume confirmation to identify high-probability entry opportunities. Unlike simple breakout indicators, Pulsar uses multi-timeframe analysis and adaptive ATR-based calculations to filter false signals and provide complete trade management from entry to exit.
WHAT MAKES THIS ORIGINAL
This indicator is unique in its integration of multiple complementary systems:
-Adaptive ATR Zones: Support and resistance levels are not static—they dynamically adjust based on current market volatility (ATR), creating entry zones that expand and contract with market conditions rather than using fixed price levels.
-Multi-Timeframe SuperTrend Filter: The trend filter operates on a higher timeframe than the chart (e.g., 5-minute SuperTrend on a 1-minute chart) to prevent counter-trend trades while maintaining granular entry precision. The visual ribbon with humorous warning text ("🚫 Don't Short - Trend is Your Friend! 📈") provides immediate trend awareness.
-Intelligent Cooldown System: After any trade exit (stop loss or take profit), the system enters a configurable cooldown period, preventing overtrading during choppy or consolidating market conditions—a critical feature often missing in breakout systems.
-Dynamic Trailing Stops: The trailing stop uses ATR multipliers to lock in profits while adapting to volatility, moving only in the favorable direction and never loosening.
-Comprehensive Dashboard: Real-time analysis displays trade status, entry prices, distances to targets in both points and ATR multiples, volume confirmation status, and cooldown countdown.
HOW IT WORKS
Core Detection Logic:
Pulsar identifies breakout opportunities by monitoring price interaction with dynamically calculated support and resistance levels:
Support/Resistance Calculation: Uses ta.lowest() and ta.highest() over a configurable lookback period to identify key levels, then adds ATR-based buffers (0.5 × ATR) to create entry zones.
Breakout Conditions:
Long Entry: Price closes above support buffer AND recent low touched support AND volume exceeds threshold
Short Entry: Price closes below resistance buffer AND recent high touched resistance AND volume exceeds threshold
SuperTrend Filter: A separate higher-timeframe SuperTrend calculation determines overall trend direction. Entries only trigger when breakout direction aligns with SuperTrend (bullish breakout + bullish trend, or bearish breakout + bearish trend).
Volume Confirmation: Current volume must exceed a configurable multiple of the 14-period SMA (default 1.0×) to confirm genuine interest in the breakout.
Cooldown Mechanism: After exit, the system tracks bars elapsed and blocks new signals until the cooldown period completes, preventing rapid-fire entries in ranging markets.
Trade Management:
Stop Loss: Calculated as entry zone ± (ATR × SL Multiplier)
Take Profit 1: Entry zone ± (ATR × TP1 Multiplier)
Take Profit 2: Entry zone ± (ATR × TP2 Multiplier)
Trailing Stop (optional): Updates every bar, moving the stop closer by maintaining distance of (ATR × Trailing Multiplier) from current price, but only in favorable direction
SuperTrend Calculation:
The SuperTrend uses standard methodology:
Upper Band = (High + Low) / 2 + (Multiplier × ATR)
Lower Band = (High + Low) / 2 - (Multiplier × ATR)
Direction changes when price crosses opposite band
The ribbon visualization adds a width offset (ATR × Ribbon Width) to create a filled zone rather than a single line.
HOW TO USE
Setup:
Add Pulsar to your chart (works best on liquid instruments like NQ, ES, CL)
Configure timeframe-specific settings (see recommendations below)
Enable SuperTrend Filter for trend-following mode, or disable for pure breakout mode
Set up alerts for Entry, TP1, TP2, and Stop Loss events
Recommended Settings by Timeframe:
1-Minute Charts:
Lookback Period: 10-15
SuperTrend Timeframe: 5 min
ATR Timeframe: 5 min (for stability)
Cooldown: 8-12 bars
Trailing Stop: Enabled with 0.8-1.0 multiplier
5-Minute Charts:
Lookback Period: 15-20
SuperTrend Timeframe: 15 min
ATR Timeframe: current chart
Cooldown: 5-8 bars
Trailing Stop: Optional
15-Minute+ Charts:
Lookback Period: 20-30
SuperTrend Timeframe: 1 hour
ATR Timeframe: current chart
Cooldown: 3-5 bars
Trailing Stop: Optional
Interpreting Signals:
Long/Short Zone Box: Green (long) or red (short) box appears when breakout conditions are met
Blue Entry Line: Shows your entry price
Red/Orange SL Line: Red = fixed stop, Orange = trailing stop (moves in real-time)
Green TP Lines: TP1 (closer) and TP2 (further) targets
SuperTrend Ribbon: Green = bullish trend (favor longs), Red = bearish trend (favor shorts)
Dashboard Status: Monitor trade state, distances, volume confirmation, and cooldown
Best Practices:
Use SuperTrend Filter: Significantly reduces false signals by avoiding counter-trend trades
Enable Cooldown on Fast Timeframes: Prevents overtrading on 1-5 minute charts
Volume Confirmation is Critical: Don't lower volume multiplier below 0.9 on futures
Use Higher Timeframe ATR: On 1-minute charts, use 5-minute ATR for stability
Avoid Major News Events: Disable during FOMC, NFP, CPI releases
Scale Out Strategy: Consider taking partial profits at TP1, letting remainder run to TP2
Parameter Optimization:
Start conservative and adjust based on results:
Too many stop-outs: Increase SL multiplier or SuperTrend multiplier
Missing good trades: Decrease volume multiplier or cooldown period
Too many false signals: Increase volume multiplier, lookback period, or cooldown
Profits not protected: Enable trailing stop or reduce trailing multiplier
KEY FEATURES
✅ Dynamic ATR-Based Zones: Entry, stop loss, and take profit levels automatically adjust to market volatility
✅ Multi-Timeframe Trend Filter: Uses higher timeframe SuperTrend to eliminate counter-trend trades
✅ Volume Confirmation: Filters low-volume false breakouts
✅ Intelligent Cooldown: Prevents overtrading with configurable post-trade waiting period
✅ Trailing Stop System: Optional dynamic stops that lock in profits using ATR distance
✅ Real-Time Dashboard: 13-row analysis showing trade status, targets, distances, volume, and cooldown
✅ Visual Ribbon Warnings: Humorous trend-following reminders on SuperTrend ribbon
✅ Complete Alert System: Notifications for entries, TP1, TP2, fixed stops, and trailing stops
✅ Customizable Visuals: Adjustable colors, dashboard position, text size, and line lengths
✅ Non-Repainting: Uses lookahead = barmerge.lookahead_off for all multi-timeframe calculations
SETTINGS EXPLAINED
SuperTrend Filter:
Enable: Toggle trend filtering on/off
Timeframe: Higher timeframe for trend analysis (recommended 3-5x chart timeframe)
ATR Period: Period for ATR calculation in SuperTrend (10-14 standard)
Multiplier: Distance from center band (2.5-3.5 for most markets)
Ribbon Width: Visual thickness of trend ribbon (0.2-0.5)
Core Parameters:
Lookback Period: Bars used to identify support/resistance (lower = more sensitive)
ATR Period: Bars for Average True Range calculation (14 is standard)
ATR Timeframe: Use higher timeframe ATR for smoother calculations on fast charts
Volume Multiplier: Required volume vs average (1.0 = average, 1.5 = 50% above average)
TP/SL:
SL Multiplier: Stop loss distance in ATR units (1.0-2.0 typical)
TP1 Multiplier: First target in ATR units (1.5-2.5 typical)
TP2 Multiplier: Second target in ATR units (2.0-3.5 typical)
Trailing Stop:
Enable: Activate dynamic trailing stop
Multiplier: Distance from current price in ATR units (0.8-1.5 typical)
Cooldown:
Enable: Prevent new signals after trade exit
Bars: Number of bars to wait before allowing next trade (higher on fast timeframes)
IMPORTANT NOTES
⚠️ Not a Holy Grail: No indicator is perfect. Pulsar is a tool that requires proper risk management, position sizing, and trading discipline.
⚠️ Backtest First: Test settings on historical data before live trading. Results vary by instrument, timeframe, and market conditions.
⚠️ Market Conditions Matter: Breakout systems perform best in trending markets. Consider reducing size or disabling during known choppy periods.
⚠️ Stop Loss is Mandatory: Always use the provided stop loss levels. Markets can move against you rapidly.
⚠️ Volume Data Required: This indicator requires volume data to function properly. It will display a warning if volume is unavailable.
⚠️ No Repainting: All multi-timeframe calls use non-repainting settings. What you see in real-time is what will be plotted historically.
TECHNICAL SPECIFICATIONS
Version: Pine Script v6
Type: Indicator (overlay = true)
Max Boxes: 500 (for zone visualization)
Max Lines: 500 (for TP/SL levels)
Max Labels: Unlimited (for annotations)
Repainting: None (uses lookahead = barmerge.lookahead_off)
COMPATIBLE INSTRUMENTS
Works best on liquid instruments with reliable volume data:
✅ Futures: NQ, MNQ, ES, MES, YM, MYM, RTY, M2K, CL, GC
✅ Forex: Major pairs (EUR/USD, GBP/USD, etc.)
✅ Stocks: Large-cap stocks with high volume
⚠️ Crypto: Works but requires higher ATR multipliers
❌ Low Volume Stocks: May produce unreliable signals
SUPPORT
For questions, suggestions, or to report issues, please comment below. I actively maintain this indicator and appreciate feedback from the community.
Enjoy trading with Pulsar! 🌟

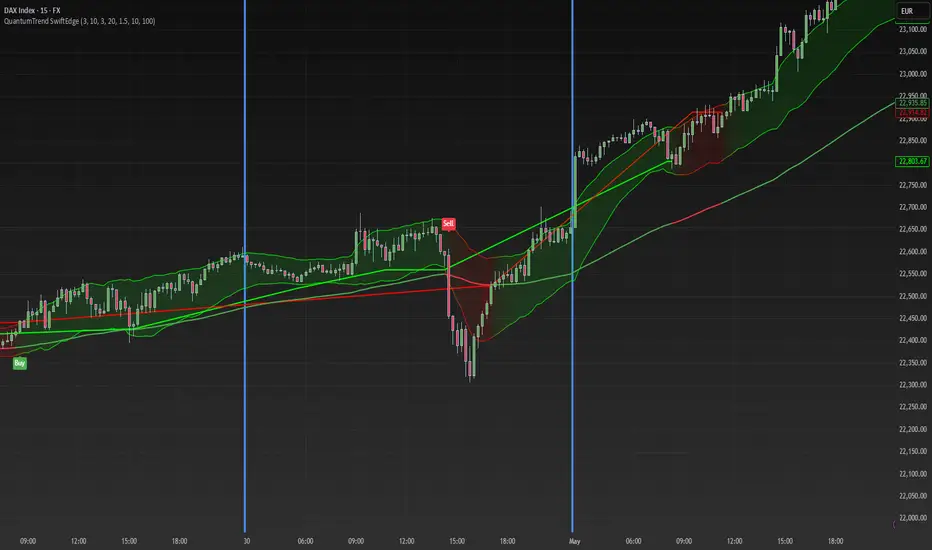
QuantumTrend SwiftEdgeQuantumTrend SwiftEdge - A Trend-Following Indicator for TradingView
Overview:
QuantumTrend SwiftEdge is a visually engaging and customizable trend-following indicator that combines the power of Supertrend, Keltner Channels, and a 100-period EMA to generate precise buy and sell signals. Designed to help traders identify trends and breakouts, this indicator offers a unique blend of technical tools with a modern gradient color effect, making it both functional and visually appealing.
What It Does:
This indicator identifies trend directions and potential entry/exit points:
- Supertrend determines the overall trend direction, showing a green line below the price during uptrends and a red line above the price during downtrends. The line only appears when the price is close to it, indicating an active trend.
- Keltner Channels highlight volatility and breakouts, with the upper and lower bands dynamically adjusting to market conditions.
- A 100-period EMA provides a longer-term trend perspective, helping to filter out noise.
- Buy and sell signals are generated when specific conditions align across these indicators, ensuring robust trade setups.
How It Works:
The indicator uses three components to generate signals:
1. **Supertrend**: Calculates trend direction using the Average True Range (ATR) and a multiplier. It switches between uptrend (green) and downtrend (red) based on price movements relative to the Supertrend line.
2. **Keltner Channels**: Consists of an EMA (default 20 periods) with upper and lower bands based on ATR. A breakout above the upper band signals potential buying opportunities, while a breakout below the lower band signals potential selling opportunities.
3. **100-period EMA**: Acts as a trend filter, ensuring signals align with the broader market direction.
**Buy Signal**:
- Price is above the 100-period EMA (bullish market).
- Price breaks above the Keltner Channel upper band (indicating a breakout).
- Supertrend switches to an uptrend (trend changes from down to up).
**Sell Signal**:
- Price is below the 100-period EMA (bearish market).
- Price breaks below the Keltner Channel lower band (indicating a breakout).
- Supertrend switches to a downtrend (trend changes from up to down).
Visual Features:
- **Gradient Colors**: Supertrend lines and Keltner Channels use a smooth gradient color transition between green (uptrend) and red (downtrend), reflecting the trend's strength. The gradient is based on a smoothed trend value, creating a visually appealing effect.
- **Keltner Channel Fill**: The area between the upper and lower Keltner Channels is filled with a transparent gradient, enhancing the trend visualization.
- **Dynamic Supertrend Visibility**: Supertrend lines only appear when the price is close to the line (within an ATR-based threshold), indicating an active trend.
How to Use:
1. Add the "QuantumTrend SwiftEdge" indicator to your chart in TradingView.
2. Customize the settings:
- **Signal Sensitivity (1=Low, 5=High)**: Default is 3. Lower values (e.g., 1) make signals less frequent by using wider parameters, while higher values (e.g., 5) make signals more frequent by tightening parameters.
- **Use Manual Settings**: If enabled, you can manually adjust all parameters (ATR Period, ATR Multiplier, Keltner Channel Length, Keltner Channel Multiplier, Keltner ATR Length, EMA Length) to fine-tune the indicator.
- **Change ATR Calculation Method**: Toggle between standard ATR calculation and a simple moving average of true range.
- **Show Buy/Sell Signals**: Toggle to show or hide buy (green "Buy" label) and sell (red "Sell" label) signals.
- **Highlighter On/Off**: Toggle to show or hide the gradient fill between the price and Supertrend line when the line is visible.
3. Interpret the signals:
- A green "Buy" label below the price indicates a potential buying opportunity.
- A red "Sell" label above the price indicates a potential selling opportunity.
- Use the Keltner Channel gradient fill and Supertrend lines to confirm the trend direction and strength.
Why This Combination?
- **Supertrend** provides a robust trend-following mechanism, ensuring signals align with the market direction.
- **Keltner Channels** add a volatility component, identifying breakouts that often precede significant price movements.
- **100-period EMA** filters out noise, ensuring signals are generated in the context of the broader trend.
Together, these indicators create a balanced approach: Supertrend and EMA confirm the trend, while Keltner Channels pinpoint actionable entry and exit points. The gradient visuals and dynamic visibility make it easier to focus on active trends.
Originality:
QuantumTrend SwiftEdge stands out with its unique features:
- Gradient color transitions for a modern, dynamic look.
- A filled gradient between Keltner Channels, visually emphasizing the trend.
- Supertrend lines that only appear when the price is close, reducing clutter and focusing on active trends.
- Flexible settings with both sensitivity-based and manual adjustments for maximum customization.
Default Settings:
The default sensitivity is set to 3, providing a balanced approach for most markets and timeframes (e.g., 5-minute charts for crypto like BTC/USD). This setting uses moderate parameters (ATR Period=10, ATR Multiplier=3.0, Keltner Channel Length=20, Keltner Channel Multiplier=1.5, Keltner ATR Length=10, EMA Length=100). Users can adjust the sensitivity or switch to manual settings for more control.
Important Notes:
- This indicator is a tool to assist in identifying trends and potential entry/exit points. It does not guarantee profits and should be used in conjunction with other analysis and risk management practices.
- The signals are based on historical price data and do not predict future performance. Always test the indicator on a demo account before using it in live trading.
- The gradient effect is purely visual and does not affect the signal logic.
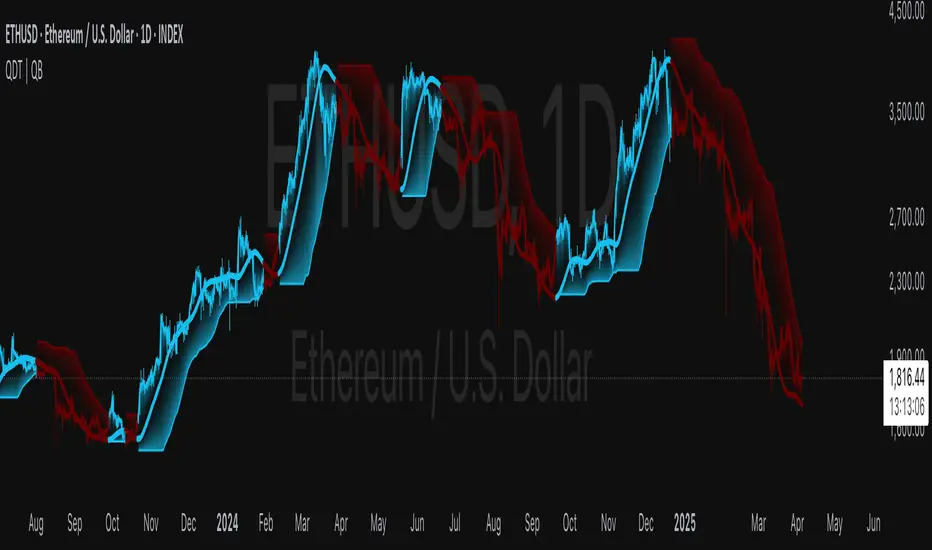
Quantile DEMA Trend | QuantEdgeB🚀 Introducing Quantile DEMA Trend (QDT) by QuantEdgeB
🛠️ Overview
Quantile DEMA Trend (QDT) is an advanced trend-following and momentum detection indicator designed to capture price trends with superior accuracy. Combining DEMA (Double Exponential Moving Average) with SuperTrend and Quantile Filtering, QDT identifies strong trends while maintaining the ability to adapt to various market conditions.
Unlike traditional trend indicators, QDT uses percentile filtering to adjust for volatility and provides dynamic thresholds, ensuring consistent signal performance across different assets and timeframes.
✨ Key Features
🔹 Trend Following with Adaptive Sensitivity
The DEMA component ensures quicker responses to price changes while reducing lag, offering a real-time reflection of market momentum.
🔹 Volatility-Adjusted Filtering
The SuperTrend logic incorporates quantile percentile filters and ATR (Average True Range) multipliers, allowing QDT to adapt to fluctuating market volatility.
🔹 Clear Signal Generation
QDT generates clear Long and Short signals using percentile thresholds, effectively identifying trend changes and market reversals.
🔹 Customizable Visual & Signal Settings
With multiple color modes and customizable settings, you can easily align the QDT indicator with your trading strategy, whether you're focused on trend-following or volatility adjustments.
📊 How It Works
1️⃣ DEMA Calculation
DEMA is used to reduce lag compared to traditional moving averages. It is calculated by applying a Double Exponential Moving Average to price data. This smoother trend-following mechanism ensures responsiveness to market movements without introducing excessive noise.
2️⃣ SuperTrend with Percentile Filtering
The SuperTrend component adapts the trend-following signal by incorporating quantile percentile filters. It identifies dynamic support and resistance levels based on historical price data:
• Upper Band: Calculated using the 75th percentile + ATR (adjusted with multiplier)
• Lower Band: Calculated using the 25th percentile - ATR (adjusted with multiplier)
These dynamic bands adjust to market conditions, filtering out noise while identifying the true direction.
3️⃣ Signal Generation
• Long Signal: Triggered when price crosses below the SuperTrend Lower Band
• Short Signal: Triggered when price crosses above the SuperTrend Upper Band
The indicator provides signals with corresponding trend direction based on these crossovers.
👁 Visual & Custom Features
• 🎨 Multiple Color Modes: Choose from "Strategy", "Solar", "Warm", "Cool", "Classic", and "Magic" color palettes to match your charting style.
• 🏷️ Long/Short Signal Labels: Optional labels for visual cueing when a long or short trend is triggered.
• 📉 Bar Color Customization: Bar colors dynamically adjust based on trend direction to visually distinguish the market bias.
👥 Who Should Use QDT?
✅ Trend Followers: Use QDT as a dynamic tool to confirm trends and capture profits in trending markets.
✅ Swing Traders: Use QDT to time entries based on confirmed breakouts or breakdowns.
✅ Volatility Traders: Identify market exhaustion or expansion points, especially during volatile periods.
✅ Systematic & Quant Traders: Integrate QDT into algorithmic strategies to enhance market detection with adaptive filtering.
⚙️ Customization & Default Settings
- DEMA Length(30): Controls the lookback period for DEMA calculation
- Percentile Length(10): Sets the lookback period for percentile filtering
- ATR Length(14): Defines the length for calculating ATR (used in SuperTrend)
- ATR Multiplier(1.2 ): Multiplier for ATR in SuperTrend calculation
- SuperTrend Length(30):Defines the length for SuperTrend calculations
📌 How to Use QDT in Trading
1️⃣ Trend-Following Strategy
✔ Enter Long positions when QDT signals a bullish breakout (price crosses below the SuperTrend lower band).
✔ Enter Short positions when QDT signals a bearish breakdown (price crosses above the SuperTrend upper band).
✔ Hold positions as long as QDT continues to provide the same direction.
2️⃣ Reversal Strategy
✔ Take profits when price reaches extreme levels (upper or lower percentile zones) that may indicate trend exhaustion or reversion.
3️⃣ Volatility-Driven Entries
✔ Use the percentile filtering to enter positions based on mean-reversion logic or breakout setups in volatile markets.
🧠 Why It Works
QDT combines the DEMA’s quick response to price changes with SuperTrend's volatility-adjusted thresholds, ensuring a responsive and adaptive indicator. The use of percentile filters and ATR multipliers helps adjust to varying market conditions, making QDT suitable for both trending and range-bound environments.
🔹 Conclusion
The Quantile DEMA Trend (QDT) by QuantEdgeB is a powerful, adaptive trend-following and momentum detection system. By integrating DEMA, SuperTrend, and quantile percentile filtering, it provides accurate and timely signals while adjusting to market volatility. Whether you are a trend follower or volatility trader, QDT offers a robust solution to identify high-probability entry and exit points.
🔹 Key Takeaways:
1️⃣ Trend Confirmation – Uses DEMA and SuperTrend for dynamic trend detection
2️⃣ Volatility Filtering – Adjusts to varying market conditions using percentile logic
3️⃣ Clear Signal Generation – Easy-to-read signals and visual cues for strategy implementation
📌 Disclaimer: Past performance is not indicative of future results. No trading strategy can guarantee success in financial markets.
📌 Strategic Advice: Always backtest, optimize, and align parameters with your trading objectives and risk tolerance before live trading.
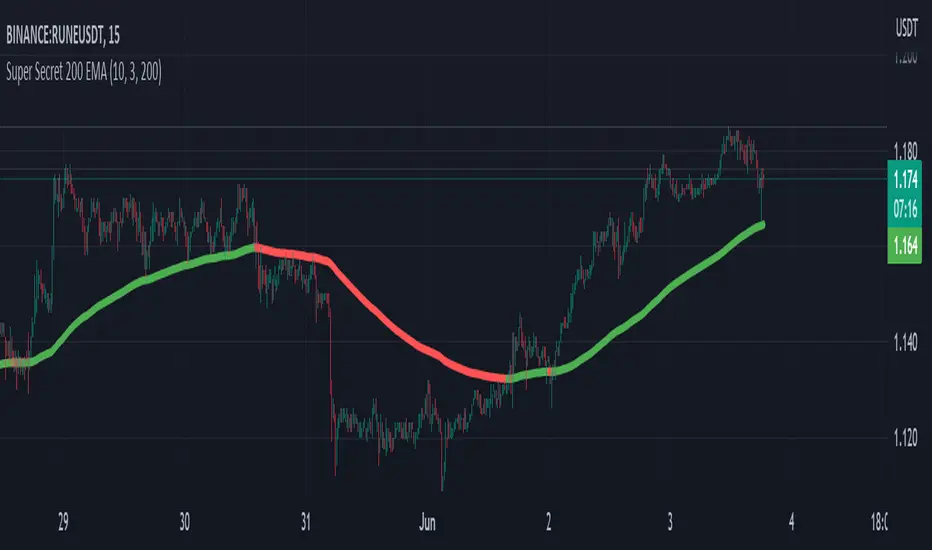
Super Secret 200 EMAThe indicator is called "Super Secret 200 EMA." It combines two technical indicators, the Supertrend and the 200 Exponential Moving Average (EMA), to generate buy and sell opportunities in a trading chart.
Here's how the indicator works and how you can use it:
Supertrend Calculation:
The Supertrend indicator helps identify the current trend in the market. It uses two parameters: Length and Multiplier.
Length: This parameter determines the number of periods used for the calculation.
Multiplier: It controls the width of the Supertrend line, indicating the level of volatility considered in the calculation.
The Supertrend is calculated by looping through the historical data from length to 1.
For each period, it checks whether the closing price has increased or decreased compared to the previous period.
If the closing price has increased, it updates the highestHigh value with the maximum of the current highest high and the high of the current period.
If the closing price has decreased, it updates the lowestLow value with the minimum of the current lowest low and the low of the current period.
Finally, it calculates the Supertrend value using the following formula:
If the change in the closing price is positive: Supertrend = lowestLow + (multiplier * Average True Range (ATR))
If the change in the closing price is negative: Supertrend = highestHigh - (multiplier * ATR)
The Supertrend line will be green if it is above the 200 EMA line and red if it is below.
200 EMA Calculation:
The 200 EMA is a widely used moving average indicator that gives more weight to recent prices.
The EMA period is set to 200 in this case.
The 200 EMA is calculated using the EMA formula, taking into account the closing prices over the specified period.
Plotting:
The Supertrend and 200 EMA lines are plotted on the chart using the plot function.
The Supertrend line is colored green if it is above the 200 EMA line and red if it is below.
The 200 EMA line is colored green if the closing price is above it and red if it is below.
Buy and Sell Conditions:
The indicator determines the buy and sell conditions based on the crossover and crossunder of the closing price with the 200 EMA line and the Supertrend line.
Buy Condition: A buy signal is generated when the closing price crosses above the 200 EMA line and is also above the Supertrend line.
Sell Condition: A sell signal is generated when the closing price crosses below the 200 EMA line and is also below the Supertrend line.
Plotting Buy and Sell Signals:
You can use this indicator to identify potential buy and sell opportunities in your trading strategy. However, please note that this is a simplified explanation, and it's essential to thoroughly understand the indicator's principles and backtest it with historical data before relying on it for actual trading decisions.
Use this with other confluences for best results and never rely on a single indicator
Trend Catch STFR - whipsaw Reduced### Summary of the Setup
This trading system combines **SuperTrend** (a trend-following indicator based on ATR for dynamic support/resistance), **Range Filter** (a smoothed median of the last 100 candles to identify price position relative to a baseline), and filters using **VIX Proxy** (a volatility measure: (14-period ATR / 14-period SMA of Close) × 100) and **ADX** (Average Directional Index for trend strength). It's designed for trend trading with volatility safeguards.
- **Entries**: Triggered only in "tradeable" markets (VIX Proxy ≥ 15 OR ADX ≥ 20) when SuperTrend aligns with direction (green for long, red for short), price crosses the Range Filter median accordingly, and you're not already in that position.
- **Exits**: Purely price-based—exit when SuperTrend flips or price crosses back over the Range Filter median. No forced exits from low volatility/trend.
- **No Trade Zone**: Blocks new entries if both VIX Proxy < 15 AND ADX < 20, but doesn't affect open positions.
- **Overall Goal**: Enter trends with confirmed strength/volatility, ride them via price action, and avoid ranging/choppy markets for new trades.
This creates a filtered trend-following strategy that prioritizes quality entries while letting winners run.
### Advantages
- **Reduces Noise in Entries**: The VIX Proxy and ADX filters ensure trades only in volatile or strongly trending conditions, avoiding low-momentum periods that often lead to false signals.
- **Lets Winners Run**: Exits based solely on price reversal (SuperTrend or Range Filter) allow positions to stay open during temporary lulls in volatility/trend, potentially capturing longer moves.
- **Simple and Balanced**: Combines trend (SuperTrend/ADX), range (Filter), and volatility (VIX Proxy) without overcomplicating—easy to backtest and adapt to assets like stocks, forex, or crypto.
- **Adaptable to Markets**: The "OR" logic for VIX/ADX provides flexibility (e.g., enters volatile sideways markets if ADX is low, or steady trends if VIX is low).
- **Risk Control**: Implicitly limits exposure by blocking entries in calm markets, which can preserve capital during uncertainty.
### Disadvantages
- **Whipsaws in Choppy Markets**: As you noted, SuperTrend can flip frequently in ranging conditions, leading to quick entries/exits and small losses, especially if the Range Filter isn't smoothing enough noise.
- **Missed Opportunities**: Strict filters (e.g., requiring VIX ≥ 15 or ADX ≥ 20) might skip early-stage trends or low-volatility grinds, reducing trade frequency and potential profits in quiet bull/bear markets.
- **Lagging Exits**: Relying only on price flips means you might hold losing trades longer if volatility drops without a clear reversal, increasing drawdowns.
- **Parameter Sensitivity**: Values like VIX 15, ADX 20, or Range Filter's 100-candle lookback need tuning per asset/timeframe; poor choices could amplify whipsaws or over-filter.
- **No Built-in Risk Management**: Lacks explicit stops/targets, so it relies on user-added rules (e.g., ATR-based stops), which could lead to oversized losses if not implemented.
### How to Use It
This system can be implemented in platforms like TradingView (via Pine Script), Python (e.g., with TA-Lib or Pandas), or MT4/5. Here's a step-by-step guide, assuming TradingView for simplicity—adapt as needed. (If coding in Python, use libraries like pandas_ta for indicators.)
1. **Set Up Indicators**:
- Add SuperTrend (default: ATR period 10, multiplier 3—adjust as suggested in prior tweaks).
- Create Range Filter: Use a 100-period SMA of (high + low)/2, smoothed (e.g., via EMA if desired).
- Calculate VIX Proxy: Custom script for (ATR(14) / SMA(close, 14)) * 100.
- Add ADX (period 14, standard).
2. **Define Rules in Code/Script**:
- **Long Entry**: If SuperTrend direction < 0 (green), close > RangeFilterMedian, (VIX Proxy ≥ 15 OR ADX ≥ 20), and not already long—buy on bar close.
- **Short Entry**: If SuperTrend direction > 0 (red), close < RangeFilterMedian, (VIX Proxy ≥ 15 OR ADX ≥ 20), and not already short—sell short.
- **Exit Long**: If in long and (SuperTrend > 0 OR close < RangeFilterMedian)—sell.
- **Exit Short**: If in short and (SuperTrend < 0 OR close > RangeFilterMedian)—cover.
- Monitor No Trade Zone visually (e.g., plot yellow background when VIX < 15 AND ADX < 20).
3. **Backtest and Optimize**:
- Use historical data on your asset (e.g., SPY on 1H chart).
- Test metrics: Win rate, profit factor, max drawdown. Adjust thresholds (e.g., ADX to 25) to reduce whipsaws.
- Forward-test on demo account to validate.
4. **Live Trading**:
- Apply to a chart, set alerts for entries/exits.
- Add risk rules: Position size 1-2% of capital, stop-loss at SuperTrend line.
- Monitor manually or automate via bots—avoid overtrading; use on trending assets.
For the adjustments I suggested earlier (e.g., ADX 25, 2-bar confirmation), integrate them into entries only—test one at a time to isolate improvements. If whipsaws persist, combine 2-3 tweaks.

SCTI V28Indicator Overview | 指标概述
English: SCTI V28 (Smart Composite Technical Indicator) is a multi-functional composite technical analysis tool that integrates various classic technical analysis methods. It contains 7 core modules that can be flexibly configured to show or hide components based on traders' needs, suitable for various trading styles and market conditions.
中文: SCTI V28 (智能复合技术指标) 是一款多功能复合型技术分析指标,整合了多种经典技术分析工具于一体。该指标包含7大核心模块,可根据交易者的需求灵活配置显示或隐藏各个组件,适用于多种交易风格和市场环境。
Main Functional Modules | 主要功能模块
1. Basic Indicator Settings | 基础指标设置
English:
EMA Display: 13 configurable EMA lines (default shows 8/13/21/34/55/144/233/377/610/987/1597/2584 periods)
PMA Display: 11 configurable moving averages with multiple MA types (ALMA/EMA/RMA/SMA/SWMA/VWAP/VWMA/WMA)
VWAP Display: Volume Weighted Average Price indicator
Divergence Indicator: Detects divergences across 12 technical indicators
ATR Stop Loss: ATR-based stop loss lines
Volume SuperTrend AI: AI-powered super trend indicator
中文:
EMA显示:13条可配置EMA均线,默认显示8/13/21/34/55/144/233/377/610/987/1597/2584周期
PMA显示:11条可配置移动平均线,支持多种MA类型(ALMA/EMA/RMA/SMA/SWMA/VWAP/VWMA/WMA)
VWAP显示:成交量加权平均价指标
背离指标:12种技术指标的背离检测系统
ATR止损:基于ATR的止损线
Volume SuperTrend AI:基于AI预测的超级趋势指标
2. EMA Settings | EMA设置
English:
13 independent EMA lines, each configurable for visibility and period length
Default shows 21/34/55/144/233/377/610/987/1597/2584 period EMAs
Customizable colors and line widths for each EMA
中文:
13条独立EMA均线,每条均可单独配置显示/隐藏和周期长度
默认显示21/34/55/144/233/377/610/987/1597/2584周期的EMA
每条EMA可设置不同颜色和线宽
3. PMA Settings | PMA设置
English:
11 configurable moving averages, each with:
Selectable types (default EMA, options: ALMA/RMA/SMA/SWMA/VWAP/VWMA/WMA)
Independent period settings (12-1056)
Special ALMA parameters (offset and sigma)
Configurable data source and plot offset
Support for fill areas between MAs
Price lines and labels can be added
中文:
11条可配置移动平均线,每条均可:
选择不同类型(默认EMA,可选ALMA/RMA/SMA/SWMA/VWAP/VWMA/WMA)
独立设置周期长度(12-1056)
设置ALMA的特殊参数(偏移量和sigma)
配置数据源和绘图偏移
支持MA之间的填充区域显示
可添加价格线和标签
4. VWAP Settings | VWAP设置
English:
Multiple anchor period options (Session/Week/Month/Quarter/Year/Decade/Century/Earnings/Dividends/Splits)
3 configurable standard deviation bands
Option to hide on daily and higher timeframes
Configurable data source and offset settings
中文:
多种锚定周期选择(会话/周/月/季/年/十年/世纪/财报/股息/拆股)
3条可配置标准差带
可选择在日线及以上周期隐藏
支持数据源选择和偏移设置
5. Divergence Indicator Settings | 背离指标设置
English:
12 detectable indicators: MACD, MACD Histogram, RSI, Stochastic, CCI, Momentum, OBV, VWmacd, Chaikin Money Flow, MFI, Williams %R, External Indicator
4 divergence types: Regular Bullish/Bearish, Hidden Bullish/Bearish
Multiple display options: Full name/First letter/Hide indicator name
Configurable parameters: Pivot period, data source, maximum bars checked, etc.
Alert functions: Independent alerts for each divergence type
中文:
检测12种指标:MACD、MACD柱状图、RSI、随机指标、CCI、动量、OBV、VWmacd、Chaikin资金流、MFI、威廉姆斯%R、外部指标
4种背离类型:正/负常规背离,正/负隐藏背离
多种显示选项:完整名称/首字母/不显示指标名称
可配置参数:枢轴点周期、数据源、最大检查柱数等
警报功能:各类背离的独立警报
6. ATR Stop Loss Settings | ATR止损设置
English:
Configurable ATR length (default 13)
4 smoothing methods (RMA/SMA/EMA/WMA)
Adjustable multiplier (default 1.618)
Displays long and short stop loss lines
中文:
可配置ATR长度(默认13)
4种平滑方法(RMA/SMA/EMA/WMA)
可调乘数(默认1.618)
显示多头和空头止损线
7. Volume SuperTrend AI Settings | Volume SuperTrend AI设置
English:
AI Prediction:
Configurable neighbors (1-100) and data points (1-100)
Price trend length and prediction trend length settings
SuperTrend Parameters:
Length (default 3)
Factor (default 1.515)
5 MA source options (SMA/EMA/WMA/RMA/VWMA)
Signal Display:
Trend start signals (circle markers)
Trend confirmation signals (triangle markers)
6 Alerts: Various trend start and confirmation signals
中文:
AI预测功能:
可配置邻居数(1-100)和数据点数(1-100)
价格趋势长度和预测趋势长度设置
SuperTrend参数:
长度(默认3)
因子(默认1.515)
5种MA源选择(SMA/EMA/WMA/RMA/VWMA)
信号显示:
趋势开始信号(圆形标记)
趋势确认信号(三角形标记)
6种警报:各类趋势开始和确认信号
Usage Recommendations | 使用建议
English:
Trend Analysis: Use EMA/PMA combinations to determine market trends, with long-period EMAs (e.g., 144/233) as primary trend references
Divergence Trading: Look for potential reversals using price-indicator divergences
Stop Loss Management: Use ATR stop loss lines for risk management
AI Assistance: Volume SuperTrend AI provides machine learning-based trend predictions
Multiple Timeframes: Verify signals across different timeframes
中文:
趋势分析:使用EMA/PMA组合判断市场趋势,长周期EMA(如144/233)作为主要趋势参考
背离交易:结合价格与指标的背离寻找潜在反转点
止损设置:利用ATR止损线管理风险
AI辅助:Volume SuperTrend AI提供基于机器学习的趋势预测
多时间框架:建议在不同时间框架下验证信号
Parameter Configuration Tips | 参数配置技巧
English:
For short-term trading: Focus on 8-55 period EMAs and shorter divergence detection periods
For long-term investing: Use 144-2584 period EMAs with longer detection parameters
In ranging markets: Disable some EMAs, mainly rely on VWAP and divergence indicators
In trending markets: Enable more EMAs and SuperTrend AI
中文:
对于短线交易:可重点关注8-55周期的EMA和较短的背离检测周期
对于长线投资:建议使用144-2584周期的EMA和较长的检测参数
在震荡市:可关闭部分EMA,主要依靠VWAP和背离指标
在趋势市:可启用更多EMA和SuperTrend AI
Update Log | 更新日志
English:
V28 main updates:
Added Volume SuperTrend AI module
Optimized divergence detection algorithm
Added more EMA period options
Improved UI and parameter grouping
中文:
V28版本主要更新:
新增Volume SuperTrend AI模块
优化背离检测算法
增加更多EMA周期选项
改进用户界面和参数分组
Final Note | 最后说明
English: This indicator is suitable for technical traders with some experience. We recommend practicing with demo trading to familiarize yourself with all features before live trading.
中文: 该指标适合有一定经验的技术分析交易者使用,建议先通过模拟交易熟悉各项功能后再应用于实盘。

PowerStrike Pro V3Purpose of the Script
"PowerStrike Pro V3" is a custom indicator designed to generate high-accuracy buy/sell signals by combining multiple technical analysis tools. This script is optimized for trend-following, scalping, and support/resistance strategies. It integrates popular indicators such as RSI, Supertrend, Bollinger Bands, and dynamic support/resistance levels to provide traders with reliable signals.
Components of the Script and How It Works
The script combines the following key components, each contributing to the total signal strength based on user-defined weights. Below is a detailed explanation of how each component works and how it contributes to the overall score:
1. RSI (Relative Strength Index)
How It Works:
RSI identifies overbought (above 70) and oversold (below 30) conditions in the market.
The script uses RSI values to measure the strength of the trend and generate buy/sell signals.
When RSI is in the oversold zone, it strengthens buy signals. When in the overbought zone, it strengthens sell signals.
Contribution to Total Score:
RSI's contribution is calculated based on its strength in the oversold or overbought zones.
The final contribution is weighted by the user-defined "RSI Weight" and added to the total score.
2. Support and Resistance Levels
How It Works:
The script dynamically calculates recent peaks (resistance) and valleys (support) using a user-defined lookback period.
These levels are plotted on the chart as dynamic support and resistance lines.
The proximity of the price to these levels strengthens the signals.
Contribution to Total Score:
If the price is near a support level, it increases the strength of buy signals.
If the price is near a resistance level, it increases the strength of sell signals.
The contribution is weighted by the "Support/Resistance Weight" and added to the total score.
3. Supertrend Indicator
How It Works:
Supertrend uses ATR (Average True Range) and a multiplier to determine the trend direction.
The script uses Supertrend's direction changes as a filter for buy/sell signals.
When Supertrend is in an uptrend, it strengthens buy signals. When in a downtrend, it strengthens sell signals.
Contribution to Total Score:
Supertrend's contribution is weighted by the "Supertrend Weight" and added to the total score.
4. Bollinger Bands
How It Works:
Bollinger Bands measure price volatility and identify potential support/resistance levels.
The script generates buy signals when the price crosses above the lower band and sell signals when it crosses below the upper band.
Contribution to Total Score:
A crossover above the lower band increases the strength of buy signals.
A crossover below the upper band increases the strength of sell signals.
The contribution is weighted by the "Bollinger Bands Weight" and added to the total score.
5. Order Book Data
How It Works:
The script analyzes bid/ask volumes from the order book to assess market depth.
High bid volume near support levels strengthens buy signals.
High ask volume near resistance levels strengthens sell signals.
Contribution to Total Score:
Order book data is weighted by the "Order Book Weight" and added to the total score.
Signal Types and Their Meaning
The script generates two types of signals:
Weak Signals:
Weak signals indicate the early stages of a trend or minor corrections.
These are represented by small green (buy) or red (sell) triangles on the chart.
Weak signals are suitable for low-risk trades or scalping strategies.
Strong Signals:
Strong signals indicate the continuation of a trend or significant reversal points.
These are represented by larger green (buy) or red (sell) arrows on the chart.
Strong signals are suitable for higher-risk, higher-reward trades.
Total Score Calculation
The script calculates the total buy and sell scores by combining the weighted contributions of all components. The formula for the total score is as follows:
Copy
Total Buy Score = (RSI Buy Strength * RSI Weight) + (Support Strength * Support/Resistance Weight) + (Supertrend Buy Strength * Supertrend Weight) + (Bollinger Buy Strength * Bollinger Weight) + (Order Book Buy Strength * Order Book Weight)
Total Sell Score = (RSI Sell Strength * RSI Weight) + (Resistance Strength * Support/Resistance Weight) + (Supertrend Sell Strength * Supertrend Weight) + (Bollinger Sell Strength * Bollinger Weight) + (Order Book Sell Strength * Order Book Weight)
The total score is then compared to user-defined thresholds to generate weak or strong signals. For example:
A total buy score above 80% generates a weak buy signal.
A total buy score above 85% generates a strong buy signal.
Recommended Strategies
Trend Following: Use strong signals to trade in the direction of the main trend.
Scalping: Use weak signals to capture short-term price movements.
Support/Resistance Trading: Use the dynamically plotted support and resistance levels to identify reversal points.
How to Use the Script
Weight Settings:
Adjust the weights for each component (RSI, Supertrend, Bollinger Bands, etc.) in the script settings to customize the signal strength calculation.
Signal Thresholds:
Set the thresholds for weak and strong signals (e.g., 80% for weak signals, 85% for strong signals).
Chart Visualization:
The script automatically plots buy/sell signals on the chart. Use these signals in conjunction with your trading strategy.
Unique Features of the Script
Dynamic Weighting: Each component's contribution to the total score can be customized using user-defined weights.
Integrated Support/Resistance: The script dynamically calculates and plots support/resistance levels, enhancing signal accuracy.
Order Book Analysis: The inclusion of order book data provides additional confirmation for signals.
Final Notes
While "PowerStrike Pro V3" combines multiple indicators to generate reliable signals, no indicator guarantees 100% accuracy. Always use proper risk management and combine this script with other analysis tools for the best results

Bewakoof stock indicator**Title**: "Bewakoof Stock Indicator: Multi-Timeframe RSI and SuperTrend Entry-Exit System"
---
### Description
The **Bewakoof Stock Indicator** is an original trading tool that combines multi-timeframe RSI analysis with the SuperTrend indicator to create reliable entry and exit signals for trending markets. This indicator is designed for traders looking to follow strong trends with built-in risk management. By filtering entries through short- and long-term momentum and utilizing dynamic trailing exits, this indicator provides a structured approach to trading.
#### Indicator Components
1. **Multi-Timeframe RSI Analysis**:
- The Relative Strength Index (RSI) is calculated across three timeframes: Daily, Weekly, and Monthly.
- By examining multiple timeframes, the indicator confirms that trends align over short, medium, and long-term intervals, making buy signals more reliable.
- **Buy Condition**: All three RSI values must meet these thresholds:
- **Daily RSI > 50** – indicates short-term upward momentum,
- **Weekly RSI > 60** – signals medium-term strength,
- **Monthly RSI > 60** – confirms long-term trend alignment.
- This filtering process ensures that buy signals are generated only in stable, upward-trending markets.
2. **SuperTrend Confirmation**:
- The SuperTrend (20-period ATR with a multiplier of 2) acts as a trend filter and trailing stop mechanism.
- For a buy condition to be valid, the closing price must be above the SuperTrend level, verifying that the market is trending up.
- The combination of RSI and SuperTrend helps to avoid false signals, focusing only on well-established trends.
#### Trade Signals
- **Buy Signal**: When both the multi-timeframe RSI and SuperTrend conditions are met, a buy signal is triggered, indicated by a “BUY” label on the chart with details:
- **Entry Price**,
- **Initial Stop-Loss** (set at the SuperTrend level for risk control),
- **Target 1** – calculated with a 1:1 risk-reward ratio based on the initial stop-loss,
- **Target 2** – calculated with a 1:2 risk-reward ratio based on the initial stop-loss.
- **Exit Signals**: This indicator provides two exit strategies to protect profits:
1. **Fixed Stop-Loss**: Automatically set at the SuperTrend level at the time of entry to limit risk.
2. **Trailing Exit**: Exits are triggered if the price crosses below the SuperTrend level, adapting to potential trend reversals.
#### Labeling & Alerts
The **Bewakoof Stock Indicator** offers intuitive labeling and alert options:
- **Labels**: Buy and exit points are clearly marked, showing entry, stop-loss, and targets directly on the chart.
- **Alerts**: Custom alerts can be set for:
- **Buy signals** when both conditions are met, and
- **Exit signals** triggered by the stop-loss or trailing exit.
#### Use Case and Benefits
This indicator is ideal for trend-following traders who value risk control and trend confirmation:
- **Stronger Trend Signals**: By requiring RSI alignment across multiple timeframes, this indicator focuses only on trades with strong trend momentum.
- **Dynamic Risk Management**: Using both fixed and trailing exits enables flexible trade management, balancing risk and potential reward.
- **Simple Trade Execution**: The chart labels and alerts simplify trade decisions, making it easy to enter, manage, and exit trades.
#### How to Use
1. **Add** the Bewakoof Stock Indicator to your chart.
2. **Watch** for the "BUY" label as your entry point.
3. **Manage the trade** using the labeled stop-loss and target levels.
4. **Exit** on either a stop-loss hit or when the price crosses below the SuperTrend for a trailing exit.
The **Bewakoof Stock Indicator** is a complete solution for trend-following traders, combining the strength of multi-timeframe RSI with the SuperTrend’s trend-following capabilities. This systematic approach aims to provide high-confidence entries and effective risk management, empowering traders to follow trends with precision and control.

ema cross by himanshu and sunilCombined EMA & SuperTrend Indicator
The "Combined EMA & SuperTrend Indicator" is a powerful technical analysis tool designed to assist traders in identifying trends and potential entry/exit points in the markets. This indicator combines two popular indicators: Exponential Moving Averages (EMAs) and the SuperTrend indicator, providing a comprehensive view of market conditions.
Key Features:
EMA Visualization: The indicator plots both short-term and long-term Exponential Moving Averages (EMAs) on the chart. The EMAs help traders identify the underlying trend and potential reversals.
SuperTrend Indicator: The SuperTrend indicator is used to identify trends and potential stop-loss levels. The indicator adapts to changing market conditions by factoring in the Average True Range (ATR) and a user-defined factor.
Alerts: The indicator generates alerts for specific conditions, such as crossovers of the EMAs and SuperTrend direction changes. This helps traders stay informed about potential trading opportunities.
How to Use:
EMA Crossovers: Pay attention to the crossovers of the short-term and long-term EMAs. When the short-term EMA crosses above the long-term EMA, it may indicate a potential bullish trend. Conversely, when the short-term EMA crosses below the long-term EMA, it may suggest a bearish trend.
SuperTrend Direction: Watch the color of the SuperTrend line. A green line indicates an uptrend, while a red line suggests a downtrend. This can help you confirm the overall trend direction.
Alerts: Take advantage of the built-in alerts to receive notifications when significant events occur, such as EMA crossovers or SuperTrend direction changes. This can help you stay informed even when you're not actively monitoring the chart.
Usage:
Apply the "Combined EMA & SuperTrend Indicator" to any chart on TradingView to visualize the EMAs and SuperTrend lines.
Configure the EMA periods, ATR length, and SuperTrend factor according to your trading style and preferences.
Utilize the generated alerts to promptly react to potential trading opportunities.
Note: This indicator is intended for educational and informational purposes. Always perform thorough analysis and consider risk management practices before making trading decisions.
Disclaimer: This indicator does not guarantee profitable trades. Past performance is not indicative of future results. Trading involves risk, and you should only trade with funds you can afford to lose.

[Rygel] Dual time frame Bollinger Bands with signals and alertsThis indicator displays two Bollinger Bands coming from two different time frames, chart's current one and a higher one.
It analyzes these two Bollinger Bands data and combines them with RSI, MFI and MACD divergences and SuperTrend to identify areas of opportunity where price is the most likely to be at a local top or bottom.
It uses probabilistic data, the Bollinger Bands, to identify convergence areas where the price is statistically overbought or oversold simultaneously at two different time frames, it then looks for signs of a trend exhaustion, using RSI, MFI and MACD divergences, and finally it looks for an early confirmation of a trend reversal, using SuperTrend data with aggressive settings.
This indicator does not produce buy and sell signals. You won't get a buy for every sell or a sell for every buy. In a bearish trend, you may get multiple consecutive bullish signals and in a bullish trend multiple bearish signals.
It is meant to help you to identify and to alert you about areas of opportunity where you could, for instance, consider taking some profits or opening a trade.
It is meant to support your investment or trading decisions, not to induce them.
SIGNALS
This indicator generated multiple types of signals. Diamonds are better than squares. Colored ones are better than grey ones.
Green square: a bullish signal confirmed by a regular divergence
Red square: a bearish signal confirmed by a regular divergence
Blue square: a bullish signal confirmed by a hidden divergence (disabled by default as these signals are less reliable)
Orange square: a bearish signal confirmed by a hidden divergence (disabled by default as these signals are less reliable)
Diamonds: same as the square signals but the signal is forming a divergence with a previous one. Diamond signals are always stronger (i.e. more reliable) than square signals.
Grey signals: same as the previous ones but for weaker signals. These signals appear when price in the current time frame is overbought or oversold but only close to be at the higher timeframe. (disabled by default as these signals are less reliable)
When a weak signal follows a strong one and creates a MACD divergence with it, it will be considered as a strong signal and displayed as a colored signal, even when weak signals are disabled.
When a strong signal follows a weak one, forming a MACD divergence, it will be shown as a diamond signal, even when weak signals are disabled.
Most reliable signals are green and red diamonds.
SETTINGS
Bollinger Bands
Source: the source used to calculate the Bollinger Bands ("close" by default)
Length: the moving-average length of the Bollinger Bands (20 by default)
You will most likely have no need to change these settings. If you're wondering what they actually do, you should most likely not touch them.
Main channel standard deviation: the standard deviation used to calculate the classical Bollinger Bands channel. (2.0 by default)
Outer bands standard deviation: additional channels outside the main one, using a larger standard deviation. (3.0 by default)
Theoretically, with a 1.0 standard deviation, around 68% of the price action should be contained within the Bollinger Bands.
With a 2.0 standard deviation, around 95%.
With a 3.0 standard deviation, around 99.7%.
With a 4.0 standard deviation, around 99.99%.
But as security prices returns have no actual statistical distribution, these probabilities don't strictly apply to Bollinger Bands. According to Wikipedia, studies have found that with a 2.0 standard deviation, only about 88% (85–90%) of the price data remain with the Bollinger Bands, instead of the theoretical 95%.
The higher you set the values, the less signals you'll get.
You should most likely keep the main channel standard deviation between 2 and 3 and add between +0.5 and +1 for the outer bands.
Most commonly used value for Bollinger Bands is 2.0.
Current time frame
Show current time frame Bollinger Bands: these are the Bollinger Bands you're used to. (enabled by default)
Show current time frame outer bands: add two additional bands outside the main channel using a larger standard deviation. (enabled by default)
Higher time frame
Show higher time frame Bollinger Bands: display secondary Bollinger Bands from a higher time frame. Time frames are configured in the below "Time frames" section. (enabled by default)
Show higher time frame outer bands: add two additional bands outside the main channel using a larger standard deviation (enabled by default)
Overbought and oversold
Show oversold and overbought background: add a background to the higher time Bollinger Bands whose color depends on the dual time frame Bollinger Bands oversold / overbought status. (enabled by default)
Asset is considered overbought/oversold when its price is outside of the Bollinger Bands' main channel.
Asset is considered strongly overbought/oversold when its price is outside of the Bollinger Bands' outer bands.
Dark red: both time frame are overbought (outside the main channel)
Red: one time frame is strongly overbought (outside the outer bands) and the other one is overbought (outside the main channel)
Bright red: both time frame are strongly overbought (outside the outer bands)
Dark green: both time frame are oversold (outside the main channel)
Green: one time frame is strongly oversold (outside the outer bands) and the other one is oversold (outside the main channel)
Bright green: both time frame are strongly oversold (outside the outer bands)
Signals
Show signals: display signals when an area of opportunity is detected. Read the introduction and the Signals section for more information. (enabled by default)
Show weak signals: display signals although at the higher time frame price is not yet overbought or oversold but close to be (disabled by default)
Divergences
Use MACD for divergences (enabled by default)
Use MFI for divergences (enabled by default)
Use RSI for divergences (enabled by default)
At least one source of divergences must be enabled for signals to work.
Enable hidden divergences: signals don't use hidden divergences by default as they generate more false positives than regular divergences. You can enable them to get more signals, it can be especially useful at high time frames (like weekly, monthly, etc.) where signals are rarer. (disabled by default)
Show divergences: draw MACD, MFI and RSI divergences on the chart. (disabled by default)
Green: regular bullish divergence
Red: regular bearish divergence
Blue: hidden bullish divergence
Orange: hidden bearish divergence
Confirmation
Confirmation speed: a faster confirmation speed will generate more false positive signals, a slower one will produce delayed but more reliable signals.
Fastest: don't wait for a SuperTrend confirmation, only wait for a divergence confirmation. Lot of false positives.
Fast: wait for a fast SuperTrend confirmation (SuperTrend factor = 1).
Medium: wait for a slower but more reliable SuperTrend confirmation (SuperTrend factor = 2). Fewer false positives but more lagging signals.
Slow: wait for an even slower but very reliable SuperTrend confirmation (SuperTrend factor = 3). Very few false positives but very late signals.
Time frames
You can define the higher time frames you wish to use here.
Default values try to adhere to a x6 to x8 ratio, x4 to x12 at maximum.
Some pairs are more significant than others, like 4 hour + daily, daily + weekly and weekly + monthly.
1 second: 10 seconds
5 seconds: 30 seconds
10 seconds: 1 minute
15 seconds: 2 minutes
30 seconds: 3 minutes
1 minute: 10 minutes
2 minutes: 15 minutes
3-4 minutes: 30 minutes
5-9 minutes: 45 minutes
10-11 minutes: 1 hour
12-14 minutes: 1 hour
15-29 minutes: 2 hours
30-44 minutes: 4 hours
45-59 minutes: 6 hours
1 hour: 8 hours
2 hours: 12 hours
3 hours: 1 day
4-5 hours: 1 day
6-7 hours: 2 days
8-11 hours: 3 days
12-23 hours: 4 days
1 day: 1 week
2 days: 2 weeks
3 days: 3 weeks
4 days: 1 month
5 days: 1 month
6 days: 1 month
1 week: 1 month
2 weeks: 2 months
3 weeks: 3 months
1 month: 6 months
2 months: 9 months
3 months: 12 months
4 months: 15 months
5 months: 21 months
6 months: 24 months
Time frames use the TradingView units:
s = seconds
h = hours
D = days
W = weeks
M = months
no unit = minutes
Time frame strings follow these rules:
They are composed of the multiplier and the time frame unit, e.g., “1S”, “30” (30 minutes), “1D” (one day), “3M” (three months).
The unit is represented by a single letter, with no letter used for minutes: “S” for seconds, “D” for days, “W” for weeks and “M” for months.
When no multiplier is used, 1 is assumed: “S” is equivalent to “1S”, “D” to “1D, etc. If only “1” is used, it is interpreted as “1min”, since no unit letter identifier is used for minutes.
There is no “hour” unit; “1H” is not valid. The correct format for one hour is “60” (remember no unit letter is specified for minutes).
The valid multipliers vary for each time frame unit:
- For seconds, only the discrete 1, 5, 10, 15 and 30 multipliers are valid.
- For minutes, 1 to 1440.
- For days, 1 to 365.
- For weeks, 1 to 52.
- For months, 1 to 12.
Styles
You can configure the appearance of the Bollinger Bands, the overbought / oversold background, the divergences and the signals here.
Advanced - MACD
Settings used for the MACD divergences. You most likely won't need to change these values, especially if you need them to be explained.
Advanced - MFI
Settings used for the MACD divergences. You most likely won't need to change these values, especially if you need them to be explained.
Advanced - RSI
Settings used for the MACD divergences. You most likely won't need to change these values, especially if you need them to be explained.
Advanced - SuperTrend
Settings used for the MACD divergences. You most likely won't need to change these values, especially if you need them to be explained.
ALERTS
Any signal: a bullish or bearish signal has been detected.
Bullish signal: a bullish signal has been detected.
Bullish signal with divergence: a bullish signal forming a divergence with a previous bullish signal has been detected.
Bearish signal: a bearish signal has been detected.
Bearish signal with divergence: a bearish signal forming a divergence with a previous bearish signal has been detected.
Overbought/oversold = asset price is outside of the Bollinger Bands' main channel.
Strongly overbought/oversold = asset price is outside of the Bollinger Bands' outer bands.
Current time frame - Entering overbought: asset is now overbought at the current time frame.
Current time frame - Exiting overbought: asset is not overbought anymore at the current time frame.
Current time frame - Entering strongly overbought: asset is now strongly overbought at the current time frame.
Current time frame - Exiting strongly overbought: asset is not strongly overbought anymore at the current time frame.
Current time frame - Entering oversold: asset is now oversold at the current time frame.
Current time frame - Exiting oversold: asset is not oversold anymore at the current time frame.
Current time frame - Entering strongly oversold: asset is now strongly oversold at the current time frame.
Current time frame - Exiting strongly oversold: asset is not strongly oversold anymore at the current time frame.
Higher time frame - Entering overbought: asset is now overbought at the higher time frame.
Higher time frame - Exiting overbought: asset is not overbought anymore at the higher time frame.
Higher time frame - Entering strongly overbought: asset is now strongly overbought at the higher time frame.
Higher time frame - Exiting strongly overbought: asset is not strongly overbought anymore at the higher time frame.
Higher time frame - Entering oversold: asset is now oversold at the higher time frame.
Higher time frame - Exiting oversold: asset is not oversold anymore at the higher time frame.
Higher time frame - Entering strongly oversold: asset is now strongly oversold at the higher time frame.
Higher time frame - Exiting strongly oversold: asset is not strongly oversold anymore at the higher time frame.
Dual time frame - Entering overbought: asset is now overbought at current and higher time frames.
Dual time frame - Exiting overbought: asset is not overbought anymore at current and higher time frames.
Dual time frame - Entering oversold: asset is now oversold at current and higher time frames.
Dual time frame - Exiting oversold: asset is not oversold anymore at current and higher time frames.
Dual time frame - Entering strongly overbought: asset is now strongly overbought at current and higher time frames.
Dual time frame - Exiting strongly overbought: asset is not strongly overbought anymore at current and higher time frames.
Dual time frame - Entering strongly oversold: asset is now strongly oversold at current and higher time frames.
Dual time frame - Exiting strongly oversold: asset is not strongly oversold anymore at current and higher time frames.
ABOUT THE HIGHER TIME FRAME BOLLINGER BANDS
Using a classical higher time frame Bollinger Bands would produce lagging data. For instance, if we are using a weekly BB at the daily time frame, we'll have to wait up to 7 days for the weekly bar to close to get the actual final weekly BB values. Instead, this indicator generates real time higher time frame Bollinger Bands by multiplying the moving average length of the Bollinger Bands by the higher time frame / current time frame ratio. For instance, a weekly BB in the daily time frame will use a x7 ratio (i.e. a 20 * 7 = 140 days MA BB).
It produces slightly different but very similar bands that are as meaningful and can be used in real time at lower time frames.
Alternatives would have been to wait up to seven days for signals to be finalized, which would have render them meaningless. Or to use previous week data, which would have made the signal inaccurrate.
To sum up, weekly Bollinger Bands use a 20 weeks moving average updated one time a week. In the daily time frame, this indicator also use a 20 weeks (140 days) moving average but updated daily instead of weekly.
A comparison between a traditional higher time frame Bollinger Bands vs the ones used by this indicator:
Blue and orange lines are the actual weekly BBs, grey ones are the daily updated ones.
ABOUT THE DIVERGENCES
This indicator uses the same divergences algorithm as my other indicators:
- RSI with divergences
- MACD with divergences
- Trend Reversal Indicator
You'll find more information about this algorithm on my RSI page.
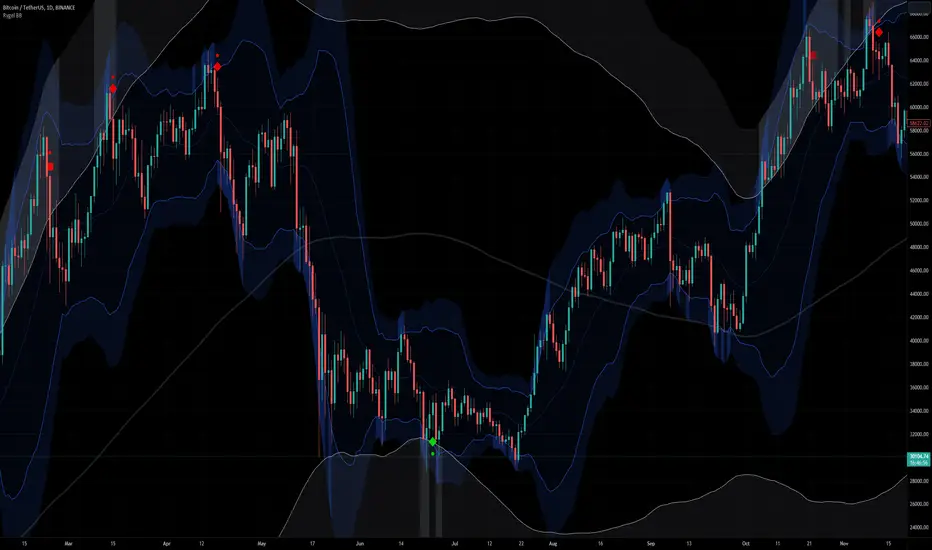
Miyagi STrendMiyagi: The attempt at mastering something for the best results.
Miyagi indicators combine multiple trigger conditions and place them in one toolbox for traders to easily use, produce alerts, backtest, reduce risk and increase profitability.
Miyagi STrend was created to allow traders the ability to both scalp and swing trade from as singular indicator. STrend aims to help traders catch more of the move.
STrend starts with the native TradingView SuperTrend indicator and adds in extra filtering in the form of the SuperTrend Oscillator (ST OSC), and an Adaptive Moving Average (AMA) - all of which are adjustable.
Entry conditions start with the following:
Long Entry: SuperTrend must be green (candles above SuperTrend), price above the Adaptive Moving Average (AMA), and lastly the SuperTrend Oscillator (ST OSC) at maximum +100.
Short Entry: SuperTrend must be red (candles below SuperTrend), price below the Adaptive Moving Average (AMA), and lastly the SuperTrend Oscillator (ST OSC) at maximum -100.
Exits are provided for both directions, long and short, when the SuperTrend Oscillator (ST OSC) hits maximum (+100/-100).
Please note the SuperTrend Oscillator (ST OSC) is not shown on the chart however is used for the final calculation to confirm entries.
We have added an "Entry on Exit" selector which allows users to enable entries on exit candles. This may allow more trades, however will incur more risk.
With "Entry on Exit" selected entry and exit alerts CAN fire in same candle and may require delays if using STrend as a swing indicator.
Without "Entry on Exit" selected entry and exit alerts CANNOT fire in same candle. This will produce less signals overall however may be safer for traders to use.
It would be best suited to utilize a stoploss when trading with Miyagi STrend to minimize risk.
Alerts are meant to fire on "Once per Bar Close" to confirm entry and exit signals.
Happy Trading!

DTM 444 BANDS 🚀DTM 444 BANDS 🚀:
The DTM 444 BANDS 🚀 is a powerful, multi-purpose trading indicator combining Supertrend, Dynamic Band Levels, Breakout Signals, and Volume Confirmation to help traders identify high-probability trade setups across different timeframes.
🔧 Key Features
✅ Multi-Timeframe Support
Analyze price action across any timeframe using the Timeframe input.
All band calculations (High, Low, Midline, and Supertrend) are pulled from a higher timeframe for clearer context.
✅ Dynamic Bands Based on Supertrend
High Band: Rolling highest of Supertrend over hiLen period.
Low Band: Rolling lowest of Supertrend over loLen period.
Midline: Midpoint of the above.
Acts like dynamic support/resistance, ideal for trend-following and breakout strategies.
✅ Dual Signal System
Breakout Signals (Buy and Sell): Triggered when price breaks the bands with volume confirmation.
Supertrend Crossover Signals (Buy1 and Sell1): Classic momentum entries with a confirmation twist.
Exit Signals: Optional take-profit/neutral indicators when price reverses.
✅ Volume Confirmation Filter (Optional)
Only triggers signals if the volume exceeds its 20-period SMA.
Helps filter out false breakouts and weak trends in low-liquidity periods.
✅ Visual Enhancements
Color-coded candles based on band positioning (e.g., red = weak, green = strong, etc.)
On-chart labels for each signal for quick reference.
Real-time Signal Dashboard using Pine Script tables showing:
Current signal
Volume filter status
Live volume vs volume SMA
🧪 Practical Use Cases
Trend Traders: Use the Supertrend cross and band breakouts to ride trends early.
Breakout Traders: Catch high-probability moves outside established ranges.
Swing Traders: Time entries and exits using color-coded bars and exit labels.
Volume-Sensitive Traders: Focus on trades with strong volume backing.
📊 Backtest Snapshot
Based on the example chart for Reliance Industries (RELIANCE.NS) on the weekly timeframe:
Several profitable buy and breakout signals during uptrends.
Timely exits and breakdown alerts before reversals.
Volume filter keeps trades clean and avoids noise.
⚙️ Customizable Parameters
High Length and Low Length (default: 19)
Supertrend Multiplier and ATR Length
Volume Filter: Toggle ON/OFF
Volume SMA Length: Default 20
Custom Timeframe: Choose any higher timeframe for multi-timeframe analysis
📢 Alerts Ready
Fully integrated with TradingView alerts:
Breakout & Breakdown
Supertrend crossovers
All alerts respect the volume filter setting
🏁 Final Thoughts
DTM 444 BANDS 🚀 is a versatile and adaptive trading system that blends trend analysis, volatility bands, and volume validation. Whether you're a trend trader, breakout hunter, or swing trader — this tool gives you a structured edge with clear visual cues and real-time alerts.

Artharjan Heiken Ashi Super TrendArtharjan Heiken Ashi SuperTrend (AHAST)
The Artharjan Heiken Ashi SuperTrend (AHAST) indicator is a refined version of the classic SuperTrend tool, designed for traders who wish to blend trend-following logic with the smoothing effects of Heiken Ashi candles. This script not only highlights market trends but also introduces multi-timeframe filtering, visual cues, and alerts for sharper decision-making.
🔑 Key Features
Heiken Ashi Integration
Option to calculate trends using standard candles or Heiken Ashi candles.
Provides smoother visualization, reducing noise.
Flexible ATR Calculation
Choose between RMA (default) and SMA for ATR computation.
Option to switch between traditional ATR and Heiken Ashi-based ATR.
Customizable Inputs
ATR length, multiplier factor, trend colors, and higher-timeframe filters are all user-configurable.
Debug mode available for internal verification.
Visual Enhancements
Dynamic background highlighting to clearly distinguish bullish vs bearish phases.
Fill plots that emphasize ongoing trends.
Buy and Sell signal markers with optional on/off toggle.
Multi-Timeframe (MTF) Filter
Fetches higher timeframe (e.g., Weekly) Heiken Ashi values.
Detects bullish and bearish flips on higher timeframe trends.
Overlay highlights to align lower timeframe trades with broader market direction.
Alerts & Automation
Alerts available for:
Buy / Sell triggers
Direction changes
Higher timeframe bullish or bearish flips
Compatible with TradingView alerts for automated workflows.
⚙️ How It Works
Core Trend Logic
The script calculates the median price of Heiken Ashi highs and lows.
SuperTrend bands (up and dn) are adjusted using ATR.
A bullish or bearish state is determined based on price closing above or below these bands.
Signal Generation
Buy Signal: Trend flips from bearish (-1) to bullish (+1).
Sell Signal: Trend flips from bullish (+1) to bearish (-1).
Signals can be plotted as circles, labels, or both depending on configuration.
MTF SuperTrend
Parallel SuperTrend calculation on a higher timeframe (user-selected).
Detects bullish flip (HTF ↑) or bearish flip (HTF ↓).
Highlights the chart background with higher timeframe color filters when enabled.
Debug Mode
Turns on background shading to indicate whether Heiken Ashi or regular candles are in use.
Helps verify internal logic for advanced users.
🎨 Visualization Example
Green Highlight / Fill → Active bullish trend
Red Highlight / Fill → Active bearish trend
Light Blue / Gray Highlights → Higher timeframe bullish / bearish alignment
Buy / Sell Labels → Clear entry or exit cues, aligned with the trend
🚨 Practical Usage
Swing Traders: Use higher timeframe filters (e.g., Weekly) to align intraday signals with broader market direction.
Intraday Traders: Focus on Heiken Ashi smoothing to avoid whipsaws in volatile sessions.
Options Traders: Combine bullish/bearish flips with option strategies (e.g., Calls/Puts) to gain directional exposure.
✅ Final Thoughts
The Artharjan Heiken Ashi SuperTrend (AHAST) is not just another SuperTrend indicator—it’s a versatile trading companion. By merging classic ATR-based logic with Heiken Ashi smoothing and multi-timeframe confirmation, this tool equips traders with early signals, trend clarity, and strong alignment across timeframes.
Use it with discipline, combine it with your trading framework, and let it sharpen your edge in the markets.
With Thanks,
Rrahul Desai
@Artharjan
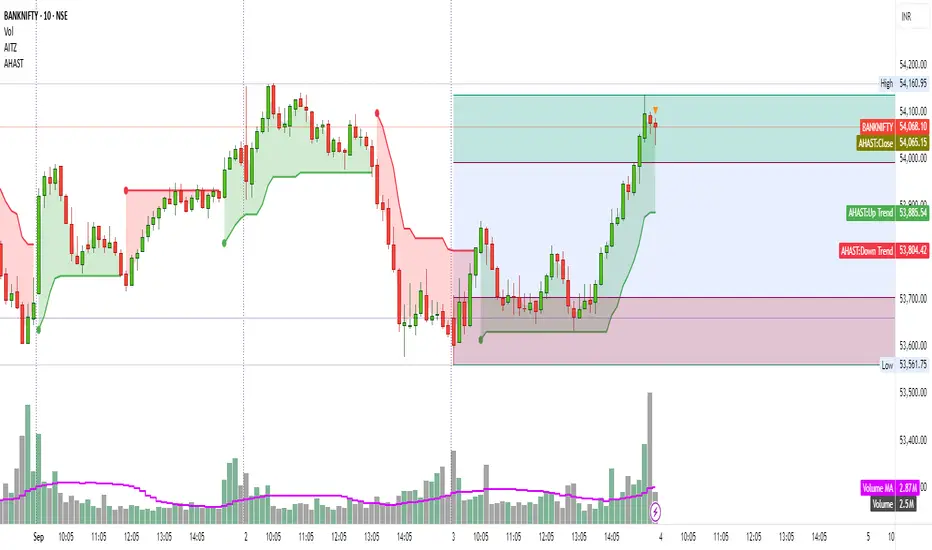
IU Indicators DashboardDESCRIPTION
The IU Indicators Dashboard is a comprehensive multi-stock monitoring tool that provides real-time technical analysis for up to 10 different stocks simultaneously. This powerful indicator creates a customizable table overlay that displays the trend status of multiple technical indicators across your selected stocks, giving you an instant overview of market conditions without switching between charts.
Perfect for portfolio monitoring, sector analysis, and quick market screening, this dashboard consolidates critical technical data into one easy-to-read interface with color-coded trend signals.
USER INPUTS
Stock Selection (10 Configurable Stocks):
- Stock 1-10: Customize any symbols (Default: NSE:CDSL, NSE:RELIANCE, NSE:VEDL, NSE:TCS, NSE:BEL, NSE:BHEL, NSE:TATAPOWER, NSE:TATASTEEL, NSE:ITC, NSE:LT)
Technical Indicator Parameters:
- EMA 1 Length: First Exponential Moving Average period (Default: 20)
- EMA 2 Length: Second Exponential Moving Average period (Default: 50)
- EMA 3 Length: Third Exponential Moving Average period (Default: 200)
- RSI Length: Relative Strength Index calculation period (Default: 14)
- SuperTrend Length: SuperTrend indicator period (Default: 10)
- SuperTrend Factor: SuperTrend multiplier factor (Default: 3.0)
Visual Customization:
- Table Size: Choose from Normal, Tiny, Small, or Large
- Table Background Color: Customize dashboard background
- Table Frame Color: Set frame border color
- Table Border Color: Configure border styling
- Text Color: Set text display color
- Bullish Color: Color for positive/bullish signals (Default: Green)
- Bearish Color: Color for negative/bearish signals (Default: Red)
LOGIC OF THE INDICATOR
The dashboard employs a multi-timeframe analysis approach using five key technical indicators:
1. Triple EMA Analysis
- Compares current price against three different EMA periods (20, 50, 200)
- Bullish Signal: Price above EMA level
- Bearish Signal: Price below EMA level
- Provides short-term, medium-term, and long-term trend perspective
2. RSI Momentum Analysis
- Uses 14-period RSI with 50-level threshold
- Bullish Signal: RSI > 50 (upward momentum)
- Bearish Signal: RSI < 50 (downward momentum)
- Identifies momentum strength and potential reversals
3. SuperTrend Direction
- Utilizes SuperTrend with configurable length and factor
- Bullish Signal: SuperTrend direction = -1 (uptrend)
- Bearish Signal: SuperTrend direction = 1 (downtrend)
- Provides clear trend direction with volatility-adjusted signals
4. MACD Histogram Analysis
- Uses standard MACD (12, 26, 9) histogram values
- Bullish Signal: Histogram > 0 (bullish momentum)
- Bearish Signal: Histogram < 0 (bearish momentum)
- Identifies momentum shifts and trend confirmations
5. Real-time Data Processing
- Implements request.security() for multi-symbol data retrieval
- Uses barstate.isrealtime logic for accurate live data
- Processes data only on the last bar for optimal performance
WHY IT IS UNIQUE
Multi-Stock Monitoring
- Monitor up to 10 different stocks simultaneously on a single chart
- No need to switch between multiple charts or timeframes
Highly Customizable Interface
- Full color customization for personalized visual experience
- Adjustable table size and positioning
- Clean, professional dashboard design
Real-time Analysis
- Live data processing with proper real-time handling
- Instant visual feedback through color-coded signals
- Optimized performance with smart data retrieval
Comprehensive Technical Coverage
- Combines trend-following, momentum, and volatility indicators
- Multiple timeframe perspective through different EMA periods
- Balanced approach using both lagging and leading indicators
Flexible Configuration
- Easy symbol switching for different markets (NSE, BSE, NYSE, NASDAQ)
- Adjustable indicator parameters for different trading styles
- Suitable for both swing trading and position trading
HOW USERS CAN BENEFIT FROM IT
Portfolio Management
- Quick Portfolio Health Check: Instantly assess the technical status of your entire stock portfolio
- Diversification Analysis: Monitor stocks across different sectors to ensure balanced exposure
- Risk Management: Identify which positions are showing bearish signals for potential exit strategies
- Rebalancing Decisions: Spot strongest performers for potential position increases
Market Screening and Analysis
- Sector Rotation: Compare different sector stocks to identify rotation opportunities
- Relative Strength Analysis: Quickly identify which stocks are outperforming or underperforming
- Market Breadth Assessment: Gauge overall market sentiment by monitoring diverse stock selections
- Trend Confirmation: Validate market trends by observing multiple stock behaviors
Time-Efficient Trading
- Single-Glance Analysis: Get complete technical overview without chart-hopping
- Pre-Market Preparation: Quickly assess overnight changes across multiple positions
- Intraday Monitoring: Track multiple opportunities simultaneously during trading hours
- End-of-Day Review: Efficiently review all watched stocks for next-day planning
Strategic Decision Making
- Entry Point Identification: Spot stocks showing bullish alignment across multiple indicators
- Exit Signal Recognition: Identify positions showing deteriorating technical conditions
- Swing Trading Opportunities: Find stocks with favorable technical setups for swing trades
- Long-term Investment Guidance: Use 200 EMA signals for long-term position decisions
Educational Benefits
- Pattern Recognition: Learn how different indicators behave across various market conditions
- Correlation Analysis: Understand how stocks move relative to each other
- Technical Analysis Learning: Observe multiple indicator interactions in real-time
- Market Sentiment Understanding: Develop better market timing skills through multi-stock observation
Workflow Optimization
- Reduced Chart Clutter: Keep your main chart clean while monitoring multiple stocks
- Faster Analysis: Complete technical analysis of 10 stocks in seconds instead of minutes
- Consistent Methodology: Apply the same technical criteria across all monitored stocks
- Alert Integration: Easy visual identification of stocks requiring immediate attention
This indicator is designed for traders and investors who want to maximize their market awareness while minimizing analysis time. Whether you're managing a portfolio, screening for opportunities, or learning technical analysis, the IU Indicators Dashboard provides the comprehensive overview you need for better trading decisions.
DISCLAIMER :
This indicator is not financial advice, it's for educational purposes only highlighting the power of coding( pine script) in TradingView, I am not a SEBI-registered advisor. Trading and investing involve risk, and you should consult with a qualified financial advisor before making any trading decisions. I do not guarantee profits or take responsibility for any losses you may incur.

Linear % ST | QuantEdgeB🚀 Introducing Linear Percentile SuperTrend (Linear % ST) by QuantEdgeB
🛠️ Overview
Linear % SuperTrend (Linear % ST) by QuantEdgeB is a hybrid trend-following indicator that combines Linear Regression, Percentile Filters, and Volatility-Based SuperTrend Logic into one dynamic tool. This system is designed to identify trend shifts early while filtering out noise during choppy market conditions.
By utilizing percentile-based median smoothing and customized ATR multipliers, this tool captures both breakout momentum and pullback opportunities with precision.
✨ Key Features
🔹 Percentile-Based Median Filtering
Removes outliers and normalizes price movement for cleaner trend detection using the 50th percentile (median) of recent price action.
🔹 Linear Regression Smoothing
A smoothed baseline is computed with Linear Regression to detect the underlying trend while minimizing lag.
🔹 SuperTrend Structure with Adaptive Bands
The indicator implements an enhanced SuperTrend engine with custom ATR bands that adapt to trend direction. Bands tighten or loosen based on volatility and trend strength.
🔹 Dynamic Long/Short Conditions
Long and short signals are derived from the relationship between price and the SuperTrend threshold zones, clearly showing trend direction with optional "Long"/"Short" labels on the chart.
🔹 Multiple Visual Themes
Select from 6 built-in color palettes including Strategy, Solar, Warm, Cool, Classic, and Magic to match your personal style or strategy layout.
📊 How It Works
1️⃣ Percentile Filtering
The source price (default: close) is filtered using a nearest-rank 50th percentile over a custom lookback. This normalizes data to reflect the central tendency and removes noisy extremes.
2️⃣ Linear Regression Trend Base
A Linear Regression Moving Average (LSMA) is applied to the filtered median, forming the core trend line. This dynamic trendline provides a low-lag yet smooth view of market direction.
3️⃣ SuperTrend Engine
ATR is applied with custom multipliers (different for long and short) to create dynamic bands. The bands react to price movement and only shift direction after confirmation, preventing false flips.
4️⃣ Trend Signal Logic
• When price stays above the dynamic lower band → Bullish trend
• When price breaks below the upper band → Bearish trend
• Trend direction remains stable until violated by price.
⚙️ Custom Settings
• Percentile Length → Lookback for percentile smoothing (default: 35)
• LSMA Length → Determines the base trend via linear regression (default: 24)
• ATR Length → ATR period used in dynamic bands (default: 14)
• Long Multiplier → ATR multiplier for bullish thresholds (default: 0.8)
• Short Multiplier → ATR multiplier for bearish thresholds (default: 1.9)
✅ How to Use
1️⃣ Trend-Following Strategy
✔️ Go Long when price breaks above the lower ATR band, initiating an upward trend
✔️ Go Short when price falls below the upper ATR band, confirming bearish conditions
✔️ Remain in trend direction until the SuperTrend flips
2️⃣ Visual Confirmation
✔️ Use bar coloring and the dynamic bands to stay aligned with trend direction
✔️ Optional Long/Short labels highlight key signal flips
👥 Who Should Use Linear % ST?
✅ Swing & Position Traders → To ride trends confidently
✅ Trend Followers → As a primary directional filter
✅ Breakout Traders → For clean signal generation post-range break
✅ Quant/Systematic Traders → Integrate clean trend logic into algorithmic setups
📌 Conclusion
Linear % ST by QuantEdgeB blends percentile smoothing with linear regression and volatility bands to deliver a powerful, adaptive trend-following engine. Whether you're a discretionary trader seeking cleaner entries or a systems-based trader building logic for automation, Linear % ST offers clarity, adaptability, and precision in trend detection.
🔹 Key Takeaways:
1️⃣ Percentile + Regression = Noise-Reduced Core Trend
2️⃣ ATR-Based SuperTrend = Reliable Breakout Confirmation
3️⃣ Flexible Parameters + Color Modes = Custom Fit for Any Strategy
📈 Use it to spot emerging trends, filter false signals, and stay confidently aligned with market momentum.
📌 Disclaimer: Past performance is not indicative of future results. No trading strategy can guarantee success in financial markets.
📌 Strategic Advice: Always backtest, optimize, and align parameters with your trading objectives and risk tolerance before live trading.

Smart Buy/Sell Signal IndicatorOverview
The Smart Buy/Sell Signal Indicator is a multi-factor trading tool that i ntegrates Supertrend, Bollinger Bands, RSI, ADX, and Moving Averages to generate high-probability buy and sell signals. Unlike simple crossover-based strategies, this indicator leverages multiple layers of confirmation to reduce false signals and improve trade execution accuracy.
This indicator is designed for trend-following traders, scalpers, and swing traders, helping them identify key reversal points and momentum shifts with precise breakout conditions.
How It Works
The Smart Buy/Sell Signal Indicator filters out weak trade signals by combining trend, volatility, momentum, and strength indicators in the following manner:
✅ Supertrend-Based Trend Filtering:
• The script checks if the price is above or below the Supertrend level before confirming a buy or sell signal.
• Buy signals occur below the Supertrend Down level, confirming support.
• Sell signals occur above the Supertrend Up level, confirming resistance.
✅ Bollinger Bands for Overbought & Oversold Conditions:
• Buy signals are confirmed when price touches the Bollinger Lower Band (suggesting oversold conditions).
• Sell signals are confirmed when price touches the Bollinger Upper Band (suggesting overbought conditions).
• This ensures that trades occur at high-probability reversal zones, rather than random price action.
✅ RSI Momentum Confirmation:
• Buy trades trigger when RSI is below 50 (indicating strength building from an oversold region).
• Sell trades trigger when RSI is above 50 (indicating weakness forming in an overbought region).
• This ensures signals are momentum-backed and not counter-trend moves.
✅ ADX Strength Confirmation:
• The script filters signals using the ADX (Average Directional Index) to ensure that only trades with sufficient market strength are executed.
• If the ADX value is below a threshold (default: 15), the signal is ignored to prevent false breakouts in choppy markets.
✅ Confirmation Moving Average (MA) for Trend Validation:
• The script applies an additional confirmation filter using a Moving Average (SMA/EMA).
• Buy signals trigger only when the price is above the MA, aligning with trend direction.
• Sell signals trigger only when the price is below the MA, ensuring alignment with the broader market structure.
✅ Trade Cooldown Mechanism (Minimum Bars Between Signals):
• To avoid frequent signals in sideways markets, a cooldown period is implemented.
• Default: 5 bars between signals (adjustable).
• Prevents rapid consecutive trades, reducing false entries.
Key Features
✔️ Supertrend & Moving Average Confirmation – Ensures trades are taken only in the correct trend direction.
✔️ Bollinger Bands Integration – Helps identify high-probability reversal zones.
✔️ ADX Strength Filtering – Ensures trades are only executed when the market has enough strength.
✔️ Momentum-Based RSI Filtering – Avoids counter-trend trades and confirms directional strength.
✔️ Trade Cooldown Mechanism – Reduces overtrading and noise in sideways markets.
✔️ Webhook Alerts for Automation – Auto-execute trades or receive real-time notifications.
✔️ Customizable Inputs – Adjustable thresholds, EMA/SMA length, ADX filter, cooldown period for flexibility.
✔️ Works Across Multiple Timeframes – Suitable for scalping (5m, 15m), swing trading (1H, 4H), and position trading (Daily).
How to Use
📌 Scalping & Intraday Trading:
• Use on 5m, 15m, or 30m timeframes.
• Look for Bollinger Band touch + RSI confirmation + Supertrend support/resistance validation before entering trades.
📌 Swing Trading:
• Use on 1H or 4H timeframes.
• Enter only when ADX is strong and price aligns with Supertrend direction.
📌 Webhook Automation:
• Set up TradingView Alerts to auto-execute trades via Webhook-compatible platforms.
Why This Combination?
This indicator is not just a simple moving average crossover tool.
It is designed to filter out weak breakouts and only execute trades that have:
✅ Trend confirmation (Supertrend + Moving Average)
✅ Volatility filtering (Bollinger Bands for overbought/oversold confirmation)
✅ Momentum validation (RSI threshold filtering)
✅ Market strength requirement (ADX ensures sufficient momentum)
This multi-layered approach ensures that only the highest-quality setups are executed, improving both win rate and reliability.
Why It’s Worth Using?
🚀 Reduces False Breakouts – Avoids weak breakouts by requiring ADX confirmation.
🚀 Works in All Market Conditions – Trend-following logic for trending markets, volatility-based entries for reversals.
🚀 Customizable to Any Trading Style – Adjustable parameters for trend, momentum, and strength filtering.
🚀 Seamless Webhook Automation – Execute trades automatically with TradingView alerts.
🚀 Ready to trade smarter?
✅ Add the Smart Buy/Sell Signal Indicator to your TradingView chart today! 🎯🔥

Dynamic Momentum Shift Detector [Invesmate]Dynamic Momentum Shift Detector
Overview
The Dynamic Momentum Shift Detector is an advanced trend-following and momentum-based indicator designed to help traders identify high-probability trading opportunities. It combines RSI-based momentum detection, Supertrend confirmation, and EMA sentiment tracking to provide reliable buy and sell signals.
This indicator is useful for traders who rely on price action and momentum shifts to make informed trading decisions. The goal is to capture early trend reversals while filtering false signals using multiple confirmations.
Key Features & Unique Aspects
RSI (2-Period) for Momentum Detection
Uses an extremely short 2-period RSI to detect overbought (75) and oversold (25) conditions.
Buy Signal: RSI crosses above 25 and price is above the Supertrend line.
Sell Signal: RSI crosses below 75 and price is below the Supertrend line.
Supertrend for Trend Confirmation
A Supertrend (ATR 20, Factor 2) is used to validate the overall market trend.
Prevents false breakouts by ensuring buy signals occur above the Supertrend line and sell signals occur below it.
21-EMA Sentiment Filter
A 21-period Exponential Moving Average (EMA) acts as a market sentiment indicator.
Background color changes for quick visual cues:
Green Fill: Price is above EMA (bullish sentiment).
Red Fill: Price is below EMA (bearish sentiment).
Refined Buy/Sell Confirmation Criteria
To eliminate weak signals, additional price action conditions are applied:
Buy Confirmation: Higher high, bullish close, and strong candle body (>40% of range).
Sell Confirmation: Lower low, bearish close, and strong candle body (>40% of range).
Persistent Buy/Sell Levels
Displays persistent buy and sell levels (green/red dots) on the chart.
These remain active until invalidated by price action.
Bull & Bear Momentum (RSI-8 for Strong Reversals)
Bull M (Green Triangle): RSI (8) crosses above 72 with a strong bullish candle (>60% body).
Bear M (Red Triangle): RSI (8) crosses below 27 with a strong bearish candle (>60% body).
How to Use the Indicator
Buy Setup:
✅ Look for a green "Bull R" signal when:
RSI crosses above 25.
Price is above Supertrend & EMA 21.
Additional confirmation from bullish candle structure.
Sell Setup:
✅ Look for a red "Bear R" signal when:
RSI crosses below 75.
Price is below Supertrend & EMA 21.
Additional confirmation from bearish candle structure.
Observation Signals:
⚠️ "Obs Buy" (Orange Label) → Possible buy setup, but missing confirmation.
⚠️ "Obs Sell" (Orange Label) → Possible sell setup, but missing confirmation.
Momentum Reversal Markers (Strong Buy/Sell Signals)
🔺 "Bull M" (Green Triangle) → Strong bullish momentum shift detected.
🔻 "Bear M" (Red Triangle) → Strong bearish momentum shift detected.
Why This Indicator is Unique & Valuable
✔ Combines multiple indicators (RSI, Supertrend, EMA) with a structured approach.
✔ Avoids false signals by requiring confirmation from price action.
✔ Provides persistent support/resistance levels to track active trades.
✔ Visually clean and easy to use with minimal chart clutter.
This indicator is suitable for swing traders, intraday traders, and positional traders who want high-probability setups with clear trend direction.