Luxy Momentum, Trend, Bias and Breakout Indicators V7
TABLE OF CONTENTS
This is Version 7 (V7) - the latest and most optimized release. If you are using any older versions (V6, V5, V4, V3, etc.), it is highly recommended to replace them with V7.
Why This Indicator is Different
Who Should Use This
Core Components Overview
The UT Bot Trading System
Understanding the Market Bias Table
Candlestick Pattern Recognition
Visual Tools and Features
How to Use the Indicator
Performance and Optimization
FAQ
---
### CREDITS & ATTRIBUTION
This indicator implements proven trading concepts using entirely original code developed specifically for this project.
### CONCEPTUAL FOUNDATIONS
• UT Bot ATR Trailing System
- Original concept by @QuantNomad: (search "UT-Bot-Strategy"
- Our version is a complete reimplementation with significant enhancements:
- Volume-weighted momentum adjustment
- Composite stop loss from multiple S/R layers
- Multi-filter confirmation system (swing, %, 2-bar, ZLSMA)
- Full integration with multi-timeframe bias table
- Visual audit trail with freeze-on-touch
- NOTE: No code was copied - this is a complete reimplementation with enhancements.
• Standard Technical Indicators (Public Domain Formulas):
- Supertrend: ATR-based trend calculation with custom gradient fills
- MACD: Gerald Appel's formula with separation filters
- RSI: J. Welles Wilder's formula with pullback zone logic
- ADX/DMI: Custom trend strength formula inspired by Wilder's directional movement concept, reimplemented with volume weighting and efficiency metrics
- ZLSMA: Zero-lag formula enhanced with Hull MA and momentum prediction
### Custom Implementations
- Trend Strength: Inspired by Wilder's ADX concept but using volume-weighted pressure calculation and efficiency metrics (not traditional +DI/-DI smoothing)
- All code implementations are original
### ORIGINAL FEATURES (70%+ of codebase)
- Multi-Timeframe Bias Table with live updates
- Risk Management System (R-multiple TPs, freeze-on-touch)
- Opening Range Breakout tracker with session management
- Composite Stop Loss calculator using 6+ S/R layers
- Performance optimization system (caching, conditional calcs)
- VIX Fear Index integration
- Previous Day High/Low auto-detection
- Candlestick pattern recognition with interactive tooltips
- Smart label and visual management
- All UI/UX design and table architecture
### DEVELOPMENT PROCESS
**AI Assistance:** This indicator was developed over 2+ months with AI assistance (ChatGPT/Claude) used for:
- Writing Pine Script code based on design specifications
- Optimizing performance and fixing bugs
- Ensuring Pine Script v6 compliance
- Generating documentation
**Author's Role:** All trading concepts, system design, feature selection, integration logic, and strategic decisions are original work by the author. The AI was a coding tool, not the system designer.
**Transparency:** We believe in full disclosure - this project demonstrates how AI can be used as a powerful development tool while maintaining creative and strategic ownership.
---
1. WHY THIS INDICATOR IS DIFFERENT
Most traders use multiple separate indicators on their charts, leading to cluttered screens, conflicting signals, and analysis paralysis. The Suite solves this by integrating proven technical tools into a single, cohesive system.
Key Advantages:
All-in-One Design: Instead of loading 5-10 separate indicators, you get everything in one optimized script. This reduces chart clutter and improves TradingView performance.
Multi-Timeframe Bias Table: Unlike standard indicators that only show the current timeframe, the Bias Table aggregates trend signals across multiple timeframes simultaneously. See at a glance whether 1m, 5m, 15m, 1h are aligned bullish or bearish - no more switching between charts.
Smart Confirmations: The indicator doesn't just give signals - it shows you WHY. Every entry has multiple layers of confirmation (MA cross, MACD momentum, ADX strength, RSI pullback, volume, etc.) that you can toggle on/off.
Dynamic Stop Loss System: Instead of static ATR stops, the SL is calculated from multiple support/resistance layers: UT trailing line, Supertrend, VWAP, swing structure, and MA levels. This creates more intelligent, price-action-aware stops.
R-Multiple Take Profits: Built-in TP system calculates targets based on your initial risk (1R, 1.5R, 2R, 3R). Lines freeze when touched with visual checkmarks, giving you a clean audit trail of partial exits.
Educational Tooltips Everywhere: Every single input has detailed tooltips explaining what it does, typical values, and how it impacts trading. You're not guessing - you're learning as you configure.
Performance Optimized: Smart caching, conditional calculations, and modular design mean the indicator runs fast despite having 15+ features. Turn off what you don't use for even better performance.
No Repainting: All signals respect bar close. Alerts fire correctly. What you see in history is what you would have gotten in real-time.
What Makes It Unique:
Integrated UT Bot + Bias Table: No other indicator combines UT Bot's ATR trailing system with a live multi-timeframe dashboard. You get precision entries with macro trend context.
Candlestick Pattern Recognition with Interactive Tooltips: Patterns aren't just marked - hover over any emoji for a full explanation of what the pattern means and how to trade it.
Opening Range Breakout Tracker: Built-in ORB system for intraday traders with customizable session times and real-time status updates in the Bias Table.
Previous Day High/Low Auto-Detection: Automatically plots PDH/PDL on intraday charts with theme-aware colors. Updates daily without manual input.
Dynamic Row Labels in Bias Table: The table shows your actual settings (e.g., "EMA 10 > SMA 20") not generic labels. You know exactly what's being evaluated.
Modular Filter System: Instead of forcing a fixed methodology, the indicator lets you build your own strategy. Start with just UT Bot, add filters one at a time, test what works for your style.
---
2. WHO WHOULD USE THIS
Designed For:
Intermediate to Advanced Traders: You understand basic technical analysis (MAs, RSI, MACD) and want to combine multiple confirmations efficiently. This isn't a "one-click profit" system - it's a professional toolkit.
Multi-Timeframe Traders: If you trade one asset but check multiple timeframes for confirmation (e.g., enter on 5m after checking 15m and 1h alignment), the Bias Table will save you hours every week.
Trend Followers: The indicator excels at identifying and following trends using UT Bot, Supertrend, and MA systems. If you trade breakouts and pullbacks in trending markets, this is built for you.
Intraday and Swing Traders: Works equally well on 5m-1h charts (day trading) and 4h-D charts (swing trading). Scalpers can use it too with appropriate settings adjustments.
Discretionary Traders: This isn't a black-box system. You see all the components, understand the logic, and make final decisions. Perfect for traders who want tools, not automation.
Works Across All Markets:
Stocks (US, international)
Cryptocurrency (24/7 markets supported)
Forex pairs
Indices (SPY, QQQ, etc.)
Commodities
NOT Ideal For :
Complete Beginners: If you don't know what a moving average or RSI is, start with basics first. This indicator assumes foundational knowledge.
Algo Traders Seeking Black Box: This is discretionary. Signals require context and confirmation. Not suitable for blind automated execution.
Mean-Reversion Only Traders: The indicator is trend-following at its core. While VWAP bands support mean-reversion, the primary methodology is trend continuation.
---
3. CORE COMPONENTS OVERVIEW
The indicator combines these proven systems:
Trend Analysis:
Moving Averages: Four customizable MAs (Fast, Medium, Medium-Long, Long) with six types to choose from (EMA, SMA, WMA, VWMA, RMA, HMA). Mix and match for your style.
Supertrend: ATR-based trend indicator with unique gradient fill showing trend strength. One-sided ribbon visualization makes it easier to see momentum building or fading.
ZLSMA : Zero-lag linear-regression smoothed moving average. Reduces lag compared to traditional MAs while maintaining smooth curves.
Momentum & Filters:
MACD: Standard MACD with separation filter to avoid weak crossovers.
RSI: Pullback zone detection - only enter longs when RSI is in your defined "buy zone" and shorts in "sell zone".
ADX/DMI: Trend strength measurement with directional filter. Ensures you only trade when there's actual momentum.
Volume Filter: Relative volume confirmation - require above-average volume for entries.
Donchian Breakout: Optional channel breakout requirement.
Signal Systems:
UT Bot: The primary signal generator. ATR trailing stop that adapts to volatility and gives clear entry/exit points.
Base Signals: MA cross system with all the above filters applied. More conservative than UT Bot alone.
Market Bias Table: Multi-timeframe dashboard showing trend alignment across 7 timeframes plus macro bias (3-day, weekly, monthly, quarterly, VIX).
Candlestick Patterns: Six major reversal patterns auto-detected with interactive tooltips.
ORB Tracker: Opening range high/low with breakout status (intraday only).
PDH/PDL: Previous day levels plotted automatically on intraday charts.
VWAP + Bands : Session-anchored VWAP with up to three standard deviation band pairs.
---
4. THE UT BOT TRADING SYSTEM
The UT Bot is the heart of the indicator's signal generation. It's an advanced ATR trailing stop that adapts to market volatility.
Why UT Bot is Superior to Fixed Stops:
Traditional ATR stops use a fixed multiplier (e.g., "stop = entry - 2×ATR"). UT Bot is smarter:
It TRAILS the stop as price moves in your favor
It WIDENS during high volatility to avoid premature stops
It TIGHTENS during consolidation to lock in profits
It FLIPS when price breaks the trailing line, signaling reversals
Visual Elements You'll See:
Orange Trailing Line: The actual UT stop level that adapts bar-by-bar
Buy/Sell Labels: Aqua triangle (long) or orange triangle (short) when the line flips
ENTRY Line: Horizontal line at your entry price (optional, can be turned off)
Suggested Stop Loss: A composite SL calculated from multiple support/resistance layers:
- UT trailing line
- Supertrend level
- VWAP
- Swing structure (recent lows/highs)
- Long-term MA (200)
- ATR-based floor
Take Profit Lines: TP1, TP1.5, TP2, TP3 based on R-multiples. When price touches a TP, it's marked with a checkmark and the line freezes for audit trail purposes.
Status Messages: "SL Touched ❌" or "SL Frozen" when the trade leg completes.
How UT Bot Differs from Other ATR Systems:
Multiple Filters Available: You can require 2-bar confirmation, minimum % price change, swing structure alignment, or ZLSMA directional filter. Most UT implementations have none of these.
Smart SL Calculation: Instead of just using the UT line as your stop, the indicator suggests a better SL based on actual support/resistance. This prevents getting stopped out by wicks while keeping risk controlled.
Visual Audit Trail: All SL/TP lines freeze when touched with clear markers. You can review your trades weeks later and see exactly where entries, stops, and targets were.
Performance Options: "Draw UT visuals only on bar close" lets you reduce rendering load without affecting logic or alerts - critical for slower machines or 1m charts.
Trading Logic:
UT Bot flips direction (Buy or Sell signal appears)
Check Bias Table for multi-timeframe confirmation
Optional: Wait for Base signal or candlestick pattern
Enter at signal bar close or next bar open
Place stop at "Suggested Stop Loss" line
Scale out at TP levels (TP1, TP2, TP3)
Exit remaining position on opposite UT signal or stop hit
---
5. UNDERSTANDING THE MARKET BIAS TABLE
This is the indicator's unique multi-timeframe intelligence layer. Instead of looking at one chart at a time, the table aggregates signals across seven timeframes plus macro trend bias.
Why Multi-Timeframe Analysis Matters:
Professional traders check higher and lower timeframes for context:
Is the 1h uptrend aligning with my 5m entry?
Are all short-term timeframes bullish or just one?
Is the daily trend supportive or fighting me?
Doing this manually means opening multiple charts, checking each indicator, and making mental notes. The Bias Table does it automatically in one glance.
Table Structure:
Header Row:
On intraday charts: 1m, 5m, 15m, 30m, 1h, 2h, 4h (toggle which ones you want)
On daily+ charts: D, W, M (automatic)
Green dot next to title = live updating
Headline Rows - Macro Bias:
These show broad market direction over longer periods:
3 Day Bias: Trend over last 3 trading sessions (uses 1h data)
Weekly Bias: Trend over last 5 trading sessions (uses 4h data)
Monthly Bias: Trend over last 30 daily bars
Quarterly Bias: Trend over last 13 weekly bars
VIX Fear Index: Market regime based on VIX level - bullish when low, bearish when high
Opening Range Breakout: Status of price vs. session open range (intraday only)
These rows show text: "BULLISH", "BEARISH", or "NEUTRAL"
Indicator Rows - Technical Signals:
These evaluate your configured indicators across all active timeframes:
Fast MA > Medium MA (shows your actual MA settings, e.g., "EMA 10 > SMA 20")
Price > Long MA (e.g., "Price > SMA 200")
Price > VWAP
MACD > Signal
Supertrend (up/down/neutral)
ZLSMA Rising
RSI In Zone
ADX ≥ Minimum
These rows show emojis: GREEB (bullish), RED (bearish), GRAY/YELLOW (neutral/NA)
AVG Column:
Shows percentage of active timeframes that are bullish for that row. This is the KEY metric:
AVG > 70% = strong multi-timeframe bullish alignment
AVG 40-60% = mixed/choppy, no clear trend
AVG < 30% = strong multi-timeframe bearish alignment
How to Use the Table:
For a long trade:
Check AVG column - want to see > 60% ideally
Check headline bias rows - want to see BULLISH, not BEARISH
Check VIX row - bullish market regime preferred
Check ORB row (intraday) - want ABOVE for longs
Scan indicator rows - more green = better confirmation
For a short trade:
Check AVG column - want to see < 40% ideally
Check headline bias rows - want to see BEARISH, not BULLISH
Check VIX row - bearish market regime preferred
Check ORB row (intraday) - want BELOW for shorts
Scan indicator rows - more red = better confirmation
When AVG is 40-60%:
Market is choppy, mixed signals. Either stay out or reduce position size significantly. These are low-probability environments.
Unique Features:
Dynamic Labels: Row names show your actual settings (e.g., "EMA 10 > SMA 20" not generic "Fast > Slow"). You know exactly what's being evaluated.
Customizable Rows: Turn off rows you don't care about. Only show what matters to your strategy.
Customizable Timeframes: On intraday charts, disable 1m or 4h if you don't trade them. Reduces calculation load by 20-40%.
Automatic HTF Handling: On Daily/Weekly/Monthly charts, the table automatically switches to D/W/M columns. No configuration needed.
Performance Smart: "Hide BIAS table on 1D or above" option completely skips all table calculations on higher timeframes if you only trade intraday.
---
6. CANDLESTICK PATTERN RECOGNITION
The indicator automatically detects six major reversal patterns and marks them with emojis at the relevant bars.
Why These Six Patterns:
These are the most statistically significant reversal patterns according to trading literature:
High win rate when appearing at support/resistance
Clear visual structure (not subjective)
Work across all timeframes and assets
Studied extensively by institutions
The Patterns:
Bullish Patterns (appear at bottoms):
Bullish Engulfing: Green candle completely engulfs prior red candle's body. Strong reversal signal.
Hammer: Small body with long lower wick (at least 2× body size). Shows rejection of lower prices by buyers.
Morning Star: Three-candle pattern (large red → small indecision → large green). Very strong bottom reversal.
Bearish Patterns (appear at tops):
Bearish Engulfing: Red candle completely engulfs prior green candle's body. Strong reversal signal.
Shooting Star: Small body with long upper wick (at least 2× body size). Shows rejection of higher prices by sellers.
Evening Star: Three-candle pattern (large green → small indecision → large red). Very strong top reversal.
Interactive Tooltips:
Unlike most pattern indicators that just draw shapes, this one is educational:
Hover your mouse over any pattern emoji
A tooltip appears explaining: what the pattern is, what it means, when it's most reliable, and how to trade it
No need to memorize - learn as you trade
Noise Filter:
"Min candle body % to filter noise" setting prevents false signals:
Patterns require minimum body size relative to price
Filters out tiny candles that don't represent real buying/selling pressure
Adjust based on asset volatility (higher % for crypto, lower for low-volatility stocks)
How to Trade Patterns:
Patterns are NOT standalone entry signals. Use them as:
Confirmation: UT Bot gives signal + pattern appears = stronger entry
Reversal Warning: In a trade, opposite pattern appears = consider tightening stop or taking profit
Support/Resistance Validation: Pattern at key level (PDH, VWAP, MA 200) = level is being respected
Best combined with:
UT Bot or Base signal in same direction
Bias Table alignment (AVG > 60% or < 40%)
Appearance at obvious support/resistance
---
7. VISUAL TOOLS AND FEATURES
VWAP (Volume Weighted Average Price):
Session-anchored VWAP with standard deviation bands. Shows institutional "fair value" for the trading session.
Anchor Options: Session, Day, Week, Month, Quarter, Year. Choose based on your trading timeframe.
Bands: Up to three pairs (X1, X2, X3) showing statistical deviation. Price at outer bands often reverses.
Auto-Hide on HTF: VWAP hides on Daily/Weekly/Monthly charts automatically unless you enable anchored mode.
Use VWAP as:
Directional bias (above = bullish, below = bearish)
Mean reversion levels (outer bands)
Support/resistance (the VWAP line itself)
Previous Day High/Low:
Automatically plots yesterday's high and low on intraday charts:
Updates at start of each new trading day
Theme-aware colors (dark text for light charts, light text for dark charts)
Hidden automatically on Daily/Weekly/Monthly charts
These levels are critical for intraday traders - institutions watch them closely as support/resistance.
Opening Range Breakout (ORB):
Tracks the high/low of the first 5, 15, 30, or 60 minutes of the trading session:
Customizable session times (preset for NYSE, LSE, TSE, or custom)
Shows current breakout status in Bias Table row (ABOVE, BELOW, INSIDE, BUILDING)
Intraday only - auto-disabled on Daily+ charts
ORB is a classic day trading strategy - breakout above opening range often leads to continuation.
Extra Labels:
Change from Open %: Shows how far price has moved from session open (intraday) or daily open (HTF). Green if positive, red if negative.
ADX Badge: Small label at bottom of last bar showing current ADX value. Green when above your minimum threshold, red when below.
RSI Badge: Small label at top of last bar showing current RSI value with zone status (buy zone, sell zone, or neutral).
These labels provide quick at-a-glance confirmation without needing separate indicator windows.
---
8. HOW TO USE THE INDICATOR
Step 1: Add to Chart
Load the indicator on your chosen asset and timeframe
First time: Everything is enabled by default - the chart will look busy
Don't panic - you'll turn off what you don't need
Step 2: Start Simple
Turn OFF everything except:
UT Bot labels (keep these ON)
Bias Table (keep this ON)
Moving Averages (Fast and Medium only)
Suggested Stop Loss and Take Profits
Hide everything else initially. Get comfortable with the basic UT Bot + Bias Table workflow first.
Step 3: Learn the Core Workflow
UT Bot gives a Buy or Sell signal
Check Bias Table AVG column - do you have multi-timeframe alignment?
If yes, enter the trade
Place stop at Suggested Stop Loss line
Scale out at TP levels
Exit on opposite UT signal
Trade this simple system for a week. Get a feel for signal frequency and win rate with your settings.
Step 4: Add Filters Gradually
If you're getting too many losing signals (whipsaws in choppy markets), add filters one at a time:
Try: "Require 2-Bar Trend Confirmation" - wait for 2 bars to confirm direction
Try: ADX filter with minimum threshold - only trade when trend strength is sufficient
Try: RSI pullback filter - only enter on pullbacks, not chasing
Try: Volume filter - require above-average volume
Add one filter, test for a week, evaluate. Repeat.
Step 5: Enable Advanced Features (Optional)
Once you're profitable with the core system, add:
Supertrend for additional trend confirmation
Candlestick patterns for reversal warnings
VWAP for institutional anchor reference
ORB for intraday breakout context
ZLSMA for low-lag trend following
Step 6: Optimize Settings
Every setting has a detailed tooltip explaining what it does and typical values. Hover over any input to read:
What the parameter controls
How it impacts trading
Suggested ranges for scalping, day trading, and swing trading
Start with defaults, then adjust based on your results and style.
Step 7: Set Up Alerts
Right-click chart → Add Alert → Condition: "Luxy Momentum v6" → Choose:
"UT Bot — Buy" for long entries
"UT Bot — Sell" for short entries
"Base Long/Short" for filtered MA cross signals
Optionally enable "Send real-time alert() on UT flip" in settings for immediate notifications.
Common Workflow Variations:
Conservative Trader:
UT signal + Base signal + Candlestick pattern + Bias AVG > 70%
Enter only at major support/resistance
Wider UT sensitivity, multiple filters
Aggressive Trader:
UT signal + Bias AVG > 60%
Enter immediately, no waiting
Tighter UT sensitivity, minimal filters
Swing Trader:
Focus on Daily/Weekly Bias alignment
Ignore intraday noise
Use ORB and PDH/PDL less (or not at all)
Wider stops, patient approach
---
9. PERFORMANCE AND OPTIMIZATION
The indicator is optimized for speed, but with 15+ features running simultaneously, chart load time can add up. Here's how to keep it fast:
Biggest Performance Gains:
Disable Unused Timeframes: In "Time Frames" settings, turn OFF any timeframe you don't actively trade. Each disabled TF saves 10-15% calculation time. If you only day trade 5m, 15m, 1h, disable 1m, 2h, 4h.
Hide Bias Table on Daily+: If you only trade intraday, enable "Hide BIAS table on 1D or above". This skips ALL table calculations on higher timeframes.
Draw UT Visuals Only on Bar Close: Reduces intrabar rendering of SL/TP/Entry lines. Has ZERO impact on logic or alerts - purely visual optimization.
Additional Optimizations:
Turn off VWAP bands if you don't use them
Disable candlestick patterns if you don't trade them
Turn off Supertrend fill if you find it distracting (keep the line)
Reduce "Limit to 10 bars" for SL/TP lines to minimize line objects
Performance Features Built-In:
Smart Caching: Higher timeframe data (3-day bias, weekly bias, etc.) updates once per day, not every bar
Conditional Calculations: Volume filter only calculates when enabled. Swing filter only runs when enabled. Nothing computes if turned off.
Modular Design: Every component is independent. Turn off what you don't need without breaking other features.
Typical Load Times:
5m chart, all features ON, 7 timeframes: ~2-3 seconds
5m chart, core features only, 3 timeframes: ~1 second
1m chart, all features: ~4-5 seconds (many bars to calculate)
If loading takes longer, you likely have too many indicators on the chart total (not just this one).
---
10. FAQ
Q: How is this different from standard UT Bot indicators?
A: Standard UT Bot (originally by @QuantNomad) is just the ATR trailing line and flip signals. This implementation adds:
- Volume weighting and momentum adjustment to the trailing calculation
- Multiple confirmation filters (swing, %, 2-bar, ZLSMA)
- Smart composite stop loss system from multiple S/R layers
- R-multiple take profit system with freeze-on-touch
- Integration with multi-timeframe Bias Table
- Visual audit trail with checkmarks
Q: Can I use this for automated trading?
A: The indicator is designed for discretionary trading. While it has clear signals and alerts, it's not a mechanical system. Context and judgment are required.
Q: Does it repaint?
A: No. All signals respect bar close. UT Bot logic runs intrabar but signals only trigger on confirmed bars. Alerts fire correctly with no lookahead.
Q: Do I need to use all the features?
A: Absolutely not. The indicator is modular. Many profitable traders use just UT Bot + Bias Table + Moving Averages. Start simple, add complexity only if needed.
Q: How do I know which settings to use?
A: Every single input has a detailed tooltip. Hover over any setting to see:
What it does
How it affects trading
Typical values for scalping, day trading, swing trading
Start with defaults, adjust gradually based on results.
Q: Can I use this on crypto 24/7 markets?
A: Yes. ORB will not work (no defined session), but everything else functions normally. Use "Day" anchor for VWAP instead of "Session".
Q: The Bias Table is blank or not showing.
A: Check:
"Show Table" is ON
Table position isn't overlapping another indicator's table (change position)
At least one row is enabled
"Hide BIAS table on 1D or above" is OFF (if on Daily+ chart)
Q: Why are candlestick patterns not appearing?
A: Patterns are relatively rare by design - they only appear at genuine reversal points. Check:
Pattern toggles are ON
"Min candle body %" isn't too high (try 0.05-0.10)
You're looking at a chart with actual reversals (not strong trending market)
Q: UT Bot is too sensitive/not sensitive enough.
A: Adjust "Sensitivity (Key×ATR)". Lower number = tighter stop, more signals. Higher number = wider stop, fewer signals. Read the tooltip for guidance.
Q: Can I get alerts for the Bias Table?
A: The Bias Table is a dashboard for visual analysis, not a signal generator. Set alerts on UT Bot or Base signals, then manually check Bias Table for confirmation.
Q: Does this work on stocks with low volume?
A: Yes, but turn OFF the volume filter. Low volume stocks will never meet relative volume requirements.
Q: How often should I check the Bias Table?
A: Before every entry. It takes 2 seconds to glance at the AVG column and headline rows. This one check can save you from fighting the trend.
Q: What if UT signal and Base signal disagree?
A: UT Bot is more aggressive (ATR trailing). Base signals are more conservative (MA cross + filters). If they disagree, either:
Wait for both to align (safest)
Take the UT signal but with smaller size (aggressive)
Skip the trade (conservative)
There's no "right" answer - depends on your risk tolerance.
---
FINAL NOTES
The indicator gives you an edge. How you use that edge determines results.
For questions, feedback, or support, comment on the indicator page or message the author.
Happy Trading!
In den Scripts nach "supertrend" suchen

SuperIchi [LuxAlgo]Using one indicator as the core for another one to improve certain aspects while offering an alternative user interaction can be very interesting in technical analysis.
This indicator is a modification of the popular Ichimoku indicator using the equally popular Supertrend indicator as its core, thus no longer entirely relying on calculations done over a fixed window size but instead relying on the average true range and the trend detection method offered by the Supertrend.
Settings
Tenkan: Atr length (left) and factor (right) used for the Supertrend involved in the calculations of the Tenkan Ichimoku component
Kijun: Atr length (left) and factor (right) used for the Supertrend involved in the calculations of the Kijun Ichimoku component
Senkou Span B: Atr length (left) and factor (right) used for the Supertrend involved in the calculations of the second Senkou Span Ichimoku component
Displacement: Bar offset of the cloud (positive offset) and Chikou (negative offset)
Usage
The SuperIchi indicator can be interpreted similarly to a regular Ichimoku as it retains the components and aspects from this one. Users can make use of the Supertrend Factor to detect shorter or longer-term trends.
Unlike the regular components of the Ichimoku based on rolling maximums/minimums, using the Supertrend here allows smoother components and makes it less prone to whipsaw signals.
Note that the Chikou is disabled by default in the style settings
Details
The original Ichimoku indicator is constructed from the average between the rolling maximum high and minimum low values. The Supertrend indicator also relies on one upper/lower extremity but using the average of these extremities for the modification of the Ichimoku indicator might not provide easy to use results due to the nature of these extremities.
Instead, we compute the average between the Supertrend and trailing maximums/minimums with a value reset when a new trend is detected by the Supertrend. This allows obtaining a result that is closer to the original average used by Ichimoku.

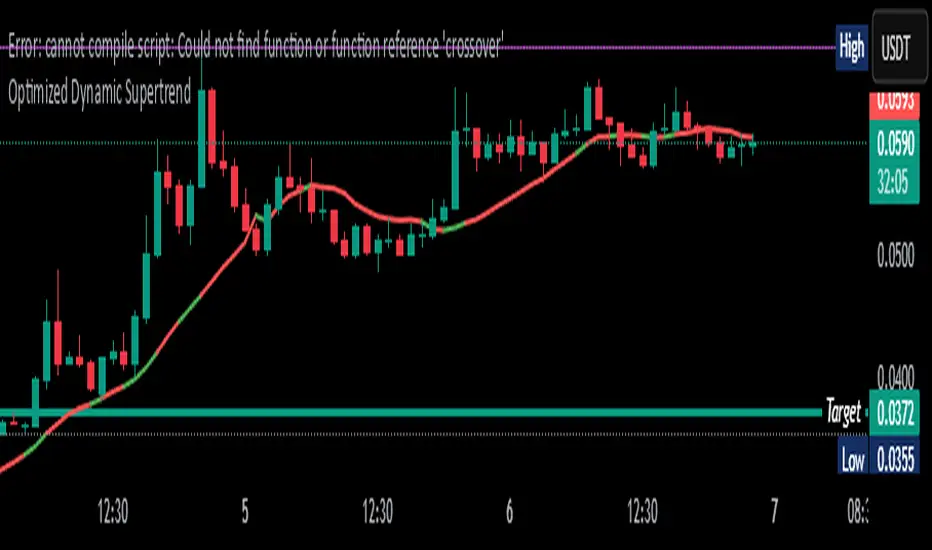
Optimized Dynamic SupertrendDetailed Explanation of the Optimized Dynamic Supertrend Script
This Supertrend script is designed to dynamically adapt to different market conditions using ATR expansion, volume confirmation, and trend filtering. Below is a step-by-step breakdown of how it works and its functions.
1 ATR-Based Supertrend Calculation
📌 Key Purpose:
The script calculates an adaptive ATR-based Supertrend line, which acts as a dynamic support or resistance level for trend direction.
📌 How it Works:
ATR (Average True Range) is used to measure market volatility.
A dynamic ATR multiplier is applied based on price standard deviation (instead of a fixed value).
The Supertrend is calculated as:
Upper Band: SMA(close, ATR length) + (ATR Multiplier * ATR Value)
Lower Band: SMA(close, ATR length) - (ATR Multiplier * ATR Value)
The Supertrend flips when price crosses and holds beyond the Supertrend line.
🔹 Dynamic Adjustment:
Instead of using a fixed ATR multiplier, the script adjusts it using:
pinescript
Copy
Edit
dynamicFactor = ta.stdev(close, atrLength) / ta.sma(close, atrLength)
atrMultiplier = input(1.5, title="Base ATR Multiplier") * dynamicFactor
High volatility → Wider Supertrend bands (to avoid false signals).
Low volatility → Tighter Supertrend bands (for faster detection).
2 Trend Detection Logic
📌 Key Purpose:
Determines if the market is in a bullish or bearish trend based on price action.
Uses volume sensitivity and ATR expansion to reduce false signals.
📌 How it Works:
pinescript
Copy
Edit
var float supertrend = na
supertrend := close > nz(supertrend , lowerBand) ? lowerBand : upperBand
The Supertrend value updates dynamically.
If price is above the Supertrend line, the trend is bullish (green).
If price is below the Supertrend line, the trend is bearish (red).
3 Volume Sensitivity Confirmation
📌 Key Purpose:
Avoid false trend flips by confirming with volume (approximated using a CVD proxy).
📌 How it Works:
pinescript
Copy
Edit
priceChange = close - close
volumeWeightedTrend = priceChange * volume // Approximate CVD Behavior
trendConfirmed = volumeWeightedTrend > 0 ? close > supertrend : close < supertrend
Positive price change + High volume → Confirms bullish momentum.
Negative price change + High volume → Confirms bearish momentum.
If there’s low volume, the trend change is ignored to avoid false breakouts.
4 Noise Reduction (Final Trend Confirmation)
📌 Key Purpose:
Filter out weak or choppy price movements using ATR expansion.
📌 How it Works:
pinescript
Copy
Edit
trendUp = trendConfirmed and ta.atr(atrLength) > ta.atr(atrLength)
trendDown = not trendUp
Trend only flips when confirmed by volume + ATR expansion.
If ATR is not expanding, the script ignores weak price movements.
This ensures Supertrend signals align with strong market moves.
5 Can This Be Used on All Timeframes?
✅ YES! This Supertrend is adaptive, meaning it adjusts dynamically based on:
Volatility: Uses ATR expansion to adjust for different market conditions.
Timeframe Sensitivity: Works on any timeframe (1M, 5M, 15M, 1H, 4H, 1D, 1W).
Market Structure: Confirms trend flips using volume & price movement strength.
🚀 Best Timeframes for Trading:
For Scalping (1M - 15M) → Quick execution, best with order flow confirmation.
For Swing Trading (1H - 4H - 1D) → Stronger trend signals, reduced noise.
For High Timeframes (3D - 1W) → Identifies major market shifts.
🔥 Advantages & Disadvantages in Your Trading Setup
✅ Advantages:
✔ Fully Dynamic & Adaptive → Adjusts to different timeframes & volatility.
✔ Reduces False Signals → Uses ATR expansion & volume confirmation.
✔ Precise Trend Reversals → Labels LONG & SHORT entries clearly.
✔ Works on Any Market → Crypto, Forex, Stocks, Commodities.
✔ No Extra Indicators → Pure Supertrend-based (fits your setup).
❌ Disadvantages:
⚠ Lagging Indicator → ATR & volume confirmation add slight delay.
⚠ Needs High Volume to Confirm → Weak volume → no trend flip.
⚠ Choppy Market = Late Entries → Sideways movement can cause delays.
🚀 Final Thoughts:
It’s fully dynamic & adaptive (unlike traditional static Supertrends).
No extra indicators → Uses only Supertrend logic
Refines entry points using volume & ATR confirmation (removes noise).
This ensures you get high-probability trend signals while filtering out weak breakouts! 🎯
Smoothed SuperTrend with VWAP Confirmation [CHE] Smoothed SuperTrend with Automated Optimization and VWAP Confirmation
Overview
The "Smoothed SuperTrend with VWAP Confirmation" is an advanced technical analysis indicator designed for precise trend identification and trading signal generation. This script integrates a smoothed version of the popular SuperTrend indicator with an additional layer of confirmation using the Volume-Weighted Average Price (VWAP). The combination of these two elements offers traders a powerful tool for identifying optimal entry and exit points in the market.
Key Features
1. Smoothed SuperTrend
- Super Smoother Algorithm: The SuperTrend in this script is not just a regular one; it is enhanced by the Super Smoother filter, which reduces market noise and provides more reliable trend signals.
- Customizable Parameters: Traders can adjust three different sets of SuperTrend parameters (factor and ATR length), allowing them to tailor the indicator to their specific trading strategies.
- Automatic Optimization: The script automatically evaluates the performance of each SuperTrend parameter set and selects the one with the best cumulative performance. This selection process can be set to pick either the best or the worst performing parameter set, depending on the trader's preference.
2. VWAP Confirmation
- Precise Trend Confirmation: Once the best-performing SuperTrend is identified, the script further refines the signals by using VWAP as a confirmation tool. VWAP is a highly respected indicator in the trading community, often used to assess the true average price of an asset.
- Long and Short Signal Generation: The script generates Long and Short signals only when the price action is confirmed by both the SuperTrend and VWAP. For a Long signal, the price must be above the VWAP, and for a Short signal, it must be below the VWAP. This dual confirmation ensures higher accuracy and reduces the likelihood of false signals.
3. Visual and Informative Labels
- Signal Labels: Upon confirmation of a trend reversal by both the SuperTrend and VWAP, the script plots clear labels on the chart, indicating confirmed Long or Short signals. These labels are customizable in terms of color, text, and size, ensuring they fit seamlessly into any chart setup.
- Best Parameters Display: At the close of the most recent bar, the script displays a label that provides detailed information about the best-performing SuperTrend parameters and their cumulative performance. This feature keeps traders informed about which settings are currently most effective.
Input Customization Options
1. Super Smoother Length
- Traders can define the length of the Super Smoother filter, which is used to smooth both price data and ATR (Average True Range) values. This input allows traders to control the sensitivity of the indicator, with shorter lengths providing faster responses and longer lengths offering smoother trends.
2. SuperTrend Parameters
- Factor: For each of the three SuperTrends, traders can set a unique factor that determines the distance of the SuperTrend bands from the average price. A higher factor results in wider bands and fewer signals, while a lower factor results in narrower bands and more signals.
- ATR Length: Traders can also specify the length of the ATR used in each SuperTrend calculation. A longer ATR period captures broader market volatility, while a shorter period focuses on more immediate price movements.
3. Label Settings
- Label Colors: The script allows full customization of label colors for Long and Short signals, ensuring that they match the trader’s chart aesthetics.
- Label Text Colors and Sizes: Traders can adjust the text color and size of the labels for Long, Short, and information labels, allowing them to prioritize visibility and readability on their charts.
4. Performance Selection Mode
- Best or Worst Performer: This input allows traders to select whether the script should optimize for the best or worst performing SuperTrend parameter set. This flexibility is useful in different market conditions, where a trader might want to analyze either the strongest trend or focus on a contrarian strategy.
5. VWAP Calculation
- The script automatically recalculates the VWAP based on trend changes, ensuring that the confirmation signals are as accurate and relevant as possible to the current market context.
Important Note
This script is designed to provide more accurate trend signals and confirmations, but like all technical indicators, it should not be used in isolation. It is recommended to use this tool as part of a broader trading strategy, including proper risk management and consideration of fundamental market conditions.
Conclusion
The "Smoothed SuperTrend with VWAP Confirmation" script is an innovative trading tool that combines the strengths of the SuperTrend and VWAP indicators. By integrating smoothing techniques and automatic parameter optimization, this indicator provides traders with more accurate and reliable trend signals. The added confirmation by VWAP further enhances the precision of the entry and exit points, making it an excellent choice for traders looking to improve their technical analysis and trading outcomes. This tool is especially valuable for those who prefer customizable inputs and a systematic approach to trading, ensuring that the indicator adapts to various market conditions and individual trading styles.
Best regards
Chervolino

P T Supertrend CustomPT Supertrend Custom Indicator Description
The PT Supertrend Custom indicator is a dual Supertrend-based tool designed to help traders identify market trends and potential reversals with enhanced accuracy. This custom indicator plots two Supertrend lines with different ATR (Average True Range) lengths and multipliers, providing a broader perspective on price movements across varying market conditions.
Key Features:
1. Dual Supertrend Lines:
- The indicator calculates two separate Supertrend values using customizable ATR lengths (default: 7 and 21) and factors (default: 3.0 for both).
- This dual-layered approach helps identify both short-term and long-term trends for better decision-making.
2. Customizable Parameters:
- ATR Length (ATR Length & ATR Length2): Determines the lookback period for volatility calculation.
- Factor (Factor & Factor2): Defines the multiplier for the ATR, controlling the sensitivity of the Supertrend lines.
3. Visual Trend Representation:
- Green and red line plots represent uptrends and downtrends, respectively.
- The indicator overlays on the price chart, offering a clear visual representation of trend direction.
- Trend fill areas provide additional clarity, with green shading for uptrends and red shading for downtrends.
4. Dynamic Trend Shifts:
- The indicator adapts dynamically based on price action, switching from an uptrend to a downtrend and vice versa when conditions change.
- Two independent trend signals allow traders to compare short-term and long-term trend confirmations.
5. Overlay on Price Chart:
- The indicator is plotted directly on the price chart for easy visualization without cluttering the workspace.
How to Use:
- Trend Identification:
- A green Supertrend line below price indicates an uptrend.
- A red Supertrend line above price signals a downtrend.
- When both Supertrends align, it indicates a strong trend; divergence may signal potential reversals.
- Entry & Exit Signals:
- Consider long positions when both Supertrend lines turn green.
- Consider short positions when both Supertrend lines turn red.
- Use the shorter ATR period for quicker entries and exits, while the longer ATR period provides confirmation.
- Risk Management:
- The Supertrend lines can serve as dynamic support/resistance levels for placing stop-loss orders.
Best Used In:
- Trend-following strategies
- Swing trading and day trading
- Volatile markets where ATR-based signals are effective
This indicator provides a comprehensive view of market trends by combining short- and long-term trend filters, making it a valuable tool for traders seeking precision and clarity in their trading decisions.
Created by Prince Thomas

Profit Maximizer PMaxPMax is a brand new indicator developed by KivancOzbilgic in earlier 2020.
It's a combination of two trailing stop loss indicators;
One is Anıl Özekşi's MOST (Moving Stop Loss) Indicator
and the other one is well known ATR based SuperTrend.
Both MOST and SuperTrend Indicators are very good at trend following systems but conversely their performance is not bright in sideways market conditions like most of the other indicators.
Profit Maximizer - PMax tries to solve this problem. PMax combines the powerful sides of MOST (Moving Average Trend Changer) and SuperTrend (ATR price detection) in one indicator.
Backtest and optimization results of PMax are far better when compared to its ancestors MOST and SuperTrend. It reduces the number of false signals in sideways and give more reliable trade signals.
PMax is easy to determine the trend and can be used in any type of markets and instruments. It does not repaint.
The first parameter in the PMax indicator set by the three parameters is the period/length of ATR.
The second Parameter is the Multiplier of ATR which would be useful to set the value of distance from the built in Moving Average.
I personally think the most important parameter is the Moving Average Length and type.
PMax will be much sensitive to trend movements if Moving Average Length is smaller. And vice versa, will be less sensitive when it is longer.
As the period increases it will become less sensitive to little trends and price actions.
In this way, your choice of period, will be closely related to which of the sort of trends you are interested in.
We are under the effect of the uptrend in cases where the Moving Average is above PMax;
conversely under the influence of a downward trend, when the Moving Average is below PMax.
Built in Moving Average type defaultly set as EMA but users can choose from 8 different Moving Average types like:
SMA : Simple Moving Average
EMA : Exponential Movin Average
WMA : Weighted Moving Average
TMA : Triangular Moving Average
VAR : Variable Index Dynamic Moving Average aka VIDYA
WWMA : Welles Wilder's Moving Average
ZLEMA : Zero Lag Exponential Moving Average
TSF : True Strength Force
Tip: In sideways VAR would be a good choice
You can use PMax default alarms and Buy Sell signals like:
1-
BUY when Moving Average crosses above PMax
SELL when Moving Average crosses under PMax
2-
BUY when prices jumps over PMax line.
SELL when prices go under PMax line.

MTF Supertrend by Rakesh Sharma📊 MULTI-TIMEFRAME SUPERTREND INDICATOR
Get clear buy and sell signals from the powerful Supertrend indicator across three critical timeframes - all on one chart!
🎯 WHAT IT DOES:
This indicator analyzes the Supertrend across Monthly, Weekly, and Daily timeframes simultaneously, giving you a complete picture of market trends from short-term to long-term perspectives.
✨ KEY FEATURES:
- 📍 Visual Signal Labels: Clear buy/sell labels appear directly on your chart when Supertrend changes direction
- Daily signals (D-BUY/D-SELL) - Small green/red labels
- Weekly signals (W-BUY/W-SELL) - Medium blue/orange labels
- Monthly signals (M-BUY/M-SELL) - Large lime/maroon labels
- 📋 Live Summary Table: Real-time dashboard showing:
- Current trend direction for each timeframe (Bullish ▲ or Bearish ▼)
- Supertrend price levels
- Color-coded for quick reading
- 🎨 Visual Trend Confirmation:
- Supertrend line plotted on current timeframe
- Background color indicating current trend
- ⚙️ Fully Customizable:
- Adjustable ATR Period (default: 10)
- Adjustable Factor (default: 3.0)
- Toggle any timeframe on/off
- Show/hide summary table
🚀 HOW TO USE:
1. **Best Trades**: Look for alignment across multiple timeframes
- All 3 timeframes bullish = Strong buy opportunity
- All 3 timeframes bearish = Strong sell opportunity
2. **Signal Strength**:
- Monthly signals = Strongest, least frequent (major trend changes)
- Weekly signals = Medium strength, moderate frequency
- Daily signals = Most frequent, good for entries/exits
3. **Risk Management**:
- Use Supertrend levels as stop-loss points
- Higher timeframe trends act as confirmation for lower timeframe trades
4. **Settings Optimization**:
- Lower ATR period (7-8) = More sensitive, more signals
- Higher ATR period (12-14) = Less sensitive, fewer false signals
- Lower Factor (2.0-2.5) = Tighter stops, more signals
- Higher Factor (3.5-4.0) = Wider stops, fewer signals
💡 TRADING STRATEGY EXAMPLES:
**Conservative Approach:**
- Only take trades when all 3 timeframes align
- Use monthly trend as overall direction filter
- Enter on daily signals in direction of weekly/monthly trend
**Aggressive Approach:**
- Trade daily signals independently
- Use weekly/monthly as confirmation
- Quick entries and exits
**Swing Trading:**
- Focus on weekly signals
- Use monthly for trend direction
- Use daily for precise entry timing
⚠️ IMPORTANT NOTES:
- This is a trend-following indicator - works best in trending markets
- May generate whipsaws in choppy/sideways markets
- Always use proper risk management and position sizing
- Combine with volume analysis and support/resistance for best results
- Past performance does not guarantee future results
📈 BEST MARKETS:
Works on all markets: Stocks, Forex, Crypto, Commodities, Indices
⏰ BEST TIMEFRAMES:
Can be applied to any chart timeframe, but works best on:
- 1H to 4H charts for intraday trading
- Daily charts for swing trading
- Weekly charts for position trading
🔧 DEFAULT SETTINGS:
- ATR Period: 10
- Factor: 3.0
- All timeframes enabled
- Summary table visible
Feel free to adjust settings based on your trading style and the asset's volatility!
📚 ABOUT SUPERTREND:
Supertrend is a trend-following indicator that uses ATR (Average True Range) to plot dynamic support and resistance levels. It helps identify the current trend direction and potential reversal points.
---
💬 Questions or suggestions? Leave a comment below!
⭐ If you find this indicator helpful, please give it a boost!
Happy Trading! 🎯

simple swing indicator-KTRNSE:NIFTY
1. Pivot High/Low as Lines:
Purpose: Identifies local peaks (pivot highs) and troughs (pivot lows) in price and draws horizontal lines at these levels.
How it Works:
A pivot high occurs when the price is higher than the surrounding bars (based on the pivotLength parameter).
A pivot low occurs when the price is lower than the surrounding bars.
These pivots are drawn as horizontal lines at the price level of the pivot.
Visualization:
Pivot High: A red horizontal line is drawn at the price level of the pivot high.
Pivot Low: A green horizontal line is drawn at the price level of the pivot low.
Example:
Imagine the price is trending up, and at some point, it forms a peak. The script identifies this peak as a pivot high and draws a red line at the price of that peak. Similarly, if the price forms a trough, the script will draw a green line at the low point.
2. Moving Averages (20-day and 50-day):
Purpose: Plots the 20-day and 50-day simple moving averages (SMA) on the chart.
How it Works:
The 20-day SMA smooths the closing price over the last 20 days.
The 50-day SMA smooths the closing price over the last 50 days.
These lines provide an overview of short-term and long-term price trends.
Visualization:
20-day SMA: A blue line showing the 20-day moving average.
50-day SMA: An orange line showing the 50-day moving average.
Example:
When the price is above both moving averages, it indicates an uptrend. If the price crosses below these averages, it might signal a downtrend.
3. Supertrend:
Purpose: The Supertrend is an indicator based on the Average True Range (ATR) and is used to track the market trend.
How it Works:
When the market is in an uptrend, the Supertrend line will be green.
When the market is in a downtrend, the Supertrend line will be red.
Visualization:
Uptrend: The Supertrend line will be plotted in green.
Downtrend: The Supertrend line will be plotted in red.
Example:
If the price is above the Supertrend, the market is considered to be in an uptrend, and if the price is below the Supertrend, the market is in a downtrend.
4. Momentum (Rate of Change):
Purpose: Measures the rate at which the price changes over a set period, showing if the momentum is positive or negative.
How it Works:
The Rate of Change (ROC) measures how much the price has changed over a certain number of periods (e.g., 14).
Positive ROC indicates upward momentum, and negative ROC indicates downward momentum.
Visualization:
Positive ROC: A purple line is plotted above the zero line.
Negative ROC: A purple line is plotted below the zero line.
Example:
If the ROC line is above zero, it means the price is increasing, suggesting bullish momentum. If the ROC is below zero, it indicates bearish momentum.
5. Volume:
Purpose: Displays the volume of traded assets, giving insight into the strength of price movements.
How it Works:
The script will color the volume bars based on whether the price closed higher or lower than the previous bar.
Green bars indicate bullish volume (closing price higher than the previous bar), and red bars indicate bearish volume (closing price lower than the previous bar).
Visualization:
Bullish Volume: Green volume bars when the price closes higher.
Bearish Volume: Red volume bars when the price closes lower.
Example:
If you see a green volume bar, it suggests that the market is participating in an uptrend, and the price has closed higher than the previous period. Red bars indicate a downtrend or selling pressure.
6. MACD (Moving Average Convergence Divergence):
Purpose: The MACD is a trend-following momentum indicator that shows the relationship between two moving averages of the price.
How it Works:
The MACD Line is the difference between the 12-period EMA (Exponential Moving Average) and the 26-period EMA.
The Signal Line is the 9-period EMA of the MACD Line.
The MACD Histogram shows the difference between the MACD line and the Signal line.
Visualization:
MACD Line: A blue line representing the difference between the 12-period and 26-period EMAs.
Signal Line: An orange line representing the 9-period EMA of the MACD line.
MACD Histogram: A red or green histogram that shows the difference between the MACD line and the Signal line.
Example:
When the MACD line crosses above the Signal line, it’s considered a bullish signal. When the MACD line crosses below the Signal line, it’s considered a bearish signal.
Full Chart Example:
Imagine you're looking at a price chart with all the indicators:
Pivot High/Low Lines are drawn as red and green horizontal lines.
20-day and 50-day SMAs are plotted as blue and orange lines, respectively.
Supertrend shows a green or red line indicating the trend.
Momentum (ROC) is shown as a purple line oscillating around zero.
Volume bars are green or red based on whether the close is higher or lower.
MACD appears as a blue line and orange line, with a red or green histogram showing the MACD vs. Signal line difference.
How the Indicators Work Together:
Trend Confirmation: If the price is above the Supertrend line and both SMAs are trending up, it indicates a strong bullish trend.
Momentum: If the ROC is positive and the MACD line is above the Signal line, it further confirms bullish momentum.
Volume: Increasing volume, especially with green bars, suggests that the trend is being supported by active participation.
By using these combined indicators, you can get a comprehensive view of the market's trend, momentum, and potential reversal points (via pivot highs and lows).

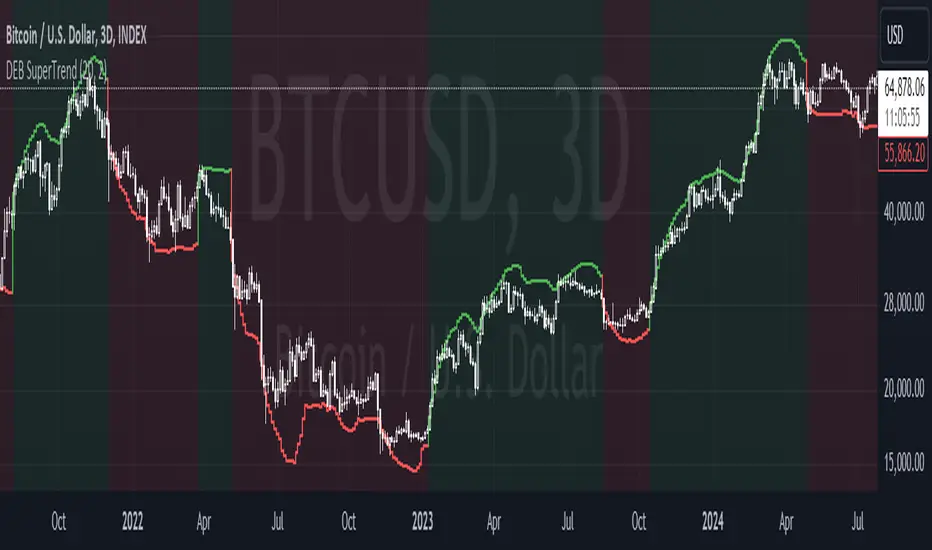
DEB SuperTrend [Mattes]The Dynamic Envelope Based Supertrend integrates two key concepts: dynamic envelopes and the Supertrend, creating a powerful trend-following tool. Understanding its functionality requires a closer look at how the envelopes are constructed and how they interact with price action.
Dynamic Envelopes
>>> Dynamic envelopes are bands that surround a central moving average (MA) which is set by the user. These are then calculated based on the standard deviation of price movements over a specified period. The formula for the upper and lower envelopes is as follows:
Upper Envelope=MA+(Multiplier×STD)
Lower Envelope=MA−(Multiplier×STD)
This dynamic approach ensures that the envelopes expand and contract based on market volatility. In periods of high volatility, the envelopes widen, allowing for more price movement without triggering false signals. Conversely, in low-volatility periods, the envelopes tighten, enhancing sensitivity to price changes.
Interaction with the Supertrend
The Supertrend component is a trend-following indicator that utilizes the concept of Average True Range (ATR) to define its trailing stop levels.
In this indicator however (like I've mentioned before), the ATR bands have been replaced with the STD envelopes, as they offer a better performance compared to ATR bands.
Trend Direction
The Supertrend indicator generates buy and sell signals based on price crossing the calculated upper and lower envelopes:
>>> Buy Signal: Triggered when the price closes above the upper envelope, indicating a potential upward trend.
>>> Sell Signal: Triggered when the price closes below the lower envelope, suggesting a downward trend.
Adaptive Nature:
The dynamic envelopes effectively serve as dynamic support and resistance levels, which adapt to price movements and volatility, while the Supertrend tracks these levels to confirm the trend direction and adjust accordingly to changes, making it an enhanced version of ATR Based Supertrends.
Unique Aspects and Advantages
->>>> The Dynamic Envelope Based Supertrend is unique for several reasons:
>>> Volatility Responsiveness: The indicator adjusts its sensitivity based on market conditions, reducing the likelihood of false signals during quiet market phases and improving reliability during volatile periods. This is reasoned by the STD envelope bands contracting and expanding relative to the tickers performance.
>>> Trend Confirmation: By integrating the Supertrend logic, the indicator not only provides entry signals but also guides traders on when to exit, maintaining a focus on trend-following rather than mean reversion.
>>> Stability: Due to its use of Standard deviation envelopes, it is very ressistant in periods of uncertainty, Rather than buy bottom and selling tops, it stays long/short for the complete period of mean reverting environments, which is based on the bigger and fuller trend direction on the larger timescales.
>>> Clear Signals: The indicator simplifies decision-making by offering visual cues through its envelopes and trend signals, making it accessible to traders of all experience levels.
Summary:
The Dynamic Envelope Based Supertrend is a sophisticated trend-following indicator that intelligently combines dynamically adjusted STD envelopes with Supertrend logic. By incorporating volatility metrics, it offers a clear and actionable framework for traders, enhancing their ability to identify and follow trends effectively.
No Lag SupertrendNo Lag Supertrend indicator improves upon the original supertrend by incorporating calculation methods that enhance responsiveness and accuracy. Traditional supertrend indicators often suffer from lag, which can delay signals and affect trading decisions. No Lag Supertrend addresses this issue through the use of KAMA (Kaufman’s Adaptive Moving Average) and Hull ATR (Average True Range) calculations.
Goals of No Lag Supertrend:
- Lag reduction: one of the main issues with traditional supertrend indicators is their lag, which can result in delayed entry and exit signals. By integrating KAMA and Hull ATR, the no lag supertrend minimizes this delay, providing more timely signals.
- Market Noise Filtering: The combined use of KAMA and Hull ATR effectively filters out market noise, ensuring that signals are based on significant price movements rather than minor fluctuations.
- Consistency Across Different Market Conditions: The adaptive nature of KAMA and the smooth responsiveness of Hull ATR ensure that the No Lag Supertrend performs consistently across various market conditions, from trending to volatile markets.
Credits: This code is based on the TradingView supertrend but improved the ATR calculations.
Trend hunter strategy - buy & sellThe indicator combines multiple technical indicators and conditions to generate buy and sell signals.
Here's how the indicator works and how to use it:
Strategy Selection:
The indicator provides a dropdown menu to choose the type of strategy. The available options are "Pullback" and "Simple."
Supertrend Settings:
The Supertrend indicator is used to identify the trend direction.
The indicator takes two input parameters:
ATR Length: Specifies the length of the Average True Range (ATR) used in the Supertrend calculation. The default value is 10.
Factor: Specifies the factor used in the Supertrend calculation. The default value is 3.0.
EMA Settings:
The indicator also includes an Exponential Moving Average (EMA) condition.
You can enable or disable the EMA condition using the "Ema Condition On/Off" checkbox.
If enabled, the indicator calculates an EMA based on the close price.
You can specify the length of the EMA using the "Ema Length" input parameter. The default value is 200.
RSI Settings:
The Relative Strength Index (RSI) indicator is used to generate additional conditions.
You can enable or disable the RSI condition using the "Rsi Condition On/Off" checkbox.
If enabled, the indicator calculates the RSI based on the close price.
You can specify the length of the RSI using the "Rsi Length" input parameter. The default value is 14.
Additionally, you can set the overbought and oversold levels for the RSI using the "RSI BUY Level" and "RSI SELL Level" input parameters, respectively. The default value for both is 50.
Final Conditions:
The indicator combines the Supertrend, EMA, and RSI conditions to generate buy and sell signals.
The specific conditions depend on the chosen strategy:
For the "Simple" strategy, the buy condition is when the Supertrend is in an up trend, not in a previous long position, the RSI is above the overbought level, and the close price is above the EMA.
For the "Pullback" strategy, the buy condition is when there is a cross under of the previous low with the Supertrend, the Supertrend is in an up trend, the RSI is above the overbought level, and the close price is above the EMA.
The sell conditions are the opposite of the respective buy conditions.
Backtest Period:
You can specify the start and end dates for the backtesting using the "Start calculations from" and "End calculations" inputs, respectively. The default start date is "2005-01-01" and the default end date is "2045-03-01." (this is work in progress) Still working on the table part, it is a bit tricky.
Trade Direction:
You can choose the trade direction using the "Trade Direction" input parameter. The available options are "Long," "Short," and "Both."
Depending on the selected trade direction, the indicator will generate signals accordingly.
Visual Display:
The indicator plots the Supertrend line on the price chart.
Buy signals are shown as green labels below the price bars.
Sell signals are shown as red labels above the price bars.
Adjust the input parameters according to your preferences, and then apply the indicator to a chart to see the generated signals. Please note that this indicator should be used for educational purposes only and should be thoroughly tested before using it for real trading.

IDX - 5UPThe UDX-5UP is a custom indicator designed to assist traders in identifying trends, entry and exit signals, and market reversal moments with greater accuracy. It combines price analysis, volume, and momentum (RSI) to provide clear buy ("Buy") and sell ("Sell") signals across any asset and timeframe, whether you're a scalper on the 5M chart or a swing trader on the 4H chart. Inspired by robust technical analysis strategies, the UDX-5UP is ideal for traders seeking a reliable tool to operate in volatile markets such as cryptocurrencies, forex, stocks, and futures.
Components of the UDX-5UP
The UDX-5UP consists of three main panels that work together to provide a comprehensive view of the market:
Main Panel (Price):
Pivot Supertrend: A dynamic line that changes color to indicate the trend. Green for an uptrend (look for buys), red for a downtrend (look for sells).
SMAs (Simple Moving Averages): Two SMAs (8 and 21 periods) to confirm the trend direction. When the SMA 8 crosses above the SMA 21, it’s a bullish signal; when it crosses below, it’s a bearish signal.
Entry/Exit Signals: "Buy" (green) and "Sell" (red) labels are plotted on the chart when entry or exit conditions are met.
Volume Panel:
Colored Volume Bars: Green bars indicate dominant buying volume, while red bars indicate dominant selling volume.
Volume Moving Average (MA 20): A blue line that helps identify whether the current volume is above or below the average, confirming the strength of the movement.
RSI Panel:
RSI (Relative Strength Index): Calculated with a period of 14, with overbought (70) and oversold (30) lines to identify momentum extremes.
Divergences: The indicator detects divergences between the RSI and price, plotting signals for potential reversals.
How the UDX-5UP Works
The UDX-5UP uses a combination of rules to generate buy and sell signals:
Buy Signal ("Buy"):
The Pivot Supertrend changes from red to green.
The SMA 8 crosses above the SMA 21.
The volume is above the MA 20, with green bars (indicating buying pressure).
The RSI is rising and, ideally, below 70 (not overbought).
Example: On the 4H chart, the price of Tether (USDT) is at 0.05515. The Pivot Supertrend turns green, the SMA 8 crosses above the SMA 21, the volume shows green bars above the MA 20, and the RSI is at 46. The UDX-5UP plots a "Buy".
Sell Signal ("Sell"):
The Pivot Supertrend changes from green to red.
The SMA 8 crosses below the SMA 21.
The volume is above the MA 20, with red bars (indicating selling pressure).
The RSI is falling and, ideally, above 70 (overbought).
Example: On the 4H chart, the price of Tether rises to 0.05817. The Pivot Supertrend turns red, the SMA 8 crosses below the SMA 21, the volume shows red bars, and the RSI is above 70. The UDX-5UP plots a "Sell".
RSI Divergences:
The indicator identifies bullish divergences (price makes a lower low, but RSI makes a higher low) and bearish divergences (price makes a higher high, but RSI makes a lower high), plotting alerts for potential reversals.
Adjustable Settings
The UDX-5UP is highly customizable to suit your trading style:
Pivot Supertrend Period: Default is 2. Increase to 3 or 4 for more conservative signals (fewer false positives, but more lag).
SMA Periods: Default is 8 and 21. Adjust to 5 and 13 for smaller timeframes (e.g., 5M) or 13 and 34 for larger timeframes (e.g., 1D).
RSI Period: Default is 14. Reduce to 10 for greater sensitivity or increase to 20 for smoother signals.
Overbought/Oversold Levels: Default is 70/30. Adjust to 80/20 in volatile markets.
Display Panels: You can enable/disable the volume and RSI panels to simplify the chart.
How to Use the UDX-5UP
Identify the Trend:
Use the Pivot Supertrend and SMAs to determine the market direction. Uptrend: look for buys. Downtrend: look for sells.
Confirm with Volume and RSI:
For buys: Volume above the MA 20 with green bars, RSI rising and below 70.
For sells: Volume above the MA 20 with red bars, RSI falling and above 70.
Enter the Trade:
Enter a buy when the UDX-5UP plots a "Buy" and all conditions are aligned.
Enter a sell when the UDX-5UP plots a "Sell" and all conditions are aligned.
Plan the Exit:
Use Fibonacci levels or support/resistance on the price chart to set targets.
Exit the trade when the UDX-5UP plots an opposite signal ("Sell" after a buy, "Buy" after a sell).
Tips for Beginners
Start with Larger Timeframes: Use the 4H or 1D chart for more reliable signals and less noise.
Combine with Other Indicators: Use the UDX-5UP with tools like Fibonacci or the Candles RSI (another powerful indicator) to confirm signals.
Practice in Demo Mode: Test the indicator in a demo account before using real money.
Manage Risk: Always use a stop-loss and don’t risk more than 1-2% of your capital per trade.
Why Use the UDX-5UP?
Simplicity: Clear "Buy" and "Sell" signals make trading accessible even for beginners.
Versatility: Works on any asset (crypto, forex, stocks) and timeframe.
Multiple Confirmations: Combines price, volume, and momentum to reduce false signals.
Customizable: Adjust the settings to match your trading style.
Author’s Notes
The UDX-5UP was developed based on years of trading and technical analysis experience. It is an evolution of tested strategies, designed to help traders navigate volatile markets with confidence. However, no indicator is infallible. Always combine the UDX-5UP with proper risk management and fundamental analysis, especially in unpredictable markets. Feedback is welcome – leave a comment or reach out with suggestions for improvements!

Stock_Cloud-EMA,VWAP,ST Indicator_V1Stock_Cloud V1 - EMA, VWAP, SuperTrend Strategy Indicator
This indicator combines three powerful technical indicators (EMA, VWAP, and SuperTrend) to create a comprehensive trading system that helps identify high-probability trading setups when all components align.
Strategy Components & Logic:
• EMA (Exponential Moving Average): Acts as a dynamic support/resistance and trend direction indicator
• VWAP (Volume Weighted Average Price): Provides important institutional price levels and volume-based trend strength
• SuperTrend: Offers trend direction and potential reversal points
Why These Components Work Together:
1. EMA filters out market noise while maintaining responsiveness to price changes
2. VWAP adds volume-based price validation, especially useful for intraday trading
3. SuperTrend confirms trend direction and potential reversal points
4. When all three indicators align, it creates a high-probability setup
Signal Generation:
• Bullish Signal: Generated when price crosses above all three indicators (EMA, VWAP, and SuperTrend turns bullish)
• Bearish Signal: Generated when price crosses below all three indicators (EMA, VWAP, and SuperTrend turns bearish)
• Background color changes help visualize the current market condition
Settings:
- EMA Length: 20 (default, adjustable)
- SuperTrend Period: 10 (default, adjustable)
- SuperTrend Multiplier: 3.0 (default, adjustable)
How to Use:
1. Look for potential entries when all three indicators align
2. Small triangles mark key entry points when alignment occurs
3. Use background color as additional confirmation
4. Monitor price action relative to all three indicators for exit signals
Best Timeframes:
Works well on all timeframes, but particularly effective on 5-minute to daily charts for stocks and indices.
Note: This indicator combines traditional technical analysis tools in a unique way to provide clear, actionable signals. Always use proper risk management and consider other factors like market conditions and support/resistance levels.
Created by Stock_Cloud
Version 2.0

Advanced Pivot Manipulation SuperTrend - Consolidation ZoneHere’s the description translated into English for your TradingView publication:
---
Advanced Pivot Manipulation SuperTrend - Consolidation Zone
Description :
This advanced indicator combines multiple technical tools to provide a comprehensive analysis of trends, key levels, and consolidation zones. Ideal for traders seeking to spot opportunities while avoiding the traps of flat markets, it helps you better understand market dynamics and improve your trading decisions.
Key Features:
1.
Dynamic SuperTrend with Pivot Points:
- An enhanced SuperTrend algorithm based on pivot points for more precise trend tracking.
- Thresholds (Up/Dn) are dynamically adjusted using ATR (Average True Range) for improved volatility adaptation.
2. Consolidation Zones:
- Automatically identifies periods when the market moves within a narrow range (1% by default).
- Consolidation zones are visually highlighted to help avoid risky trades.
3. Dynamic Support and Resistance:
- Automatically calculates support and resistance levels based on a rolling period (configurable).
- These levels serve as key references for potential breakouts or trend reversals.
4. Advanced Detection Tools:
- Includes a volume multiplier and shadow-to-body ratio to signal unusual or potentially manipulated moves (e.g., spoofing).
5. Intuitive Visuals:
- SuperTrend lines are color-coded to indicate bullish (green) or bearish (red) trends.
- Semi-transparent lines mark support and resistance levels, and red backgrounds indicate consolidation zones.
Customizable Parameters:
- Pivot Point Period: Adjust the period for detecting pivot highs and lows.
- ATR Factor and Period: Control the sensitivity of the SuperTrend indicator.
- Lookback Period for S/R: Define the duration for calculating support and resistance levels.
- Volume Multiplier and Shadow/Body Ratio: Configure thresholds for detecting high volumes or anomalies in candlestick patterns.
How to Use:
- Easily identify dominant trends using the SuperTrend.
- Spot consolidation zones to avoid inefficient trades or prepare breakout strategies.
- Use support and resistance levels as reference points for placing orders or adjusting risk management.
Target Audience:
- Intraday and swing traders.
- Anyone looking for a comprehensive and customizable indicator to effectively analyze volatile markets.
---
Notes:
The indicator is fully customizable to suit your needs and strategies. Feel free to experiment with the parameters to maximize its effectiveness according to your trading style.
Keywords: SuperTrend, Support and Resistance, Consolidation, Pivot Points, Trends, ATR, Advanced Trading.
---
This description highlights the indicator’s strengths and is designed to appeal to the TradingView community.

Dynamic Trailing (Zeiierman)█ Overview
The Dynamic Trailing (Zeiierman) indicator enhances the traditional SuperTrend approach by providing a more nuanced, adaptable tool for trend analysis and market volatility assessment. It combines techniques to identify dynamic support and resistance levels, trend directions, and market volatility. By integrating the Average True Range (ATR) with a unique multiplier system and smoothing mechanisms, this indicator offers a nuanced approach to trend-following strategies, making it a valuable asset for traders looking to leverage SuperTrend methodologies with additional insights into market dynamics.
█ How It Works
At its core, this indicator builds on the traditional SuperTrend formula by utilizing a modified ATR calculation to define the deviation for dynamic support and resistance levels. These levels are dynamically adjusted based on market volatility. The innovation lies in the addition of the Hull Moving Average (HMA) and the Triple Exponential Moving Average (TEMA) for an enhanced smoothing effect, making the indicator's trend signals more reliable and less prone to market noise. The trend direction is determined by comparing the closing price with the dynamic levels, facilitating clear bullish or bearish signals.
The indicator incorporates a 'Supertrend' function, which uses the dynamic levels and the price’s position relative to them to determine the trend direction. This determination is visualized through color-coded lines and a cloud zone, which expands or contracts based on the ATR and a user-defined width setting, illustrating the market's volatility and trend strength.
ATR Calculation: Utilizes the Average True Range (ATR) to measure market volatility. The ATR is a cornerstone of this indicator, helping to dynamically adjust the support and resistance levels according to the market’s changing conditions.
Supertrend Calculation: Implements a supertrend formula that combines the ATR with user-defined multipliers to plot potential trend directions. This feature helps in identifying whether the market is in an uptrend or downtrend, offering visual cues for potential reversals.
TEMA Calculation: Employs the Triple Exponential Moving Average (TEMA) through a Hull Moving Average (HMA) calculation to smooth out price data. This smoothing process helps in reducing market noise and makes the trend direction clearer.
Dynamic Support and Resistance: Calculates dynamic support and resistance levels by applying a deviation (derived from the ATR and user-defined multiplier) to the smoothed price data. These levels adapt to market conditions, providing areas where price might experience support or resistance.
Trend and Cloud Calculation: Determines the overall trend direction and plots a 'Cloud' zone around it, which adjusts in width based on the ATR and a user-defined cloud width setting. This cloud acts as a visual buffer, indicating the strength and stability of the current trend.
█ How to Use
Trend Identification: The primary function of this indicator is to help traders quickly identify the prevailing market trend. A change in the color of the dynamic trailing line or its position relative to the price can signal potential trend reversals.
Dynamic Support and Resistance: Unlike static levels, the dynamic levels adjust with market conditions, providing current areas where the price might experience support or resistance.
Dynamic Support
Dynamic Resistance
█ Settings
Mult (Multiplier): Adjusts the multiplier for the ATR calculation, affecting the deviation distance for support and resistance levels. Higher values decrease sensitivity and vice versa.
Len (Length): Sets the period for the HMA in the TEMA calculation, influencing the indicator's responsiveness to price changes.
Smoothness: Determines the smoothness of the dynamic support and resistance lines by setting the SMA length. Higher values result in smoother lines.
Cloud Width : Modifies the width of the cloud, providing a visual representation of market volatility.
Color Settings (upcol and dncol): Allows users to customize the colors of the indicator's lines and cloud, aiding in visual trend identification.
-----------------
Disclaimer
The information contained in my Scripts/Indicators/Ideas/Algos/Systems does not constitute financial advice or a solicitation to buy or sell any securities of any type. I will not accept liability for any loss or damage, including without limitation any loss of profit, which may arise directly or indirectly from the use of or reliance on such information.
All investments involve risk, and the past performance of a security, industry, sector, market, financial product, trading strategy, backtest, or individual's trading does not guarantee future results or returns. Investors are fully responsible for any investment decisions they make. Such decisions should be based solely on an evaluation of their financial circumstances, investment objectives, risk tolerance, and liquidity needs.
My Scripts/Indicators/Ideas/Algos/Systems are only for educational purposes!
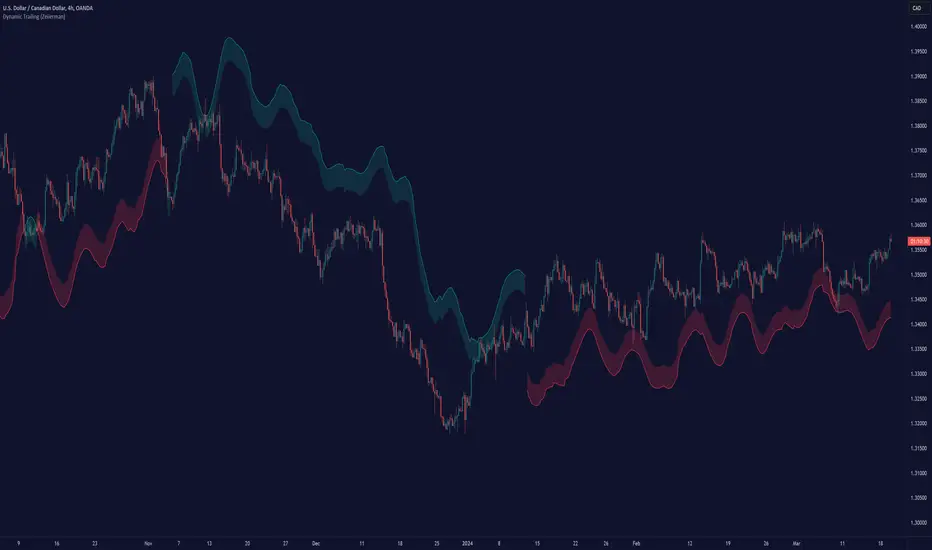
StableF-MainIt is combination of Built in Super trend and Adx with take profit
uptrend is considered when +dmi is above -dmi and +dmi is above 25 and adx is above 25 and supertrend gives Buy
downtrend is considered when -dmi is above +dmi and -dmi is above 25 and adx is above 25 and supertrend give sell
use fibo for target by taking as previous swing high and swing low
-supertrend crossover is referred as buy plotshape
-supertrend cross under is referred as Sell plotshape
-keep stoploss at dot line of supertrend
-adx-dmi crossover (+dmi crossed above -dmi) is shown by Triangle Up symbol
-adx-dmi crossunder( -dmi crosses below +dmi) is shown by Triangle down symbol
--Cross symbol with blue line with linewidth 2 is referred as Take profit
--combine this with adx -dmi setting with 7 and 14
----disclaimer-----
used free built in supertrend and adx so u can use same setting in other broker or in trading view
not responsible for any loss or gain
-only for educational purpose
BlackPika Supertrend Public v2Hello Reader!
What is Supertrend indicator ?
The Supertrend Indicator is a popular technical analysis tool designed to assist traders in identifying market trends.
The indicator combines the average true range (ATR) with a multiplier to calculate its value. This value is then added to or subtracted from the asset’s closing price to plot the supertrend line.
The Supertrend Indicator can help identify trends, manage risk, and confirm market tendencies.
The indicator is limited by its lagging nature, is not very flexible, and can send up false signals.
The Supertrend Indicator has become a staple for traders in stocks, currencies, and commodities for its ability to identify and follow market trends.
About this script:
This script is based on the SuperTrend. There are some extra things added to make it able to use more efficiently. They are listed below:
1. Pullback signals: These signals indicate a pull back after a trend reversal and are the most optimum places where you can add to your existing position. They also come with Alerts !
2. Trailing Stop Loss and Take Profit: These further help to reduce the draw-down and can help you to trail profits with more granularity thus securing gains. This are using RSI levels. RSI levels above 70 will indicate a partial take profit when long and RSI levels below 25 will indicate a take profit level when short.
How to use ?
----------------
Personally I use it on major pairs on cryptocurrencies like BTCUSD . Usually after the trend flips, there will be pullbacks, You can enter a part of the position when trend reversal is confirmed. (LONG signal)
Then add more when you get a pullback (PB_LONG signal).
To make life simpler, alerts are added for pullback signals as well. These can help acheive good entry price. Entering at pullback signals limits your losses to a great extent, as the trend will flip on the bar close if it goes against you.
You can trade manually or you can automate. All the signals have been provided with Alerts. some signals have been grouped, to reduce the number of the alerts if you wish to.
I wish you all the luck and please comment and Like if you have any doubts.

MAST TrendHello Traders !!
This is a simple super trend based MAST trend.
By default the supertrend is 10 period with 3 ATR multiplier.
A moving average is used to benefit from the pullback entries.
Bullish Pullback : Price above Supertrend & below MA
Bullish: Price above Supertrend and above MA
Bearish pullback : Price below Supertrend & above MA
Bearish : Price below Supertrend & below MA
Refer to investopedia or any relevant articles for in detail about Supertrend.

区间顶底|超级趋势|增强版中文介绍 (English description follows)
【脚本概述】 本指标是一个多功能的综合交易系统,旨在通过结合趋势跟踪、动量反转、关键支撑阻力位以及成交量分析,为交易者提供高胜率的决策辅助。它将多个复杂的分析模块融合在一个简洁的图表中,适合日内交易及波段交易。
【核心功能与计算逻辑】
1. 智能支撑与阻力区间 (Support & Resistance Zones)
原理:基于自定义长度(默认130周期)的高低点回溯,结合ATR(平均真实波幅)计算出的动态顶底区间。
视觉:紫色区域为阻力区(潜在卖点),绿色区域为支撑区(潜在买点)。
信号:当价格触及这些区域并出现反转K线结构时,会给出相应的箭头提示。
2. 超级趋势 (SuperTrend)
原理:基于ATR(10周期,3倍乘数)的经典趋势跟踪算法。
用途:作为主要的趋势过滤器。背景颜色会随趋势变化(绿色为多头趋势,红色为空头趋势),帮助交易者顺势操作。
3. EMA均线系统
配置:包含EMA 144、169、233三条均线。
用途:用于判断长期趋势方向。当价格位于均线组上方时,主要寻找做多机会;反之则寻找做空机会。
4. 增强型RSI反转信号
红色倒三角 (R):RSI下穿超买线(70),提示顶部回归风险。
蓝色正三角 (R):RSI上穿超卖线(30),提示底部回归机会。
此信号仅作为辅助确认,建议结合支撑阻力位使用。
5. 爆量K线高亮 (Volume Anomalies)
原理:当单根K线的成交量大于过去30根K线平均成交量的2.5倍时,系统会将其判定为“爆量”。
视觉:K线实体会被染成明黄色,提示主力资金介入或情绪剧烈波动。
6. 多周期趋势面板 (Dashboard)
位置:图表右上角。
功能:实时监控从15分钟到日线级别的SuperTrend趋势方向以及成交量状态,帮助交易者进行多周期共振分析。
【使用策略建议】
顺势交易:主要依据SuperTrend背景色和EMA均线方向操作。
反转交易:关注价格进入紫色/绿色区间,且同时出现RSI三角形信号或爆量黄色K线时的反转机会。
止损设置:建议设置在支撑阻力区间的边缘外侧。
免责声明:本脚本仅用于技术交流和辅助分析,不构成任何投资建议。市场有风险,交易需谨慎。
English Summary
This is an "All-in-One" enhanced trading system that combines Trend, Momentum, and Volume analysis.
Key Features:
Dynamic Support & Resistance: Auto-detected zones based on Pivot High/Low and ATR volatility.
SuperTrend: Classic ATR-based trend following (Period 10, Multiplier 3) with background highlighting.
RSI Confirmation: Identifies Overbought/Oversold mean reversions (marked with Triangles).
Volume Highlight: Highlights candles with volume > 2.5x the 30-period average (Yellow candles).
Multi-Timeframe Dashboard: Monitors trend direction and volume status across 15m to 1D timeframes.

[blackcat] L3 SupertrendX MTFLevel: 3
Background
A supertrend is a trend-following indicator, similar to moving averages. It is plotted against price and the current trend can be determined simply by its placement against price. It is a very simple indicator and is constructed with only two parameters - period and multiplier.
Function
This is my private version of supertrend, so I named it supertrend X. My intention was improving the inherent lag issue of supertrend indicator. It may be improved under some scenarios and may be the same as TradingView official supertrend with the same set of parameters.
Remarks
I use different color to scoring trend strength with scores ranging from 0 to 100.
0 exhibits blue color
25 exhibits green color
50 exhibits yellow color
75 exhibits red color
100 exhibits fuchsia color
others exhibit gradient color
Feedbacks are appreciated.

Reversal PointsHi , in this script i tried to find reversal points on big trends. For this purpose i have used Supertrend and Donchian channels. I combined both in a single indicator for finding reversal points. I am suggesting for using higher time frames like 4 hours or 1 day. It will be work in lower time frames too. But the signals will be less reliable than higher timeframes. Here is settings in this script:
New low sensitiity : this setting for donchian channels lookback. Bigger value result as less signals.
Atr Period: Period for Atr , it is for supertrend indicator in it.
Source: Source for supertrend indicator.
Atr Multiplier : Atr multiplier setting for Supertrend. Bigger value will be result as less signals.
Good luck.
Enes.

OG Trend MasterOG Trend Master
Smart trend-tracking indicator designed to identify opportunities using Supertrend + EMA confirmation logic.
It automatically adapts to market volatility and structure:
✅ Supertrend core to detect directional bias
⚡ Dual EMA cross for confirmation and precision
🎯 Visual arrows + diamonds for instant clarity on entries
🔔 Real-time alerts for both LONG and SHORT confirmations
Built for traders who value simplicity, accuracy, and flow.
From scalpers to swing traders OG Trend Master delivers smooth trend identification across all timeframes.

Moving Average Exponential-DonCHI-SUPERTRENDThe "Moving Average Exponential-DonCHI-SUPERTREND" is a trading strategy or indicator that combines three distinct technical analysis tools:
Moving Average Exponential (EMA): This is a type of moving average that gives more weight to recent prices, making it more responsive to price changes compared to a simple moving average.
Donchian Channels (DonCHI): These are bands that are plotted above and below the recent price highs and lows. They help identify the current price volatility and potential breakout points.
SUPERTREND: This is a trend-following indicator that uses the average true range (ATR) to determine the direction of the trend. It provides signals similar to moving averages but with less lag.
