Quarterly Theory ICT 04 [TradingFinder] SSMT 4Quarter Divergence🔵 Introduction
Sequential SMT Divergence is an advanced price-action-based analytical technique rooted in the ICT (Inner Circle Trader) methodology. Its primary objective is to identify early-stage divergences between correlated assets within precise time structures. This tool not only breaks down market structure but also enables traders to detect engineered liquidity traps before the market reacts.
In simple terms, SMT (Smart Money Technique) occurs when two correlated assets—such as indices (ES and NQ), currency pairs (EURUSD and GBPUSD), or commodities (Gold and Silver)—exhibit different reactions at key price levels (swing highs or lows). This lack of alignment is often a sign of smart money manipulation and signals a lack of confirmation in the ongoing trend—hinting at an imminent reversal or at least a pause in momentum.
In its Sequential form, SMT divergences are examined through a more granular temporal lens—between intraday quarters (Q1 through Q4). When SMT appears at the transition from one quarter to another (e.g., Q1 to Q2 or Q3 to Q4), the signal becomes significantly more powerful, often aligning with a critical phase in the Quarterly Theory—a framework that segments market behavior into four distinct phases: Accumulation, Manipulation, Distribution, and Reversal/Continuation.
For instance, a Bullish SMT forms when one asset prints a new low while its correlated counterpart fails to break the corresponding low from the previous quarter. This usually indicates absorption of selling pressure and the beginning of accumulation by smart money. Conversely, a Bearish SMT arises when one asset makes a higher high, but the second asset fails to confirm, signaling distribution or a fake-out before a decline.
However, SMT alone is not enough. To confirm a true Market Structure Break (MSB), the appearance of a Precision Swing Point (PSP) is essential—a specific candlestick formation on a lower timeframe (typically 5 to 15 minutes) that reveals the entry of institutional participants. The combination of SMT and PSP provides a more accurate entry point and better understanding of premium and discount zones.
The Sequential SMT Indicator, introduced in this article, dynamically scans charts for such divergence patterns across multiple sessions. It is applicable to various markets including Forex, crypto, commodities, and indices, and shows particularly strong performance during mid-week sessions (Wednesdays and Thursdays)—when most weekly highs and lows tend to form.
Bullish Sequential SMT :
Bearish Sequential SMT :
🔵 How to Use
The Sequential SMT (SSMT) indicator is designed to detect time and structure-based divergences between two correlated assets. This divergence occurs when both assets print a similar swing (high or low) in the previous quarter (e.g., Q3), but in the current quarter (e.g., Q4), only one asset manages to break that swing level—while the other fails to reach it.
This temporal mismatch is precisely identified by the SSMT indicator and often signals smart money activity, a market phase transition, or even the presence of an engineered liquidity trap. The signal becomes especially powerful when paired with a Precision Swing Point (PSP)—a confirming candle on lower timeframes (5m–15m) that typically indicates a market structure break (MSB) and the entry of smart liquidity.
🟣 Bullish Sequential SMT
In the previous quarter, both assets form a similar swing low.
In the current quarter, one asset (e.g., EURUSD) breaks that low and trades below it.
The other asset (e.g., GBPUSD) fails to reach the same low, preserving the structure.
This time-based divergence reflects declining selling pressure, potential absorption, and often marks the end of a manipulation phase and the start of accumulation. If confirmed by a bullish PSP candle, it offers a strong long opportunity, with stop-losses defined just below the swing low.
🟣 Bearish Sequential SMT
In the previous quarter, both assets form a similar swing high.
In the current quarter, one asset (e.g., NQ) breaks above that high.
The other asset (e.g., ES) fails to reach that high, remaining below it.
This type of divergence signals weakening bullish momentum and the likelihood of distribution or a fake-out before a price drop. When followed by a bearish PSP candle, it sets up a strong shorting opportunity with targets in the discount zone and protective stops placed above the swing high.
🔵 Settings
⚙️ Logical Settings
Quarterly Cycles Type : Select the time segmentation method for SMT analysis.
Available modes include: Yearly, Monthly, Weekly, Daily, 90 Minute, and Micro.
These define how the indicator divides market time into Q1–Q4 cycles.
Symbol : Choose the secondary asset to compare with the main chart asset (e.g., XAUUSD, US100, GBPUSD).
Pivot Period : Sets the sensitivity of the pivot detection algorithm. A smaller value increases responsiveness to price swings.
Activate Max Pivot Back : When enabled, limits the maximum number of past pivots to be considered for divergence detection.
Max Pivot Back Length : Defines how many past pivots can be used (if the above toggle is active).
Pivot Sync Threshold : The maximum allowed difference (in bars) between pivots of the two assets for them to be compared.
Validity Pivot Length : Defines the time window (in bars) during which a divergence remains valid before it's considered outdated.
🎨 Display Settings
Show Cycle :Toggles the visual display of the current Quarter (Q1 to Q4) based on the selected time segmentation
Show Cycle Label : Shows the name (e.g., "Q2") of each detected Quarter on the chart.
Show Bullish SMT Line : Draws a line connecting the bullish divergence points.
Show Bullish SMT Label : Displays a label on the chart when a bullish divergence is detected.
Bullish Color : Sets the color for bullish SMT markers (label, shape, and line).
Show Bearish SMT Line : Draws a line for bearish divergence.
Show Bearish SMT Label : Displays a label when a bearish SMT divergence is found.
Bearish Color : Sets the color for bearish SMT visual elements.
🔔 Alert Settings
Alert Name : Custom name for the alert messages (used in TradingView’s alert system).
Message Frequency :
All: Every signal triggers an alert.
Once Per Bar: Alerts once per bar regardless of how many signals occur.
Per Bar Close: Only triggers when the bar closes and the signal still exists.
Time Zone Display : Choose the time zone in which alert timestamps are displayed (e.g., UTC).
Bullish SMT Divergence Alert : Enable/disable alerts specifically for bullish signals.
Bearish SMT Divergence Alert : Enable/disable alerts specifically for bearish signals
🔵 Conclusion
The Sequential SMT (SSMT) indicator is a powerful and precise tool for identifying structural divergences between correlated assets within a time-based framework. Unlike traditional divergence models that rely solely on sequential pivot comparisons, SSMT leverages Quarterly Theory, in combination with concepts like liquidity sweeps, market structure breaks (MSB) and precision swing points (PSP), to provide a deeper and more actionable view of market dynamics.
By using SSMT, traders gain not only the ability to identify where divergence occurs, but also when it matters most within the market cycle. This empowers them to anticipate major moves or traps before they fully materialize, and position themselves accordingly in high-probability trade zones.
Whether you're trading Forex, crypto, indices, or commodities, the true strength of this indicator is revealed when used in sync with the Accumulation, Manipulation, Distribution, and Reversal phases of the market. Integrated with other confluence tools and market models, SSMT can serve as a core component in a professional, rule-based, and highly personalized trading strategy.
In den Scripts nach "smt" suchen

Multi-Timeframe SFP + SMTImportant: Please Read First
This indicator is not a "one size fits all" solution. It is a professional and complex tool that requires you to learn how to use it, in addition to backtesting different settings to discover what works best for your specific trading style and the assets you trade. The default settings provided are my personal preferences for trading higher-timeframe setups, but you are encouraged to experiment and find your own optimal configuration.
Please note that while this initial version is solid, it may still contain small errors or bugs. I will be actively working on improving the indicator over time. Also, be aware that the script is not written for maximum efficiency and may be resource-intensive, but this should not pose a problem for most users.
The source code for this indicator is open. If you truly want to understand precisely how all the logic works, you can copy and paste the code into an AI assistant like Gemini or ChatGPT and ask it to explain any part of the script to you.
Author's Preferred Settings (Guideline)
As a starting point, here are the settings I personally use for my trading:
SFP Timeframe: 4-Hour (Strength: 5-5)
Max Lookback: 35 Bars
Raid Expiration: 1 Bar
SFP Lines Limit: 1
SMT Timeframe 1: 30-Minute (Strength: 2-2) with 3-Minute LTF Detection.
SMT Timeframe 2: 15-Minute (Strength: 3-3) with 3-Minute LTF Detection.
SMT Timeframe 3: 1-Hour (Strength: 1-1) with 3-Minute LTF Detection.
SMT Timeframe 4: 15-Minute (Strength: 1-1) with 3-Minute LTF Detection.
Multi-Timeframe SMT: An Overview
This indicator is a powerful tool designed to identify high-probability trading setups by combining two key institutional concepts: Swing Failure Patterns (SFP) on a higher timeframe and Smart Money Technique (SMT) divergences on a lower timeframe. A key feature is the ability to configure and run up to four independent SMT analyses simultaneously, allowing you to monitor for divergences across multiple timeframes (e.g., 15m, 1H, 4H) from a single indicator.
Its primary purpose is to generate automated signals through TradingView's alert system. By setting up alerts, the script runs server-side, monitoring the market for you. When a setup presents itself, it will send a push notification to your device, allowing you to personally evaluate the trade without being tied to your screen.
The Strategy: HTF Liquidity Sweeps into LTF SMT
The core strategy is built on a classic institutional trading model:
Wait for a liquidity sweep on a significant high timeframe (e.g., 4-hour, Daily).
Once liquidity is taken, look for a confirmation of a shift in market structure on a lower timeframe.
This indicator uses an SMT divergence as that confirmation signal, indicating that smart money may be stepping in to reverse the price.
How It Works: The Two-Step Process
The indicator's logic follows a precise two-step process to generate a signal:
Step 1: The Swing Failure Pattern (SFP)
First, the indicator identifies a high-timeframe liquidity sweep. This is configured in the "Swing Failure Pattern (SFP) Timeframe" settings.
It looks for a candle that wicks above a previous high (or below a previous low) but then closes back within the range of that pivot. This action is known as a "raid" or a "swing failure," suggesting the move failed to find genuine momentum.
Step 2: The SMT Divergence
The moment a valid SFP is confirmed, the indicator's multiple SMT engines activate.
Each engine begins monitoring the specific SMT timeframe you have configured (e.g., "SMT Timeframe 1," "SMT Timeframe 2," etc.) for a Smart Money Technique (SMT) divergence.
An SMT divergence occurs when two closely correlated assets fail to move in sync. For example, after a raid on a high, Asset A makes a new high, but Asset B fails to do so. This disagreement suggests weakness and a potential reversal.
When the script finds this divergence, it plots the SMT line and triggers an alert.
The Power of Alerts
The true strength of this indicator lies in its alert capabilities. You can create alerts for both unconfirmed and confirmed SMTs.
Enable Alerts LTF Detection: These alerts trigger when an unconfirmed, potential SMT is spotted on the lower "LTF Detection" timeframe. While not yet confirmed, these early alerts can notify you of a potential move before it fully happens, allowing you to be ahead of the curve and find the best possible trade entries.
Enable Alerts Confirmed SMT: These alerts trigger only when a permanent, confirmed SMT line is plotted on your chosen SMT timeframe. These signals are more reliable but occur later than the early detection alerts.
Key Concepts Explained
What is Pivot Strength?
Pivot Strength determines how significant a high or low needs to be to qualify as a valid structural point. A setting of 5-5, for example, means that for a candle's high to be considered a valid pivot high, its high must be higher than the highs of the 5 candles to its left and the 5 candles to its right.
Higher Strength (e.g., 5-5, 8-8): Creates fewer, but more significant, pivots. This is ideal for identifying major structural highs and lows on higher timeframes.
Lower Strength (e.g., 2-2, 3-3): Creates more pivots, making it suitable for identifying the smaller shifts in momentum on lower timeframes.
Raid Expiration & Validity
An SFP signal is not valid forever. The "Raid Expiration" setting determines how many SFP timeframe bars can pass after a raid before that signal is considered "stale" and can no longer be used to validate an SMT. This ensures your SMT divergences are always in response to recent liquidity sweeps.
Why You Must Be on the Right Chart Timeframe to See SMT Lines
Pine Script™ has a fundamental rule: an indicator running on a chart can only "see" the bars of that chart's timeframe or higher.
When the SMT logic is set to the 15-minute timeframe, it calculates its pivots based on 15-minute data. To accurately plot lines connecting these pivots, you must be on a 15-minute chart or lower (e.g., 5-minute, 1-minute).
If you are on a higher timeframe chart, like the 1-hour, the 15-minute bars do not exist on that chart, so the indicator has no bars to draw the lines on.
This is precisely why the alert system is so powerful. You can set your alert to run on the 15-minute timeframe, and TradingView's servers will monitor that timeframe for you, sending a notification regardless of what chart you are currently viewing.

Multi-Timeframe SMTSummery
The Multi-Timeframe SMT indicator is designed to identify and visualize Higher Timeframe (HTF) data on a Lower Timeframe (LTF) chart, allowing traders to see the broader market context without changing their current chart's resolution. It accurately draws pivots and SMT divergences from higher timeframes on the corresponding candles of your current lower timeframe chart.
Its core features include:
Multi-Timeframe Analysis: Configure and monitor pivots on up to four independent timeframes, from intraday to monthly.
Customizable Pivot Detection: Define the strength of pivots by adjusting the number of bars to the left and right.
SMT Divergence: Automatically identifies bullish and bearish SMT divergences by comparing the price action of the main chart symbol with a chosen correlated asset.
Early SMT Detection: A unique feature that monitors a lower "detection timeframe" to provide early warnings of potential SMT setups before they're confirmed on the main timeframe. Note that this early detection is only shown on timeframes equal to or lower than the "Detection timeframe" you have set.
Visual Cues & Alerts: Clear on-chart labels, lines, and fully customizable alerts notify you of confirmed pivots and SMT divergences, ensuring you don't miss key opportunities.
Important Nuance Regarding Pivot Label Display
Due to a self-imposed limit within this script's drawing management logic, the indicator might quickly reach its drawing capacity if you enable pivot crosses for multiple timeframes simultaneously. When this internal drawing limit is exceeded, the script is designed to automatically remove the oldest drawings to make space for new ones.
Therefore, to ensure optimal performance and visibility of the most recent and relevant pivots, it's highly recommended to only enable the "Show Pivot Crosses" option for one timeframe at a time. If you wish to view pivots for a different timeframe, simply disable the pivot crosses for the currently active timeframe and then enable them for your desired one. This approach prevents the rapid cycling and disappearance of pivot labels, providing a clearer and more stable visual experience.
In-Depth Explanation of the Logic
This script is built on two primary concepts: pivot points and Smart Money Technique (SMT) divergence. It systematically collects historical data on multiple timeframes, identifies pivots, and then compares them between two assets to find divergences.
Pivot Point Identification
A pivot is a turning point in the market. A pivot high is a candle that has a higher high than the candles to its immediate left and right. Conversely, a pivot low is a candle with a lower low than its neighbors.
How it Works in the Script:
The script tracks the highest high and lowest low for each period of the selected timeframe (e.g., for each 4-hour candle). When a new high-timeframe candle closes, it stores that high/low value and its bar index in an array. The checkForPivot() function then checks if a recently stored high or low qualifies as a pivot.
Key Inputs:
Left Strength (leftBars1): The number of candles to the left that must have a lower high (for a pivot high) or higher low (for a pivot low).
Right Strength (rightBars1): The number of candles to the right that must meet the same criteria.
For example, with Left Strength and Right Strength both set to 3, a pivot high is only confirmed when its high is greater than the highs of the 3 previous high-timeframe candles and the 3 subsequent high-timeframe candles. Increasing these values will identify more significant, longer-term pivots.
Smart Money Technique (SMT) Divergence
SMT Divergence is a concept popularized by The Inner Circle Trader (ICT). It occurs when two closely correlated assets fail to move in sync. For instance, if Asset A makes a higher high but Asset B fails to do so and instead makes a lower high, this creates a bearish SMT divergence. It suggests that the "smart money" may not be supporting the move in Asset A, signaling a potential reversal.
Bearish SMT: Main asset makes a higher high, while the correlated asset makes a lower high. This is a potential sell signal.
Bullish SMT: Main asset makes a lower low, while the correlated asset makes a higher low. This is a potential buy signal.
How it Works in the Script:
Data Request: For each timeframe, the script uses the request.security() function to fetch the high and low data for both the main chart symbol (syminfo.tickerid) and the chosen Comparison Asset.
Pivot Comparison: When a new pivot is confirmed on the main asset, the script checks if a corresponding pivot also formed on the comparison asset at the same time.
Divergence Check: It then compares the direction of the pivots. For a bearish SMT, it checks if the main asset's new pivot high is higher than its previous pivot high, while the comparison asset's new pivot high is lower than its previous one. The logic is reversed for bullish SMT.
Visualization: If a divergence is found, the script draws a red (bearish) or green (bullish) line connecting the two pivots on your chart and places an "SMT" label.
Early SMT Detection
This is a proactive feature designed to give you a heads-up. Waiting for a 4-hour or daily pivot to form can take a long time. The early detection system looks for SMT divergences on a much smaller, user-defined Detection timeframe (e.g., 15-minute).
How it Works in the Script:
Awaiting Setup: After a primary pivot (Pivot A) is formed on the main timeframe (e.g., a Daily pivot high), the script begins monitoring.
Intraday Monitoring: It then watches the Detection timeframe (e.g., 15-minute) for smaller intraday pivots.
Potential Divergence: It looks for an intraday pivot that forms a divergence against the primary Pivot A.
Watchline & Alert: When this "potential" divergence occurs, the script draws a dashed white line and triggers a "Potential SMT" alert. This isn't a confirmed SMT on the main timeframe yet, but it's a powerful early warning that one may be forming.
Drawing & Object Management
To keep the chart clean and prevent performance issues, the script manages its drawings (lines and labels) efficiently. It stores them in arrays and uses a drawing limit to automatically delete the oldest drawings as new ones are created, ensuring your TradingView remains responsive.
How to Use the Indicator
Configuration
Enable Timeframes: Use the checkboxes (Enable Timeframe 1, Enable Timeframe 2, etc.) to activate the timeframes you want to monitor. It's often best to start with one or two to keep the chart clean.
Select Timeframes: Choose the higher timeframes you want to analyze (e.g., 240 for 4-hour, D for Daily, W for Weekly).
Set Pivot Strength: The default of 3 for Left/Right strength is a good starting point. Increase it to find more significant market structure points or decrease it for more frequent, shorter-term pivots.
Configure SMT:
Check Enable SMT for the timeframes where you want to detect divergence.
Enter a Comparison Asset . This is crucial. Ensure the assets are correlated.
To use the early warning system, check Enable early SMT detection and select an appropriate Detection timeframe (e.g., 15 or 60 minutes for a Daily analysis).

G&S SMT### Description of the Pine Script
This Pine Script is designed to identify **Smart Money Technique (SMT)** setups between **Gold (GC1!)** and **Silver (SI1!) Futures** on a **15-minute timeframe**. It specifically looks for divergences between the price movements of Gold and Silver over the last 4 candles and compares it with the next candle's price movement. The script provides **Bullish** and **Bearish** signals for SMT during a specified time range of **8:45 AM EST to 10:30 AM EST**.
### Key Features of the Script:
1. **Futures Symbols**:
- The script uses **Gold Futures (GC1!)** and **Silver Futures (SI1!)** on a 15-minute timeframe to monitor their price movements.
2. **Time Range Filtering**:
- The signals are only active between **8:45 AM EST and 10:30 AM EST**, ensuring that the script only signals within the most relevant trading hours for your strategy.
3. **SMT Calculation (Last 4 Candles vs Next Candle)**:
- **Gold and Silver Price Change Calculation**: The script compares the price changes of **Gold** and **Silver** over the **last 4 candles** and then compares them with the price movement of the **next candle**:
- **Bullish SMT**: Occurs when Gold shows an increase in the last 4 candles while Silver shows a decrease, and both Gold and Silver show an increase in the next candle.
- **Bearish SMT**: Occurs when Gold shows a decrease in the last 4 candles while Silver shows an increase, and both Gold and Silver show a decrease in the next candle.
4. **Bullish and Bearish Signals**:
- **Bullish SMT Signal**: The script will plot a **green** arrow below the bar when a Bullish SMT setup is identified.
- **Bearish SMT Signal**: A **red** arrow above the bar is plotted when a Bearish SMT setup is identified.
5. **Gold and Silver Difference Plot**:
- The difference between the prices of **Gold** and **Silver** is plotted as a **blue line**, giving a visual representation of the relationship between the two assets. When the difference line moves significantly, it can indicate a potential divergence or convergence in the prices of Gold and Silver.
### Script Logic Breakdown:
1. **Price Change for Last 4 Candles**:
- The script calculates the price change for Gold and Silver from the 4th-to-last candle to the last candle.
- `gold_change_last4` and `silver_change_last4` calculate these price differences.
2. **Price Change for Next Candle**:
- It then calculates the price change from the last candle to the next candle.
- `gold_change_next` and `silver_change_next` calculate these price differences.
3. **Bullish SMT Condition**:
- If Gold increased while Silver decreased in the last 4 candles, and both Gold and Silver show an increase in the next candle, it indicates a **Bullish SMT**.
4. **Bearish SMT Condition**:
- If Gold decreased while Silver increased in the last 4 candles, and both Gold and Silver show a decrease in the next candle, it indicates a **Bearish SMT**.
5. **Time Filter**:
- Signals are only plotted when the current time is between **8:45 AM EST and 10:30 AM EST** to match your preferred trading hours.
### Visualization:
- **Bullish Signals**: Plotted as **green arrows** below the bars when a Bullish SMT setup is identified.
- **Bearish Signals**: Plotted as **red arrows** above the bars when a Bearish SMT setup is identified.
- **Gold - Silver Difference**: A **blue line** is plotted to show the price difference between Gold and Silver, helping visualize any divergence.
### How It Helps:
- **Divergence Identification**: This script highlights potential divergences between Gold and Silver Futures, which can provide insights into market sentiment and smart money movements.
- **Focus on Relevant Time Frame**: By filtering signals between 8:45 AM EST and 10:30 AM EST, you are focusing on a timeframe that can be more beneficial for trading.
- **Visual Clarity**: The arrows and the price difference line provide clear signals and a visual representation of the relationship between Gold and Silver, helping you make informed trading decisions.
This script is an automated approach to detecting **SMT setups** and helping traders recognize when Gold and Silver might be signaling a bullish or bearish move based on their divergence patterns.

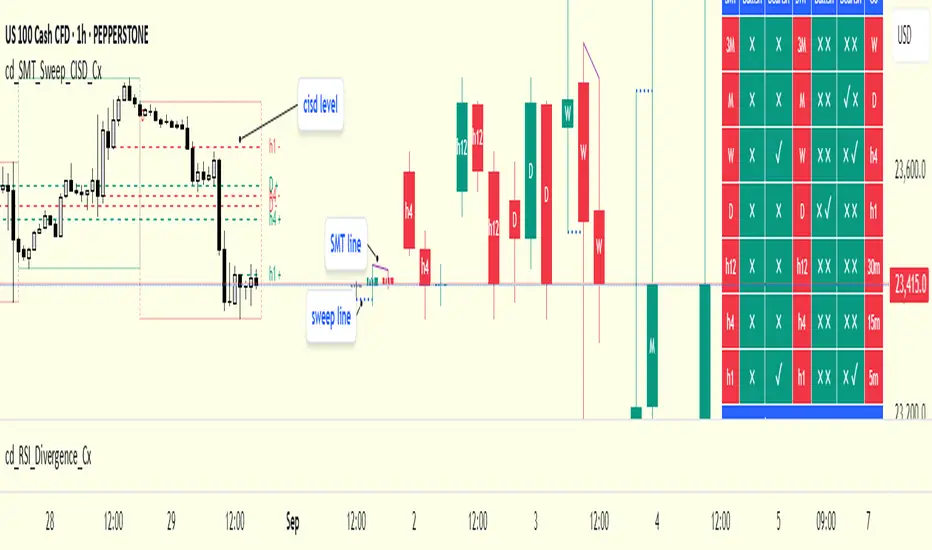
cd_SMT_Sweep_CISD_CxGeneral
This indicator is designed to show trading opportunities after sweeps of higher timeframe (HTF) highs/lows and, if available, Smart Money Technique (SMT) divergence with a correlated asset, followed by confirmation from a lower timeframe change in state delivery (CISD).
Users can track SMT, Sweep, and CISD levels across nine different timeframes.
________________________________________
Usage and Details
Commonly correlated timeframes are available in the menu by default. Users can also enter other compatible timeframes manually if necessary.
The indicator output is presented as:
• A summary table
• Display on HTF candles
• CISD levels shown as lines
Users can disable any of these from the menu.
Presentations of selected timeframes are displayed only if they are greater than or equal to the active chart timeframe.
From the Show/Hide section, you can control the display of:
• SMT table
• Sweep table
• HTF candles
• CISD levels
• HTF boxes aligned with the active timeframe
________________________________________
SMT Analysis
To receive analysis, users must enter correlated assets in the menu (or adjust them as needed).
If asset X is paired with correlated asset Y, then a separate entry for Y correlated with X is not required.
Four correlation pairs are included by default. Users should check them according to their broker/exchange or define new ones.
Checkboxes at the beginning of each row allow activation/deactivation of pairs.
SMT analysis is performed on the last three candles of each selected HTF.
If one asset makes a new high while the correlated one does not (or one makes a new low while the other does not), this is considered SMT and will be displayed both in the table and on the chart.
Charts without defined correlated assets will not display an SMT table.
________________________________________
Sweep Analysis
For the selected timeframes, the current candle is compared with the previous one.
If price violates the previous level and then pulls back behind it, this is considered a sweep. It is displayed in both the table and on the chart.
Within correlated pairs, the analysis is done separately and shown only in the table.
Example with correlated and non-correlated pairs:
• In the table, X = false, ✓ = true.
• The Sweep Table has two columns for Bullish and Bearish results.
• For correlated pairs, both values appear side by side.
• For undefined pairs, only the active asset is shown.
Example 1: EURUSD and GBPUSD pair
• If both sweep → ✓ ✓
• If one sweeps, the other does not → ✓ X
• If neither sweeps → X X
Example 2: AUDUSD with no correlated pair defined
• If sweep → ✓
• If no sweep → X
________________________________________
HTF Candles
For every HTF enabled by the user, the last three candles (including the current one) are shown on the chart.
SMT and sweep signals are marked where applicable.
________________________________________
CISD Levels
For the selected timeframes, bullish and bearish CISD levels are plotted on the chart.
________________________________________
HTF Boxes
HTF boxes aligned with the active timeframe are displayed on the chart.
Box border colors change according to whether the active HTF candle is bullish or bearish.
________________________________________
How to Read the Chart?
Let’s break down the example below:
• Active asset: Nasdaq
• Correlated asset: US500 (defined in the menu, confirmed in the table bottom row)
• Active timeframe: H1 → therefore, the HTF box is shown for Daily
• Since a correlated pair is defined, the indicator runs both SMT and Sweep analysis for the selected timeframes. Without correlation, only Sweep analysis would be shown.
Table is prepared for H1 and higher timeframes (as per user selection and active TF).
Observations:
• SMT side → H1 timeframe shows a bearish warning
• Sweep side → Bearish column shows X and ✓
o X → no sweep on Nasdaq
o ✓ → sweep on US500
Meaning: US500 made a new high (+ sweep) while Nasdaq did not → SMT formed.
The last column of the table shows the compatible LTF for confirmation.
For H1, it suggests checking the 5m timeframe.
On the chart:
• CISD levels for selected timeframes are drawn
• SMT line is marked on H1 candles
• Next step: move to 5m chart for CISD confirmation before trading (with other confluences).
Similarly, the Daily row in the table shows a Bullish Sweep on US500.
________________________________________
Alerts
Two alert options are available:
1. Activate Alert (SMT + Sweep):
Triggers if both SMT and Sweep occur in the selected timeframes. (Classic option)
2. Activate Alert (Sweep + Sweep):
Triggers if sweeps occur in both assets of a correlated pair at the same timeframe.
Interpretation:
If SMT + Sweep are already present on higher timeframes, and simultaneous sweeps appear on lower timeframes, this may indicate a strong directional move.
Of course, this must be validated with CISD and other confluences.
________________________________________
HTF CISD Levels
Although CISD levels act as confirmation levels in their own timeframe, observing how price reacts to HTF CISD levels can provide valuable insights for intraday analysis.
POIs overlapping with these levels may be higher priority.
________________________________________
What’s Next in Future Versions?
• Completed CISD confirmations
• Additional alert options
• Plus your feedback and suggestions
________________________________________
Final Note
I’ll be happy to hear your opinions and feedback.
Happy trading!
Quarterly Theory ICT 05 [TradingFinder] Doubling Theory Signals🔵 Introduction
Doubling Theory is an advanced approach to price action and market structure analysis that uniquely combines time-based analysis with key Smart Money concepts such as SMT (Smart Money Technique), SSMT (Sequential SMT), Liquidity Sweep, and the Quarterly Theory ICT.
By leveraging fractal time structures and precisely identifying liquidity zones, this method aims to reveal institutional activity specifically smart money entry and exit points hidden within price movements.
At its core, the market is divided into two structural phases: Doubling 1 and Doubling 2. Each phase contains four quarters (Q1 through Q4), which follow the logic of the Quarterly Theory: Accumulation, Manipulation (Judas Swing), Distribution, and Continuation/Reversal.
These segments are anchored by the True Open, allowing for precise alignment with cyclical market behavior and providing a deeper structural interpretation of price action.
During Doubling 1, a Sequential SMT (SSMT) Divergence typically forms between two correlated assets. This time-structured divergence occurs between two swing points positioned in separate quarters (e.g., Q1 and Q2), where one asset breaks a significant low or high, while the second asset fails to confirm it. This lack of confirmation—especially when aligned with the Manipulation and Accumulation phases—often signals early smart money involvement.
Following this, the highest and lowest price points from Doubling 1 are designated as liquidity zones. As the market transitions into Doubling 2, it commonly returns to these zones in a calculated move known as a Liquidity Sweep—a sharp, engineered spike intended to trigger stop orders and pending positions. This sweep, often orchestrated by institutional players, facilitates entry into large positions with minimal slippage.
Bullish :
Bearish :
🔵 How to Use
Applying Doubling Theory requires a simultaneous understanding of temporal structure and inter-asset behavioral divergence. The method unfolds over two main phases—Doubling 1 and Doubling 2—each divided into four quarters (Q1 to Q4).
The first phase focuses on identifying a Sequential SMT (SSMT) divergence, which forms when two correlated assets (e.g., EURUSD and GBPUSD, or NQ and ES) react differently to key price levels across distinct quarters. For example, one asset may break a previous low while the other maintains structure. This misalignment—especially in Q2, the Manipulation phase—often indicates early smart money accumulation or distribution.
Once this divergence is observed, the extreme highs and lows of Doubling 1 are marked as liquidity zones. In Doubling 2, the market gravitates back toward these zones, executing a Liquidity Sweep.
This move is deliberate—designed to activate clustered stop-loss and pending orders and to exploit pockets of resting liquidity. These sweeps are typically driven by institutional forces looking to absorb liquidity and position themselves ahead of the next major price move.
The key to execution lies in the fact that, during the sweep in Doubling 2, a classic SMT divergence should also appear between the two assets. This indicates a weakening of the previous trend and adds an extra layer of confirmation.
🟣 Bullish Doubling Theory
In the bullish scenario, Doubling 1 begins with a bullish SSMT divergence, where one asset forms a lower low while the other maintains its structure. This divergence signals weakening bearish momentum and possible smart money accumulation. In Doubling 2, the market returns to the previous low and sweeps the liquidity zone—breaking below it on one asset, while the second fails to confirm, forming a bullish SMT divergence.
f this move is followed by a bullish PSP and a clear market structure break (MSB), a long entry is triggered. The stop-loss is placed just below the swept liquidity zone, while the target is set in the premium zone, anticipating a move driven by institutional buyers.
🟣 Bearish Doubling Theory
The bearish scenario follows the same structure in reverse. In Doubling 1, a bearish SSMT divergence occurs when one asset prints a higher high while the other fails to do so. This suggests distribution and weakening buying pressure. Then, in Doubling 2, the market returns to the previous high and executes a liquidity sweep, targeting trapped buyers.
A bearish SMT divergence appears, confirming the move, followed by a bearish PSP on the lower timeframe. A short position is initiated after a confirmed MSB, with the stop-loss placed
🔵 Settings
⚙️ Logical Settings
Quarterly Cycles Type : Select the time segmentation method for SMT analysis.
Available modes include : Yearly, Monthly, Weekly, Daily, 90 Minute, and Micro.
These define how the indicator divides market time into Q1–Q4 cycles.
Symbol : Choose the secondary asset to compare with the main chart asset (e.g., XAUUSD, US100, GBPUSD).
Pivot Period : Sets the sensitivity of the pivot detection algorithm. A smaller value increases responsiveness to price swings.
Pivot Sync Threshold : The maximum allowed difference (in bars) between pivots of the two assets for them to be compared.
Validity Pivot Length : Defines the time window (in bars) during which a divergence remains valid before it's considered outdated.
🎨 Display Settings
Show Cycle :Toggles the visual display of the current Quarter (Q1 to Q4) based on the selected time segmentation
Show Cycle Label : Shows the name (e.g., "Q2") of each detected Quarter on the chart.
Show Labels : Displays dynamic labels (e.g., “Q2”, “Bullish SMT”, “Sweep”) at relevant points.
Show Lines : Draws connection lines between key pivot or divergence points.
Color Settings : Allows customization of colors for bullish and bearish elements (lines, labels, and shapes)
🔔 Alert Settings
Alert Name : Custom name for the alert messages (used in TradingView’s alert system).
Message Frequenc y:
All : Every signal triggers an alert.
Once Per Bar : Alerts once per bar regardless of how many signals occur.
Per Bar Close : Only triggers when the bar closes and the signal still exists.
Time Zone Display : Choose the time zone in which alert timestamps are displayed (e.g., UTC).
Bullish SMT Divergence Alert : Enable/disable alerts specifically for bullish signals.
Bearish SMT Divergence Alert : Enable/disable alerts specifically for bearish signals
🔵 Conclusion
Doubling Theory is a powerful and structured framework within the realm of Smart Money Concepts and ICT methodology, enabling traders to detect high-probability reversal points with precision. By integrating SSMT, SMT, Liquidity Sweeps, and the Quarterly Theory into a unified system, this approach shifts the focus from reactive trading to anticipatory analysis—anchored in time, structure, and liquidity.
What makes Doubling Theory stand out is its logical synergy of time cycles, behavioral divergence, liquidity targeting, and institutional confirmation. In both bullish and bearish scenarios, it provides clearly defined entry and exit strategies, allowing traders to engage the market with confidence, controlled risk, and deeper insight into the mechanics of price manipulation and smart money footprints.

Twitter Model ICT [TradingFinder] MMXM ERL D + FVG + M15 MSS/SMT🔵 Introduction
The Twitter Model ICT is a trading approach based on ICT (Inner Circle Trader) models, focusing on price movement between external and internal liquidity in lower timeframes. This model integrates key concepts such as Market Structure Shift (MSS), Smart Money Technique (SMT) divergence, and CISD level break to identify precise entry points in the market.
The primary goal of this model is to determine key liquidity levels, such as the previous day’s high and low (PDH/PDL) and align them with the Fair Value Gap (FVG) in the 1-hour timeframe. The overall strategy involves framing trades around the 1H FVG and using the M15 Market Structure Shift (MSS) for entry confirmation.
The Twitter Model ICT is designed to utilize external liquidity levels, such as PDH/PDL, as key entry zones. The model identifies FVG in the 1-hour timeframe, which acts as a magnet for price movement. Additionally, traders confirm entries using M15 Market Structure Shift (MSS) and SMT divergence.
Bullish Twitter Model :
In a bullish setup, the price sweeps the previous day’s low (PDL), and after confirming reversal signals, buys are executed in internal liquidity zones. Conversely, in a bearish setup, the price sweeps the previous day’s high (PDH), and after confirming weakness signals, sells are executed.
Bearish Twitter Model :
In short setups, entries are only executed above the Midnight Open, while in long setups, entries are taken below the Midnight Open. Adhering to these principles allows traders to define precise entry and exit points and analyze price movement with greater accuracy based on liquidity and market structure.
🔵 How to Use
The Twitter Model ICT is a liquidity-based trading strategy that analyzes price movements relative to the previous day’s high and low (PDH/PDL) and Fair Value Gap (FVG). This model is applicable in both bullish and bearish directions and utilizes the 1-hour (1H) and 15-minute (M15) timeframes for entry confirmation.
The price first sweeps an external liquidity level (PDH or PDL) and then provides an entry opportunity based on Market Structure Shift (MSS) and SMT divergence. Additionally, the entry should be positioned relative to the Midnight Open, meaning long entries should occur below the Midnight Open and short entries above it.
🟣 Bullish Twitter Model
In a bullish setup, the price first sweeps the previous day’s low (PDL) and reaches an external liquidity level. Then, in the 1-hour timeframe (1H), a bullish Fair Value Gap (FVG) forms, which serves as the price target.
To confirm the entry, a Market Structure Shift (MSS) in the 15-minute timeframe (M15) should be observed, signaling a trend reversal to the upside. Additionally, SMT divergence with correlated assets can indicate weakness in selling pressure.
Under these conditions, a long position is taken below the Midnight Open, with a stop-loss placed at the lowest point of the recent bearish move. The price target for this trade is the FVG in the 1-hour timeframe.
🟣 Bearish Twitter Model
In a bearish setup, the price first sweeps the previous day’s high (PDH) and reaches an external liquidity level. Then, in the 1-hour timeframe (1H), a bearish Fair Value Gap (FVG) is identified, serving as the trade target.
To confirm entry, a Market Structure Shift (MSS) in the 15-minute timeframe (M15) should form, signaling a trend shift to the downside. If an SMT divergence is present, it can provide additional confirmation for the trade.
Once these conditions are met, a short position is taken above the Midnight Open, with a stop-loss placed at the highest level of the recent bullish move. The trade's price target is the FVG in the 1-hour timeframe.
🔵 Settings
Bar Back Check : Determining the return of candles to identify the CISD level.
CISD Level Validity : CISD level validity period based on the number of candles.
Daily Position : Determines whether only the first signal of the day is considered or if signals are evaluated throughout the entire day.
Session : Specifies in which trading sessions the indicator will be active.
Second Symbol : This setting allows you to select another asset for comparison with the primary asset. By default, "XAUUSD" (Gold) is set as the second symbol, but you can change it to any currency pair, stock, or cryptocurrency. For example, you can choose currency pairs like EUR/USD or GBP/USD to identify divergences between these two assets.
Divergence Fractal Periods : This parameter defines the number of past candles to consider when identifying divergences. The default value is 2, but you can change it to suit your preferences. This setting allows you to detect divergences more accurately by selecting a greater number of candles.
The indicator allows displaying sessions based on various time zones. The user can select one of the following options :
UTC (Coordinated Universal Time)
Local Time of the Session
User’s Local Time
Show Open Price : Displays the New York market opening price.
Show PDH / PDL : Displays the previous day’s high and low to identify potential entry points.
Show SMT Divergence : Displays lines and labels for bullish ("+SMT") and bearish ("-SMT") divergences.
🔵 Conclusion
The Twitter Model ICT is an effective approach for analyzing and executing trades in financial markets, utilizing a combination of liquidity principles, market structure, and SMT confirmations to identify optimal entry and exit points.
By analyzing the previous day’s high and low (PDH/PDL), Fair Value Gaps (FVG), and Market Structure Shift (MSS) in the 1H and M15 timeframes, traders can pinpoint liquidity-driven trade opportunities. Additionally, considering the Midnight Open level helps traders avoid random entries and ensures better trade placement.
By applying this model, traders can interpret market movements based on liquidity flow and structural changes, allowing them to fine-tune their trading decisions with higher precision. Ultimately, the Twitter Model ICT provides a structured and logical approach for traders who seek to trade based on liquidity behavior and trend shifts in the market.

ICT SMT Divergence Lines - EnhancedThis indicator identifies and highlights Smart Money Technique (SMT) divergence between two user-selected symbols across any timeframe. It compares the last two completed candles of both symbols and marks potential SMT signals only when market context aligns with smart money principles.
⚡ Key Features
✅ SMT Bullish Signal
Symbol 1 forms a lower low compared to its prior candle.
Symbol 2 forms a higher low compared to its prior candle.
The previous candle on the chart was bearish (close < open).
✅ SMT Bearish Signal
Symbol 1 forms a higher high compared to its prior candle.
Symbol 2 forms a lower high compared to its prior candle.
The previous candle on the chart was bullish (close > open).
✅ Visual Representation
Draws a clean, subtle line between the two SMT candles — green for bullish SMT and red for bearish SMT — making divergence easy to spot.
Optional small triangle markers above or below the bar where SMT is detected.
Old lines are automatically removed to keep the chart uncluttered.
✅ Multi-timeframe compatible
Works on any chart timeframe.
Compares the last two completed candles in the current chart timeframe, or can be adapted for a fixed higher timeframe.

Anti-SMT + FVG SignalMade by Laila
Anti-SMT + FVG Strategy
A contrarian price-action strategy that combines SMT illusion with Fair Value Gap (FVG) confirmation and multiple filters.
Strategy Concept
This strategy challenges traditional SMT divergence logic. Instead of entering trades based on expected SMT divergence between correlated pairs (e.g., EURUSD and DXY), it assumes the divergence is false and will reverse. The concept is to take advantage of these false signals, also known as "SMT illusions."
To confirm the setup, the strategy integrates Fair Value Gaps (FVGs), which are price imbalances left unfilled between candle 1 and 3.
Anti-SMT Logic
Short Entry:
EURUSD makes a new high (Candle 1)
DXY does not make a new low
Long Entry:
EURUSD makes a new low (Candle 1)
DXY does not make a new high
This divergence is considered false, and the strategy expects a reversal.
Fair Value Gap (FVG) Confirmation
A trade is only triggered if the price touches a Fair Value Gap during:
Candle 1 (the candle that forms the SMT illusion), or
Candle 2 (entry confirmation)
This helps avoid low-quality setups and increases entry precision.
Additional Filters
To improve robustness and prevent overfitting, the strategy includes:
EMA Trend Filter:
Long entries are allowed only if price is above the 50 EMA
Short entries are allowed only if price is below the 50 EMA
Time Filter:
Trades are only permitted between 08:00 and 18:00 UTC
Cooldown Filter:
A minimum of 10 candles between trades is required to prevent overtrading
Strategy Parameters and Defaults
Optimized for EURUSD on the 4-hour (4H) timeframe
Includes realistic commission and slippage
Uses conservative position sizing (e.g., 1% per trade)
Backtesting over hundreds of trades shows approximately 57% win rate under default conditions
These results are historical and do not guarantee future performance
Purpose and Value
This strategy offers a structured and logical approach to contrarian trading by:
Introducing the concept of false SMT divergence
Using price inefficiencies (FVGs) as confirmation
Filtering trades with realistic and widely accepted conditions
Encouraging quality over quantity through strict entry rules
It is not a simple mashup but a well-defined trading system that blends institutional concepts in a usable framework.
FOR CRT SMT – 4 CANDLEFOR CRT SMT – 4 CANDLE Indicator
This indicator detects SMT (Smart Money Technique) divergence by comparing the last 4 candle highs and lows of two different assets.
Originally designed for BTC–ETH comparison, but it works on any market, including Forex pairs.
You can open EURUSD on the chart and select GBPUSD from the settings, and the indicator will detect SMT divergence between EUR and GBP the same way it does between BTC and ETH. This makes it useful for analyzing correlated markets across crypto, forex, and more.
🔴 Upper SMT (Bearish Divergence – Red)
Occurs when:
The main chart asset makes a higher high,
The comparison asset makes a lower high.
This may signal a liquidity grab and potential reversal.
🟢 Lower SMT (Bullish Divergence – Green)
Occurs when:
The main chart asset makes a lower low,
The comparison asset makes a higher low.
This may indicate the market is sweeping liquidity before reversing upward.
📌 Features
Uses the last 4 candles of both assets.
Automatically draws divergence lines.
Shows clear “SMT ↑” or “SMT ↓” labels.
Works on Crypto, Forex, and all correlated assets.

cd_indiCATor_CxGeneral:
This indicator is the redesigned, simplified, and feature-enhanced version of the previously shared indicators:
cd_cisd_market_Cx, cd_HTF_Bias_Cx, cd_sweep&cisd_Cx, cd_SMT_Sweep_CISD_Cx, and cd_RSI_divergence_Cx.
Within the holistic setup, the indicator tracks:
• HTF bias
• Market structure (trend) in the current timeframe
• Divergence between selected pairs (SMT)
• Divergence between price and RSI values
• Whether the price is in an important area (FVG, iFVG, and Volume Imbalance)
• Whether the price is at a key level
• Whether the price is within a user-defined special timeframe
The main condition and trigger of the setup is an HTF sweep with CISD confirmation on the aligned timeframe.
When the main condition occurs, the indicator provides the user with a real-time market status summary, enriched with other data.
________________________________________
What’s new?
-In the SMT module:
• Triad SMT analysis (e.g.: NQ1!, ES1!, and YM1!)
• Dyad SMT analysis (e.g.: EURUSD, GBPUSD)
• Alternative pair definition and divergence analysis for non-correlated assets
o For crypto assets (xxxUSDT <--> xxxUSDT.P) (e.g.: SOLUSDT.P, SOLUSDT)
o For stocks, divergence analysis by comparing the asset with its value in another currency
(BIST:xxx <--> BIST:xxx / EURTRY), (BAT:xxx <--> BAT:xxx / EURUSD)
-Special timeframe definition
-Configurable multi-option alarm center
-Alternative summary presentation (check list / status table / stickers)
________________________________________
Details and usage:
The user needs to configure four main sections:
• Pair and correlated pairs
• Timeframes (Auto / Manual)
• Alarm center
• Visual arrangement and selections
Pair Selections:
The user should adjust trading pairs according to their trade preferences.
Examples:
• Triad: NQ1!-ES1!-YM1!, BTC-ETH-Total3
• Dyad: NAS100-US500, XAUUSD-XAGUSD, XRPUSDT-XLMUSDT
Single pairs:
-Crypto Assets:
If crypto assets are not in the triad or dyad list, they are automatically matched as:
Perpetual <--> Spot (e.g.: DOGEUSDT.P <--> DOGEUSDT)
If the asset is already defined in a dyad list (e.g., DOGE – SHIB), the dyad definition takes priority.
________________________________________
-Stocks:
If stocks are defined in the dyad list (e.g.: BIST:THYAO <--> BIST:PGSUS), the dyad definition takes priority.
If not defined, the stock is compared with its value in the selected currency.
For example, in the Turkish Stock Exchange:
BIST:FENER stock, if EUR is chosen from the menu, is compared as BIST:FENER / OANDA:EURTRY.
Here, “OANDA” and the stock market currency (TRY) are automatically applied for the exchange rate.
For NYSE:XOM, its pair will be NYSE:XOM / EURUSD.
________________________________________
Timeframes:
By default, the menu is set to “Auto.” In this mode, aligned timeframes are automatically selected.
Aligned timeframes (LTF-HTF):
1m-15m, 3m-30m, 5m-1h, 15m-4h, 1h-D, 4h-W, D-M
Example: if monitoring the chart on 5m:
• 1h sweep + 5m CISD confirmation
• D sweep + 1h CISD confirmation (bias)
• 5m market structure
• 1h SMT and 1h RSI divergence analysis
For manual selections, the user must define the timeframes for Sweep and HTF bias.
FVG, iFVG, and Volume Imbalance timeframes must be manually set in both modes.
________________________________________
Alarm Center:
The user can choose according to preferred criteria.
Each row has options.
“Yes” → included in alarm condition.
“No” → not included in alarm condition.
If special timeframe criteria are added to the alarm, the hour range must also be entered in the same row, and the “Special Zone” tab (default: -4) should be checked.
Key level timeframes and plot options must be set manually.
Example alarm setup:
Alongside the main Sweep + CISD condition, if we also want HTF bias + Trend alignment + key level (W, D) and special timeframe (09:00–11:00), we should set up the menu as follows:
________________________________________
Visual Arrangement and Selections:
Users can control visibility with checkboxes according to their preferences.
In the Table & Sticker tab, table options and labels can be controlled.
• Summary Table has two options: Check list and Status Table
• From the HTF bias section, real-time bias and HTF sweep zone (optional) are displayed
• The RSI divergence section only shows divergence analysis results
• The SMT 2 sub-section only functions when triad is selected
Labels are shown on the bar where the sweep + CISD condition occurs, displaying the current situation.
With the Check box option, all criteria’s real-time status is shown (True/False).
Status Table provides a real-time summary table.
Although the menu may look crowded, most settings only need to be adjusted once during initial use.
________________________________________
What’s next?
• Suggestions from users
• Standard deviation projection
• Mitigation/order blocks (cd special mtg)
• PSP /TPD
________________________________________
Final note:
Every additional criterion in the alarm settings will affect alarm frequency.
Multiple conditions occurring at the same time is not, by itself, sufficient to enter a trade—you should always apply your own judgment.
Looking forward to your feedback and suggestions.
Happy trading! 🎉

SWUltimate Sniper: SMT + AO + Money Flow
Overview This indicator is a comprehensive trading system designed to identify high-probability reversal points by combining three powerful concepts: Smart Money Techniques (SMT), Awesome Oscillator (AO) Momentum Divergences, and Macro Money Flow Analysis. It aims to filter out false signals by requiring confirmation from multiple technical factors before generating a signal.
Key Features & Logic
1. SMT Divergence (Smart Money Tool) The core of this indicator compares the current asset's price structure (Highs and Lows) against a benchmark symbol (Default: BTCUSDT).
Bullish SMT: When Bitcoin makes a Lower Low (LL), but the Altcoin makes a Higher Low (HL). This suggests underlying strength and accumulation in the Altcoin despite BTC's weakness.
Bearish SMT: When Bitcoin makes a Higher High (HH), but the Altcoin makes a Lower High (LH). This suggests weakness and distribution in the Altcoin despite BTC's strength.
2. Awesome Oscillator (AO) Confirmation To prevent premature entries based solely on price action, the indicator checks for momentum divergence on the Awesome Oscillator.
If the "AO Filter" option is enabled in settings, a signal (triangle) will only appear if both SMT Divergence and AO Divergence occur simultaneously (or within the same pivot window). This significantly increases the reliability of the setup.
3. Money Flow Dashboard A dashboard in the top-right corner provides real-time macro context to ensure you are trading with the trend.
USDT.D (Tether Dominance): Monitors whether capital is entering (Bullish) or leaving (Bearish) the crypto market.
BTC.D (Bitcoin Dominance): Monitors whether capital is flowing into Bitcoin or rotating into Altcoins (Altcoin Season).
How to Use
Buy Signal (Green Triangle): Look for a Green Triangle below the bar. Ideally, confirm this with the Dashboard showing "Money Flow: Entering" (Green) and "Trend: Flowing to Alts" (Green).
Sell Signal (Red Triangle): Look for a Red Triangle above the bar.
Dashboard: Use the dashboard as a trend filter. Do not long an Altcoin if USDT.D is spiking (Market Bearish).
Settings
Comparison Symbol: Select the benchmark asset (Default: BTCUSDT).
Pivot Period: Adjust the sensitivity of the divergence detection.
Use AO Filter: Toggle ON/OFF to require Awesome Oscillator confirmation for signals.
Dashboard: Toggle the visibility of the Money Flow panel.

PSP (Precision Swing Point - CIC SMT)PSP SMT – Correlation Stages Indicator
The PSP SMT – Correlation Stages indicator is designed to identify Smart Money divergences (SMT) between correlated markets through a progressive, stage-based model.
It visually classifies price behavior into correlation stages, helping traders detect early imbalance, confirmation, and distribution phases used by institutional participants.
By comparing a primary asset with a correlated symbol, the indicator highlights loss of correlation, displacement, and confirmation signals, offering a structured framework to anticipate potential reversals or continuations within ICT-based market models.
Ideal for traders who apply ICT concepts, intermarket analysis, and liquidity-based strategies, the PSP SMT enhances timing, context, and confidence in decision-making.

cd_sweep&cisd_CxOverview:
When the price is at a significant zone/level on a higher time frame (HTF), and it sweeps (breaks through and then closes back below/above) the high or low of the previous HTF candle, it is common to look for a Change in State of Delivery (CISD) on a lower time frame (LTF) to enter a trade.
This model can be summarized as:
HTF Sweep → LTF CISD (Optional: SMT / Divergences)
________________________________________
Working Principle & Details:
1. The indicator monitors price action on the selected HTF and tracks any sweep (violation) of the previous HTF candle's high or low. Simultaneously, it identifies CISD levels on the LTF. If SMT is enabled, it will appear as a label on the chart.
When both HTF sweep and LTF CISD conditions are met, the indicator marks the chart at the open of the next candle and triggers an alert if set.
CISD levels are tracked and updated whenever a new HTF high/low is formed.
2. The indicator monitors the formation of entry models on up to six selected pairs, displaying results in two separate tables:
o HTF Sweep Query Table: Monitors live HTF candles and reports pairs that meet the sweep condition.
o CISD Table: Displays the pairs where a valid entry model has formed. A "🔥" symbol indicates the condition has occurred.
3. Bias Visualization:
Based on the selected HTF, a visual band is shown at the bottom of the chart using the chosen bullish/bearish colors.
Bias is determined by:
o Candle closing above/below the previous one suggesting continuation.
o A failed close after a sweep implying potential reversal.
4. HTF Candles:
Displays HTF candles based on the user-defined time frame.
5. Optional SMT (Smart Money Technique):
Must be enabled in the menu and requires the correlated pair to be entered correctly for accurate results.
Displayed only as a visual confirmation, not a requirement for model formation.
If the currently open symbol sweeps the previous candle while the correlated symbol does not (or vice versa), an "SMT" label appears on the chart.
6. Color & Table Positioning:
Controlled via the settings menu.
________________________________________
Warnings:
• The indicator only marks CISDs that form at HTF high/low zones.
• Entering every time the model forms does not guarantee profitability.
• Waiting for the model to appear at significant HTF levels/zones increases the likelihood of success.
• HTF and LTF selections should follow commonly accepted combinations or user-tested time frames.
• If you want to trigger alerts only for symbols entered in the indicator, ensure the "Use indicator alerts" option is enabled.
• To set alerts for the TradingView watchlist instead, disable the "Use indicator alerts" option.
________________________________________
Feel free to share your thoughts and suggestions.
Happy trading! 💫

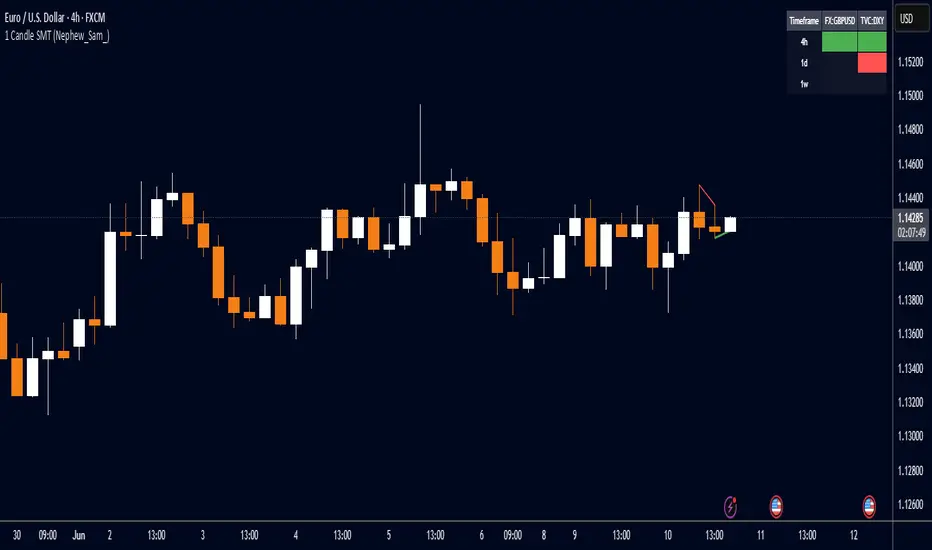
1 Candle SMT Divergence (Nephew_Sam_)📊 1 Candle SMT Divergence Detector
3-Way Smart Money Theory (SMT) Divergence Scanner for Multi-Symbol Analysis
This indicator identifies 1-candle SMT divergences by comparing one primary symbol against up to 2 correlation symbols across multiple timeframes simultaneously. Perfect for detecting institutional smart money moves and market inefficiencies.
🎯 Key Features:
3-Way Comparison: Compare 1 "From" symbol vs 2 "To" symbols (configurable)
5 Symbol Pairs: Pre-configure up to 5 different symbol combinations
Multi-Timeframe: Scan 5 timeframes simultaneously (Chart, 1H, 4H, Daily, Weekly)
Smart Filtering: Only displays timeframes equal to or higher than your chart
Real-Time Detection: Compares current vs previous candle highs/lows
Visual Alerts: Clean table display with color-coded divergence status
Line Drawing: Optional trend lines connecting divergence points
Replay Compatible: Works with TradingView's replay mode
📈 How It Works:
Detects when one symbol makes a higher high while correlated symbols make lower highs (and vice versa for lows). This creates SMT divergence signals that often precede significant market moves.
Introducing the "Smart Money Trap" (SMT) IndicatorThe "Smart Money Trap" (SMT) indicator is a powerful tool designed for simultaneous analysis of multiple currency pairs and their correlations. This indicator allows you to effortlessly visualize divergences and correlations between various currency pairs on a single chart, enhancing your ability to perform in-depth technical analysis.
Key Features:
Multi-Currency Comparison:
The SMT indicator enables you to view the following currency pairs simultaneously:
EUR/USD (Euro to US Dollar)
GBP/USD (British Pound to US Dollar)
USD/JPY (US Dollar to Japanese Yen)
DXY (US Dollar Index)
Correlation and Divergence Analysis:
By overlaying these currency pairs, the SMT indicator helps you identify correlations and divergences between them, which can signal potential trading opportunities.
Customizable Timeframes:
The indicator automatically adjusts to the current chart’s timeframe, ensuring that your analysis is always in sync with the selected period.
Enhanced Decision-Making:
With the ability to visualize multiple currency pairs and their relationships, you can make more informed trading decisions and better understand market dynamics.
The SMT indicator is a valuable tool for traders looking to track and analyze currency pair interactions and identify trading signals based on their correlations and divergences.

WaleedGhuman SMT/MSS/OF/ModelsAt the core of the WaleedGhuman SMT/MSS/OF/Models indicator lies a sophisticated Smart Money Technique (SMT) Divergence Engine that operates across specific distinct timeframes simultaneously. The result is a comprehensive market analysis tool that bridges the gap between macro market structure and micro price action, delivering institutional-grade divergence analysis in an accessible, visually intuitive format.


cd_correlation_analys_Cxcd_correlation_analys_Cx
General:
This indicator is designed for correlation analysis by classifying stocks (487 in total) and indices (14 in total) traded on Borsa İstanbul (BIST) on a sectoral basis.
Tradingview's sector classifications (20) have been strictly adhered to for sector grouping.
Depending on user preference, the analysis can be performed within sectors, between sectors, or manually (single asset).
Let me express my gratitude to the code author, @fikira, beforehand; you will find the reason for my thanks in the context.
Details:
First, let's briefly mention how this indicator could have been prepared using the classic method before going into details.
Classically, assets could be divided into groups of forty (40), and the analysis could be performed using the built-in function:
ta.correlation(source1, source2, length) → series float.
I chose sectoral classification because I believe there would be a higher probability of assets moving together, rather than using fixed-number classes.
In this case, 21 arrays were formed with the following number of elements:
(3, 11, 21, 60, 29, 20, 12, 3, 31, 5, 10, 11, 6, 48, 73, 62, 16, 19, 13, 34 and indices (14)).
However, you might have noticed that some arrays have more than 40 elements. This is exactly where @Fikira's indicator came to the rescue. When I examined their excellent indicator, I saw that it could process 120 assets in a single operation. (I believe this was the first limit overrun; thanks again.)
It was amazing to see that data for 3 pairs could be called in a single request using a special method.
You can find the details here:
When I adapted it for BIST, I found it sufficient to call data for 2 pairs instead of 3 in a single go. Since asset prices are regular and have 2 decimal places, I used a fixed multiplier of $10^8$ and a fixed decimal count of 2 in Fikira's formulas.
With this method, the (high, low, open, close) values became accessible for each asset.
The summary up to this point is that instead of the ready-made formula + groups of 40, I used variable-sized groups and the method I will detail now.
Correlation/harmony/co-movement between assets provides advantages to market participants. Coherent assets are expected to rise or fall simultaneously.
Therefore, to convert co-movement into a mathematical value, I defined the possible movements of the current candle relative to the previous candle bar over a certain period (user-defined). These are:
Up := high > high and low > low
Down := high < high and low < low
Inside := high <= high and low >= low
Outside := high >= high and low <= low and NOT Inside.
Ignore := high = low = open = close
If both assets performed the same movement, 1 was added to the tracking counter.
If (Up-Up), (Down-Down), (Inside-Inside), or (Outside-Outside), then counter := counter + 1.
If the period length is 100 and the counter is 75, it means there is 75% co-movement.
Corr = counter / period ($75/100$)
Average = ta.sma(Corr, 100) is obtained.
The highest coefficients recorded in the array are presented to the user in a table.
From the user menu options, the user can choose to compare:
• With assets in its own sector
• With assets in the selected sector
• By activating the confirmation box and manually entering a single asset for comparison.
Table display options can be adjusted from the Settings tab.
In the attached examples:
Results for AKBNK stock from the Finance sector compared with GARAN stock from the same sector:
Timeframe: Daily, Period: 50 => Harmony 76% (They performed the same movement in 38 out of 50 bars)
Comment: Opposite movements at swing high and low levels may indicate a change in the direction of the price flow (SMT).
Looking at ASELS from the Electronic Technology sector over the last 30 daily candles, they performed the same movements by 40% with XU100, 73.3% (22/30) with XUTEK (Technology Index), and 86.9% according to the averages.
Comment: It is more appropriate to follow ASELS stock with XUTEK (Technology index) instead of the general index (XU100). Opposite movements at swing high and low levels may indicate a change in the direction of the price flow (SMT).
Again, when ASELS stock is taken on H1 instead of daily, and the length is 100 instead of 30, the harmony rate is seen to be 87%.
Please share your thoughts and criticisms regarding the indicator, which I prepared with a bit of an educational purpose specifically for BIST.
Happy trading.

Intraday Pivot Highs & Lows (Asia London NY)Intraday Pivot Highs & Lows (Asia London NY)
Script Description
This TradingView indicator is optimized for Forex, scalping, intraday, and day trading strategies. It accurately plots Pivot Points and levels, high/low, support and resistance levels. These are clearly identified to aid the trader during killzone sessions and session opens. Ideal for scalp trading, intraday sessions, and leveraging SMT (Smart Money Techniques). Utilize these Price Levels effectively during London Open, NY Open, and the Asia Session, utilizing Market Structure to pinpoint key levels and reversal zones for successful trading. Improve your Trade Setups, recognize reliable Chart Patterns, identify critical Price Pivots, and trade confidently off Institutional Levels.
This script marks the intraday pivot highs, lows and midpoints retracement levels for
Asia
London
New York
It also plots the previous day's high, low, midpoint, and 0.618 Fibonacci retracement levels, providing traders with critical price reference points for making intraday trading decisions.
Originality & Usefulness
This indicator uniquely integrates pivot calculations across three major Forex sessions (Asia, London, NY), clearly delineating session boundaries.
It enhances visibility by using distinct styling
solid for New York
dashed for London
dotted lines for Asia
And colour co-ordinated labeling, improving traders' ability to identify important intraday price action zones efficiently. Unlike standard pivot indicators, this script emphasizes session-specific trading dynamics.
### Key Features ###
Session-Based Levels: Automatically plots high, low, midpoint, and Fibonacci (.618) levels for each major session (Asia, London, NY).
Distinct Visual Cues: Lines and labels use session-specific styles and colors to easily differentiate between sessions.
Previous Day Reference: Clearly plots and labels yesterday's high, low, midpoint, and Fibonacci levels.
Flexible Visibility: Traders can set timeframe visibility to maintain clean charts on higher timeframes.
### How It Works
At the start of next day's session, previous session lines are cleared, ensuring the chart remains uncluttered.
High, low, midpoint, and Fibonacci retracement levels (.618) are dynamically calculated and displayed at the close of each session.
All session levels remain visible until the start of the next respective session, providing continuous actionable insights.
Trading Application:
Session highs and lows act as strong intraday support and resistance zones.
Midpoints and Fibonacci levels are effective for identifying potential reversal zones and retracements.
Daily levels provide a broader context, useful for gauging intraday volatility and range.
### Limitations and Considerations ##
Best used on liquid assets with clear session-based price action, such as Forex major pairs, if used on indexes make sure they contain 24 hour price action not just New York session.
This indicator is designed to streamline intraday trading by clearly marking essential pivot points and session-based levels, significantly improving traders' market context and decision-making accuracy. Can be used to enhance SMT decision making when scalping killzones.

Strength Comparison @joshuuuexample:
if you want to find the stronger/weaker pair between eurusd and gbpusd, what you can do is check the eurgbp charts. if eurgbp is bullish, that means, that longs longs on eurusd are better than on gbpusd.
Unfortunately, there is no such thing to compare for example usoil with ukoil, or us100 with us500.
That's where this indicator comes in handy. You can choose whatever two symbols you want, that are supported by tradingview and you will get a chart, which shows symbol1/symbol2.
Now you can use normal market structure, or the ema option, to find out the stronger symbol.
This can also help predicting the so called SMT Divergences, taught by ICT.
⚠️ Open Source ⚠️
Coders and TV users are authorized to copy this code base, but a paid distribution is prohibited. A mention to the original author is expected, and appreciated.
⚠️ Terms and Conditions ⚠️
This financial tool is for educational purposes only and not financial advice. Users assume responsibility for decisions made based on the tool's information. Past performance doesn't guarantee future results. By using this tool, users agree to these terms.

IAN'S SMTHow to fix it (pick ONE)
✅ Option A — Treat MNQ as NQ (recommended)
If MNQ should behave identically to NQ:
isNQ = chartNorm == symA_norm or chartNorm == "MNQ1"
or more robust:
isNQ = str.contains(chartNorm, "NQ")
That makes:
NQ1!
MNQ1!
NQH2026
all map to index 0
✅ Option B — Add MNQ as its own symbol (clean but heavier)
Add a 4th symbol slot:
symD = input.symbol("MNQ1!", "Symbol D")
Then:
Update N_SYMS
Add high_i(3), low_i(3)
Expand every SMT array
This works but is a lot of refactoring

AssetCorrelationUtils
- Open source Library Used for Indicators that utilize correlation between assets for divergence calculations. It has no drawing elements.
ASSET CORRELATION UTILS
PineScript library for automatic detection of correlated asset pairs and triads for multi-asset analysis.
WHAT IT DOES
This library automatically identifies correlated assets based on the current chart symbol. It returns properly configured asset pairings for use in SMT divergence detection, inter-market analysis, and multi-asset comparison tools.
HOW IT WORKS
The library matches your chart symbol against known correlation groups:
Index Futures: NQ/ES/YM/RTY triads (including micros)
Metals: Gold/Silver/Copper triads (futures and CFD)
Forex: EUR/GBP/DXY and USD/JPY/CHF triads
Energy: Crude/Gasoline/Heating Oil triads
Treasury: ZB/ZF/ZN bond triads
Crypto: BTC/ETH/TOTAL3 and major altcoin pairings
Inversion flags are automatically computed for assets that move inversely (e.g., DXY vs EUR pairs).
HOW TO USE
import fstarcapital/AssetCorrelationUtils/1 as acu
// Simple: auto-detect from current chart
config = acu.resolveCurrentChart()
// Access resolved assets
primary = config.primary
secondary = config.secondary
tertiary = config.tertiary
EXPORTED FUNCTIONS
resolveCurrentChart(): One-call auto-detection using chart syminfo
resolveAssets(): Full detection with custom parameters
resolveTriad() / resolveDyad(): Manual resolution with inversion logic
detect*() functions: Category-specific detectors for custom workflows
TYPES
AssetPairing: Core structure for primary/secondary/tertiary tickers with inversion flags
AssetConfig: Full resolution result with detection status and asset category
DISCLAIMER
This library is a utility for building multi-asset indicators. Asset correlations are not guaranteed and may change over time. Always validate pairings for your specific trading context.
Full Default Function @type and @field descriptions below.
Library "AssetCorrelationUtils"
detectIndicesFutures(ticker)
Detects Index Futures (NQ/ES/YM/RTY + micro variants)
Parameters:
ticker (string) : The ticker string to check (typically syminfo.ticker)
Returns: AssetPairing with secondary and tertiary assets configured
detectMetalsFutures(ticker)
Detects Metal Futures (GC/SI/HG + micro variants)
Parameters:
ticker (string) : The ticker string to check
Returns: AssetPairing with secondary and tertiary assets configured
detectForexFutures(ticker)
Detects Forex Futures (6E/6B + micro variants)
Parameters:
ticker (string) : The ticker string to check
Returns: AssetPairing with secondary and tertiary assets configured
detectEnergyFutures(ticker)
Detects Energy Futures (CL/RB/HO + micro variants)
Parameters:
ticker (string) : The ticker string to check
Returns: AssetPairing with secondary and tertiary assets configured
detectTreasuryFutures(ticker)
Detects Treasury Futures (ZB/ZF/ZN)
Parameters:
ticker (string) : The ticker string to check
Returns: AssetPairing with secondary and tertiary assets configured
detectCryptoFutures(ticker)
Detects CME Crypto Futures (BTC/ETH + micro variants)
Parameters:
ticker (string) : The ticker string to check
Returns: AssetPairing with secondary and tertiary assets configured
detectCADFutures(ticker)
Detects CAD Forex Futures (6C + micro variants)
Parameters:
ticker (string) : The ticker string to check
Returns: AssetPairing with secondary and tertiary assets configured
detectForexCFD(ticker, tickerId)
Detects Forex CFD pairs (EUR/GBP/DXY, USD/JPY/CHF triads)
Parameters:
ticker (string) : The ticker string to check
tickerId (string) : The full ticker ID (syminfo.tickerid) for primary asset
Returns: AssetPairing with secondary and tertiary assets configured
detectCrypto(ticker, tickerId)
Detects major Crypto assets (BTC, ETH, SOL, XRP, alts)
Parameters:
ticker (string) : The ticker string to check
tickerId (string) : The full ticker ID for primary asset
Returns: AssetPairing with secondary and tertiary assets configured
detectMetalsCFD(ticker, tickerId)
Detects Metals CFD (XAU/XAG/Copper)
Parameters:
ticker (string) : The ticker string to check
tickerId (string) : The full ticker ID for primary asset
Returns: AssetPairing with secondary and tertiary assets configured
detectIndicesCFD(ticker, tickerId)
Detects Indices CFD (NAS100/SP500/DJ30)
Parameters:
ticker (string) : The ticker string to check
tickerId (string) : The full ticker ID for primary asset
Returns: AssetPairing with secondary and tertiary assets configured
detectEUStocks(ticker, tickerId)
Detects EU Stock Indices (GER40/EU50) - Dyad only
Parameters:
ticker (string) : The ticker string to check
tickerId (string) : The full ticker ID for primary asset
Returns: AssetPairing with secondary asset configured (tertiary empty for dyad)
getDefaultFallback(tickerId)
Returns default fallback assets (chart ticker only, no correlation)
Parameters:
tickerId (string) : The full ticker ID for primary asset
Returns: AssetPairing with chart ticker as primary, empty secondary/tertiary (no correlation)
applySessionModifierWithBackadjust(tickerStr, sessionType)
Applies futures session modifier to ticker WITH back adjustment
Parameters:
tickerStr (string) : The ticker to modify
sessionType (string) : The session type (syminfo.session)
Returns: Modified ticker string with session and backadjustment.on applied
applySessionModifierNoBackadjust(tickerStr, sessionType)
Applies futures session modifier to ticker WITHOUT back adjustment
Parameters:
tickerStr (string) : The ticker to modify
sessionType (string) : The session type (syminfo.session)
Returns: Modified ticker string with session and backadjustment.off applied
isTriadMode(pairing)
Checks if a pairing represents a valid triad (3 assets)
Parameters:
pairing (AssetPairing) : The AssetPairing to check
Returns: True if tertiary is non-empty (triad mode), false for dyad
getAssetTicker(tickerId)
Extracts clean ticker string from full ticker ID
Parameters:
tickerId (string) : The full ticker ID (e.g., "BITGET:BTCUSDT.P")
Returns: Clean ticker string (e.g., "BTCUSDT.P")
resolveTriad(chartTickerId, pairing)
Resolves triad asset assignments with proper inversion flags
Parameters:
chartTickerId (string) : The current chart's ticker ID (syminfo.tickerid)
pairing (AssetPairing) : The detected AssetPairing
Returns: Tuple
resolveDyad(chartTickerId, pairing)
Resolves dyad asset assignment with proper inversion flag
Parameters:
chartTickerId (string) : The current chart's ticker ID
pairing (AssetPairing) : The detected AssetPairing (dyad: tertiary is empty)
Returns: Tuple
resolveAssets(ticker, tickerId, assetType, sessionType, useBackadjust)
Main auto-detection entry point. Detects asset category and returns fully resolved config.
Parameters:
ticker (string) : The ticker string to check (typically syminfo.ticker)
tickerId (string) : The full ticker ID (typically syminfo.tickerid)
assetType (string) : The asset type (typically syminfo.type)
sessionType (string) : The session type for futures (typically syminfo.session)
useBackadjust (bool) : Whether to apply back adjustment for futures session alignment
Returns: AssetConfig with fully resolved assets, inversion flags, and detection status
resolveCurrentChart()
Simplified auto-detection using current chart's syminfo values
Returns: AssetConfig with fully resolved assets, inversion flags, and detection status
AssetPairing
Core asset pairing structure for triad/dyad configurations
Fields:
primary (series string) : The primary (chart) asset ticker ID
secondary (series string) : The secondary correlated asset ticker ID
tertiary (series string) : The tertiary correlated asset ticker ID (empty for dyad)
invertSecondary (series bool) : Whether secondary asset should be inverted for divergence calc
invertTertiary (series bool) : Whether tertiary asset should be inverted for divergence calc
AssetConfig
Full asset resolution result with mode detection and computed values
Fields:
detected (series bool) : Whether auto-detection succeeded
isTriadMode (series bool) : True if triad (3 assets), false if dyad (2 assets)
primary (series string) : The resolved primary asset ticker ID
secondary (series string) : The resolved secondary asset ticker ID
tertiary (series string) : The resolved tertiary asset ticker ID (empty for dyad)
invertSecondary (series bool) : Computed inversion flag for secondary asset
invertTertiary (series bool) : Computed inversion flag for tertiary asset
assetCategory (series string) : String describing the detected asset category
