Supertrend - SSL Strategy with Toggle [AlPashaTrader]📈 Overview of the Supertrend - SSL Strategy with Toggle Indicator
This strategy combines two powerful technical tools—Supertrend and SSL Channel—to deliver precise and reliable trading signals, designed for traders who value confirmation and risk management. 🎯
⚙️ How This Indicator Was Created
The strategy was meticulously crafted to harness the complementary strengths of:
Supertrend Indicator: A trend-following tool based on Average True Range (ATR) and a multiplier factor, it detects bullish or bearish trends by calculating dynamic support and resistance levels. 📊
SSL Channel: A channel indicator built using two Simple Moving Averages (SMA) of the highs and lows over a set period. It cleverly determines trend direction by comparing price action relative to these moving averages. 🔄
These two indicators are merged into one cohesive strategy with an optional toggle feature allowing the trader to choose whether to require confirmation from both indicators before taking a position or to act on signals from either. 🎚️
The script includes user-friendly controls for:
Defining a custom trading date range 📅, useful for backtesting or restricting trading to specific market conditions.
Setting the ATR length and multiplier for Supertrend sensitivity ⚙️.
Adjusting the SSL channel period for responsiveness to price changes ⏱️.
Choosing whether to require dual confirmation (both Supertrend and SSL signals) for more conservative trading or a single indicator trigger for a more aggressive approach 🛡️ vs ⚔️.
🔍 How This Indicator Works
Signal Generation:
Supertrend analyzes market volatility and trend direction, signaling a potential buy when the trend turns bullish 📈 and a sell when bearish 📉.
SSL Channel tracks price relative to its high and low moving averages to identify uptrends and downtrends. A crossover of the SSL Up and SSL Down lines generates buy or sell signals 🔔.
Confirmation Logic:
When confirmation is enabled, the strategy waits for agreement between both indicators before entering a trade ✅, reducing false signals.
When confirmation is disabled, it trades based on signals from either indicator ⚡, allowing more frequent entries but potentially higher risk.
Entry and Exit Rules:
Entry occurs when the indicator(s) signal a new trend direction 🚀 for long, or decline for short.
Exit happens when opposing signals appear 🛑, closing existing positions to lock in profits or cut losses.
Visual Aids:
The SSL Channel lines are plotted directly on the chart with distinct colors to intuitively show trend shifts 🎨.
The system respects the specified date range ⏳, ensuring trades only occur within user-defined periods.
🎯 How to Use This Strategy Effectively
Set Your Preferences: Adjust ATR length, factor, and SSL period to your style. More sensitive? Decrease lengths. Smoother? Increase them ⚙️.
Choose Confirmation Mode: Use the toggle depending on your risk appetite:
Confirmation ON ✅: For conservative traders wanting high-probability setups.
Confirmation OFF ⚡: For aggressive traders who want more signals.
Apply Date Filters: Focus your trading or backtesting on specific periods 📅.
Monitor Entry/Exit Signals: Watch crossovers and Supertrend changes closely 👀.
Risk Management: The strategy uses position sizing as a percentage of equity (default 15%) 💰. Adjust accordingly.
Combine with Other Tools: Enhance results by combining this with volume, price action, or fundamentals 🔧.
📝 Summary
This Supertrend - SSL Strategy with Toggle is a dynamic and flexible trading tool blending volatility-based trend detection with moving-average channel insights. It empowers traders to customize confirmation strictness, control trading periods, and efficiently capture trending opportunities while managing risk smartly.
By integrating proven indicators in a user-friendly, visually intuitive package, this strategy stands as a sophisticated tool suitable for various markets and trading styles. 🚀📊
In den Scripts nach "smart" suchen

Quarterly Theory ICT 05 [TradingFinder] Doubling Theory Signals🔵 Introduction
Doubling Theory is an advanced approach to price action and market structure analysis that uniquely combines time-based analysis with key Smart Money concepts such as SMT (Smart Money Technique), SSMT (Sequential SMT), Liquidity Sweep, and the Quarterly Theory ICT.
By leveraging fractal time structures and precisely identifying liquidity zones, this method aims to reveal institutional activity specifically smart money entry and exit points hidden within price movements.
At its core, the market is divided into two structural phases: Doubling 1 and Doubling 2. Each phase contains four quarters (Q1 through Q4), which follow the logic of the Quarterly Theory: Accumulation, Manipulation (Judas Swing), Distribution, and Continuation/Reversal.
These segments are anchored by the True Open, allowing for precise alignment with cyclical market behavior and providing a deeper structural interpretation of price action.
During Doubling 1, a Sequential SMT (SSMT) Divergence typically forms between two correlated assets. This time-structured divergence occurs between two swing points positioned in separate quarters (e.g., Q1 and Q2), where one asset breaks a significant low or high, while the second asset fails to confirm it. This lack of confirmation—especially when aligned with the Manipulation and Accumulation phases—often signals early smart money involvement.
Following this, the highest and lowest price points from Doubling 1 are designated as liquidity zones. As the market transitions into Doubling 2, it commonly returns to these zones in a calculated move known as a Liquidity Sweep—a sharp, engineered spike intended to trigger stop orders and pending positions. This sweep, often orchestrated by institutional players, facilitates entry into large positions with minimal slippage.
Bullish :
Bearish :
🔵 How to Use
Applying Doubling Theory requires a simultaneous understanding of temporal structure and inter-asset behavioral divergence. The method unfolds over two main phases—Doubling 1 and Doubling 2—each divided into four quarters (Q1 to Q4).
The first phase focuses on identifying a Sequential SMT (SSMT) divergence, which forms when two correlated assets (e.g., EURUSD and GBPUSD, or NQ and ES) react differently to key price levels across distinct quarters. For example, one asset may break a previous low while the other maintains structure. This misalignment—especially in Q2, the Manipulation phase—often indicates early smart money accumulation or distribution.
Once this divergence is observed, the extreme highs and lows of Doubling 1 are marked as liquidity zones. In Doubling 2, the market gravitates back toward these zones, executing a Liquidity Sweep.
This move is deliberate—designed to activate clustered stop-loss and pending orders and to exploit pockets of resting liquidity. These sweeps are typically driven by institutional forces looking to absorb liquidity and position themselves ahead of the next major price move.
The key to execution lies in the fact that, during the sweep in Doubling 2, a classic SMT divergence should also appear between the two assets. This indicates a weakening of the previous trend and adds an extra layer of confirmation.
🟣 Bullish Doubling Theory
In the bullish scenario, Doubling 1 begins with a bullish SSMT divergence, where one asset forms a lower low while the other maintains its structure. This divergence signals weakening bearish momentum and possible smart money accumulation. In Doubling 2, the market returns to the previous low and sweeps the liquidity zone—breaking below it on one asset, while the second fails to confirm, forming a bullish SMT divergence.
f this move is followed by a bullish PSP and a clear market structure break (MSB), a long entry is triggered. The stop-loss is placed just below the swept liquidity zone, while the target is set in the premium zone, anticipating a move driven by institutional buyers.
🟣 Bearish Doubling Theory
The bearish scenario follows the same structure in reverse. In Doubling 1, a bearish SSMT divergence occurs when one asset prints a higher high while the other fails to do so. This suggests distribution and weakening buying pressure. Then, in Doubling 2, the market returns to the previous high and executes a liquidity sweep, targeting trapped buyers.
A bearish SMT divergence appears, confirming the move, followed by a bearish PSP on the lower timeframe. A short position is initiated after a confirmed MSB, with the stop-loss placed
🔵 Settings
⚙️ Logical Settings
Quarterly Cycles Type : Select the time segmentation method for SMT analysis.
Available modes include : Yearly, Monthly, Weekly, Daily, 90 Minute, and Micro.
These define how the indicator divides market time into Q1–Q4 cycles.
Symbol : Choose the secondary asset to compare with the main chart asset (e.g., XAUUSD, US100, GBPUSD).
Pivot Period : Sets the sensitivity of the pivot detection algorithm. A smaller value increases responsiveness to price swings.
Pivot Sync Threshold : The maximum allowed difference (in bars) between pivots of the two assets for them to be compared.
Validity Pivot Length : Defines the time window (in bars) during which a divergence remains valid before it's considered outdated.
🎨 Display Settings
Show Cycle :Toggles the visual display of the current Quarter (Q1 to Q4) based on the selected time segmentation
Show Cycle Label : Shows the name (e.g., "Q2") of each detected Quarter on the chart.
Show Labels : Displays dynamic labels (e.g., “Q2”, “Bullish SMT”, “Sweep”) at relevant points.
Show Lines : Draws connection lines between key pivot or divergence points.
Color Settings : Allows customization of colors for bullish and bearish elements (lines, labels, and shapes)
🔔 Alert Settings
Alert Name : Custom name for the alert messages (used in TradingView’s alert system).
Message Frequenc y:
All : Every signal triggers an alert.
Once Per Bar : Alerts once per bar regardless of how many signals occur.
Per Bar Close : Only triggers when the bar closes and the signal still exists.
Time Zone Display : Choose the time zone in which alert timestamps are displayed (e.g., UTC).
Bullish SMT Divergence Alert : Enable/disable alerts specifically for bullish signals.
Bearish SMT Divergence Alert : Enable/disable alerts specifically for bearish signals
🔵 Conclusion
Doubling Theory is a powerful and structured framework within the realm of Smart Money Concepts and ICT methodology, enabling traders to detect high-probability reversal points with precision. By integrating SSMT, SMT, Liquidity Sweeps, and the Quarterly Theory into a unified system, this approach shifts the focus from reactive trading to anticipatory analysis—anchored in time, structure, and liquidity.
What makes Doubling Theory stand out is its logical synergy of time cycles, behavioral divergence, liquidity targeting, and institutional confirmation. In both bullish and bearish scenarios, it provides clearly defined entry and exit strategies, allowing traders to engage the market with confidence, controlled risk, and deeper insight into the mechanics of price manipulation and smart money footprints.

PowerHouse SwiftEdge AI v2.10 StrategyOverview
The PowerHouse SwiftEdge AI v2.10 Strategy is a sophisticated trading system designed to identify high-probability trade setups in forex, stocks, and cryptocurrencies. By combining multi-timeframe trend analysis, momentum signals, volume confirmation, and smart money concepts (Change of Character and Break of Structure ), this strategy offers traders a robust tool to capitalize on market trends while minimizing false signals. The strategy’s unique “AI” component analyzes trends across multiple timeframes to provide a clear, actionable dashboard, making it accessible for both novice and experienced traders. The strategy is fully customizable, allowing users to tailor its filters to their trading style.
What It Does
This strategy generates Buy and Sell signals based on a confluence of technical indicators and smart money concepts. It uses:
Multi-Timeframe Trend Analysis: Confirms the market’s direction by analyzing trends on the 1-hour (60M), 4-hour (240M), and daily (D) timeframes.
Momentum Filter: Ensures trades align with strong price movements to avoid choppy markets.
Volume Filter: Validates signals with above-average volume to confirm market participation.
Breakout Filter: Requires price to break key levels for added confirmation.
Smart Money Signals (CHoCH/BOS): Identifies reversals (CHoCH) and trend continuations (BOS) based on pivot points.
AI Trend Dashboard: Summarizes trend strength, confidence, and predictions across timeframes, helping traders make informed decisions without needing to analyze complex data manually.
The strategy also plots dynamic support and resistance trendlines, take-profit (TP) levels, and “Get Ready” signals to alert users of potential setups before they fully develop. Trades are executed with predefined take-profit and stop-loss levels for disciplined risk management.
How It Works
The strategy integrates multiple components to create a cohesive trading system:
Multi-Timeframe Trend Analysis:
The strategy evaluates trends on three timeframes (1H, 4H, Daily) using Exponential Moving Averages (EMA) and Volume-Weighted Average Price (VWAP). A trend is considered bullish if the price is above both the EMA and VWAP, bearish if below, or neutral otherwise.
Signals are only generated when the trend on the user-selected higher timeframe aligns with the trade direction (e.g., Buy signals require a bullish higher timeframe trend). This reduces noise and ensures trades follow the broader market context.
Momentum Filter:
Measures the percentage price change between consecutive bars and compares it to a volatility-adjusted threshold (based on the Average True Range ). This ensures trades are taken only during significant price movements, filtering out low-momentum conditions.
Volume Filter (Optional):
Checks if the current volume exceeds a long-term average and shows positive short-term volume change. This confirms strong market participation, reducing the risk of false breakouts.
Breakout Filter (Optional):
Requires the price to break above (for Buy) or below (for Sell) recent highs/lows, ensuring the signal aligns with a structural shift in the market.
Smart Money Concepts (CHoCH/BOS):
Change of Character (CHoCH): Detects potential reversals when the price crosses under a recent pivot high (for Sell) or over a recent pivot low (for Buy) with a bearish or bullish candle, respectively.
Break of Structure (BOS): Confirms trend continuations when the price breaks below a recent pivot low (for Sell) or above a recent pivot high (for Buy) with strong momentum.
These signals are plotted as horizontal lines with labels, making it easy to visualize key levels.
AI Trend Dashboard:
Combines trend direction, momentum, and volatility (ATR) across timeframes to calculate a trend score. Scores above 0.5 indicate an “Up” trend, below -0.5 indicate a “Down” trend, and otherwise “Neutral.”
Displays a table summarizing trend strength (as a percentage), AI confidence (based on trend alignment), and Cumulative Volume Delta (CVD) for market context.
A second table (optional) shows trend predictions for 1H, 4H, and Daily timeframes, helping traders anticipate future market direction.
Dynamic Trendlines:
Plots support and resistance lines based on recent swing lows and highs within user-defined periods (shortTrendPeriod, longTrendPeriod). These lines adapt to market conditions and are colored based on trend strength.
Why This Combination?
The PowerHouse SwiftEdge AI v2.10 Strategy is original because it seamlessly integrates traditional technical analysis (EMA, VWAP, ATR, volume) with smart money concepts (CHoCH, BOS) and a proprietary AI-driven trend analysis. Unlike standalone indicators, this strategy:
Reduces False Signals: By requiring confluence across trend, momentum, volume, and breakout filters, it minimizes trades in choppy or low-conviction markets.
Adapts to Market Context: The ATR-based momentum threshold adjusts dynamically to volatility, ensuring signals remain relevant in both trending and ranging markets.
Simplifies Decision-Making: The AI dashboard distills complex multi-timeframe data into a user-friendly table, eliminating the need for manual analysis.
Leverages Smart Money: CHoCH and BOS signals capture institutional price action patterns, giving traders an edge in identifying reversals and continuations.
The combination of these components creates a balanced system that aligns short-term trade entries with longer-term market trends, offering a unique blend of precision, adaptability, and clarity.
How to Use
Add to Chart:
Apply the strategy to your TradingView chart on a liquid symbol (e.g., EURUSD, BTCUSD, AAPL) with a timeframe of 60 minutes or lower (e.g., 15M, 60M).
Configure Inputs:
Pivot Length: Adjust the number of bars (default: 5) to detect pivot highs/lows for CHoCH/BOS signals. Higher values reduce noise but may delay signals.
Momentum Threshold: Set the base percentage (default: 0.01%) for momentum confirmation. Increase for stricter signals.
Take Profit/Stop Loss: Define TP and SL in points (default: 10 each) for risk management.
Higher/Lower Timeframe: Choose timeframes (60M, 240M, D) for trend filtering. Ensure the chart timeframe is lower than or equal to the higher timeframe.
Filters: Enable/disable momentum, volume, or breakout filters to suit your trading style.
Trend Periods: Set shortTrendPeriod (default: 30) and longTrendPeriod (default: 100) for trendline plotting. Keep below 2000 to avoid buffer errors.
AI Dashboard: Toggle Enable AI Market Analysis to show/hide the prediction table and adjust its position.
Interpret Signals:
Buy/Sell Labels: Green "Buy" or red "Sell" labels indicate trade entries with predefined TP/SL levels plotted.
Get Ready Signals: Yellow "Get Ready BUY" or orange "Get Ready SELL" labels warn of potential setups.
CHoCH/BOS Lines: Aqua (CHoCH Sell), lime (CHoCH Buy), fuchsia (BOS Sell), or teal (BOS Buy) lines mark key levels.
Trendlines: Green/lime (support) or fuchsia/purple (resistance) dashed lines show dynamic support/resistance.
AI Dashboard: Check the top-right table for trend strength, confidence, and CVD. The optional bottom table shows trend predictions (Up, Down, Neutral).
Backtest and Trade:
Use TradingView’s Strategy Tester to evaluate performance. Adjust TP/SL and filters based on results.
Trade manually based on signals or automate with TradingView alerts (set alerts for Buy/Sell labels).
Originality and Value
The PowerHouse SwiftEdge AI v2.10 Strategy stands out by combining multi-timeframe analysis, smart money concepts, and an AI-driven dashboard into a single, user-friendly system. Its adaptive momentum threshold, robust filtering, and clear visualizations empower traders to make confident decisions without needing advanced technical knowledge. Whether you’re a day trader or swing trader, this strategy provides a versatile, data-driven approach to navigating dynamic markets.
Important Notes:
Risk Management: Always use appropriate position sizing and risk management, as the strategy’s TP/SL levels are customizable.
Symbol Compatibility: Test on liquid symbols with sufficient historical data (at least 2000 bars) to avoid buffer errors.
Performance: Backtest thoroughly to optimize settings for your market and timeframe.

ICT Macro Zone Boxes w/ Individual H/L Tracking v3.1ICT Macro Zones (Grey Box Version
This indicator dynamically highlights key intraday time-based macro sessions using a clean, minimalistic grey box overlay, helping traders align with institutional trading cycles. Inspired by ICT (Inner Circle Trader) concepts, it tracks real-time highs and lows for each session and optionally extends the zone box after the session ends — making it a precision tool for intraday setups, order flow analysis, and macro-level liquidity sweeps.
### 🔍 **What It Does**
- Plots **six predefined macro sessions** used in Smart Money Concepts:
- AM Macro (09:50–10:10)
- London Close (10:50–11:10)
- Lunch Macro (11:30–13:30)
- PM Macro (14:50–15:10)
- London SB (03:00–04:00)
- PM SB (15:00–16:00)
- Each zone:
- **Tracks high and low dynamically** throughout the session.
- **Draws a consistent grey shaded box** to visualize price boundaries.
- **Displays a label** at the first bar of the session (optional).
- **Optionally extends** the box to the right after the session closes.
### 🧠 **How It Works**
- Uses Pine Script arrays to define each session’s time window, label, and color.
- Detects session entry using `time()` within a New York timezone context.
- High/Low values are updated per bar inside the session window.
- Once a session ends, the box is optionally closed and fixed in place.
- All visual zones use a standardized grey tone for clarity and consistency across charts.
### 🛠️ **Settings**
- **Shade Zone High→Low:** Enable/disable the grey macro box.
- **Extend Box After Session:** Keep the zone visible after it ends.
- **Show Entry Label:** Display a label at the start of each session.
### 🎯 **Why This Script is Unique**
Unlike basic session markers or colored backgrounds, this tool:
- Focuses on **macro moments of liquidity and reversal**, not just open/close times.
- Uses **per-session logic** to individually track price behavior inside key time windows.
- Supports **real-time high/low tracking and clean zone drawing**, ideal for Smart Money and ICT-style strategies.
Perfect — based on your list, here's a **bundle-style description** that not only explains the function of each script but also shows how they **work together** in a Smart Money/ICT workflow. This kind of cross-script explanation is exactly what TradingView wants to see to justify closed-source mashups or interdependent tools.
---
📚 ICT SMC Toolkit — Script Integration Guide
This set of advanced Smart Money Concept (SMC) tools is designed for traders who follow ICT-based methodologies, combining liquidity theory, time-based precision, and engineered confluences for high-probability trades. Each indicator is optimized to work both independently and synergistically, forming a comprehensive trading framework.
---
First FVG Custom Time Range
**Purpose:**
Plots the **first Fair Value Gap (FVG)** that appears within a defined session (e.g., NY Kill Zone, Custom range). Includes optional retest alerts.
**Best Used With:**
- Use with **ICT Macro Zones (Grey Box Version)** to isolate FVGs during high-probability times like AM Macro or PM SB.
- Combine with **Liquidity Levels** to assess whether FVGs form near swing points or liquidity voids.
---
ICT SMC Liquidity Grabs and OB s
**Purpose:**
Detects **liquidity grabs** (stop hunts above/below swing highs/lows) and **bullish/bearish order blocks**. Includes optional Fibonacci OTE levels for sniper entries.
**Best Used With:**
- Use with **ICT Turtle Soup (Reversal)** for confirmation after a liquidity grab.
- Combine with **Macro Zones** to catch order blocks forming inside timed macro windows.
- Match with **Smart Swing Levels** to confirm structure breaks before entry.
ICT SMC Liquidity Levels (Smart Swing Lows)
**Purpose:**
Automatically marks swing highs/lows based on user-defined lookbacks. Tracks whether those levels have been breached or respected.
**Best Used With:**
- Combine with **Turtle Soup** to detect if a swing level was swept, then reversed.
- Use with **Liquidity Grabs** to confirm a grab occurred at a meaningful structural point.
- Align with **Macro Zones** to understand when liquidity events occur within macro session timing.
ICT Turtle Soup (Liquidity Reversal)
**Purpose:**
Implements the classic ICT Turtle Soup model. Looks for swing failure and quick reversals after a liquidity sweep — ideal for catching traps.
Best Used With:
- Confirm with **Liquidity Grabs + OBs** to identify institutional activity at the reversal point.
- Use **Liquidity Levels** to ensure the reversal is happening at valid previous swing highs/lows.
- Amplify probability when pattern appears during **Macro Zones** or near the **First FVG**.
ICT Turtle Soup Ultimate V2
**Purpose:**
An enhanced, multi-layer version of the Turtle Soup setup that includes built-in liquidity checks, OTE levels, structure validation, and customizable visual output.
**Best Used With:**
- Use as an **entry signal generator** when other indicators (e.g., OBs, liquidity grabs) are aligned.
- Pair with **Macro Zones** for high-precision timing.
- Combine with **First FVG** to anticipate price rebalancing before explosive moves.
---
## 🧠 Workflow Example:
1. **Start with Macro Zones** to focus only on institutional trading windows.
2. Look for **Liquidity Grabs or Swing Sweeps** around key highs/lows.
3. Check for a **Turtle Soup Reversal** or **Order Block Reaction** near that level.
4. Confirm confluence with a **Fair Value Gap**.
5. Execute using the **OTE level** from the Liquidity Grabs + OB script.
---
Let me know which script you want to publish first — I’ll tailor its **individual TradingView description** and flag its ideal **“Best Used With” partners** to help users see the value in your ecosystem.

Gabriel's Adaptive MA📜 Gabriel's Adaptive MA — Indicator Description
Gabriel's Adaptive Moving Average (GAMA) is a dynamic trend-following indicator that intelligently adjusts its smoothing based on both trend strength and market volatility.
It is designed to provide faster responsiveness during strong moves while maintaining stability during choppy or consolidating periods.
🧠 What it does:
This indicator plots a custom-built, highly dynamic Moving Average that adapts itself intelligently based on:
Trend Strength (via Perry Kaufman's Efficiency Ratio)
Market Volatility (via Tushar Chande's Volatility Ratio)
It reacts faster when the market is trending strongly and/or highly volatile,
and it smooths out and slows down when the market is choppy or calm.
🔍 How it works (step-by-step):
1. User Inputs:
length: (default 14)
How many bars to look back for calculations.
fastSC: Fastest possible smoothing constant (hardcoded as 2 / (2+1))
slowSC: Slowest possible smoothing constant (hardcoded as 2 / (30+1))
(These are used to control how fast/slow the KAMA can react.)
2. Calculate Trendiness — Kaufman Efficiency Ratio (ER):
Net Change = Absolute difference between current close and close from length bars ago.
Sum of Absolute Changes = Sum of absolute price changes between every bar inside the length window.
Efficiency Ratio (ER) = Net Change divided by Sum of Changes.
✅ If ER is close to 1 → Smooth, trending market.
✅ If ER is close to 0 → Choppy, sideways market.
3. Calculate Bumpiness — Volatility Ratio (VR):
Short-Term Volatility = Standard deviation of close over length.
Long-Term Volatility = Standard deviation of close over length * 2.
Volatility Ratio (VR) = Short-Term Volatility divided by Long-Term Volatility.
✅ If VR is >1 → Market is becoming more volatile recently.
✅ If VR is <1 → Market is calming down.
4. Create the Hybrid Alpha:
Multiply ER × VR.
Then square the result (math.pow(..., 2)).
This hybrid alpha decides how aggressive the MA should be based on both trend and volatility.
If ER and VR are both strong → big alpha → fast movement.
If ER and/or VR are weak → small alpha → slow movement.
5. Calculate the Final Adaptive Smoothing Constant (hybridSC):
hybridSC = slowSC + hybridAlpha × (fastSC - slowSC)
This smoothly interpolates between the slowest and fastest smoothing depending on market conditions.
6. Calculate and Plot the Adaptive MA:
The moving average is manually calculated:
hybridMA := na(hybridMA ) ? close : hybridMA + hybridSC * (close - hybridMA )
It behaves like an EMA but with dynamic smoothing, not a fixed alpha.
✅ If hybridSC is high → MA hugs the price closely.
✅ If hybridSC is low → MA stays smooth and resists noise.
Finally, it plots this Adaptive MA on the chart in blue color.
📊 Visual Summary
Market Type What Happens to GAMA
Trending hard + volatile Follows price quickly
Trending hard + calm Follows steadily but carefully
Sideways + volatile Reacts carefully (won't chase noise)
Sideways + calm Smooths heavily (avoids fakeouts)
✨ Main Strengths:
Adapts automatically without you tuning settings manually every time market changes.
Responds smartly to both trend quality (ER) and market energy (VR).
Reduces lag during real moves.
Filters out false signals during choppy mess.
🧪 Key Innovation compared to normal MAs:
Traditional MA Gabriel's Adaptive MA
Same smoothing every bar Dynamic smoothing every bar
Slow during fast moves Adapts fast during real moves
No understanding of volatility or trendiness Full market sensitivity
⚡ **Simple One-Line Description:**
"Gabriel's Adaptive MA is a dynamic, trend-and-volatility-sensitive moving average that intelligently adjusts its speed to match market conditions."
Institutional Activity AnalysisThe Institutional Activity Analysis (IAA) indicator is a powerful tool designed to help traders identify potential institutional buying and selling activity in the market. By analyzing volume, price movement, and accumulation/distribution trends, this indicator provides insights into market dynamics that may signal significant activity.
This indicator is not a buy or sell recommendation but rather a tool to assist traders in understanding market behavior. It should be used in conjunction with other technical analysis tools and strategies for a comprehensive trading approach.
Key Features:
Smart Money Flow Index (SMFI):
1). Tracks the flow of "smart money" by analyzing price action relative to volume.
2). Helps identify whether institutional activity is bullish or bearish.
Accumulation/Distribution (Acc/Dist):
1). Measures buying and selling pressure in the market.
2). Indicates whether the market is in an accumulation (buying) or distribution (selling) phase.
Volume Spike Detection:
1. Identifies unusual volume spikes that may signal institutional activity.
2. Highlights these spikes with a yellow circle on the chart.
Significant Price Movement:
1. Detects strong price movements accompanied by high volume.
2. Marks these movements with a green triangle on the chart.
Customizable Dashboard:
1. Displays key metrics such as volume flow, smart money flow, accumulation/distribution, and volatility.
2. Includes visual signals for volume spikes and significant moves.
3. The dashboard can be positioned anywhere on the chart or turned off.
Heatmap for Activity Intensity:
1. Visualizes the intensity of market activity by combining volume and price volatility.
How to Read the Indicator:
Smart Money Flow (SMFI):
1. A positive SMFI value indicates bullish institutional activity.
2. A negative SMFI value suggests bearish institutional activity.
3. The blue line on the indicator represents the smoothed SMFI.
Accumulation/Distribution (Acc/Dist):
1. A positive slope indicates accumulation (buying pressure).
2. A negative slope indicates distribution (selling pressure).
3. The purple line on the indicator shows the smoothed Acc/Dist slope.
Volume Spikes:
1. Yellow circles on the chart indicate unusual volume spikes.
2. These spikes may signal institutional interest or significant market activity.
Significant Price Movements:
1. Green triangles on the chart highlight strong price movements with high volume.
2. These movements may indicate potential breakouts or reversals.
Dashboard:
The dashboard provides a quick summary of key metrics:
1. Volume Flow: Indicates whether volume is above or below the average.
2. Smart Money: Shows whether institutional activity is bullish or bearish.
3. Acc/Dist: Displays whether the market is in accumulation or distribution.
4. Volatility: Provides the current volatility level.
5. Signals: Highlights whether there are volume spikes or significant moves.
How to Use the Indicator:
Identify Institutional Activity:
1. Look for confluences between volume spikes, significant price movements, and the direction of the SMFI and Acc/Dist slope.
2. For example, a volume spike combined with a positive SMFI and accumulation may indicate bullish institutional activity.
Confirm Market Trends:
1. Use the indicator to confirm trends by analyzing the direction of the SMFI and Acc/Dist slope.
2. A rising SMFI and positive Acc/Dist slope suggest a strong uptrend, while the opposite indicates a downtrend.
Monitor Volatility:
1. High volatility combined with volume spikes may signal potential breakouts or reversals.
2. Use the volatility metric on the dashboard to gauge market conditions.
Set Alerts:
1. Use the built-in alert conditions to get notified of volume spikes and significant price movements.
2. Alerts can help you stay informed about potential market opportunities.
Important Notes:
1. This is not a buy or sell recommendation. The IAA indicator is a technical analysis tool designed to provide insights into market activity. Always use it in conjunction with other tools and strategies.
2. The indicator works best when combined with other forms of analysis, such as support/resistance levels, trendlines, and candlestick patterns.
3. Past performance is not indicative of future results. Always practice proper risk management and trade responsibly.
Customization:
The indicator includes several customizable settings:
1. Volume Spike Threshold: Adjust the sensitivity for detecting volume spikes.
2. Smoothing Period: Change the period for calculating SMFI and Acc/Dist.
3. Price Movement Threshold: Modify the sensitivity for detecting significant price movements.
4. Dashboard Position: Move the dashboard to any corner of the chart or turn it off.
5. Visual Settings: Customize the colors and transparency of the dashboard and signals.
Example Use Case:
Imagine you're analyzing a stock that has been consolidating for several days. Suddenly, the IAA indicator detects:
1. A volume spike (yellow circle),
2. A significant price movement (green triangle),
3. A positive SMFI (bullish smart money flow),
4. And an accumulation phase (positive Acc/Dist slope).
This confluence of signals may indicate that institutional buyers are entering the market, potentially leading to a breakout. You can then use this information to plan your trade, such as setting alerts or monitoring for confirmation from other indicators.
Disclaimer:
The Institutional Activity Analysis (IAA) indicator is for educational and informational purposes only. It is not financial advice or a recommendation to buy or sell any security. Always conduct your own research and consult with a financial advisor before making trading decisions. Use this tool responsibly and at your own risk.

Uptrick: Acceleration ShiftsIntroduction
Uptrick: Acceleration Shifts is designed to measure and visualize price momentum shifts by focusing on acceleration —the rate of change in velocity over time. It uses various moving average techniques as a trend filter, providing traders with a clearer perspective on market direction and potential trade entries or exits.
Purpose
The main goal of this indicator is to spot strong momentum changes (accelerations) and confirm them with a chosen trend filter. It attempts to distinguish genuine market moves from noise, helping traders make more informed decisions. The script can also trigger multiple entries (smart pyramiding) within the same trend, if desired.
Overview
By measuring how quickly price velocity changes (acceleration) and comparing it against a smoothed average of itself, this script generates buy or sell signals once the acceleration surpasses a given threshold. A trend filter is added for further validation. Users can choose from multiple smoothing methods and color schemes, and they can optionally enable a small table that displays real-time acceleration values.
Originality and Uniqueness
This script offers an acceleration-based approach, backed by several different moving average choices. The blend of acceleration thresholds, a trend filter, and an optional extra-entry (pyramiding) feature provides a flexible toolkit for various trading styles. The inclusion of multiple color themes and a slope-based coloring of the trend line adds clarity and user customization.
Inputs & Features
1. Acceleration Length (length)
This input determines the number of bars used when calculating velocity. Specifically, the script computes velocity by taking the difference in closing prices over length bars, and then calculates acceleration based on how that velocity changes over an additional length. The default is 14.
2. Trend Filter Length (smoothing)
This sets the lookback period for the chosen trend filter method. The default of 50 results in a moderately smooth trend line. A higher smoothing value will create a slower-moving trend filter.
3. Acceleration Threshold (threshold)
This multiplier determines when acceleration is considered strong enough to trigger a main buy or sell signal. A default value of 2.5 means the current acceleration must exceed 2.5 times the average acceleration before signaling.
4. Smart Pyramiding Strength (pyramidingThreshold)
This lower threshold is used for additional (pyramiding) entries once the main trend has already been identified. For instance, if set to 0.5, the script looks for acceleration crossing ±0.5 times its average acceleration to add extra positions.
5. Max Pyramiding Entries (maxPyramidingEntries)
This sets a limit on how many extra positions can be opened (beyond the first main signal) in a single directional trend. The default of 3 ensures traders do not become overexposed.
6. Show Acceleration Table (showTable)
When enabled, a small table displaying the current acceleration and its average is added to the top-right corner of the chart. This table helps monitor real-time momentum changes.
7. Smart Pyramiding (enablePyramiding)
This toggle decides whether additional entries (buy or sell) will be generated once a main signal is active. If enabled, these extra signals act as filtered entries, only firing when acceleration re-crosses a smaller threshold (pyramidingThreshold). These signals have a '+' next to their signal on the label.
8. Select Color Scheme (selectedColorScheme)
Allows choosing between various pre-coded color themes, such as Default, Emerald, Sapphire, Golden Blaze, Mystic, Monochrome, Pastel, Vibrant, Earth, or Neon. Each theme applies a distinct pair of colors for bullish and bearish conditions.
9. Trend Filter (TrendFilter)
Lets the user pick one of several moving average approaches to determine the prevailing trend. The options include:
Short Term (TEMA)
EWMA
Medium Term (HMA)
Classic (SMA)
Quick Reaction (DEMA)
Each method behaves differently, balancing reactivity and smoothness.
10. Slope Lookback (slopeOffset)
Used to measure the slope of the trend filter over a set number of bars (default is 10). This slope then influences the coloring of the trend filter line, indicating bullish or bearish tilt.
Note: The script refers to this as the "Massive Slope Index," but it effectively serves as a Trend Slope Calculation, measuring how the chosen trend filter changes over a specified period.
11. Alerts for Buy/Sell and Pyramiding Signals
The script includes built-in alert conditions that can be enabled or configured. These alerts trigger whenever the script detects a main Buy or Sell signal, as well as extra (pyramiding) signals if Smart Pyramiding is active. This feature allows traders to receive immediate notifications or automate a trading response.
Calculation Methodology
1. Velocity and Acceleration
Velocity is derived by subtracting the closing price from its value length bars ago. Acceleration is the difference in velocity over an additional length period. This highlights how quickly momentum is shifting.
2. Average Acceleration
The script smooths raw acceleration with a simple moving average (SMA) using the smoothing input. Comparing current acceleration against this average provides a threshold-based signal mechanism.
3. Trend Filter
Users can pick one of five moving average types to form a trend baseline. These range from quick-reacting methods (DEMA, TEMA) to smoother options (SMA, HMA, EWMA). The script checks whether the price is above or below this filter to confirm trend direction.
4. Buy/Sell Logic
A buy occurs when acceleration surpasses avgAcceleration * threshold and price closes above the trend filter. A sell occurs under the opposite conditions. An additional overbought/oversold check (based on a longer SMA) refines these signals further.
When price is considered oversold (i.e., close is below a longer-term SMA), a bullish acceleration signal has a higher likelihood of success because it indicates that the market is attempting to reverse from a lower price region. Conversely, when price is considered overbought (close is above this longer-term SMA), a bearish acceleration signal is more likely to be valid. This helps reduce false signals by waiting until the market is extended enough that a reversal or continuation has a stronger chance of following through.
5. Smart Pyramiding
Once a main buy or sell signal is triggered, additional (filtered) entries can be taken if acceleration crosses a smaller multiplier (pyramidingThreshold). This helps traders scale into strong moves. The script enforces a cap (maxPyramidingEntries) to limit risk.
6. Visual Elements
Candles can be recolored based on the active signal. Labels appear on the chart whenever a main or pyramiding entry signal is triggered. An optional table can show real-time acceleration values.
Color Schemes
The script includes a variety of predefined color themes. For bullish conditions, it might use turquoise or green, and for bearish conditions, magenta or red—depending on which color scheme the user selects. Each scheme aims to provide clear visual differentiation between bullish and bearish market states.
Why Each Indicator Was Part of This Component
Acceleration is employed to detect swift changes in momentum, capturing shifts that may not yet appear in more traditional measures. To further adapt to different trading styles and market conditions, several moving average methods are incorporated:
• TEMA (Triple Exponential Moving Average) is chosen for its ability to reduce lag more effectively than a standard EMA while still reacting swiftly to price changes. Its construction layers exponential smoothing in a way that can highlight sudden momentum shifts without sacrificing too much smoothness.
• DEMA (Double Exponential Moving Average) provides a faster response than a single EMA by using two layers of exponential smoothing. It is slightly less smoothed than TEMA but can alert traders to momentum changes earlier, though with a higher risk of noise in choppier markets.
• HMA (Hull Moving Average) is known for its balance of smoothness and reduced lag. Its weighted calculations help track trend direction clearly, making it useful for traders who want a smoother line that still reacts fairly quickly.
• SMA (Simple Moving Average) is the classic baseline for smoothing price data. It offers a clear, stable perspective on long-term trends, though it reacts more slowly than other methods. Its simplicity can be beneficial in lower-volatility or more stable market environments.
• EWMA (Exponentially Weighted Moving Average) provides a middle ground by emphasizing recent price data while still retaining some degree of smoothing. It typically responds faster than an SMA but is less aggressive than DEMA or TEMA.
Alongside these moving average techniques, the script employs a slope calculation (referred to as the “Massive Slope Index”) to visually indicate whether the chosen filter is sloping upward or downward. This adds an extra layer of clarity to directional analysis. The indicator also uses overbought/oversold checks, based on a longer-term SMA, to help filter out signals in overstretched markets—reducing the likelihood of false entries in conditions where the price is already extensively extended.
Additional Features
Alerts can be set up for both main signals and additional pyramiding signals, which is helpful for automated or semi-automated trading. The optional acceleration table offers quick reference values, making momentum monitoring more intuitive. Including explicit alert conditions for Buy/Sell and Pyramiding ensures traders can respond promptly to market movements or integrate these triggers into automated strategies.
Summary
This script serves as a comprehensive momentum-based trading framework, leveraging acceleration metrics and multiple moving average filters to identify potential shifts in market direction. By combining overbought/oversold checks with threshold-based triggers, it aims to reduce the noise that commonly plagues purely reactive indicators. The flexibility of Smart Pyramiding, customizable color schemes, and built-in alerts allows users to tailor their experience and respond swiftly to valid signals, potentially enhancing trading decisions across various market conditions.
Disclaimer
All trading involves significant risk, and users should apply their own judgment, risk management, and broader analysis before making investment decisions.

Celestial Pair Spread Hello friends, after a very long time!
Today, I tried to put into code an idea that came to my mind spontaneously and suddenly.
Note :
This script is experimental and improvable.
I haven't had a chance to try it yet.
TIMEFRAME : 1D (Daily Bars)
CELESTIAL SPREAD
The spread moves in a very limited area and is consistent within itself, especially on days far from the end of the contract.
That's why there is a reassuring sky atmosphere. That's why this name was given completely improvised.
Basic logic of the script
We enter the name of the CME Futures contract we want to enter:
Ex : CL1! , ES1! , ZC1! , NQ1!
The script creates us a pair trade parity divided into secondary contracts.
Example : ES1!/ES2!
What is pair trading?
I will explain briefly here.
For users who are wondering:
www.investopedia.com
Let's get back to our topic.
Now we have created a parity that does not actually exist.
This parity is the manifestation of the relative movements of two contracts.
When the parity rises, ES1! increased,ES2! has fallen.
In the opposite case, We can say: ES1! Contract has been dropped ES2! has increased.
Pair trading is generally a trade that needs to be kept in mind from time to time.
It is a method preferred by professionals who can process very quickly.
Market risk is minimal, but since 2 contracts are purchased, more money is paid and very low percentage profits are made.
It is very expensive to do pair trading, especially with oil and its derivatives and interest security derivatives.
The contract we are considering has micros. (small-item contracts tied to the same value)
So when we switch to our broker MES1!/MES2! We will trade.
For all CME futures :
www.cmegroup.com
Anyway, let's continue:
The script created the parity showing its relationship with the next contract and plotted it as bars.
Celestial bands are just like Bollinger bands, but they consist of 3 bands based on percentage changes rather than standard deviation.
The middle band is obtained from moving averages.
The upper and lower bands are the middle band subjected to a threshold value.
The threshold value can be changed.
0.15 percent was charged for this script.
CAUTION :
As can be seen in the example below;
The most important thing is not to make any transactions when the contract switch dates are approaching.
Therefore, it is recommended to use it just below the main chart.
The blue bars in the parity are
Values that outside the upper and lower threshold values are colored blue.
For this condition
Alerts has been added.
Don't forget to add alert and edit.
MAIN PURPOSE
It is aimed to start a pair trade when such conditions come and to quickly close the trades when the parity basis reaches the value.
OTHER IMPORTANT POINTS
Other issues are broker related issues.
Difference between initial margins and maintanence margins of contracts (between 1! and 2!)
It shouldn't be too high.
The commission should not be too high.
Leverage must be high because the profit percentage is very low.
To calculate leverage you must divide your contract size by the relevant margin requirement.
Sample margin requirement table:
www.interactivebrokers.com
RISKS
It is an experimental and intellectual script,
the risk of contract price differences (maybe it will not leave a profit except for very extreme values)
I remind you of the quickness risk that comes from a two-legged trade.
Alerts definitely synchronized with an audible alert sent to a smartphone as an e-mail notification and displayed on the locked screen for quick action.
Best regards!

MMXM ICT [TradingFinder] Market Maker Model PO3 CHoCH/CSID + FVG🔵 Introduction
The MMXM Smart Money Reversal leverages key metrics such as SMT Divergence, Liquidity Sweep, HTF PD Array, Market Structure Shift (MSS) or (ChoCh), CISD, and Fair Value Gap (FVG) to identify critical turning points in the market. Designed for traders aiming to analyze the behavior of major market participants, this setup pinpoints strategic areas for making informed trading decisions.
The document introduces the MMXM model, a trading strategy that identifies market maker activity to predict price movements. The model operates across five distinct stages: original consolidation, price run, smart money reversal, accumulation/distribution, and completion. This systematic approach allows traders to differentiate between buyside and sellside curves, offering a structured framework for interpreting price action.
Market makers play a pivotal role in facilitating these movements by bridging liquidity gaps. They continuously quote bid (buy) and ask (sell) prices for assets, ensuring smooth trading conditions.
By maintaining liquidity, market makers prevent scenarios where buyers are left without sellers and vice versa, making their activity a cornerstone of the MMXM strategy.
SMT Divergence serves as the first signal of a potential trend reversal, arising from discrepancies between the movements of related assets or indices. This divergence is detected when two or more highly correlated assets or indices move in opposite directions, signaling a likely shift in market trends.
Liquidity Sweep occurs when the market targets liquidity in specific zones through false price movements. This process allows major market participants to execute their orders efficiently by collecting the necessary liquidity to enter or exit positions.
The HTF PD Array refers to premium and discount zones on higher timeframes. These zones highlight price levels where the market is in a premium (ideal for selling) or discount (ideal for buying). These areas are identified based on higher timeframe market behavior and guide traders toward lucrative opportunities.
Market Structure Shift (MSS), also referred to as ChoCh, indicates a change in market structure, often marked by breaking key support or resistance levels. This shift confirms the directional movement of the market, signaling the start of a new trend.
CISD (Change in State of Delivery) reflects a transition in price delivery mechanisms. Typically occurring after MSS, CISD confirms the continuation of price movement in the new direction.
Fair Value Gap (FVG) represents zones where price imbalance exists between buyers and sellers. These gaps often act as price targets for filling, offering traders opportunities for entry or exit.
By combining all these metrics, the Smart Money Reversal provides a comprehensive tool for analyzing market behavior and identifying key trading opportunities. It enables traders to anticipate the actions of major players and align their strategies accordingly.
MMBM :
MMSM :
🔵 How to Use
The Smart Money Reversal operates in two primary states: MMBM (Market Maker Buy Model) and MMSM (Market Maker Sell Model). Each state highlights critical structural changes in market trends, focusing on liquidity behavior and price reactions at key levels to offer precise and effective trading opportunities.
The MMXM model expands on this by identifying five distinct stages of market behavior: original consolidation, price run, smart money reversal, accumulation/distribution, and completion. These stages provide traders with a detailed roadmap for interpreting price action and anticipating market maker activity.
🟣 Market Maker Buy Model
In the MMBM state, the market transitions from a bearish trend to a bullish trend. Initially, SMT Divergence between related assets or indices reveals weaknesses in the bearish trend. Subsequently, a Liquidity Sweep collects liquidity from lower levels through false breakouts.
After this, the price reacts to discount zones identified in the HTF PD Array, where major market participants often execute buy orders. The market confirms the bullish trend with a Market Structure Shift (MSS) and a change in price delivery state (CISD). During this phase, an FVG emerges as a key trading opportunity. Traders can open long positions upon a pullback to this FVG zone, capitalizing on the bullish continuation.
🟣 Market Maker Sell Model
In the MMSM state, the market shifts from a bullish trend to a bearish trend. Here, SMT Divergence highlights weaknesses in the bullish trend. A Liquidity Sweep then gathers liquidity from higher levels.
The price reacts to premium zones identified in the HTF PD Array, where major sellers enter the market and reverse the price direction. A Market Structure Shift (MSS) and a change in delivery state (CISD) confirm the bearish trend. The FVG then acts as a target for the price. Traders can initiate short positions upon a pullback to this FVG zone, profiting from the bearish continuation.
Market makers actively bridge liquidity gaps throughout these stages, quoting continuous bid and ask prices for assets. This ensures that trades are executed seamlessly, even during periods of low market participation, and supports the structured progression of the MMXM model.
The price’s reaction to FVG zones in both states provides traders with opportunities to reduce risk and enhance precision. These pullbacks to FVG zones not only represent optimal entry points but also create avenues for maximizing returns with minimal risk.
🔵 Settings
Higher TimeFrame PD Array : Selects the timeframe for identifying premium/discount arrays on higher timeframes.
PD Array Period : Specifies the number of candles for identifying key swing points.
ATR Coefficient Threshold : Defines the threshold for acceptable volatility based on ATR.
Max Swing Back Method : Choose between analyzing all swings ("All") or a fixed number ("Custom").
Max Swing Back : Sets the maximum number of candles to consider for swing analysis (if "Custom" is selected).
Second Symbol for SMT : Specifies the second asset or index for detecting SMT divergence.
SMT Fractal Periods : Sets the number of candles required to identify SMT fractals.
FVG Validity Period : Defines the validity duration for FVG zones.
MSS Validity Period : Sets the validity duration for MSS zones.
FVG Filter : Activates filtering for FVG zones based on width.
FVG Filter Type : Selects the filtering level from "Very Aggressive" to "Very Defensive."
Mitigation Level FVG : Determines the level within the FVG zone (proximal, 50%, or distal) that price reacts to.
Demand FVG : Enables the display of demand FVG zones.
Supply FVG : Enables the display of supply FVG zones.
Zone Colors : Allows customization of colors for demand and supply FVG zones.
Bottom Line & Label : Enables or disables the SMT divergence line and label from the bottom.
Top Line & Label : Enables or disables the SMT divergence line and label from the top.
Show All HTF Levels : Displays all premium/discount levels on higher timeframes.
High/Low Levels : Activates the display of high/low levels.
Color Options : Customizes the colors for high/low lines and labels.
Show All MSS Levels : Enables display of all MSS zones.
High/Low MSS Levels : Activates the display of high/low MSS levels.
Color Options : Customizes the colors for MSS lines and labels.
🔵 Conclusion
The Smart Money Reversal model represents one of the most advanced tools for technical analysis, enabling traders to identify critical market turning points. By leveraging metrics such as SMT Divergence, Liquidity Sweep, HTF PD Array, MSS, CISD, and FVG, traders can predict future price movements with precision.
The price’s interaction with key zones such as PD Array and FVG, combined with pullbacks to imbalance areas, offers exceptional opportunities with favorable risk-to-reward ratios. This approach empowers traders to analyze the behavior of major market participants and adopt professional strategies for entry and exit.
By employing this analytical framework, traders can reduce errors, make more informed decisions, and capitalize on profitable opportunities. The Smart Money Reversal focuses on liquidity behavior and structural changes, making it an indispensable tool for financial market success.

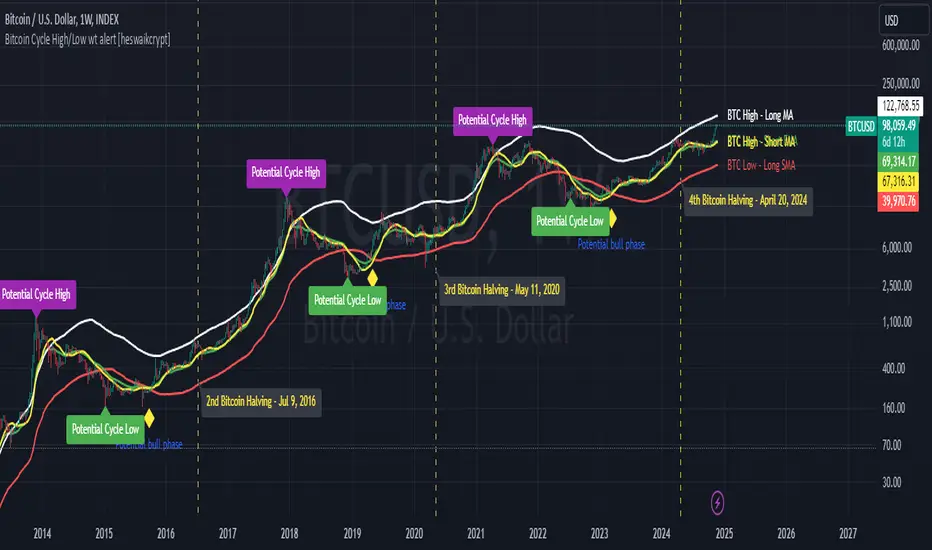
Bitcoin Cycle High/Low with functional Alert [heswaikcrypt]Introduction
Just as machines are fine-tuned for maximum efficiency, trading indicators must evolve to meet the demands of ever-changing markets.
Credit goes to the initial author, @NoCreditsLeft I only improved the existing Pi-cycle indicator with a functional alert and included a bull mode indicator in the script. The alert can help you get a live alert at candle close when the cycle tops, bottoms, and the potential bull phase switch occurs.
Philip Swift’s Pi Cycle Top Indicator is a brilliant example of leveraging mathematical relationships to signal critical turning points in Bitcoin’s price cycles. Historically, it has identified market and local tops with some relative accuracy, often within three days, as demonstrated in all the previous bull run cycles.
At its core, the Pi Cycle Indicator derives its name from the mathematical constant π (pi), achieved by using simple moving averages (MAs) in a specific ratio: 𝜋 = Long MA/short MA
The Bull mode switch is calculated using a crossover of the short exponentia moving average and the long moving average.
.
.
.
Knowing when Bitcoin reaches its top—and receiving timely alerts about it—is crucial for successful trading. The indicator is designed to signal;
Potential Bitcoin tops: Purple label
Potential Bitcoin bottoms : green Label, and
Parabolic swing : Yellow diamond shape (relating to the market switching to a potential bull mode)
"Please note: This indicator is tailored for Bitcoin using historical data analysis and should not be considered definitive. However accurate it might be."
Setting alerts
To set the alert conditions, select any alert function call to get alert whenever the conditions are met. The script is configured on dialy TF; you can set it on 1D or weekly TF.
Enjoy and Trade smartly
ICT Power Of Three | Flux Charts💎 GENERAL OVERVIEW
Introducing our new ICT Power Of Three Indicator! This indicator is built around the ICT's "Power Of Three" strategy. This strategy makes use of these 3 key smart money concepts : Accumulation, Manipulation and Distribution. Each step is explained in detail within this write-up. For more information about the process, check the "HOW DOES IT WORK" section.
Features of the new ICT Power Of Three Indicator :
Implementation of ICT's Power Of Three Strategy
Different Algorithm Modes
Customizable Execution Settings
Customizable Backtesting Dashboard
Alerts for Buy, Sell, TP & SL Signals
📌 HOW DOES IT WORK ?
The "Power Of Three" comes from these three keywords "Accumulation, Manipulation and Distribution". Here is a brief explanation of each keyword :
Accumulation -> Accumulation phase is when the smart money accumulate their positions in a fixed range. This phase indicates price stability, generally meaning that the price constantly switches between up & down trend between a low and a high pivot point. When the indicator detects an accumulation zone, the Power Of Three strategy begins.
Manipulation -> When the smart money needs to increase their position sizes, they need retail traders' positions for liquidity. So, they manipulate the market into the opposite direction of their intended direction. This will result in retail traders opening positions the way that the smart money intended them to do, creating liquidity. After this step, the real move that the smart money intended begins.
Distribution -> This is when the real intention of the smart money comes into action. With the new liquidity thanks to the manipulation phase, the smart money add their positions towards the opposite direction of the retail mindset. The purpose of this indicator is to detect the accumulation and manipulation phases, and help the trader move towards the same direction as the smart money for their trades.
Detection Methods Of The Indicator :
Accumulation -> The indicator detects accumulation zones as explained step-by-step :
1. Draw two lines from the lowest point and the highest point of the latest X bars.
2. If the (high line - low line) is lower than Average True Range (ATR) * accumulationConstant
3. After the condition is validated, an accumulation zone is detected. The accumulation zone will be invalidated and manipulation phase will begin when the range is broken.
Manipulation -> If the accumulation range is broken, check if the current bar closes / wicks above the (high line + ATR * manipulationConstant) or below the (low line - ATR * manipulationConstant). If the condition is met, the indicator detects a manipulation zone.
Distribution -> The purpose of this indicator is to try to foresee the distribution zone, so instead of a detection, after the manipulation zone is detected the indicator automatically create a "shadow" distribution zone towards the opposite direction of the freshly detected manipulation zone. This shadow distribution zone comes with a take-profit and stop-loss layout, customizable by the trader in the settings.
The X bars, accumulationConstant and manipulationConstant are subject to change with the "Algorithm Mode" setting. Read the "Settings" section for more information.
This indicator follows these steps and inform you step by step by plotting them in your chart.
🚩UNIQUENESS
This indicator is an all-in-one suite for the ICT's Power Of Three concept. It's capable of plotting the strategy, giving signals, a backtesting dashboard and alerts feature. Different and customizable algorithm modes will help the trader fine-tune the indicator for the asset they are currently trading. The backtesting dashboard allows you to see how your settings perform in the current ticker. You can also set up alerts to get informed when the strategy is executable for different tickers.
⚙️SETTINGS
1. General Configuration
Algorithm Mode -> The indicator offers 3 different detection algorithm modes according to your needs. Here is the explanation of each mode.
a) Small Manipulation
This mode has the default bar length for the accumulation detection, but a lower manipulation constant, meaning that slighter imbalances in the price action can be detected as manipulation. This setting can be useful on tickers that have lower liquidity, thus can be manipulated easier.
b) Big Manipulation
This mode has the default bar length for the accumulation detection, but a higher manipulation constant, meaning that heavier imbalances on the price action are required in order to detect manipulation zones. This setting can be useful on tickers that have higher liquidity, thus can be manipulated harder.
c) Short Accumulation
This mode has a ~70% lower bar length requirement for accumulation zone detection, and the default manipulation constant. This setting can be useful on tickers that are highly volatile and do not enter accumulation phases too often.
Breakout Method -> If "Close" is selected, bar close price will be taken into calculation when Accumulation & Manipulation zone invalidation. If "Wick" is selected, a wick will be enough to validate the corresponding zone.
2. TP / SL
TP / SL Method -> If "Fixed" is selected, you can adjust the TP / SL ratios from the settings below. If "Dynamic" is selected, the TP / SL zones will be auto-determined by the algorithm.
Risk -> The risk you're willing to take if "Dynamic" TP / SL Method is selected. Higher risk usually means a better winrate at the cost of losing more if the strategy fails. This setting is has a crucial effect on the performance of the indicator, as different tickers may have different volatility so the indicator may have increased performance when this setting is correctly adjusted.
3. Visuals
Show Zones -> Enables / Disables rendering of Accumulation (yellow) and Manipulation (red) zones.

Liquidity-Finder ICT / SMCIn the context of ICT and the Smart Money Concept, liquidity is likely viewed as a crucial factor for determining the strength and sustainability of a market move. Smart Money is often associated with large institutional traders who have the ability to influence liquidity.
Liquidity Sweep:
A liquidity sweep in this context might involve Smart Money intentionally executing trades across various price levels to assess market depth and liquidity. This information can be used to identify potential areas of interest for Smart Money to initiate or exit positions without causing significant price disruptions.
Stop Hunt:
Stop hunting is a concept that Smart Money traders may employ to deliberately trigger stop orders in the market. By doing so, they can create temporary price movements that allow them to accumulate or liquidate positions at more favorable prices before the market reacts.
Smart Money Concept (SMC):
The Smart Money Concept revolves around the idea that large institutional traders (Smart Money) have superior information and resources compared to retail traders. Understanding the behavior of Smart Money, as taught in ICT and SMC, involves analyzing market dynamics, order flow, and liquidity to make more informed trading decisions.
Liquidating:
Liquidating refers to the process of selling or closing out existing positions. In the context of Smart Money, the term could imply that institutional traders are actively managing their positions, either taking profits or cutting losses strategically based on their analysis of market conditions.
The Indicator
The Indicator show open liquidity as solid lines and liquidates liquidity as dashed lines
Is able to send alerts for liquidity level was liquidated, liquidity level was dipped or the next close is on the other side
ATR VisualizerAdvance Your Market Analysis with the True Range Indicator
The True Range Indicator is a sophisticated screener meticulously developed to bolster your trading execution by presenting an exceptional understanding of the market direction. The centerpiece of this instrument is a distinctive candle configuration depicting the Average True Range (ATR) and the Bear/Bull range. However, it traverses beyond the conventional channels to offer specific market settings to boost your trading decisions.
User-Defined Settings
Broadly, the indicator offers five dynamic settings:
Bear/Bull Range
The Bear/Bull Range outlines the ATR for each candle type - bearish and bullish - and then smartly opts for the pertinent one based on the prevalent market circumstances. This feature aids in comparing the range of bullish and bearish candlesticks, which deepens your understanding of the price action and volatility.
Bearish Range
The Bearish Range isolates and computes the ATR for bearish candles solely. Utilizing this option spots the bear-dominated periods and provides insights about potential market reversals or downward continuations.
Bullish Range
Opposite to the Bearish Range, the Bullish Range setting tabulates the ATR exclusively for bullish candles. It assists in tracking the periods when bulls control, enlightening traders about the possibility of upward continuations or trend reversals.
Average Range
The Average Range provides an unbiased measure of range without prioritizing either bull or bear trends. This model is ideal for traders looking for a holistic interpretation of market behavior, regardless of direction.
Cumulative Average Range
Equally significant is the Cumulative Average Range which calculates the aggregate moving average of the true ranges for an expressed period. This setting is extremely valuable when evaluating the long-term volatility and spotting potential breakouts.
Dual Candle Configuration
Going a step ahead, the True Range Indicator uniquely offers the possibility to incorporate more than one candle estimate on your screen. This ensures simultaneous analysis of multiple market dynamics, thereby enhancing your trading precision multifold.
Concluding Thoughts
In essence, the True Range Indicator is an indispensable companion for traders looking to not only leverage market volatility but also make educated predictions. Equipped with an array of insightful market settings and the ability to display dual candle estimates on-screen, you can customize the functionality to suit your unique trading style and magnify your market performance dramatically.

OSPL Volume [Community Edition]NSE:BANKNIFTY1!
This indicator is based on the concepts popularized by @OptionsScalper123 "Siva" of OiPulse. His ideology Is that large moves come after high volume candles. For Nifty, high volume is considered to be a candle above 125k volume and for BankNifty it’s 50k.
This indicator allows you to cut the noise and focus only on the high volume candle. It shows high volume candle in a brighter shade and lower volume candles in a less visible shade.
You can set the minimum volume threshold limit for Nifty and BankNifty. The indicator smartly recognizes which index you are using it in and uses the respective threshold volume limit.
All colors are customizable.
Thanks for Siva for all the ideas and wonderful products he has given to the community
Thanks to all the wonderful Pinescipters for developing awesome indicators and keeping the source open.
The source code of this indicator is just a few lines. Hope you can use it in your projects and learn something from this just how I learned from other scripts.
Any changes or updates needed in this indicator, please suggest. I was thinking some kind of alerts can be added when volume crosses the threshold. Let me know.
Boost/like this indicator and comment if you find this useful. Cheers and happy trading!!!

Price alertThis indicator is an indicator for setting alerts.
Set alerts after adding them to the chart.
By setting an alert, you can notify the closing price to your smartphone or smartwatch.

RS Score (1-100) vs NQ/ES/YM - TP# RS Score (1–100) vs NQ/ES/YM — How to Use & Interpret
## What this indicator is doing
It gives you a **single score from 1 to 100** that tells you whether a stock is acting like a **leader** or a **laggard** compared to the **overall U.S. market** (Nasdaq + S&P + Dow), using about **1 year of data**.
---
## The core idea: “Is this stock beating the market?”
This script compares your stock to a blended benchmark of:
* **Nasdaq futures (NQ)**
* **S&P futures (ES)**
* **Dow futures (YM)**
### Why that matters
A stock can be going up, but if the market is going up faster, the stock is **not a leader**.
This tool answers:
* “Is this stock outperforming the big market?”
* “Is it doing it consistently, or is it just wild and noisy?”
---
## What the 1–100 score means
Think of **50** as the “middle line.”
### The most important rule
* **Above 50 = outperforming the market blend**
* **Below 50 = underperforming**
* **Around 50 = roughly market-like**
### Easy interpretation bands
* **80–100 (Strong Leader):** stock is outperforming the market clearly and consistently
* **60–80 (Healthy):** generally outperforming, decent leadership
* **45–60 (Neutral-ish):** not special, close to market performance
* **30–45 (Weak):** lagging the market
* **1–30 (Very Weak):** strong underperformance
**Think “leaders live above 50,” and “real leaders tend to stay 70+.”**
---
## Why this score is “smarter” than just comparing returns
This script doesn’t just ask *“did it outperform?”*
It also asks *“did it outperform in a clean, steady way?”*
So it penalizes:
* choppy, unstable performance
* “one lucky spike” moves
That’s why it’s great for finding **higher-quality leadership**.
---
## Timeframe consistency: why it works on Daily, Weekly, Monthly
You added **Lock to last completed Daily bar**.
That means:
* it uses the **same daily reference point** no matter what chart timeframe you switch to
* your RS score won’t “walk around” just because the current day/week/month is still forming
**Practical meaning:**
If your score says 72, it should be 72 whether you’re looking at Daily, Weekly, or Monthly (as of the last completed day).
---
## The “RS New High” marker (NH) — what it’s telling you
The marker shows when your RS score hits a **new high** over your chosen lookback period (default ~252 trading days).
### In plain terms:
> “This stock is now showing its strongest relative performance vs the market (in about a year).”
### Why it’s powerful
A lot of the best leaders:
* show RS new highs **before** price breaks out
* or show RS new highs **during** breakouts
**So NH is a “leadership confirmation” signal.**
### How to use NH in real life
* **Best case:** RS hits a new high **while price is near breakout levels**
→ this often means institutions are accumulating and the stock is acting like a leader
* **Okay case:** price makes new highs but RS does not
→ stock is rising, but it’s not leading (could still work, but less attractive)
---
## Divergences: when RS and price disagree
This is one of the most useful ways to use RS.
### Bearish divergence (warning)
**Price makes a higher high, but RS makes a lower high.**
In simple terms:
> “The stock is still going up, but it’s losing leadership versus the market.”
This often shows up before:
* pullbacks
* breakout failures
* trend weakening
* rotation into stronger names
**It’s a caution sign, not an automatic sell.**
### Bullish divergence (early strength)
**Price makes a lower low, but RS makes a higher low.**
In simple terms:
> “The stock is holding up better than the market — strength is building underneath.”
This can happen before:
* reversals
* strong bounce setups
* early leadership emergence
---
## How to use this indicator in a simple trading workflow
### 1) Screening (finding leaders)
When scanning charts:
* Prefer stocks **above 50**
* Strong candidates are typically **70+**
* Bonus points if you see **NH markers** recently
**Quick rule:**
If RS < 50, it’s usually not worth your time unless you’re hunting deep value turnarounds.
---
### 2) Breakouts (confirming quality)
When a stock is near a breakout point:
* You want RS to be **rising**
* Ideally RS is near highs or prints **NH**
If price breaks out but RS is weak:
* it’s more likely to be a “meh breakout”
* sometimes it works, but it’s less “leader-like”
---
### 3) Managing positions (leadership health check)
If you’re already holding:
* RS staying high and rising = healthy leadership
* RS rolling over while price still rises = **possible early warning**
* RS plunging under 50 = the stock is now **lagging the market** (big red flag)
---
## Common “mistakes” and how to avoid them
### Mistake 1: Thinking RS > 50 means “guaranteed winner”
No — it means it’s acting **stronger than the market**, but price action still matters.
Use it with:
* trend structure
* volume/accumulation
* breakout levels
### Mistake 2: Overreacting to one divergence
One divergence is a warning.
You want confirmation like:
* failed breakout
* heavy sell volume
* loss of key moving averages
* repeated RS lower highs
### Mistake 3: Comparing RS values across totally different markets without context
RS works best when:
* comparing stocks within the same broad market environment
* keeping the same benchmark blend and same lookback
---
## Simple cheat sheet
* **RS > 50:** outperforming market (good)
* **RS 70–100:** leader zone
* **NH marker:** strongest relative strength in lookback window (leadership confirmation)
* **Price HH + RS LH:** bearish divergence (leadership weakening)
* **Price LL + RS HL:** bullish divergence (strength building)
Thank you!

RSI Divergence Indicator (Multi-Time Frame Confirmation)This custom-built RSI indicator blends traditional divergence detection with multi-timeframe trend confirmation, offering traders a smarter way to spot meaningful momentum shifts.

EEQI [Environment Quality Index] PyraTime The Problem: Why Good Strategies Fail
The number one reason traders lose capital is not a lack of strategy—it is forced execution in poor environments.
Most indicators (RSI, MACD, Stochastic) are continuously active, generating signals even when the market is dead, choppy, or chaotic. A breakout strategy that prints money in a trend will destroy your account in a consolidation range. A mean-reversion system that works in chop will fail during a parabolic expansion.
The Solution: PyraTime EEQI The Execution Environment Quality Index (EEQI) is a "Gatekeeper" layer for your trading. It does not tell you what to buy or sell; it tells you if you should be trading at all.
By aggregating Volatility, Price Structure, and Efficiency into a single composite score, the EEQI answers the most critical question in discretionary trading: "Is the market efficient enough to deploy capital right now?"
How It Works: The 3 Core Engines
The EEQI calculates a raw "Environment Score" (from -2 to +4) by analyzing three distinct dimensions of price action.
1. Volatility Engine (Usability)
The Logic: Measures the "Alive-ness" of the market using ATR Percentiles.
The Filter: It detects "Dead Zones" (where price is too flat to hit targets) and "Chaos Zones" (where volatility is too dangerous).
Smart Feature (Parabolic Override): If price moves significantly (>2x ATR) in a single candle, the engine recognizes this as "High Momentum" rather than chaos, unlocking Green signals during breakouts.
2. Structure Engine (Bar Quality)
The Logic: Analyzes the relationship between candle bodies, wicks, and overlap.
The Filter: It penalizes "Barbed Wire" price action—candles with long wicks and high overlap—which indicate indecision and algo-chop.
The Goal: We want to trade during "Clean Flow," where candle bodies are large and overlap is low.
3. Efficiency Engine (Directional Flow)
The Logic: Compares Net Displacement (start-to-finish distance) vs. Total Distance Traveled.
The Filter: Identifies "Whipsaw" conditions where price moves a lot but goes nowhere.
Smart Feature (Velocity Lock): If price travels a massive distance quickly, the efficiency requirement is relaxed to catch explosive moves that might otherwise look "messy."
The "Smart Gatekeepers"
Even if the Core Engines look good, the EEQI applies three final safety checks before granting a PRIME status.
Regime Persistence (Stability Check): The market must hold a high score for a set number of bars (default: 1) before the signal turns Green. This prevents "fake-outs" where a single anomaly candle tricks you into entering a bad trend.
Volume Validation (Liquidity Check): Price movement without participation is a trap. The EEQI checks Relative Volume (RVOL). If volume is below average (e.g., lunch hour, holidays, or late-night sessions), the score is capped at "Fair" or "Low Vol," preventing execution in thin liquidity.
Macro Context (HTF Filter): You cannot trade against the higher timeframe. The EEQI checks the trend and volatility of the Higher Timeframe (default: Weekly). If the macro view is compressed or dead, the local signal is vetoed.
How to Read the HUD
The Dashboard (Bottom Right) gives you an instant read on the market state.
🟢 PRIME (+4): Execution Optimal. The market is trending, efficient, and backed by volume. This is the "Green Light" for your strategy.
🔵 FAIR (+1 to +3): Tradeable. Conditions are decent, but one factor (e.g., volume or structure) is imperfect. Exercise caution.
⚪ NEUTRAL (0): Indecision. The market is transitioning. Stand aside.
🟡 BUILDING: Wait. The market is good, but hasn't proven itself yet (Persistence Check).
🟠 POOR / LOW VOL: Chop. Price is messy or lacking participation.
🔴 AVOID (-2): Danger Zone. The market is either dead flat or violently chaotic. Do not trade.
Settings & Customization
The indicator comes with calibrated presets for different asset classes:
Crypto: Tolerates higher volatility and requires stronger efficiency confirmation.
Forex: Stricter dead-zone filters to handle ranging sessions.
Indices: Balanced settings for standard equity hours.
Disclaimer
This tool is designed for environment analysis only. It does not provide buy or sell signals, entry prices, or stop-losses. It is intended to be used as a filter to improve the performance of your own discretionary strategies.

Gold Inverse Correlation TrackerGold Inverse Correlation Tracker - Professional Multi-Asset Analysis
What This Indicator Does:
This indicator monitors the real-time correlation between Gold and five key financial assets that historically move inversely (opposite) to gold prices. It displays these relationships across three different timeframes simultaneously, giving you both short-term trading signals and long-term trend confirmation.
The indicator tracks:
US Dollar Index (DXY) - Historical correlation: -0.63
Real Interest Rates (TIPS) - Historical correlation: -0.82 (strongest inverse relationship)
10-Year Treasury Yield - Nominal interest rate proxy
S&P 500 (SPX) - Equity market sentiment (variable correlation)
VIX - Volatility index (optional, flight-to-safety indicator)
Why Inverse Correlations Matter for Gold Trading:
Understanding inverse correlations is critical for gold traders because:
Predictive Power - When assets move opposite to gold consistently, you can use their strength/weakness to predict gold's next move
Hedging Opportunities - Strong inverse correlations let you hedge gold positions by trading the inverse asset
Regime Detection - When correlations break down, it signals a market regime change or increased uncertainty
Confirmation Signals - Multiple strong inverse correlations validate your gold trade thesis
Risk Management - Knowing what moves against gold helps you understand your portfolio's true exposure
The Science Behind the Numbers:
Real interest rates have the strongest inverse correlation to gold (approximately -0.82) because:
Gold pays no yield or dividend
When real rates rise, the opportunity cost of holding gold increases
Investors shift to interest-bearing assets when they offer positive real returns
When real rates go negative, gold becomes relatively more attractive
The US Dollar shows strong inverse correlation (approximately -0.63) because:
Gold is priced in US dollars globally
A stronger dollar makes gold more expensive for foreign buyers, reducing demand
A weaker dollar makes gold cheaper internationally, increasing demand
Both compete as reserve assets and stores of value
Why the Indicator is Weighted This Way:
Three Timeframe Approach:
Short-term (20 periods) - Captures recent correlation shifts for day trading and swing trading
Medium-term (50 periods) - The primary signal - balances noise reduction with responsiveness
Long-term (100 periods) - Confirms structural correlation trends for position trading
Correlation Thresholds:
Strong Inverse (<-0.7) - Statistically significant inverse relationship; highest confidence for inverse trades
Moderate Inverse (<-0.3) - Meaningful inverse relationship; still useful but less reliable
Weak Inverse (<0.0) - Slight inverse tendency; correlation may be breaking down
Positive (>0.0) - Assets moving together; inverse relationship has failed
How to Use This Indicator:
For Inverse Trading Strategies:
When DXY shows RED correlation (<-0.7), consider shorting DXY when gold is strong
When Real Rates show RED correlation, rising rates = falling gold (and vice versa)
When multiple assets show strong inverse correlation, confidence is highest
For Regime Detection:
All RED = Classic gold market behavior; correlations intact
Mixed colors = Transitional market; be cautious
All GREEN/GRAY = Correlation breakdown; paradigm shift occurring
For Hedging:
Use assets with strong inverse correlation to hedge gold positions
When correlation weakens, reduce hedge size
When correlation strengthens, increase hedge effectiveness
Alert System:
The indicator includes built-in alerts for:
Individual assets crossing strong inverse threshold
Multiple assets simultaneously showing strong inverse correlation (highest probability setup)
Correlation breakdowns that may signal regime changes
Color Guide:
RED - Strong inverse correlation (<-0.7) - Best inverse trading opportunity
ORANGE - Moderate inverse (<-0.3) - Useful but less reliable
YELLOW - Weak inverse (<0.0) - Correlation weakening
GRAY - Weak positive (0.0 to 0.7) - Assets moving together
GREEN - Strong positive (>0.7) - Inverse relationship broken
Recommended Settings:
Day Trading (1H-4H charts):
Short: 14 periods
Medium: 30 periods
Long: 60 periods
Swing Trading (Daily charts):
Short: 20 periods (default)
Medium: 50 periods (default)
Long: 100 periods (default)
Position Trading (Weekly charts):
Short: 10 periods
Medium: 20 periods
Long: 50 periods
Pro Tips:
Watch for divergences - when gold moves but correlations don't confirm
Correlation breakdowns often precede major trend reversals
The Medium-term (50p) correlation is plotted on the chart as your primary reference
Use the Status column for quick assessment of each asset's relationship
Set alerts for "Multiple Strong Inverse" to catch highest-probability setups
Important Notes:
This indicator is designed for Gold charts only (XAUUSD, GLD, GC1!, etc.)
Correlations are not static - they change over time based on market conditions
A correlation of -0.82 means 82% of gold's price movements can be explained by real interest rates
Always combine with other technical analysis and fundamental factors
Past correlations do not guarantee future relationships
Based on Research:
The correlation coefficients used in this indicator are based on peer-reviewed research:
Erb & Harvey (1997-2012): Real rates to gold correlation of -0.82
World Gold Council (2024): US Dollar to gold correlation of -0.63
Multiple academic studies confirming gold's inverse relationship with opportunity cost assets
Use this indicator to trade smarter, hedge better, and understand the macro forces driving gold prices.

Penny Stock Short Signal Pro# Penny Stock Short Signal Pro (PSSP) v1.0
## Complete User Guide & Documentation
---
# 📋 TABLE OF CONTENTS
1. (#introduction)
2. (#why-short-penny-stocks)
3. (#the-7-core-detection-systems)
4. (#installation--setup)
5. (#understanding-the-dashboard)
6. (#input-settings-deep-dive)
7. (#visual-elements-explained)
8. (#alert-configuration)
9. (#trading-strategies)
10. (#risk-management)
11. (#best-practices)
12. (#troubleshooting)
13. (#changelog)
---
# Introduction
**Penny Stock Short Signal Pro (PSSP)** is a comprehensive Pine Script v6 indicator specifically engineered for identifying high-probability short-selling opportunities on low-priced, high-volatility stocks. Unlike generic indicators that apply broad technical analysis, PSSP is purpose-built for the unique characteristics of penny stock price action—where parabolic moves, retail FOMO, and violent reversals create predictable patterns for prepared traders.
## Key Features
- **7 Independent Detection Systems** working in concert to identify exhaustion points
- **Composite Signal Engine** that requires multiple confirmations before triggering
- **Real-Time Dashboard** displaying all signal states and market metrics
- **Automatic Risk Management** with dynamic stop-loss and profit target calculations
- **Customizable Sensitivity** for different trading styles (scalping vs. swing)
- **Built-in Alert System** for all major signal types
## Who Is This For?
- **Active Day Traders** looking to capitalize on intraday reversals
- **Short Sellers** who specialize in penny stocks and small caps
- **Momentum Traders** who want to identify when momentum is exhausting
- **Risk-Conscious Traders** who need clear entry/exit levels
---
# Why Short Penny Stocks?
## The Penny Stock Lifecycle
Penny stocks follow a remarkably predictable lifecycle that creates shorting opportunities:
```
PHASE 1: ACCUMULATION
└── Low volume, tight range
└── Smart money quietly building positions
PHASE 2: MARKUP / PROMOTION
└── News catalyst or promotional campaign
└── Volume increases, price begins rising
└── Early momentum traders enter
PHASE 3: DISTRIBUTION (YOUR OPPORTUNITY)
└── Parabolic move attracts retail FOMO buyers
└── Smart money selling into strength
└── Volume climax signals exhaustion
└── ⚠️ PSSP SIGNALS FIRE HERE ⚠️
PHASE 4: DECLINE
└── Support breaks, panic selling
└── Price returns toward origin
└── Short sellers profit
```
## Why Shorts Work on Penny Stocks
1. **No Fundamental Support**: Most penny stocks have no earnings, revenue, or assets to justify elevated prices
2. **Promotional Nature**: Many rallies are driven by promoters who will eventually stop
3. **Retail Exhaustion**: Retail buying power is finite—when it's exhausted, gravity takes over
4. **Float Dynamics**: Low float stocks move fast in both directions
5. **Technical Levels Matter**: VWAP, round numbers, and prior highs become self-fulfilling resistance
---
# The 7 Core Detection Systems
PSSP employs seven independent detection algorithms. Each identifies a specific type of exhaustion or reversal signal. When multiple systems fire simultaneously, the probability of a successful short dramatically increases.
---
## 1. PARABOLIC EXHAUSTION DETECTOR
### What It Detects
Identifies when price has moved too far, too fast and is likely to reverse. This system looks for the classic "blow-off top" pattern common in penny stock runners.
### Technical Logic
```
Parabolic Signal = TRUE when:
├── Consecutive green candles ≥ threshold (default: 3)
├── AND price extension from VWAP ≥ threshold ATRs (default: 1.5)
└── OR shooting star / upper wick rejection pattern forms
```
### Visual Representation
```
╱╲ ← Shooting star / upper wick
╱ ╲ (Parabolic exhaustion)
╱
╱
╱
══════════════ VWAP
╱
╱
```
### Why It Works on Penny Stocks
Penny stocks are notorious for parabolic moves driven by retail FOMO. When everyone who wants to buy has bought, there's no one left to push prices higher. The shooting star pattern shows that sellers are already stepping in at higher prices.
### Key Settings
| Parameter | Default | Range | Description |
|-----------|---------|-------|-------------|
| Lookback Period | 10 | 3-30 | Bars to analyze for pattern |
| Extension Threshold | 1.5 ATR | 0.5-5.0 | How far above VWAP is "parabolic" |
| Consecutive Green Bars | 3 | 2-10 | Minimum green bars for exhaustion |
---
## 2. VWAP REJECTION SYSTEM
### What It Detects
Volume Weighted Average Price (VWAP) is the single most important level for institutional traders. This system identifies when price tests above VWAP and gets rejected back below—a powerful short signal.
### Technical Logic
```
VWAP Rejection = TRUE when:
├── Candle high pierces above VWAP
├── AND candle closes below VWAP
├── AND candle is bearish (close < open)
└── AND rejection distance is within sensitivity threshold
```
### Visual Representation
```
High ──→ ╱╲
╱ ╲
VWAP ════════╱════╲═══════════
Close ←── Rejection
```
### Extended VWAP Signals
The system also tracks VWAP standard deviation bands. Rejection from the upper band (2 standard deviations above VWAP) is an even stronger signal.
### Why It Works on Penny Stocks
- Algorithms and institutions use VWAP as their benchmark
- Failed attempts to reclaim VWAP often lead to waterfall selling
- VWAP acts as a "magnet" that price tends to revert toward
### Key Settings
| Parameter | Default | Range | Description |
|-----------|---------|-------|-------------|
| Rejection Sensitivity | 0.5 ATR | 0.1-2.0 | How close to VWAP for valid rejection |
| Show VWAP Line | True | - | Display VWAP on chart |
| Show VWAP Bands | True | - | Display standard deviation bands |
| Band Multiplier | 2.0 | 0.5-4.0 | Standard deviations for bands |
---
## 3. VOLUME CLIMAX DETECTOR
### What It Detects
Identifies "blow-off tops" where extreme volume accompanies a price spike. This often marks the exact top as it represents maximum retail participation—after which buying power is exhausted.
### Technical Logic
```
Volume Climax = TRUE when:
├── Current volume ≥ (Average volume × Climax Multiple)
├── AND one of:
│ ├── Selling into the high (upper wick > lower wick on green bar)
│ └── OR post-climax weakness (red bar following climax bar)
```
### Visual Representation
```
Price: ╱╲
╱ ╲
╱ ╲
╱ ╲
╱
Volume:
▂▃▅▇██▇▅▃▂▁
↑
Volume Climax (3x+ average)
```
### Why It Works on Penny Stocks
- Retail traders pile in at the top, creating volume spikes
- Market makers and smart money use this liquidity to exit
- Once the volume spike passes, there's no fuel left for higher prices
- The "smart money selling into dumb money buying" creates the top
### Key Settings
| Parameter | Default | Range | Description |
|-----------|---------|-------|-------------|
| Volume MA Length | 20 | 5-50 | Period for average volume calculation |
| Climax Volume Multiple | 3.0x | 1.5-10.0 | Multiple of average for "climax" |
| Show Volume Bars | True | - | Visual volume representation |
---
## 4. RSI DIVERGENCE ANALYZER
### What It Detects
Bearish divergence occurs when price makes higher highs but RSI (momentum) makes lower highs. This indicates that momentum is weakening even as price pushes higher—a warning of imminent reversal.
### Technical Logic
```
Bearish Divergence = TRUE when:
├── RSI is in overbought territory (> threshold)
├── AND RSI is declining (current < previous < prior)
└── Indicates momentum exhaustion before price catches up
```
### Visual Representation
```
Price: /\ /\
/ \ / \ ← Higher high
/ \/
/
/
RSI: /\
/ \ /\
/ \/ \ ← Lower high (DIVERGENCE)
/ \
════════════════════ Overbought (70)
```
### Why It Works on Penny Stocks
- Penny stocks often push to new highs on weaker and weaker momentum
- Divergence signals that fewer buyers are participating at each new high
- Eventually, the lack of buying pressure leads to collapse
### Key Settings
| Parameter | Default | Range | Description |
|-----------|---------|-------|-------------|
| RSI Length | 14 | 5-30 | Standard RSI calculation period |
| Overbought Level | 70 | 60-90 | RSI level considered overbought |
| Divergence Lookback | 14 | 5-30 | Bars to look back for swing highs |
---
## 5. KEY LEVEL REJECTION TRACKER
### What It Detects
Identifies rejections from significant price levels where shorts are likely to be concentrated: High of Day (HOD), premarket highs, and psychological levels (whole and half dollars).
### Technical Logic
```
Level Rejection = TRUE when:
├── Price touches key level (within 0.2% tolerance)
├── AND candle is bearish (close < open)
├── AND close is in lower portion of candle range
│
├── Key Levels Tracked:
│ ├── High of Day (HOD)
│ ├── Premarket High
│ └── Psychological levels ($1.00, $1.50, $2.00, etc.)
```
### Visual Representation
```
HOD ─────────────────────────────────
╱╲ ← Rejection
╱ ╲
╱ ╲
╱
─────────────────────────────────
PM High ─────────────────────────────
```
### Why It Works on Penny Stocks
- **HOD**: The high of day is where the most traders are trapped long. Failure to break HOD often triggers stop-loss cascades
- **Premarket High**: Represents overnight enthusiasm; failure to exceed often means the "news" is priced in
- **Psychological Levels**: Round numbers ($1, $2, $5) attract orders and act as natural resistance
### Key Settings
| Parameter | Default | Range | Description |
|-----------|---------|-------|-------------|
| Track HOD Rejection | True | - | Monitor high of day |
| Track Premarket High | True | - | Monitor premarket resistance |
| Track Psychological Levels | True | - | Monitor round numbers |
---
## 6. FAILED BREAKOUT DETECTOR
### What It Detects
Identifies "bull traps" where price breaks above resistance but immediately fails and closes back below. This traps breakout buyers and often leads to accelerated selling.
### Technical Logic
```
Failed Breakout = TRUE when:
├── Price breaks above recent high (lookback period)
├── AND one of:
│ ├── Same bar closes below the breakout level
│ └── OR following bars show consecutive red candles
```
### Visual Representation
```
╱╲
╱ ╲ ← False breakout
Recent High ══╱════╲════════════════
╱ ╲
╱ ╲
╱ ╲ ← Trapped longs panic sell
```
### Why It Works on Penny Stocks
- Breakout traders enter on the break, providing exit liquidity for smart money
- When the breakout fails, these traders become trapped and must exit
- Their forced selling accelerates the decline
- Penny stocks have thin order books, making failed breakouts especially violent
### Key Settings
| Parameter | Default | Range | Description |
|-----------|---------|-------|-------------|
| Breakout Lookback | 5 | 2-15 | Bars to define "recent high" |
| Confirmation Bars | 2 | 1-5 | Bars to confirm failure |
---
## 7. MOVING AVERAGE BREAKDOWN SYSTEM
### What It Detects
Monitors exponential moving averages (EMAs) for bearish crossovers and price rejections. EMA crosses often signal trend changes, while rejections from EMAs indicate resistance.
### Technical Logic
```
MA Breakdown = TRUE when:
├── Bearish EMA cross (fast crosses below slow)
└── OR EMA rejection (price tests EMA from below and fails)
```
### Visual Representation
```
╱╲ ← Rejection from EMA
╱ ╲
EMA 9 ═══════════╱════╲═══════════
╲
EMA 20 ═══════════════════╲════════
╲
Bearish cross ↓
```
### Why It Works on Penny Stocks
- EMAs smooth out the noise and show underlying trend direction
- When fast EMA crosses below slow EMA, it signals momentum shift
- Rejected attempts to reclaim EMAs show sellers are in control
### Key Settings
| Parameter | Default | Range | Description |
|-----------|---------|-------|-------------|
| Fast EMA | 9 | 3-20 | Short-term trend |
| Slow EMA | 20 | 10-50 | Medium-term trend |
| Show EMAs | True | - | Display on chart |
---
# Installation & Setup
## Step 1: Access Pine Editor
1. Open TradingView (tradingview.com)
2. Open any chart
3. Click "Pine Editor" at the bottom of the screen
## Step 2: Create New Indicator
1. Click "Open" → "New blank indicator"
2. Delete any existing code
3. Paste the entire PSSP code
## Step 3: Save and Add to Chart
1. Click "Save" (give it a name like "PSSP")
2. Click "Add to chart"
3. The indicator will appear with default settings
## Step 4: Configure Settings
1. Click the gear icon (⚙️) on the indicator
2. Adjust settings based on your trading style (see Settings section)
3. Click "OK" to apply
## Recommended Chart Setup
- **Timeframe**: 1-minute or 5-minute for scalping, 15-minute for swing shorts
- **Chart Type**: Candlestick
- **Extended Hours**: Enable if trading premarket/afterhours
- **Volume**: Can disable default volume since PSSP tracks it
---
# Understanding the Dashboard
The real-time dashboard provides at-a-glance status of all systems:
```
┌─────────────────────────────────────────┐
│ 📊 SHORT SIGNAL DASHBOARD │
├─────────────────────────────────────────┤
│ Signal Strength: 5/7 │
├─────────────────────────────────────────┤
│ ─── ACTIVE SIGNALS ─── │
│ │
│ Parabolic Exhaustion 🔴 2.1 ATR │
│ VWAP Rejection 🔴 Above │
│ Volume Climax 🔴 4.2x Avg │
│ RSI Divergence ⚪ RSI: 68 │
│ Level Rejection 🔴 @ HOD │
│ Failed Breakout 🔴 │
│ MA Breakdown ⚪ Bullish │
├─────────────────────────────────────────┤
│ ─── RISK LEVELS ─── │
│ Stop: $2.45 T1: $2.10 T2: $1.85 │
└─────────────────────────────────────────┘
```
## Dashboard Elements Explained
### Signal Strength Indicator
| Rating | Signals | Color | Interpretation |
|--------|---------|-------|----------------|
| STRONG | 5-7 | Red | High-confidence short opportunity |
| MODERATE | 3-4 | Orange | Decent setup, consider other factors |
| WEAK | 1-2 | Gray | Insufficient confirmation |
| NONE | 0 | Gray | No short signals active |
### Signal Status Icons
- 🔴 = Signal is ACTIVE (condition met)
- ⚪ = Signal is INACTIVE (condition not met)
### Contextual Metrics
Each signal row includes relevant metrics:
- **Parabolic**: Shows ATR extension from VWAP
- **VWAP**: Shows if price is Above/Below VWAP
- **Volume**: Shows current volume as multiple of average
- **RSI**: Shows current RSI value
- **Level**: Shows which level was touched (HOD, PM High, etc.)
- **MA**: Shows EMA relationship (Bullish/Bearish)
### Risk Levels
When a composite short signal fires:
- **Stop**: Suggested stop-loss level (high + ATR multiple)
- **T1**: First profit target (1:1 risk/reward)
- **T2**: Second profit target (user-defined R:R)
---
# Input Settings Deep Dive
## Group 1: Parabolic Exhaustion
| Setting | Default | Conservative | Aggressive | Description |
|---------|---------|--------------|------------|-------------|
| Enable | True | True | True | Turn system on/off |
| Lookback Period | 10 | 15 | 5 | Bars analyzed for pattern |
| Extension Threshold | 1.5 | 2.0 | 1.0 | ATRs above VWAP for "parabolic" |
| Consecutive Green Bars | 3 | 4 | 2 | Minimum green bars required |
**Tuning Tips:**
- Lower thresholds = more signals but more false positives
- Higher thresholds = fewer signals but higher quality
- For very volatile penny stocks, consider higher thresholds
## Group 2: VWAP Rejection
| Setting | Default | Conservative | Aggressive | Description |
|---------|---------|--------------|------------|-------------|
| Enable | True | True | True | Turn system on/off |
| Rejection Sensitivity | 0.5 | 0.3 | 0.8 | ATR distance for valid rejection |
| Show VWAP Line | True | True | True | Display VWAP |
| Show VWAP Bands | True | True | True | Display deviation bands |
| Band Multiplier | 2.0 | 2.5 | 1.5 | Standard deviations for bands |
**Tuning Tips:**
- Tighter sensitivity (lower number) = must reject very close to VWAP
- Wider bands = less frequent upper band rejections but more significant
## Group 3: Volume Climax
| Setting | Default | Conservative | Aggressive | Description |
|---------|---------|--------------|------------|-------------|
| Enable | True | True | True | Turn system on/off |
| Volume MA Length | 20 | 30 | 10 | Baseline volume period |
| Climax Volume Multiple | 3.0 | 4.0 | 2.0 | Multiple for "climax" status |
| Show Volume Profile | True | True | True | Visual volume bars |
**Tuning Tips:**
- Higher multiple = only extreme volume spikes trigger
- Shorter MA = more responsive to recent volume changes
- For highly liquid stocks, consider higher multiples
## Group 4: Momentum Divergence
| Setting | Default | Conservative | Aggressive | Description |
|---------|---------|--------------|------------|-------------|
| Enable | True | True | True | Turn system on/off |
| RSI Length | 14 | 21 | 7 | RSI calculation period |
| Overbought Level | 70 | 75 | 65 | Threshold for "overbought" |
| Divergence Lookback | 14 | 20 | 10 | Bars for swing high detection |
**Tuning Tips:**
- Lower overbought threshold = more frequent signals
- Shorter RSI length = more responsive but noisier
## Group 5: Key Level Rejection
| Setting | Default | Description |
|---------|---------|-------------|
| Enable | True | Master toggle for level system |
| Track Premarket High | True | Monitor premarket resistance |
| Track HOD Rejection | True | Monitor high of day |
| Track Psychological Levels | True | Monitor round numbers |
**Tuning Tips:**
- Disable premarket tracking if stock doesn't have significant premarket activity
- Psychological levels work best on stocks under $10
## Group 6: Failed Follow-Through
| Setting | Default | Conservative | Aggressive | Description |
|---------|---------|--------------|------------|-------------|
| Enable | True | True | True | Turn system on/off |
| Breakout Lookback | 5 | 8 | 3 | Bars defining "recent high" |
| Confirmation Bars | 2 | 3 | 1 | Bars to confirm failure |
**Tuning Tips:**
- Shorter lookback = more breakouts detected but smaller significance
- More confirmation bars = higher confidence but later entry
## Group 7: Moving Average Signals
| Setting | Default | Conservative | Aggressive | Description |
|---------|---------|--------------|------------|-------------|
| Enable | True | True | True | Turn system on/off |
| Fast EMA | 9 | 12 | 5 | Short-term trend |
| Slow EMA | 20 | 26 | 13 | Medium-term trend |
| Show EMAs | True | True | True | Display on chart |
**Tuning Tips:**
- Standard 9/20 works well for most penny stocks
- Faster EMAs (5/13) for scalping, slower (12/26) for swing trading
## Group 8: Composite Signal
| Setting | Default | Conservative | Aggressive | Description |
|---------|---------|--------------|------------|-------------|
| Minimum Signals | 3 | 4-5 | 2 | Signals needed for trigger |
| Show Dashboard | True | True | True | Display signal table |
| Dashboard Position | top_right | - | - | Screen location |
**Tuning Tips:**
- **Minimum Signals is the most important setting**
- Higher minimum = fewer trades but higher win rate
- Lower minimum = more trades but more false signals
## Group 9: Risk Management
| Setting | Default | Conservative | Aggressive | Description |
|---------|---------|--------------|------------|-------------|
| Show Stop Levels | True | True | True | Display stop loss |
| Stop ATR Multiple | 1.5 | 2.0 | 1.0 | Stop distance in ATRs |
| Show Targets | True | True | True | Display profit targets |
| Target R:R | 2.0 | 1.5 | 3.0 | Risk:Reward for Target 2 |
**Tuning Tips:**
- Tighter stops (lower ATR multiple) = less risk but more stop-outs
- Higher R:R targets = bigger winners but fewer targets hit
## Group 10: Visual Settings
| Setting | Default | Description |
|---------|---------|-------------|
| Bullish Color | Green | Color for bullish elements |
| Bearish Color | Red | Color for bearish/short signals |
| Warning Color | Orange | Color for caution signals |
| Neutral Color | Gray | Color for inactive elements |
---
# Visual Elements Explained
## Chart Overlays
### VWAP Line (Blue)
- **Solid blue line** = Volume Weighted Average Price
- Price above VWAP = bullish bias
- Price below VWAP = bearish bias
- **Use**: Short when price rejects from above VWAP
### VWAP Bands (Purple circles)
- Upper band = 2 standard deviations above VWAP
- Lower band = 2 standard deviations below VWAP
- **Use**: Extreme extension to upper band signals potential reversal
### EMAs (Orange and Red)
- **Orange line** = Fast EMA (9-period default)
- **Red line** = Slow EMA (20-period default)
- **Use**: Bearish cross or price rejection from EMAs confirms short
### HOD Line (Red, dashed)
- Shows the current day's high
- **Use**: Rejection from HOD is a key short signal
### Premarket High (Orange, dashed)
- Shows premarket session high
- **Use**: Failure to break PM high often signals weakness
## Signal Markers
### Individual Signal Markers (Small)
| Shape | Color | Signal |
|-------|-------|--------|
| ▼ Triangle | Purple | Parabolic Exhaustion |
| ✕ X-Cross | Blue | VWAP Rejection |
| ◆ Diamond | Yellow | Volume Climax |
| ● Circle | Orange | RSI Divergence |
| ■ Square | Red | Failed Breakout |
### Composite Short Signal (Large)
- **Large red triangle** with "SHORT" text
- Only appears when minimum signal threshold is met
- This is your primary trading signal
## Risk Level Lines
### Stop Loss (Red line)
- Calculated as: Entry + (ATR × Stop Multiple)
- Represents maximum acceptable loss
- **RESPECT THIS LEVEL**
### Target 1 (Light green line)
- First profit target at 1:1 risk/reward
- Consider taking partial profits here
### Target 2 (Dark green line)
- Second profit target at user-defined R:R
- Let winners run to this level
## Background Coloring
### Light Red Background
- Appears when composite short signal is active
- Indicates you should be looking for shorts, not longs
### Light Purple Background
- Appears during extreme parabolic extension
- Warning of potential imminent reversal
---
# Alert Configuration
## Available Alerts
### 1. Composite Short Signal
**Best for**: Primary trading signal
```
Condition: Composite short signal fires
Message: "PSSP: Short Signal Triggered - {ticker} at {close}"
```
### 2. Parabolic Exhaustion
**Best for**: Early warning of potential top
```
Condition: Parabolic exhaustion detected
Message: "PSSP: Parabolic exhaustion detected on {ticker}"
```
### 3. Volume Climax
**Best for**: Blow-off top identification
```
Condition: Volume climax occurs
Message: "PSSP: Volume climax / blow-off top on {ticker}"
```
### 4. Strong Short Setup (5+ Signals)
**Best for**: High-confidence opportunities only
```
Condition: 5 or more signals active
Message: "PSSP: STRONG short setup on {ticker}"
```
### 5. Very Strong Short Setup (6+ Signals)
**Best for**: Maximum confidence trades
```
Condition: 6 or more signals active
Message: "PSSP: VERY STRONG short setup on {ticker}"
```
### 6. Failed Breakout
**Best for**: Bull trap identification
```
Condition: Failed breakout detected
Message: "PSSP: Failed breakout detected on {ticker}"
```
### 7. Key Level Rejection
**Best for**: Resistance level plays
```
Condition: Key level rejection occurs
Message: "PSSP: Key level rejection on {ticker}"
```
## Setting Up Alerts in TradingView
1. Right-click on the chart
2. Select "Add Alert"
3. Set Condition to "Penny Stock Short Signal Pro"
4. Choose your desired alert condition
5. Configure notification method (popup, email, webhook, etc.)
6. Set expiration (or "Open-ended" for permanent)
7. Click "Create"
## Alert Strategy Recommendations
### For Active Day Traders
- Enable: Composite Short Signal, Volume Climax
- Set to: Popup + Sound
- Check frequently during market hours
### For Swing Traders
- Enable: Strong Short Setup (5+), Very Strong Short Setup (6+)
- Set to: Email + Mobile Push
- Review at key times (open, lunch, close)
### For Part-Time Traders
- Enable: Very Strong Short Setup (6+) only
- Set to: Email + SMS
- Only trade highest-conviction setups
---
# Trading Strategies
## Strategy 1: The Parabolic Fade
**Setup Requirements:**
- Parabolic Exhaustion signal ACTIVE
- Extension from VWAP ≥ 2.0 ATR
- Volume climax or declining volume on push
**Entry:**
- Short on first red candle after signal
- Or short on break below prior candle's low
**Stop Loss:**
- Above the high of the parabolic move
- Maximum: 1.5 ATR above entry
**Targets:**
- T1: VWAP (take 50% off)
- T2: Lower VWAP band or LOD
**Best Time:** 9:30-10:30 AM (morning runners)
---
## Strategy 2: VWAP Rejection Short
**Setup Requirements:**
- VWAP Rejection signal ACTIVE
- Price came from below VWAP
- Rejection candle has significant upper wick
**Entry:**
- Short on close below VWAP
- Or short on break below rejection candle low
**Stop Loss:**
- Above VWAP + 0.5 ATR
- Or above rejection candle high
**Targets:**
- T1: Lower VWAP band
- T2: Prior support or LOD
**Best Time:** Midday (11:00 AM - 2:00 PM)
---
## Strategy 3: HOD Failure Short
**Setup Requirements:**
- Level Rejection signal ACTIVE (HOD)
- Multiple tests of HOD without breakthrough
- Volume declining on each test
**Entry:**
- Short on confirmed HOD rejection
- Wait for close below the rejection candle
**Stop Loss:**
- Above HOD + 0.25 ATR (tight)
- Clear invalidation if HOD breaks
**Targets:**
- T1: VWAP
- T2: Morning support levels
**Best Time:** 10:30 AM - 12:00 PM
---
## Strategy 4: Volume Climax Fade
**Setup Requirements:**
- Volume Climax signal ACTIVE
- Volume ≥ 3x average on green candle
- Followed by bearish candle or upper wick
**Entry:**
- Short on first red candle after climax
- Or short on break below climax candle low
**Stop Loss:**
- Above climax candle high
- Give room for volatility spike
**Targets:**
- T1: 50% retracement of the run
- T2: VWAP or start of the run
**Best Time:** First hour of trading
---
## Strategy 5: The Full Composite (High Conviction)
**Setup Requirements:**
- Composite Short signal ACTIVE
- Minimum 4-5 individual signals
- Clear visual of signal markers clustering
**Entry:**
- Short immediately on composite signal
- Use market order for fast-moving stocks
**Stop Loss:**
- Use indicator's automatic stop level
- Do not deviate from system
**Targets:**
- T1: Indicator's T1 level (1:1)
- T2: Indicator's T2 level (2:1)
**Best Time:** Any time with sufficient signals
---
# Risk Management
## Position Sizing Formula
```
Position Size = (Account Risk %) / (Stop Loss %)
Example:
- Account: $25,000
- Risk per trade: 1% = $250
- Entry: $2.00
- Stop: $2.20 (10% stop)
- Position Size: $250 / 10% = $2,500 worth
- Shares: $2,500 / $2.00 = 1,250 shares
```
## Risk Rules
### The 1% Rule
Never risk more than 1% of your account on any single trade. For a $25,000 account, max risk = $250.
### The 2x Stop Rule
If your stop gets hit twice on the same stock, stop trading it for the day. The pattern isn't working.
### The Daily Loss Limit
Set a maximum daily loss (e.g., 3% of account). Stop trading if hit.
### The Size-Down Rule
After a losing trade, reduce your next position size by 50%. Rebuild after a winner.
## Short-Specific Risks
### The Short Squeeze
- Penny stocks can squeeze violently
- ALWAYS use stops
- Never "hope" a position comes back
- Size appropriately for volatility
### The Hard-to-Borrow
- Check borrow availability before trading
- High borrow fees eat into profits
- Some stocks become HTB mid-trade
### The Halt Risk
- Penny stocks can halt on volatility
- Position size for worst-case halt against you
- Halts can open significantly higher
---
# Best Practices
## DO's
✅ **Wait for multiple signals** - Single signals have lower accuracy
✅ **Trade with the trend** - Short when daily trend is down
✅ **Use the dashboard** - Check signal count before entering
✅ **Respect stops** - The indicator calculates them for a reason
✅ **Size appropriately** - Penny stocks are volatile; position small
✅ **Trade liquid stocks** - Volume ≥ 500K daily average
✅ **Know the catalyst** - Understand why the stock is moving
✅ **Take partial profits** - Secure gains at T1
✅ **Journal your trades** - Track what works and what doesn't
✅ **Time your entries** - Best shorts often come 10:30-11:30 AM
## DON'Ts
❌ **Don't short strong stocks** - If it won't go down, don't force it
❌ **Don't fight the tape** - A stock going up can keep going up
❌ **Don't average up on losers** - Adding to losing shorts is dangerous
❌ **Don't ignore the dashboard** - It exists to help you
❌ **Don't overtrade** - Quality over quantity
❌ **Don't short into news** - Wait for the reaction first
❌ **Don't trade the first 5 minutes** - Too chaotic for reliable signals
❌ **Don't hold overnight** - Penny stock gaps can destroy accounts
❌ **Don't trade without stops** - Ever.
❌ **Don't trade on tilt** - After losses, take a break
## Optimal Trading Windows
| Time (ET) | Quality | Notes |
|-----------|---------|-------|
| 9:30-9:35 | ⭐ | Too volatile, avoid |
| 9:35-10:30 | ⭐⭐⭐⭐⭐ | Best shorts, morning runners exhaust |
| 10:30-11:30 | ⭐⭐⭐⭐ | Secondary exhaustion, HOD rejections |
| 11:30-2:00 | ⭐⭐ | Midday lull, lower quality |
| 2:00-3:00 | ⭐⭐⭐ | Afternoon setups develop |
| 3:00-3:30 | ⭐⭐⭐⭐ | End of day momentum |
| 3:30-4:00 | ⭐⭐ | Closing volatility, risky |
---
# Troubleshooting
## Common Issues
### "Signals aren't appearing"
- Check that the relevant system is enabled in settings
- Ensure minimum signals threshold isn't too high
- Verify the stock has sufficient volume for calculations
### "Too many false signals"
- Increase minimum signals threshold
- Use more conservative settings (see Settings section)
- Focus on stocks with cleaner price action
### "Dashboard not showing"
- Ensure "Show Signal Dashboard" is enabled
- Check that your chart has enough space
- Try a different dashboard position
### "VWAP line is missing"
- VWAP requires intraday timeframes (1m, 5m, 15m, etc.)
- VWAP resets daily; won't show on daily+ charts
- Ensure "Show VWAP Line" is enabled
### "Stop loss seems too tight/wide"
- Adjust Stop ATR Multiple in Risk Management settings
- Lower multiple = tighter stop
- Higher multiple = wider stop
### "Alerts not triggering"
- Verify alert is set to the correct indicator
- Check that alert hasn't expired
- Ensure notification settings are configured in TradingView
## Performance Optimization
If the indicator is slow:
1. Reduce the number of visual elements shown
2. Disable unused signal systems
3. Use on fewer simultaneous charts
4. Close unused browser tabs
---
# Changelog
## Version 1.0 (Initial Release)
- 7 core detection systems implemented
- Real-time signal dashboard
- Automatic risk management calculations
- 7 alert conditions
- Full visual overlay system
- Comprehensive input settings
## Planned Features (Future Updates)
- Scanner integration for multi-stock screening
- Machine learning signal weighting
- Backtesting statistics panel
- Volume profile analysis
- Level 2 data integration (if available)
- Custom timeframe VWAP options
---
# Support & Feedback
## Reporting Issues
When reporting issues, please include:
1. TradingView username
2. Stock symbol and timeframe
3. Screenshot of the issue
4. Your indicator settings
5. Steps to reproduce
## Feature Requests
We welcome suggestions for improving PSSP. Consider:
- What specific pattern are you trying to catch?
- How would this help your trading?
- Any reference examples?
---
# Disclaimer
**IMPORTANT: This indicator is for educational and informational purposes only.**
- Past performance does not guarantee future results
- Short selling carries unlimited risk potential
- Always use proper position sizing and stop losses
- Paper trade before using real capital
- The creator assumes no liability for trading losses
- Consult a financial advisor before trading
**Trade at your own risk.**
---
*Penny Stock Short Signal Pro v1.0*
*Pine Script v6*
*© 2025*

Teemo Volume Delta & Market HUDTeemo Volume Delta & Market HUD
Description:
Teemo Volume Delta goes beyond simple volume indicators to provide expert-level analysis of Buy and Sell pressure within the market. It visualizes supply/demand imbalances inside candles and provides an immediate grasp of market control via a real-time HUD.
With the v1.2.0 update, we have removed unnecessary overlays (like EMAs) to focus on Pure Delta Analysis and a flexible Smart Accumulation System, making the tool lighter and more powerful.
🚀 Key Features
1. Dual Calculation Modes Offers two calculation methods tailored to your trading environment and goals:
Estimation: Rapidly estimates buy/sell volume based on candle shape (OHLC) and price range. It features fast loading times and works instantly on all assets.
Intraday: Analyzes lower timeframe data (e.g., 1-minute bars) to calculate the precise delta of the current timeframe. (Loading time may vary depending on TradingView data limits.)
2. Smart Accumulation System Supports strategic analysis beyond simple summation with two distinct modes:
Time Based: Resets the Cumulative Delta to 0 at specific intervals (e.g., every 4 hours, Daily). This is optimized for session-based analysis or day trading.
Infinite: Continuously accumulates data without resetting, ideal for analyzing long-term Divergences between price and delta.
3. Intuitive HUD (Heads-Up Display) Displays critical market data on the chart for instant decision-making:
Delta Panel: Shows real-time Buy/Sell volume and Net Delta for the current candle.
Market HUD: Provides a comprehensive view of Trend Strength (ADX), Momentum (RSI), and the Cumulative Buy/Sell status for the current period.
4. Teemo Design System (v1.2) Provides optimized color themes for visual comfort during long trading sessions:
Teemo Neon: High-contrast Mint/Purple theme optimized for dark backgrounds.
Classic Soft: A calming Soft Green/Red theme designed to reduce eye strain (Recommended for all backgrounds).
⚙️ Settings Guide
Calculation Mode: Choose between Estimation (Speed) or Intraday (Precision).
Accumulation Mode: Choose Time Based (Periodic Reset) or Infinite (Continuous).
Reset Period: Set the reset interval for Time Based mode (e.g., 1D = Daily Reset).
Color Preset: Select between Teemo Neon or Classic Soft themes.
💡 Trading Tips
Delta Divergence: If the price makes a higher high but the Cumulative Delta (HUD) makes a lower high, it signals weakening buying pressure and a potential reversal.
Candle Coloring: A solid Mint (or Green) candle body indicates a price rise accompanied by strong actual buying volume, offering higher reliability than standard candles.
HUD Confluence: Consider trend-following entries when the ADX is above 25 and the Delta is heavily skewed in one direction.
This indicator is for informational purposes only and does not constitute financial advice. The Estimation mode provides approximations based on algorithms, and the Intraday mode's accuracy depends on the quality of the lower timeframe data provided by the exchange.
Developed by Teemo Trading Systems
------------------------------------------------------------------------
Teemo Volume Delta & Market HUD
설명 본문:
Teemo Volume Delta는 단순한 거래량 지표를 넘어, 시장 내부의 매수(Buy)와 매도(Sell) 압력을 정밀하게 분석하는 전문가용 도구입니다. 캔들 내부의 수급 불균형을 시각화하고, 실시간 HUD를 통해 시장의 주도권이 누구에게 있는지 즉각적으로 파악할 수 있도록 돕습니다.
v1.2.0 업데이트를 통해 불필요한 보조지표(EMA)를 제거하고, 순수한 델타 분석과 유연한 누적(Accumulation) 시스템에 집중하여 더욱 가볍고 강력해졌습니다.
🚀 주요 기능 (Key Features)
1. 듀얼 계산 모드 (Dual Calculation Modes) 사용자의 환경과 목적에 맞춰 두 가지 계산 방식을 제공합니다.
Estimation (추정 모드): 캔들의 형태(OHLC)와 가격 변동폭을 기반으로 매수/매도 볼륨을 빠르게 추정합니다. 로딩 속도가 빠르며 모든 자산에 즉시 적용 가능합니다.
Intraday (정밀 분석 모드): 하위 타임프레임(예: 1분봉)의 데이터를 분석하여 상위 타임프레임의 델타를 정밀하게 계산합니다. (TradingView 데이터 제한에 따라 로딩 시간이 소요될 수 있습니다.)
2. 스마트 누적 시스템 (Smart Accumulation) 단순 누적을 넘어, 전략적 분석을 위한 두 가지 모드를 지원합니다.
Time Based: 지정한 주기(예: 4시간, 1일)마다 누적 델타를 **0으로 초기화(Reset)**합니다. 세션별 수급 분석이나 데이 트레이딩에 최적화되어 있습니다.
Infinite: 초기화 없이 데이터를 계속 누적하여, 장기적인 가격과 델타의 **다이버전스(Divergence)**를 분석하는 데 유용합니다.
3. 직관적인 HUD (Heads-Up Display) 차트 우측과 좌측에 핵심 정보를 요약하여 보여줍니다.
Delta Panel: 현재 캔들의 매수/매도 거래량과 순매수(Net Delta) 상태를 실시간으로 표시합니다.
Market HUD: ADX(추세 강도), RSI(모멘텀), 그리고 현재 구간의 누적 매수/매도 현황을 한눈에 볼 수 있습니다.
4. Teemo Design System (v1.2) 장시간 차트를 보는 트레이더를 위해 시인성이 뛰어난 컬러 테마를 제공합니다.
Teemo Neon: 어두운 배경에 최적화된 고대비 민트/퍼플 테마.
Classic Soft: 눈의 피로를 줄여주는 차분한 그린/레드 테마 (밝은/어두운 배경 모두 추천).
⚙️ 설정 가이드 (Settings)
Calculation Mode: Estimation(속도 중심) 또는 Intraday(정확도 중심) 중 선택.
Accumulation Mode: Time Based(주기별 리셋) 또는 Infinite(무한 누적) 선택.
Reset Period: Time Based 모드 사용 시 리셋할 주기 설정 (예: 1D = 매일 리셋).
Color Preset: Teemo Neon 또는 Classic Soft 테마 선택.
💡 활용 팁 (Trading Tips)
델타 다이버전스: 가격은 신고가를 갱신하지만 누적 델타(Cum Delta)는 낮아진다면, 매수세가 약화되고 있다는 강력한 반전 신호입니다.
캔들 컬러링: 캔들의 몸통 색상이 짙은 민트색(또는 그린)이라면 강력한 매수세가 동반된 상승을 의미하며, 신뢰도가 높습니다.
HUD 활용: ADX가 25 이상이면서 델타가 한쪽 방향으로 쏠릴 때 추세 매매를 고려하세요.
이 지표는 정보 제공의 목적으로만 사용되며, 재정적 조언이 아닙니다. Estimation 모드는 근사치를 제공하며, Intraday 모드는 거래소에서 제공하는 하위 데이터의 품질에 따라 정확도가 달라질 수 있습니다.

BULLISH!! Low High Range Options HelperThis indicator is designed for range-based options trading, where price tends to rotate between a defined low and high rather than trend continuously. Its purpose is not to tell you what to trade, but to provide context for timing, specifically answering the question: if price is at a discount here, how much time should an option realistically have?
The script identifies a recent price range and plots three key levels. The range high represents the upper boundary of recent price action and often acts as a take-profit or resistance area. The range mid is the 50 percent equilibrium of the range and is intended as a confirmation level rather than an entry signal. The range low represents the discount zone, where risk is best defined for bullish options trades. This is the only area where options guidance is displayed.
When price touches the range low, the indicator calculates how long similar range rotations have taken in the past, adjusts that timing to the current chart timeframe, and applies a safety factor to reduce the risk of under-timing an options position. It then displays a suggested days-to-expiration label, such as 3 DTE, 4 DTE, 5 DTE, 6 DTE, 7 DTE, 10 DTE, or 14 plus. Shorter DTE values reflect faster expected rotations, while longer DTE values reflect slower, choppier, or more uncertain conditions. The goal is to help avoid the common mistake of buying options that do not have enough time to work.
A typical way to use this tool is to identify a clearly defined range, wait for price to reach the range low, note the DTE guidance shown on the chart, then wait for confirmation such as a reclaim of the range midpoint before considering a trade. Risk can then be managed with the range structure in mind, often targeting the range high in rotational environments. The indicator is most effective in sideways or mean-reverting markets rather than strong trends.
This script does not place trades, predict direction, or guarantee outcomes. It does not account for news events, earnings, implied volatility changes, or broader macro conditions. It is intended as a contextual tool to support disciplined decision-making, not as a standalone trading system.
Always trade smart. Manage position size, define risk before entering a trade, and avoid over-leveraging short-dated options. The objective is not to predict the market, but to consistently align price structure with realistic time expectations.

RSI-RS StrategyRSI-RS Strategy: Smart Trend Following 🚀
Overview
This strategy combines Multi-Timeframe RSI with Mansfield Relative Strength to identify high-momentum breakouts in strong stocks. Unlike standard RSI strategies, it features a "Smart Trailing Stop" that tightens when momentum weakens but respects key RSI 50 support levels to avoid shaking you out of winning trades.
Key Features ✨
1. 🎯 High-Probability Entries
Multi-Confirmations: Requires Monthly RSI > 60 and Weekly RSI > 60 (Trend is Up).
Dual Trigger: Enters on a Daily RSI Breakout (>60) OR a Weekly RSI Catch-up, ensuring you don't miss late moves.
RS Filter: Only buys stocks outperforming the Index (RS > 0).
New Listing Safe: Automatically skips Monthly checks for new IPOs lacking history.
2. 🛡️ Advanced "Hybrid" Stop Loss
This strategy solves the "Wick Out" problem:
Confirmation Exit: If price drops below the Stop Loss, it waits for the Next Candle to confirm the breakdown. It ignores intraday wicks!
Crash Protection: Includes a "Panic Button" (Default 3% buffer). If price crashes rapidly intraday, it exits immediately to save capital.
Smart Trailing: The Stop Loss moves UP when RSI shows weakness (<60), locking in profits.
3. 🧠 Smart Support Buffer
Wait for 50: Uniquely detects when RSI is resting on 50 Support (Zone 50-55).
Patience: It ignores minor weakness signals in this zone, waiting for a bounce instead of exiting prematurely.
4. 🧹 Clean Visuals
Minimalist Labels: Transparent Entry/Exit labels that don't declutter the chart.
Setup Watch: Visually signals "Watch > " before the trade triggers.
Transparency: "SL Update" diamonds prove exactly why the stop moved (showing the RSI value).
Settings Guide ⚙️
Confirmation Window: How many bars the breakout remains valid (Default: 2).
RSI Support Buffer: The "Safe Zone" range above 50 (Default: 5).
Crash Buffer %: Distance below SL for immediate emergency exit (Default: 3.0%).
Visuals: Toggle Setup Labels and SL Diamonds on/off to keep your chart clean.
How to Trade It
Green Background: You are in a trade.
Red Line: Your Hard Stop Loss (Closing Basis).
Maroon Dotted Line: Your Crash Limit (Intraday Danger Zone).
Orange Diamond: Warning! RSI Weakness detected, SL has tightened.
Disclaimer
Backtested on Indian Equities (NSE). Designed for Swing Trading on Daily Timeframe. Always manage your own risk.
