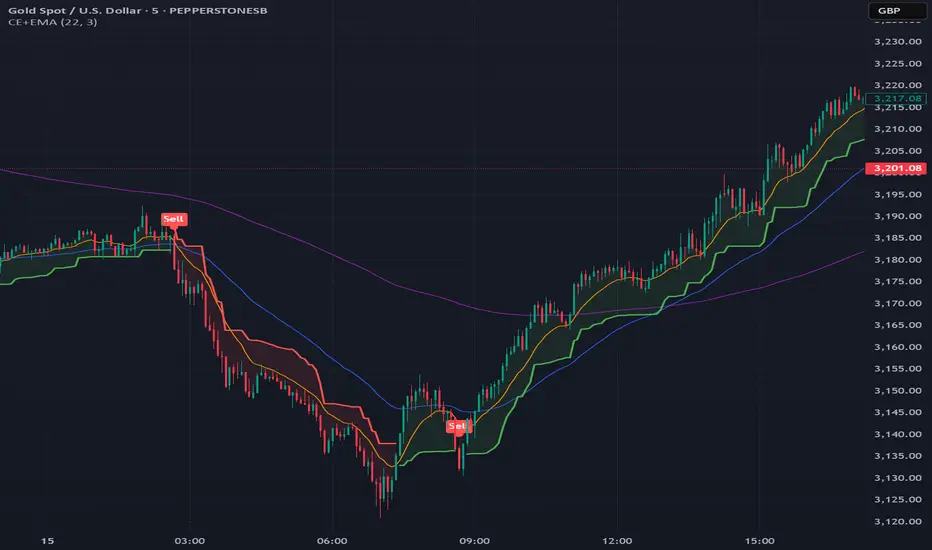
Chandelier Exit + EMA Filtered SignalsThis script is a powerful upgrade to the original Chandelier Exit by Alex Orekhov (everget), combining trend-following logic with higher-quality trade filtering.
✅ Key Features:
Chandelier Exit logic with ATR-based stop levels
Buy/Sell signals only when trend is confirmed:
Buy: Price must be above EMA 13, 50, and 200
Sell: Price must be below EMA 13, 50, and 200
Candle highlighting: Green for Buy, Red for Sell
Signal labels for visual clarity
Toggle to show/hide EMAs
Built-in alerts for:
Buy signal
Sell signal
Trend direction change
🛠️ Inputs:
ATR Period and Multiplier
Toggle: Use Close Price for High/Low Calculation
Toggle: Show/Hide Labels and State Highlight
Toggle: Show/Hide EMA 13, 50, 200
Toggle: Await confirmed bar for alerts
🔔 Alerts Included:
Chandelier Exit Buy
Chandelier Exit Sell
Direction Change (long to short or vice versa)
💡 How to Use:
Use on trending assets (e.g., Gold, Indices, Crypto).
Combine with support/resistance or session filters for optimal results.
Enable alerts to be notified on trade setups.
📢 Credits:
Based on the original Chandelier Exit script by everget.
Enhancements by AP Capital for filtered signals and better visual feedback.
In den Scripts nach "signal" suchen
Gap Reversal Signal with Indicators🔍 Gap Reversal Signal with Indicators — 結合 KD、MACD、SAR 與背離分析的多功能指標
🔍 Gap Reversal Signal with Indicators — A Multi-Tool Signal Indicator Combining KD, MACD, SAR, and Divergence Analysis
中文說明:
本指標結合多種常用技術分析工具,包括 KD 隨機指標、MACD 動能交叉、SAR 趨勢方向、以及 MACD 背離偵測,用以辨識潛在的價格反轉區域。適用於日內交易與波段操作,支援各類市場,如加密貨幣、股票與外匯等。
English Description:
This indicator combines several popular technical tools: Stochastic KD, MACD momentum crossovers, SAR trend direction, and MACD divergence detection. It helps traders identify potential reversal areas and is ideal for both intraday and swing trading. Works well on crypto, stocks, and forex markets.
🧠 功能特點 | Key Features
✅ KD指標(慢速隨機指標)檢測超買超賣並提供%K與%D交叉訊號
✅ Stochastic KD (slow) to detect overbought/oversold zones and crossover signals
✅ MACD金叉/死叉與零軸突破捕捉趨勢轉變與動能反轉
✅ MACD Crossovers + Zero-Line Breaks to capture trend changes and momentum reversals
✅ SAR指標即時顯示多空方向
✅ Parabolic SAR for real-time trend direction indication
✅ MACD背離偵測協助辨識潛在反轉區域
✅ MACD Divergence Detection for identifying hidden trend reversals
✅ 圖形提示與標籤提示可視化呈現各類訊號
✅ Visual Alerts and Labels for easy and quick signal recognition
📈 支援市場 | Supported Markets
📊 台股 / 美股 / 外匯 / 加密貨幣
📊 Taiwan Stocks / US Stocks / Forex / Cryptocurrencies (e.g. BTC, ETH)
🔧 推薦用法 | Recommended Use
搭配缺口策略與支撐壓力位使用
Use with gap-trading strategies and support/resistance zones
用於盤整末期或趨勢反轉的提示
Helpful for end-of-consolidation signals or trend reversals
支援短線與波段交易風格
Suitable for scalping and swing trading styles
💡 把這個指標加入你的圖表,立即體驗多重技術分析所帶來的交易優勢!
💡 Add this indicator to your chart now and experience the power of multi-tool technical analysis!

External Signals Strategy Tester v5External Signals Strategy Tester v5 – User Guide (English)
1. Purpose
This Pine Script strategy is a universal back‑tester that lets you plug in any external buy/sell series (for example, another indicator, webhook feed, or higher‑time‑frame condition) and evaluate a rich set of money‑management rules around it – with a single click on/off workflow for every module.
2. Core Workflow
Feed signals
Buy Signal / Sell Signal inputs accept any series (price, boolean, output of request.security(), etc.).
A crossover above 0 is treated as “signal fired”.
Date filter
Start Date / End Date restricts the test window so you can exclude unwanted history.
Trade engine
Optional Long / Short enable toggles.
Choose whether opposite signals simply close the trade or reverse it (flip direction in one transaction).
Risk modules – all opt‑in via check‑boxes
Classic % block – fixed % Take‑Profit / Stop‑Loss / Break‑Even.
Fibonacci Bollinger Bands (FBB) module
Draws dynamic VWMA/HMA/SMA/EMA/DEMA/TEMA mid‑line with ATR‑scaled Fibonacci envelopes.
Every line can be used for stops, trailing, or multi‑target exits.
Separate LONG and SHORT sub‑modules
Each has its own SL plus three Take‑Profits (TP1‑TP3).
Per TP you set line, position‑percentage to close, and an optional trailing flag.
Executed TP/SLs deactivate themselves so they cannot refire.
Trailing behaviour
If Trail is checked, the selected line is re‑evaluated once per bar; the order is amended via strategy.exit().
3. Inputs Overview
Group Parameter Notes
Trade Settings Enable Long / Enable Short Master switches
Close on Opposite / Reverse Position How to react to a counter‑signal
Risk % Use TP / SL / BE + their % Traditional fixed‑distance management
Fibo Bands FIBO LEVELS ENABLE + visual style/length Turn indicator overlay on/off
FBB LONG SL / TP1‑TP3 Enable, Line, %, Trail Rules applied only while a long is open
FBB SHORT SL / TP1‑TP3 Enable, Line, %, Trail Rules applied only while a short is open
Line choices: Basis, 0.236, 0.382, 0.5, 0.618, 0.764, 1.0 – long rules use lower bands, short rules use upper bands automatically.
4. Algorithm Details
Position open
On the very first bar after entry, the script checks the direction and activates the corresponding LONG or SHORT module, deactivating the other.
Order management loop (every bar)
FBB Stop‑Loss: placed/updated at chosen band; if trailing, follows the new value.
TP1‑TP3: each active target updates its limit price to the selected band (or holds static if trailing is off).
The classic % block runs in parallel; its exits have priority because they call strategy.close_all().
Exit handling
When any strategy.exit() fires, the script reads exit_id and flips the *_Active flag so that order will not be recreated.
A Stop‑Loss (SL) also disables all remaining TPs for that leg.
5. Typical Use Cases
Scenario Suggested Setup
Scalping longs into VWAP‐reversion Enable LONG TP1 @ 0.382 (30 %), TP2 @ 0.618 (40 %), SL @ 0.236 + trailing
Fade shorts during news spikes Enable SHORT SL @ 1.0 (no trail) and SHORT TP1,2,3 on consecutive lowers with small size‑outs
Classic trend‑follow Use only classic % TP/SL block and disable FBB modules
6. Hints & Tips
Signal quality matters – this script manages exits, it does not generate entries.
Keep TV time zone in mind when picking start/end dates.
For portfolio‑style testing allocate smaller default_qty_value than 100 % or use strategy.percent_of_equity sizing.
You can combine FBB exits with fixed‑% ones for layered management.
7. Limitations / Safety
No pyramiding; the script holds max one position at a time.
All calculations are bar‑close; intra‑bar touches may differ from real‑time execution.
The indicator overlay is optional, so you can run visual‑clean tests by unchecking FIBO LEVELS ENABLE.

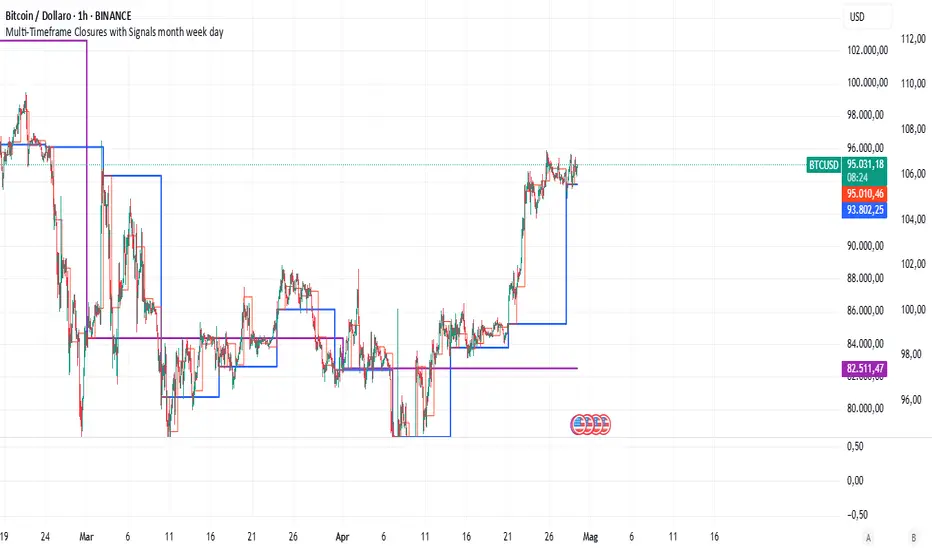
Multi-Timeframe Closures with Signals month week dayMulti-Timeframe Price Anchoring Indicator (Monthly, Weekly, Daily)
This indicator provides a powerful visual framework for analyzing price action across three major timeframes: monthly, weekly, and daily. It plots the closing prices of each timeframe directly on the chart to help traders assess where current price stands in relation to significant historical levels.
🔍 Core Features:
Monthly, Weekly, and Daily Close Lines: Automatically updated at the start of each new period.
Color-coded Price Anchors: Each timeframe is visually distinct for fast interpretation.
Multi-timeframe Awareness: Helps you identify trend alignment or divergence across different time horizons.
Long & Short Bias Signals: The script can optionally display long or short suggestions based on where the current price stands relative to the anchored closing prices.
📈 How to Use:
Trend Confirmation: If price is consistently above all three levels, it signals a strong bullish trend (potential long bias). If it’s below, the opposite applies (short bias).
Reversal or Pullback Zones: When price becomes extended far above/below the monthly and weekly closes, it may suggest overbought/oversold conditions and the possibility of a reversal or retracement.
Intraday Alignment: Useful for traders who want to enter positions on lower timeframes while being aware of higher timeframe trends.
This indicator is ideal for swing traders, day traders, and position traders who want to anchor their decisions to meaningful multi-timeframe reference points.
Advanced Momentum Scanner [QuantAlgo]The Advanced Momentum Scanner is a sophisticated technical indicator designed to identify market momentum and trend direction using multiple exponential moving averages (EMAs), momentum metrics, and adaptive visualization techniques. It is particularly valuable for those looking to identify trading and investing opportunities based on trend changes and momentum shifts across any market and timeframe.
🟢 Technical Foundation
The Advanced Momentum Scanner utilizes a multi-layered approach with four different EMA periods to identify market momentum and trend direction:
Ultra-Fast EMA for quick trend changes detection (default: 5)
Fast EMA for short-term trend analysis (default: 10)
Mid EMA for intermediate confirmation (default: 30)
Slow EMA for long-term trend identification (default: 100)
For momentum detection, the indicator implements a Rate of Change (RoC) calculation to measure price momentum over a specified period. It further enhances analysis by incorporating RSI readings for overbought/oversold conditions, volatility measurements through ATR, and optional volume confirmation. When these elements align, the indicator generates trading signals based on the selected sensitivity mode (Conservative, Balanced, or Aggressive).
🟢 Key Features & Signals
1. Multi-Period Trend Identification
The indicator combines multiple EMAs of different lengths to provide comprehensive trend analysis within the same timeframe, displaying the information through color-coded visual elements on the chart.
When an uptrend is detected, chart elements are colored with the bullish theme color (default: green/teal).
Similarly, when a downtrend is detected, chart elements are colored with the bearish theme color (default: red).
During neutral or indecisive periods, chart elements are colored with a neutral gray color, providing clear visual distinction between trending and non-trending market conditions.
This visualization provides immediate insights into underlying trend direction without requiring separate indicators, helping traders and investors quickly identify the market's current state.
2. Trend Strength Information Panel
The trend panel operates in three different sensitivity modes (Conservative, Aggressive, and Balanced), each affecting how the indicator processes and displays market information.
The Conservative mode prioritizes trend sustainability over frequency, showing only strong trend movements with high probability.
The Aggressive mode detects early trend changes, providing more frequent signals but potentially more false positives.
The Balanced mode offers a middle ground with moderate signal frequency and reliability.
Regardless of the selected mode, the panel displays:
Current trend direction (UPTREND, DOWNTREND, or NEUTRAL)
Trend strength percentage (0-100%)
Early detection signals when applicable
The active sensitivity mode
This comprehensive approach helps traders and investors:
→ Assess the strength of current market trends
→ Identify early potential trend changes before full confirmation
→ Make more informed trading and investing decisions based on trend context
3. Customizable Visualization Settings
This indicator offers extensive visual customization options to suit different trading styles and preferences:
Display options:
→ Fully customizable uptrend, downtrend, and neutral colors
→ Color-coded price bars showing trend direction
→ Dynamic gradient bands visualizing potential trend channels
→ Optional background coloring based on trend intensity
→ Adjustable transparency levels for all visual elements
These visualization settings can be fine-tuned through the indicator's interface, allowing traders and investors to create a personalized chart environment that emphasizes the most relevant information for their strategy.
The indicator also features a comprehensive alert system with notifications for:
New trend formations (uptrend, downtrend, neutral)
Early trend change signals
Momentum threshold crossovers
Other significant market conditions
Alerts can be customized and delivered through TradingView's notification system, making it easy to stay informed of important market developments even when you are away from the charts.
🟢 Practical Usage Tips
→ Trend Analysis and Interpretation: The indicator visualizes trend direction and strength directly on the chart through color-coding and the information panel, allowing traders and investors to immediately identify the current market context. This information helps in assessing the potential for continuation or reversal.
→ Signal Generation Strategies: The indicator generates potential trading signals based on trend direction, momentum confirmation, and selected sensitivity mode. Users can choose between Conservative (fewer but more reliable signals), Balanced (moderate approach), or Aggressive (more frequent but potentially less reliable signals).
→ Multi-Period Trend Assessment: Through its layered EMA approach, the indicator enables users to understand trend conditions across different lookback periods within the same timeframe. This helps in identifying the dominant trend and potential turning points.
🟢 Pro Tips
Adjust EMA periods based on your timeframe:
→ Lower values for shorter timeframes and more frequent signals
→ Higher values for higher timeframes and more reliable signals
Fine-tune sensitivity mode based on your trading style:
→ "Conservative" for position trading/long-term investing and fewer false signals
→ "Balanced" for swing trading/medium-term investing with moderate signal frequency
→ "Aggressive" for scalping/day trading and catching early trend changes
Look for confluence between components:
→ Strong trend strength percentage and direction in the information panel
→ Overall market context aligning with the expected direction
Use for multiple trading approaches:
→ Trend following during strong momentum periods
→ Counter-trend trading at band extremes during overextension
→ Early trend change detection with sensitivity adjustments
→ Stop loss placement using dynamic bands
Combine with:
→ Volume indicators for additional confirmation
→ Support/resistance analysis for strategic entry/exit points
→ Multiple timeframe analysis for broader market context

Statistical Trailing Stop [LuxAlgo]The Statistical Trailing Stop tool offers traders a way to lock in profits in trending markets with four statistical levels based on the log-normal distribution of volatility.
The indicator also features a dashboard with statistics of all detected signals.
🔶 USAGE
The tool works out of the box, traders can adjust the data used with two parameters: data & distribution length.
By default, the tool takes volatility measures of groups of 10 candles, and statistical measures of the last 100 of these groups then traders can adjust the base level to use as trailing, the larger the level, the more resistant the tool will be to moves against the trend.
🔹 Base Levels
Traders can choose up to 4 different levels of trailing, all based on the statistical distribution of volatility.
As we can see in the chart above, each higher level is more resistant to market movements, so level 0 is the most reactive and level 3 the least.
It is up to the trader to determine the best level for each underlying, time frame and market conditions.
🔹 Dashboard
The tool provides a dashboard with the statistics of all trades, making it very easy to assess the performance of the parameters used for any given market.
As we can see on the chart, all Daily BTC signals with default parameters but different base levels, level 2 is the best performing of all four, giving a positive expectation of $2435 per trade, taking into account all long and short trades.
Of note are the long trades with a win rate of 76.47% and a risk-to-reward of 3.34, giving a positive expectation of $4839 per trade, with winners having an average duration of 210 days and losers 32 days.
This, compared to short trades with negative expectation, speaks to the uptrend bias of this particular market.
🔶 SETTINGS
Data Length: Select how many bars to use per data point
Distribution Length: Select how many data points the distribution will have
Base Level: Choose between 4 different trailing levels
🔹 Dashboard
Show Statistics: Enable/disable dashboard
Position: Select dashboard position
Size: Select dashboard size

Trend Targets [AlgoAlpha]OVERVIEW
This script combines a smoothed trend-following model with dynamic price rejection logic and ATR-based target projection to give traders a complete visual framework for trading trend continuations. It overlays on price and automatically detects potential trend shifts, confirms rejections near dynamic support/resistance, and displays calculated stop-loss and take-profit levels to support structured risk-reward management. Unlike traditional indicators that only show trend direction or signal entries, this tool brings together a unique mix of signal validation, volatility-aware positioning, and layered profit-taking to guide decision-making with more context.
CONCEPTS
The core trend logic is built on a custom Supertrend that uses an ATR-based band structure with long smoothing chains—first through a WMA, then an EMA—allowing the trend line to respond to major shifts while ignoring noise. A key addition is the use of rejection logic: the script looks for consolidation candles that "hug" the smoothed trend line and counts how many consecutive bars reject from it. This behavior often precedes significant moves. A user-defined threshold filters out weak tests and highlights only meaningful rejections.
FEATURES
Trend Detection : Automatically identifies trend direction using a smoothed Supertrend (WMA + EMA), with shape markers on trend shifts and color-coded bars for clarity.
Rejection Signals : Detects price rejections at the trend line after a user-defined number of consolidation bars; plots ▲/▼ icons to highlight strong continuation setups.
Target Projection : On trend confirmation, plots entry, stop-loss (ATR-based), and three dynamic take-profit levels based on customizable multiples.
Dynamic Updates : All levels (entry, SL, TP1–TP3) auto-adjust based on volatility and are labeled in real time on the chart.
Customization : Users can tweak trend parameters, rejection confirmation count, SL/TP ratios, smoothing lengths, and appearance settings.
Alerts : Built-in alerts for trend changes, rejection events, and when TP1, TP2, or TP3 are reached.
Chart Overlay : Plots directly on price chart with minimal clutter and clearly labeled levels for easy trading.
USAGE
Start by tuning the Supertrend factor and ATR period to fit your asset and timeframe—higher values will catch bigger swings, lower values catch faster moves. The confirmation count should match how tightly you want to filter rejection behavior—higher values make signals rarer but stronger. When the trend shifts, the indicator colors the bars and line accordingly, and if enabled, plots the full entry-TP-SL structure. Rejection markers appear only after enough qualifying bars confirm price pressure at the trend line. This is especially useful for continuation plays where price retests the trend but fails to break it. All calculations are based on volatility (ATR), so targets naturally adjust with market conditions. Add alerts to get notified of important signals even when away from the chart.

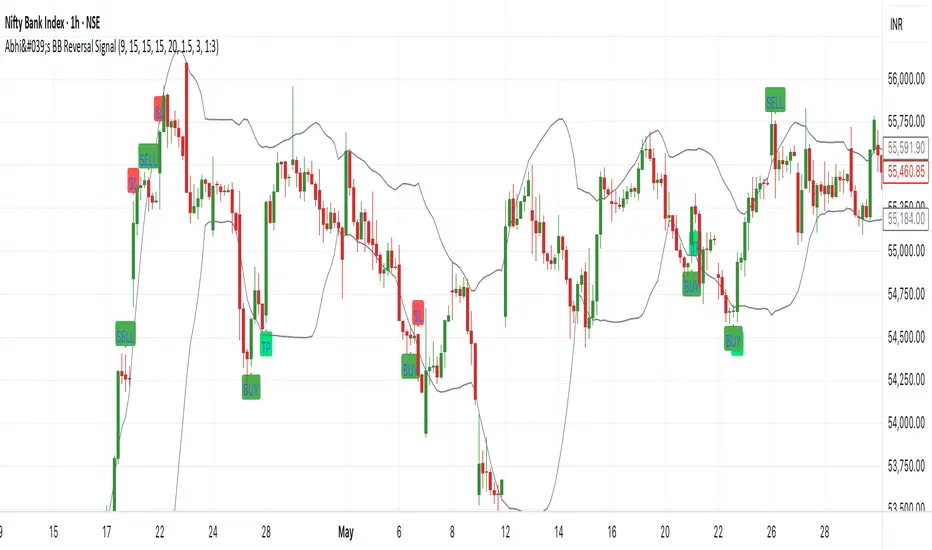
Abhi's Bollinger Band Reversal SignalThis Pine Script indicator is designed to detect reversal trade opportunities using Bollinger Band breakouts. It identifies both buy and sell setups with clearly defined entry, stop-loss (SL), and target (TP) conditions. It also manages trades visually with real-time signal plotting, and limits entries per trading day.
⚙️ How It Works
🔽 Sell Signal Conditions
- The previous candle must close above the upper Bollinger Band, and its entire body must be above the band
- The current candle must fail to break the previous high, and must break below the previous low
- Entry is taken at the previous candle’s low, with SL at its high
- Target is calculated based on a configurable Risk:Reward ratio
🔼 Buy Signal Conditions
- The previous candle must close below the lower Bollinger Band, and its entire body must be below the band
- The current candle must fail to break the previous low, and must break above the previous high
- Entry is at the previous candle’s high, with SL at its low
- Target is calculated using the same Risk:Reward ratio
⏰ Time-Based Exit
- If a trade is still active by a user-defined exit time (e.g. 15:15), the trade is closed
- Labels are plotted to show whether this exit was a profit or loss
🧩 User Inputs
- Start Time for signals
- Exit Time for open trades
- Bollinger Band Settings: Period and Std Dev
- Max Entries Per Day
- Risk:Reward Ratio: Dropdown for 1:1, 1:1.5, ..., 1:3
🎨 Visual Features
✅ BUY and SELL signals are plotted when valid conditions are detected
🟢 TP and 🔴 SL labels show trade outcome
🕒 TIME EXIT labels appear at user-set exit time with green/red coloring based on profitability
📉 Bollinger Bands plotted for visual context
📌 Notes:
- Designed for intraday trading, resets entry counter daily
- Uses bar_index > tradeBarIndex to avoid SL/TP being triggered on the same candle as entry
- Tracks only one trade at a time (tradeActive) — ensures clear, non-overlapping logic
[COG]Adaptive Volatility Bands# Adaptive Volatility Bands (AVB) Indicator Guide for Traders
## Special Acknowledgment 🙌
This script is inspired by and builds upon the foundational work of **DonovanWall**, a respected contributor to the trading community. His innovative approach to adaptive indicators has been instrumental in developing this advanced trading tool.
## What is the Adaptive Volatility Bands Indicator?
The Adaptive Volatility Bands (AVB) is a sophisticated technical analysis tool designed to help traders understand market dynamics by creating dynamic, responsive price channels that adapt to changing market conditions. Unlike traditional static indicators, this script uses advanced mathematical techniques to create flexible bands that adjust to market volatility in real-time.
## Key Features and Inputs
### 1. Price and Filtering Options
- **Price Source**: Determines the base price used for calculations (default is HLC3 - Average of High, Low, and Close)
- **Filter Poles**: Controls the smoothness of the indicator (1-9 poles)
- Lower values: More responsive, more noise
- Higher values: Smoother, but slower to react
### 2. Volatility and Band Settings
- **Sample Length**: Determines how many bars are used to calculate volatility (default 144)
- **Volatility Multiplier**: Adjusts the width of the main bands (default 1.414)
- **Outer Band Multiplier**: Controls the width of the outer bands (default 2.5)
- **Inner Band Ratio**: Positions the inner bands between the center and outer bands (default 0.25)
### 3. Advanced Processing Options
- **Lag Reduction Mode**: Helps reduce indicator delay
- **Fast Response Mode**: Makes the indicator more responsive to recent price changes
### 4. Signal and Visualization Options
- **Show Entry Signals**: Displays buy and sell signals
- **Signal Display Style**: Choose between labels or shapes
- **Range Filter**: Adds an additional filter for signal validation
## How the Indicator Works
The Adaptive Volatility Bands create a dynamic price channel with three key components:
1. **Center Line**: Represents the core trend direction
2. **Inner Bands**: Closer to the center line
3. **Outer Bands**: Wider bands that show broader price potential
### Color Dynamics
- The indicator uses a smart color gradient system
- Colors change based on price position within the bands
- Helps visualize bullish (green/blue) and bearish (red) market conditions
## Trading Strategies for Beginners
### Basic Entry Signals
- **Buy Signal**:
- Price touches the center line from below
- Candle is bullish (closes higher than it opens)
- Price is above the center line
- Trend is upward
- **Sell Signal**:
- Price touches the center line from above
- Candle is bearish (closes lower than it opens)
- Price is below the center line
- Trend is downward
### Risk Management Tips
1. Use the bands to identify:
- Potential trend changes
- Volatility levels
- Support and resistance areas
2. Combine with other indicators for confirmation
3. Always use stop-loss orders
4. Adjust parameters to match your trading style and asset
## When to Use This Indicator
Best suited for:
- Trending markets
- Swing trading
- Identifying potential entry and exit points
- Understanding market volatility
### Recommended Markets
- Stocks
- Forex
- Cryptocurrencies
- Futures
## Customization
The script offers extensive customization:
- Adjust smoothness
- Change band multipliers
- Modify color schemes
- Enable/disable features like lag reduction
## Important Considerations for Beginners
🚨 **Disclaimer**:
- No indicator guarantees profits
- Always practice with a demo account first
- Learn and understand the indicator before live trading
- Market conditions change, so continually adapt your strategy
## Getting Started
1. Add the script to your TradingView chart
2. Experiment with different settings
3. Backtest on historical data
4. Start with small positions
5. Continuously learn and improve
Happy Trading! 📈🔍

Forexsom MA Crossover SignalsA Trend-Following Trading Indicator for TradingView
Overview
This indicator plots two moving averages (MA) on your chart and generates visual signals when they cross, helping traders identify potential trend reversals. It is designed to be simple yet effective for both beginners and experienced traders.
Key Features
✅ Dual Moving Averages – Plots a Fast MA (default: 9-period) and a Slow MA (default: 21-period)
✅ Customizable MA Types – Choose between EMA (Exponential Moving Average) or SMA (Simple Moving Average)
✅ Clear Buy/Sell Signals – Displays "BUY" (green label) when the Fast MA crosses above the Slow MA and "SELL" (red label) when it crosses below
✅ Alerts – Get notified when new signals appear (compatible with TradingView alerts)
✅ Clean Visuals – Easy-to-read moving averages with adjustable colors
How It Works
Bullish Signal (BUY) → Fast MA crosses above Slow MA (suggests uptrend)
Bearish Signal (SELL) → Fast MA crosses below Slow MA (suggests downtrend)
Best Used For
✔ Trend-following strategies (swing trading, day trading)
✔ Confirming trend reversals
✔ Filtering trade entries in combination with other indicators
Customization Options
Adjust Fast & Slow MA lengths
Switch between EMA or SMA for smoother or more responsive signals
Why Use This Indicator?
Simple & Effective – No clutter, just clear signals
Works on All Timeframes – From scalping (1M, 5M) to long-term trading (4H, Daily)
Alerts for Real-Time Trading – Never miss a signal

RSI Disparity SignalRSI Disparity Signal Indicator
Overview:
This TradingView indicator detects when the RSI is significantly lower than its RSI-based moving average (RSI MA). Whenever the RSI is 20 points or more below the RSI MA, a signal (red dot) appears above the corresponding candlestick.
How It Works:
Calculates RSI using the default 14-period setting.
Calculates the RSI-based Moving Average (RSI MA) using a 14-period simple moving average (SMA).
Measures the disparity between the RSI and its MA.
Generates a signal when the RSI is 20 points or more below the RSI MA.
Plots a red circle above the candlestick whenever this condition is met.
Customization:
You can modify the RSI length and MA period to fit your trading strategy.
Change the plotshape() style to use different symbols like triangles or arrows.
Adjust the disparity threshold (currently set at 20) to make the signal more or less sensitive.
Use Case:
This indicator can help identify potentially oversold conditions where RSI is significantly below its average, signaling possible price reversals.

3x Supertrend + EMA200 Signal Buy/Sell [nsen]The indicator uses signals from three Supertrend lines to determine whether to trade Buy or Sell, with the assistance of a moving average for bias.
Buy/Sell signals are generated when the conditions are met:
A Buy signal is triggered when all three Supertrend lines indicate a bullish trend and are above the EMA.
A Sell signal is triggered when all three Supertrend lines indicate a bearish trend and are below the EMA.
Indicator ใช้สัญญาณจาก Supertrend ทั้งหมด 3 เส้น โดยใช้ในการกำหนดว่าจะเลือกเทรด Buy หรือ Sell โดยการใช้ moveing average เข้ามาช่วยในการ bias
แสดงสัญญาณ Buy/Sell เมื่อเข้าเงื่อนไข
- Supertrend ทั้ง 3 เส้นเป็นสัญญาณ Bullish และอยู่เหนือเส้น EMA จะเปิดสัญญาณ Buy
- Supertrend ทั้ง 3 เส้นเป็นสัญญาณ Bearish และอยู่ใต้เส้น EMA จะเปิดสัญญาณ Sell

Float Turnover Signal
The *Float Turnover Signal* indicator helps traders analyze the relationship between price changes and trading volume relative to the stock's free float. It generates signals based on turnover ratios, providing insights into liquidity-driven price movements.
**How It Works**
- The indicator calculates the **percentage change** in closing price from two days ago to the previous day.
- It retrieves the **free float** (the number of publicly available shares) from TradingView.
- It then calculates the **turnover percentage**, which represents the previous day's trading volume as a percentage of the free float.
- The **turnover ratio** is derived by dividing the price change percentage by the turnover percentage.
- Based on this ratio, the indicator generates **color-coded signals**:
- 🟢 **Green Signal** – Indicates a balanced turnover ratio (0.8 to 1.2), suggesting a stable price-volume relationship.
- 🟡 **Yellow Signal** – Indicates a near-optimal but not perfect ratio (0.6-0.8 or 1.2-1.5), suggesting caution.
**Customization & Features**
✅ **Adjustable Signal Display** – Users can choose how many recent bars will display signals using the `"Number of Bars to Display Signal"` setting.
✅ **Works on Any Timeframe** – The indicator adapts to different chart resolutions.
✅ **Helps Identify Volume-Driven Moves** – Ideal for spotting potential breakouts, liquidity shifts, and confirming price action validity.

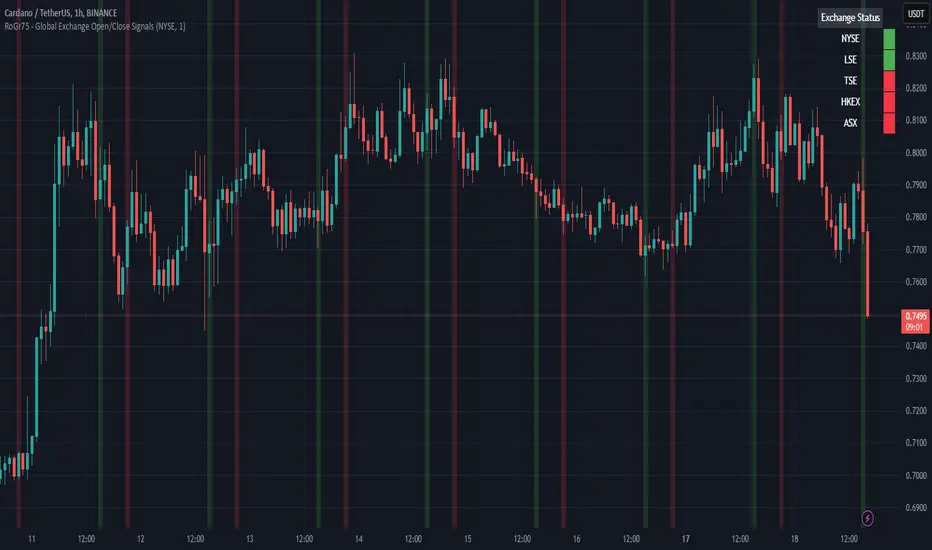
RoGr75 - Global Exchange Open/Close SignalsGlobal Exchange Open/Close Signals Indicator
This indicator helps traders track market hours for major global exchanges (NYSE, LSE, TSE, HKEX, and ASX) with these key features:
• Real-time Status Dashboard: Shows which exchanges are currently open/closed with an easy-to-read color-coded display (Green = Open, Red = Closed)
• Visual Market Open/Close Signals: Displays gradient background lines when your selected exchange opens (green) or closes (red)
• Timezone Adjustment: Easily adapt the indicator to your local timezone using the UTC offset setting
Supported Exchanges and Trading Hours (UTC):
• NYSE: 13:30 - 20:00 (9:30 AM - 4:00 PM ET)
• LSE: 08:00 - 16:30 (8:00 AM - 4:30 PM London)
• TSE: 00:00 - 06:30 (9:00 AM - 3:30 PM Tokyo)
• HKEX: 01:30 - 08:00 (9:30 AM - 4:00 PM HK)
• ASX: 00:00 - 06:00 (10:00 AM - 4:00 PM Sydney)
Settings:
• Select Exchange: Choose which exchange to monitor for open/close signals
• Show Dashboard: Toggle the exchange status dashboard on/off
• User Timezone Offset: Adjust the display to your local timezone (in UTC)
Use Cases:
• Monitor multiple exchange hours simultaneously
• Get visual alerts for market opens and closes
• Coordinate trading across different time zones
• Plan entries and exits around market hours
• Manage global trading portfolios effectively
Note: The indicator handles timezone conversions and markets crossing midnight automatically. Times are based on standard trading sessions and may not reflect holidays or special trading hours.
[COG] Adaptive Squeeze Intensity 📊 Adaptive Squeeze Intensity (ASI) Indicator
🎯 Overview
The Adaptive Squeeze Intensity (ASI) indicator is an advanced technical analysis tool that combines the power of volatility compression analysis with momentum, volume, and trend confirmation to identify high-probability trading opportunities. It quantifies the degree of price compression using a sophisticated scoring system and provides clear entry signals for both long and short positions.
⭐ Key Features
- 📈 Comprehensive squeeze intensity scoring system (0-100)
- 📏 Multiple Keltner Channel compression zones
- 📊 Volume analysis integration
- 🎯 EMA-based trend confirmation
- 🎨 Proximity-based entry validation
- 📱 Visual status monitoring
- 🎨 Customizable color schemes
- ⚡ Clear entry signals with directional indicators
🔧 Components
1. 📐 Squeeze Intensity Score (0-100)
The indicator calculates a total squeeze intensity score based on four components:
- 📊 Band Convergence (0-40 points): Measures the relationship between Bollinger Bands and Keltner Channels
- 📍 Price Position (0-20 points): Evaluates price location relative to the base channels
- 📈 Volume Intensity (0-20 points): Analyzes volume patterns and thresholds
- ⚡ Momentum (0-20 points): Assesses price momentum and direction
2. 🎨 Compression Zones
Visual representation of squeeze intensity levels:
- 🔴 Extreme Squeeze (80-100): Red zone
- 🟠 Strong Squeeze (60-80): Orange zone
- 🟡 Moderate Squeeze (40-60): Yellow zone
- 🟢 Light Squeeze (20-40): Green zone
- ⚪ No Squeeze (0-20): Base zone
3. 🎯 Entry Signals
The indicator generates entry signals based on:
- ✨ Squeeze release confirmation
- ➡️ Momentum direction
- 📊 Candlestick pattern confirmation
- 📈 Optional EMA trend alignment
- 🎯 Customizable EMA proximity validation
⚙️ Settings
🔧 Main Settings
- Base Length: Determines the calculation period for main indicators
- BB Multiplier: Sets the Bollinger Bands deviation multiplier
- Keltner Channel Multipliers: Three separate multipliers for different compression zones
📈 Trend Confirmation
- Four customizable EMA periods (default: 21, 34, 55, 89)
- Optional trend requirement for entry signals
- Adjustable EMA proximity threshold
📊 Volume Analysis
- Customizable volume MA length
- Adjustable volume threshold for signal confirmation
- Option to enable/disable volume analysis
🎨 Visualization
- Customizable bullish/bearish colors
- Optional intensity zones display
- Status monitor with real-time score and state information
- Clear entry arrows and background highlights
💻 Technical Code Breakdown
1. Core Calculations
// Base calculations for EMAs
ema_1 = ta.ema(close, ema_length_1)
ema_2 = ta.ema(close, ema_length_2)
ema_3 = ta.ema(close, ema_length_3)
ema_4 = ta.ema(close, ema_length_4)
// Proximity calculation for entry validation
ema_prox_raw = math.abs(close - ema_1) / ema_1 * 100
is_close_to_ema_long = close > ema_1 and ema_prox_raw <= prox_percent
```
### 2. Squeeze Detection System
```pine
// Bollinger Bands setup
BB_basis = ta.sma(close, length)
BB_dev = ta.stdev(close, length)
BB_upper = BB_basis + BB_mult * BB_dev
BB_lower = BB_basis - BB_mult * BB_dev
// Keltner Channels setup
KC_basis = ta.sma(close, length)
KC_range = ta.sma(ta.tr, length)
KC_upper_high = KC_basis + KC_range * KC_mult_high
KC_lower_high = KC_basis - KC_range * KC_mult_high
```
### 3. Scoring System Implementation
```pine
// Band Convergence Score
band_ratio = BB_width / KC_width
convergence_score = math.max(0, 40 * (1 - band_ratio))
// Price Position Score
price_range = math.abs(close - KC_basis) / (KC_upper_low - KC_lower_low)
position_score = 20 * (1 - price_range)
// Final Score Calculation
squeeze_score = convergence_score + position_score + vol_score + mom_score
```
### 4. Signal Generation
```pine
// Entry Signal Logic
long_signal = squeeze_release and
is_momentum_positive and
(not use_ema_trend or (bullish_trend and is_close_to_ema_long)) and
is_bullish_candle
short_signal = squeeze_release and
is_momentum_negative and
(not use_ema_trend or (bearish_trend and is_close_to_ema_short)) and
is_bearish_candle
```
📈 Trading Signals
🚀 Long Entry Conditions
- Squeeze release detected
- Positive momentum
- Bullish candlestick
- Price above relevant EMAs (if enabled)
- Within EMA proximity threshold (if enabled)
- Sufficient volume confirmation (if enabled)
🔻 Short Entry Conditions
- Squeeze release detected
- Negative momentum
- Bearish candlestick
- Price below relevant EMAs (if enabled)
- Within EMA proximity threshold (if enabled)
- Sufficient volume confirmation (if enabled)
⚠️ Alert Conditions
- 🔔 Extreme squeeze level reached (score crosses above 80)
- 🚀 Long squeeze release signal
- 🔻 Short squeeze release signal
💡 Tips for Usage
1. 📱 Use the status monitor to track real-time squeeze intensity and state
2. 🎨 Pay attention to the color gradient for trend direction and strength
3. ⏰ Consider using multiple timeframes for confirmation
4. ⚙️ Adjust EMA and proximity settings based on your trading style
5. 📊 Use volume analysis for additional confirmation in liquid markets
📝 Notes
- 🔧 The indicator combines multiple technical analysis concepts for robust signal generation
- 📈 Suitable for all tradable markets and timeframes
- ⭐ Best results typically achieved in trending markets with clear volatility cycles
- 🎯 Consider using in conjunction with other technical analysis tools for confirmation
⚠️ Disclaimer
This technical indicator is designed to assist in analysis but should not be considered as financial advice. Always perform your own analysis and risk management when trading.

Adaptive Resonance Oscillator [AlgoAlpha]Introducing the Adaptive Resonance Oscillator , an advanced momentum-based oscillator designed to dynamically adjust to changing market conditions. This innovative indicator detects market frequency through a Hilbert Transform approach, adapting in real-time to identify overbought and oversold conditions with improved accuracy. With built-in divergence detection, trend analysis, and customizable smoothing, this tool is perfect for traders looking to refine their entries and exits based on adaptive oscillation mechanics.
🚀 Key Features :
🔹 Adaptive Frequency Detection – Uses Hilbert Transform principles to dynamically determine market cycle length for precise oscillator calculation.
⚙️ Customizable Smoothing – Option to apply a Hull Moving Average (HMA) for enhanced signal clarity.
📈 Divergence Detection – Identifies bullish and bearish divergences with visual markers, helping traders spot early trend reversals.
🟢 Overbought & Oversold Signals – Highlights extreme momentum conditions with adjustable thresholds.
🔔 Real-Time Alerts – Get notified for crossovers, divergences, and strong trend shifts directly on your TradingView chart.
🎨 Fully Customizable Appearance – Modify colors, divergence sensitivity, and smoothing options to fit your trading style.
🛠 How to Use :
Add the Adaptive Resonance Oscillator to your TradingView chart by clicking the ★ to favorite it.
Monitor the Charts , switch between smoothed and I smoothed modes to identify trend and price swings, use divergences and reversal signals for potential entry/exits.
Set alerts for bullish/bearish crossovers and divergence signals to stay ahead of market moves.
⚙ How It Works :
The indicator begins by applying a Hilbert Transform frequency estimation to the price series, identifying the dominant market cycle length. This is used to calculate a period for the RSI that matches its resonant frequency with the dominant market frequency, dynamically adjusting the Oscillator. The oscillator then applies an optional Hull Moving Average (HMA) smoothing for signal refinement. Additionally, the indicator scans for bullish and bearish divergences by comparing oscillator movements against price action, plotting signals accordingly. When overbought/oversold conditions or divergence events occur, alerts are triggered to notify the trader in real time.

Smart Money Breakout Signals [AlgoAlpha]Introducing the Smart Money Breakout Signals, a cutting-edge trading indicator designed to identify key structural shifts and breakout opportunities in the market. This tool leverages a blend of smart money concepts like Break of Structure (BOS) and Change of Character (CHoCH) to provide traders with actionable insights into market direction and potential entry or exit points.
Key Features :
✨ Market Structure Analysis : Automatically detects and labels BOS and CHoCH for trend confirmation and reversals.
🎨 Customizable Visualization : Tailor bullish and bearish colors for breakout lines and signals to suit your preferences.
📊 Dynamic Take-Profit Targets : Displays three tiered take-profit levels based on breakout volatility.
🔔 Real-Time Alerts : Stay ahead of the game with notifications for bullish and bearish breakouts.
📋 Performance Dashboard : Monitor signal statistics, including win rates and total signals, directly on your chart.
How to Use :
Add the Indicator : Add the script to your favourites ⭐ and customize settings like market structure horizon and confirmation type.
Monitor Breakouts : Observe BOS and CHoCH labels to identify potential trend shifts. Use the breakout lines and tiered take-profit levels to plan trades effectively.
Set Alerts : Enable alerts for bullish or bearish breakouts to act on opportunities without constant monitoring.
How It Works :
The indicator identifies market structure by analyzing pivot highs and lows over a user-defined time horizon. A breakout is confirmed based on either candle closes or wicks surpassing previous pivot points. Upon detection, the script generates signals with breakout lines and calculates take-profit targets based on the distance from the breakout level. A built-in dashboard tracks performance metrics like total signals and win rates, giving traders real-time feedback on strategy effectiveness.

RSI OB/OS Strategy Analyzer█ OVERVIEW
The RSI OB/OS Strategy Analyzer is a comprehensive trading tool designed to help traders identify and evaluate overbought/oversold reversal opportunities using the Relative Strength Index (RSI). It provides visual signals, performance metrics, and a detailed table to analyze the effectiveness of RSI-based strategies over a user-defined lookback period.
█ KEY FEATURES
RSI Calculation
Calculates RSI with customizable period (default 14)
Plots dynamic overbought (70) and oversold (30) levels
Adds background coloring for OB/OS regions
Reversal Signals
Identifies signals based on RSI crossing OB/OS levels
Two entry strategies available:
Revert Cross: Triggers when RSI exits OB/OS zone
Cross Threshold: Triggers when RSI enters OB/OS zone
Trade Direction
Users can select a trade bias:
Long: Focuses on oversold reversals (bullish signals)
Short: Focuses on overbought reversals (bearish signals)
Performance Metrics
Calculates three key statistics for each lookback period:
Win Rate: Percentage of profitable trades
Mean Return: Average return across all trades
Median Return: Median return across all trades
Metrics calculated as percentage changes from entry price
Visual Signals
Dual-layer signal display:
BUY: Green triangles + text labels below price
SELL: Red triangles + text labels above price
Semi-transparent background highlighting in OB/OS zones
Performance Table
Interactive table showing metrics for each lookback period
Color-coded visualization:
Win Rate: Gradient from red (low) to green (high)
Returns: Green for positive, red for negative
Time Filtering
Users can define a specific time window for the indicator to analyze trades, ensuring that performance metrics are calculated only for the desired period.
Customizable Display
Adjustable table font sizes: Auto/Small/Normal/Large
Toggle option for table visibility
█ PURPOSE
The RSI OB/OS Strategy Analyzer helps traders:
Identify mean-reversion opportunities through RSI extremes
Backtest entry strategy effectiveness across multiple time horizons
Optimize trade timing through visual historical performance data
Quickly assess strategy robustness with color-coded metrics
█ IDEAL USERS
Counter-Trend Traders: Looking to capitalize on RSI extremes
Systematic Traders: Needing quantitative strategy validation
Educational Users: Studying RSI behavior in different market conditions
Multi-Timeframe Analysts: Interested in forward returns analysis

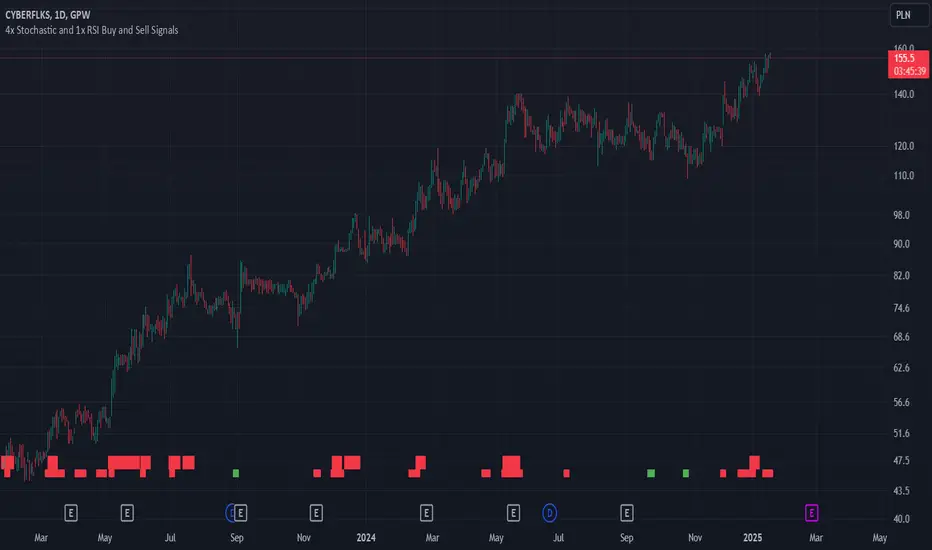
4x Stochastic and 1x RSI Buy and Sell SignalsBuy signal (green), when Stochastic 9, 14, 40 and 60 are bellow 20.
Sell signal (red), when Stochastic 9, 14, 40 and 60 are above 80.
Buy signal is larger, when RSI is also bellow 30.
Sell signal is larger, when RSI is also above 70.
Using RSI is optional and can be disabled.
Use this signals when confirmed by another indicators, like support and resistance levels, EMAs and fundamental analysis.
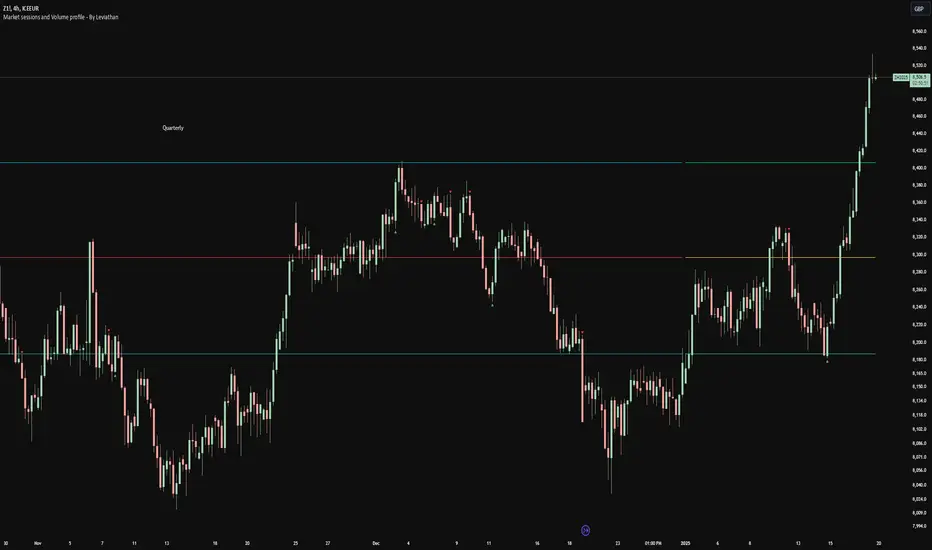
Volume profile [Signals] - By Leviathan [Mindyourbuisness]Market Sessions and Volume Profile with Sweep Signals - Based on Leviathan's Volume Profile
This indicator is an enhanced version of Leviathan's Volume Profile indicator, adding session-based value area analysis and sweep detection signals. It combines volume profile analysis with market structure concepts to identify potential reversal opportunities.
Features
- Session-based volume profiles (Daily, Weekly, Monthly, Quarterly, Yearly)
- Forex sessions support (Tokyo, London, New York)
- Value Area analysis with POC, VAH, and VAL levels
- Extended level visualization for the last completed session
- Sweep detection signals for key value area levels
Sweep Signals Explanation
The indicator detects two types of sweeps at VAH, VAL, and POC levels:
Bearish Sweeps (Red Triangle Down)
Conditions:
- Price makes a high above the level (VAH/VAL/POC)
- Closes below the level
- Closes below the previous candle's low
- Previous candle must be bullish
Trading Implication: Suggests a failed breakout and potential reversal to the downside. These sweeps often indicate stop-loss hunting above key levels followed by institutional selling.
Bullish Sweeps (Green Triangle Up)
Conditions:
- Price makes a low below the level (VAH/VAL/POC)
- Closes above the level
- Closes above the previous candle's high
- Previous candle must be bearish
Trading Implication: Suggests a failed breakdown and potential reversal to the upside. These sweeps often indicate stop-loss hunting below key levels followed by institutional buying.
Trading Guidelines
1. Use sweep signals in conjunction with the overall trend
2. Look for additional confirmation like:
- Volume surge during the sweep
- Price action patterns
- Support/resistance levels
3. Consider the session's volatility and time of day
4. More reliable signals often occur at VAH and VAL levels
5. POC sweeps might indicate stronger reversals due to their significance as fair value levels
Notes
- The indicator works best on higher timeframes (1H and above)
- Sweep signals are more reliable during active market hours
- Consider using multiple timeframe analysis for better confirmation
- Past performance is not indicative of future results
Credits: Original Volume Profile indicator by Leviathan
Adaptive Fourier Transform Supertrend [QuantAlgo]Discover a brand new way to analyze trend with Adaptive Fourier Transform Supertrend by QuantAlgo , an innovative technical indicator that combines the power of Fourier analysis with dynamic Supertrend methodology. In essence, it utilizes the frequency domain mathematics and the adaptive volatility control technique to transform complex wave patterns into clear and high probability signals—ideal for both sophisticated traders seeking mathematical precision and investors who appreciate robust trend confirmation!
🟢 Core Architecture
At its core, this indicator employs an adaptive Fourier Transform framework with dynamic volatility-controlled Supertrend bands. It utilizes multiple harmonic components that let you fine-tune how market frequencies influence trend detection. By combining wave analysis with adaptive volatility bands, the indicator creates a sophisticated yet clear framework for trend identification that dynamically adjusts to changing market conditions.
🟢 Technical Foundation
The indicator builds on three innovative components:
Fourier Wave Analysis: Decomposes price action into primary and harmonic components for precise trend detection
Adaptive Volatility Control: Dynamically adjusts Supertrend bands using combined ATR and standard deviation
Harmonic Integration: Merges multiple frequency components with decreasing weights for comprehensive trend analysis
🟢 Key Features & Signals
The Adaptive Fourier Transform Supertrend transforms complex wave calculations into clear visual signals with:
Dynamic trend bands that adapt to market volatility
Sophisticated cloud-fill visualization system
Strategic L/S markers at key trend reversals
Customizable bar coloring based on trend direction
Comprehensive alert system for trend shifts
🟢 Practical Usage Tips
Here's how you can get the most out of the Adaptive Fourier Transform Supertrend :
1/ Setup:
Add the indicator to your favorites, then apply it to your chart ⭐️
Start with close price as your base source
Use standard Fourier period (14) for balanced wave detection
Begin with default harmonic weight (0.5) for balanced sensitivity
Start with standard Supertrend multiplier (2.0) for reliable band width
2/ Signal Interpretation:
Monitor trend band crossovers for potential signals
Watch for convergence of price with Fourier trend
Use L/S markers for trade entry points
Monitor bar colors for trend confirmation
Configure alerts for significant trend reversals
🟢 Pro Tips
Fine-tune Fourier parameters for optimal sensitivity:
→ Lower Base Period (8-12) for more reactive analysis
→ Higher Base Period (15-30) to filter out noise
→ Adjust Harmonic Weight (0.3-0.7) to control shorter trend influence
Customize Supertrend settings:
→ Lower multiplier (1.5-2.0) for tighter bands
→ Higher multiplier (2.0-3.0) for wider bands
→ Adjust ATR length based on market volatility
Strategy Enhancement:
→ Compare signals across multiple timeframes
→ Combine with volume analysis
→ Use with support/resistance levels
→ Integrate with other momentum indicators

Normalized Price ComparisonNormalized Price Comparison Indicator Description
The "Normalized Price Comparison" indicator is designed to provide traders with a visual tool for comparing the price movements of up to three different financial instruments on a common scale, despite their potentially different price ranges. Here's how it works:
Features:
Normalization: This indicator normalizes the closing prices of each symbol to a scale between 0 and 1 over a user-defined period. This normalization process allows for the comparison of price trends regardless of the absolute price levels, making it easier to spot relative movements and trends.
Crossing Alert: It features an alert functionality that triggers when the normalized price lines of the first two symbols (Symbol 1 and Symbol 2) cross each other. This can be particularly useful for identifying potential trading opportunities when one asset's relative performance changes against another.
Customization: Users can input up to three symbols for analysis. The normalization period can be adjusted, allowing flexibility in how historical data is considered for the scaling process. This period determines how many past bars are used to calculate the minimum and maximum prices for normalization.
Visual Representation: The indicator plots these normalized prices in a separate pane below the main chart. Each symbol's normalized price is represented by a distinct colored line:
Symbol 1: Blue line
Symbol 2: Red line
Symbol 3: Green line
Use Cases:
Relative Performance Analysis: Ideal for investors or traders who want to compare how different assets are performing relative to each other over time, without the distraction of absolute price differences.
Divergence Detection: Useful for spotting divergences where one asset might be outperforming or underperforming compared to others, potentially signaling changes in market trends or investment opportunities.
Crossing Strategy: The alert for when Symbol 1 and Symbol 2's normalized lines cross can be used as a part of a trading strategy, signaling potential entry or exit points based on relative price movements.
Limitations:
Static Alert Messages: Due to Pine Script's constraints, the alert messages cannot dynamically include the names of the symbols being compared. The alert will always mention "Symbol 1" and "Symbol 2" crossing.
Performance: Depending on the timeframe and the number of symbols, performance might be affected, especially on lower timeframes with high data frequency.
This indicator is particularly beneficial for those interested in multi-asset analysis, offering a streamlined way to observe and react to relative price movements in a visually coherent manner. It's a powerful tool for enhancing your trading or investment analysis by focusing on trends and relationships rather than raw price data.

Trend Heuristics (+Signals)Trend Heuristics - Enhanced Rolling VWAP with Smart Signals
This indicator is an enhanced version of the Rolling VWAP (RVWAP) concept, originally based on PineCoders' ConditionalAverages library. It combines volume-weighted average price analysis with advanced signal detection for both sweeps and breakouts.
Core Features
1. Rolling VWAP System
- Implements a dynamic rolling VWAP that adapts to different timeframes
- Includes standard deviation bands for volatility measurement
- Offers flexible time period settings (fixed or auto-adjusting)
- Provides customizable visual elements including bands and fills
2. Dual Signal System
Sweep Signals
Detects high-probability reversal points with these conditions:
- Bullish Sweep:
- Opens above upper band
- Tests below upper band (low)
- Closes above upper band
- Shows stronger lower wick
- Closes above previous high
- Has favorable close position (upper 50% of candle)
- Bearish Sweep:
- Opens below lower band
- Tests above lower band (high)
- Closes below lower band
- Shows stronger upper wick
- Closes below previous low
- Has favorable close position (lower 50% of candle)
Breakout Signals
Identifies potential trend changes with these conditions:
- Bullish Breakout:
- Opens below VWAP
- Closes above upper band
- Indicates strong momentum shift upward
- Bearish Breakout:
- Opens above VWAP
- Closes below lower band
- Indicates strong momentum shift downward
Technical Details
Base Components
- Built upon PineCoders' ConditionalAverages library
- Incorporates custom alert system via CustomAlertLib
- Uses standard deviation for band calculations
Customization Options
- Adjustable standard deviation multiplier
- Flexible time period settings
- Independent controls for sweep and breakout signals
- Customizable visual elements (colors, sizes, positions)
- Custom alert message formatting
Use Cases
1. Trend Following:
- Use VWAP as dynamic support/resistance
- Monitor breakout signals for trend changes
2. Mean Reversion:
- Use sweep signals for counter-trend opportunities
- Standard deviation bands for range identification
3. Volume Analysis:
- VWAP provides volume-weighted price levels
- Helps identify significant price levels
Notes
- Best performed on liquid instruments with consistent volume
- Most effective on timeframes from 1hours to 4 hours and 1D, anything greater isn't very good
- Recommended to use in conjunction with other technical analysis tools
- Signals can be filtered based on higher timeframe trends
Credits
- Original Rolling VWAP concept by PineCoders