HMA Trend Line (Croc Signal Line)HMA Trend Line (Croc Signal Line) — The Ultimate Hull Moving Average Trend Indicator
Full English description here:
What is the HMA Trend Line (Croc Signal Line)?
The HMA Trend Line (Croc Signal Line) is a powerful, adaptive trend indicator for TradingView, based on the Hull Moving Average (HMA). This indicator is designed to help traders identify real market trends with less lag and reduced noise compared to traditional moving averages like SMA (Simple Moving Average) and EMA (Exponential Moving Average).
Why use the HMA Trend Line?
+ Faster Trend Detection: The Hull Moving Average (HMA) responds more quickly to price action, giving you earlier buy and sell signals.
+ Smoother and Cleaner: It provides a visually clean trend line that avoids the choppiness of classic EMAs and SMAs.
+ Reduced Lag: The HMA Trend Line follows the market closer, helping you avoid late entries or exits and spot trend reversals sooner.
+ Dynamic Support and Resistance: Use the line as a dynamic support or resistance to manage trades and identify pullbacks or breakouts.
What does “Croc Signal Line” mean?
The “Croc” in Croc Signal Line stands for:
+ Clean
+ Responsive
+ Optimized
+ Curve
This highlights the unique advantage of this indicator: a curve that is both fast-reacting and smooth, helping traders focus on real trends and filter out market noise.
How does the Hull Moving Average (HMA) work?
The HMA was developed by Alan Hull and uses weighted moving averages and a unique calculation to deliver both responsiveness and smoothness. Unlike standard moving averages, the HMA reacts faster to new price moves and avoids false signals in ranging or volatile markets.
How to use the HMA Trend Line (Croc Signal Line) on TradingView?
+ Watch for price crossing above the trend line for potential bullish signals, and below for bearish signals.
+ Use on any timeframe: from 1-minute scalping to daily, weekly, or even monthly charts.
+ Works with all asset classes: Forex, stocks, indices, cryptocurrencies, commodities, and futures.
+ Combine with other indicators (like Stochastics, RSI, or volume) for confirmation and to build your unique trading strategy.
+ Adjust the Signal Line Period for your market and style: shorter periods for faster markets, longer for smoother trends.
Who should use this indicator?
+ Day traders, swing traders, and long-term investors looking for reliable, actionable trend signals.
+ Anyone seeking a cleaner, more responsive alternative to the classic moving averages.
+ Traders who want a simple, visually clear way to filter out market noise and see real price direction.
Disclaimer:
This indicator is for educational and study purposes only. Please perform your own backtesting and analysis before using it in live trading. This script does not constitute financial advice. Use at your own risk.
--------
In den Scripts nach "signal" suchen

Velez Price Action Signals (with 20 & 200 SMA)Velez Price Action Signals – With 20 & 200 SMA Overlay
This TradingView Pine Script is a clean and powerful reversal signal tool inspired by Oliver Velez’s price action philosophy, enhanced with trend context via two Simple Moving Averages.
🔍 Signal Logic
Buy Signal:
Current candle sweeps below the previous 5-bar low (liquidity grab).
Candle is bullish (close > open).
The lower wick is significantly larger than the body (e.g. ratio > 1.5).
Sell Signal:
Current candle sweeps above the previous 5-bar high.
Candle is bearish (close < open).
The upper wick is significantly larger than the body.
Signals appear as BUY/SELL labels on the chart (non-repainting).

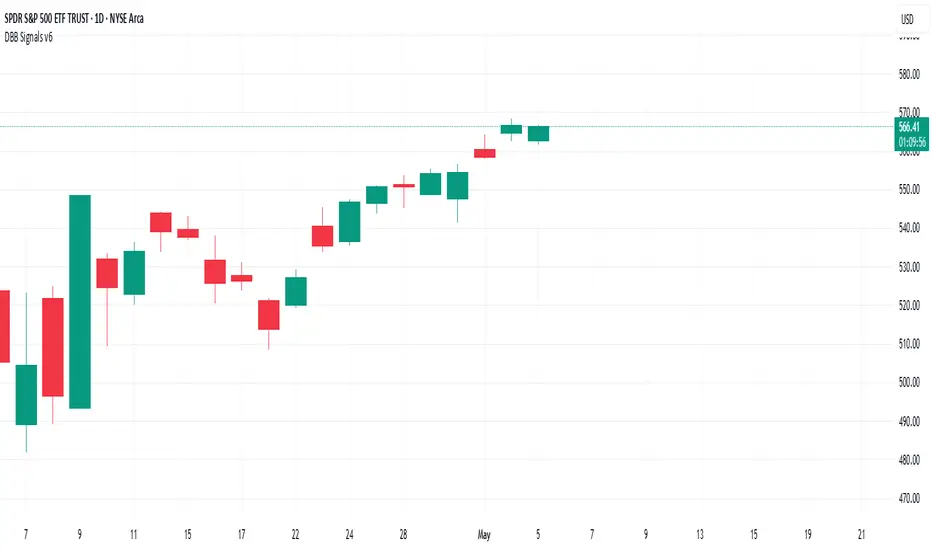
Darvas Box Breakout Signals v6 (Manus)Purpose:
This script is designed for TradingView to automatically identify potential "Darvas Boxes" on your price chart and signal when the price breaks out of these boxes.
How it Works:
Finds Highs: It looks back over a set number of bars (default is 20, but you can change this) to find the highest price point.
Confirms Box Top: It waits until the price stays below that high point for a specific number of bars (default is 3) to confirm the top of the box.
Confirms Box Bottom: After the top is confirmed, it looks for the lowest price reached and waits until the price stays above that low point for the same number of bars (3) to confirm the bottom of the box.
Draws Box (Optional): If enabled in the settings, it draws lines on the chart representing the top and bottom of the confirmed box.
What Signals It Shows:
Breakout Signal: When the price closes above the top line of a confirmed box, it plots a green upward-pointing triangle above that price bar. This suggests the stock might be starting a move higher.
Breakdown Signal: When the price closes below the bottom line of a confirmed box, it plots a red downward-pointing triangle below that price bar. This suggests the stock might be starting a move lower.
Key Features:
Uses the Darvas Box theory logic.
Provides clear visual signals for potential entries based on breakouts or breakdowns.
Allows customization of the lookback period and confirmation bars via the indicator settings.
Written in Pine Script version 6.
Remember, this script just provides signals based on price patterns; it doesn't predict the future or guarantee profits. It should be used as one tool within the larger trading plan we discussed, especially considering risk management.
Market Structure Confluence [AlgoAlpha]OVERVIEW
This script is called "Market Structure Confluence" and it combines classic market structure analysis with a dynamic volatility-based band system to detect shifts in trend and momentum more reliably. It tracks key swing points (higher highs, higher lows, lower highs, lower lows) to define the trend, then overlays a basis and ATR-smoothed volatility bands to catch rejection signals and highlight potential inflection points in the market.
CONCEPTS
Market structure is the foundation of price action trading, focusing on the relationship between successive highs and lows to understand trend conditions. Break of Structure (BOS) and Change of Character (CHoCH) events are important because they signal when a market might be shifting direction. This script enhances traditional structure by integrating volatility bands, which act like dynamic support/resistance zones based on ATR, allowing it to capture momentum surges and rejections beyond just structural shifts.
FEATURES
Swing Detection: It detects and labels Higher Highs (HH), Higher Lows (HL), Lower Highs (LH), and Lower Lows (LL) based on user-defined time horizons, helping traders quickly spot the trend direction.
BOS and CHoCH Lines: When a previous swing point is broken, the script automatically plots a Break of Structure (BOS) line. If the break represents a major trend reversal (a CHoCH), it is marked differently to separate simple breakouts from real trend changes.
Rejection Signals: Special arrows plot when price pierces a band and then pulls back, suggesting a potential trap move or rejection signal in the direction of the new structure.
Alerts: Built-in alerts for structure breaks, CHoCHs, swing points, rejections at bands, and trend flips make it easy to automate setups without manually watching the chart.
USAGE
Set your preferred swing detection size depending on your timeframe and trading style — smaller numbers for intraday, larger numbers for swing trading. Choose whether you want BOS/CHoCH confirmed by candle closes or by wick breaks. Use the volatility band settings to fine-tune how tightly or loosely the bands hug the price, adjusting sensitivity based on market conditions. When a BOS or CHoCH occurs, or when a rejection happens at the bands, the script will highlight it clearly and optionally trigger alerts. Watch for combinations where both structure breaks and volatility band rejections happen together — those are high-quality trade signals. This setup works best when used with basic trend filtering and higher timeframe confirmation.

Bitcoin as % Global M2 signalThis script provides signal system:
Buy signal: each time the YoY of the Global M2 rises more than 2.5% while the distance between the bitcoin price as a percentage of the Global M2 is below its yearly SMA.
Sell signal: the distance between the bitcoin price as a percentage of the Global M2 and its yearly SMA is > 0.7
This is a very simple system, but it seems to work pretty well to ride the bitcoin price cycle wave.
The parameters are hard coded but they can be easily changed to test different levels for both the buy and sell signals.

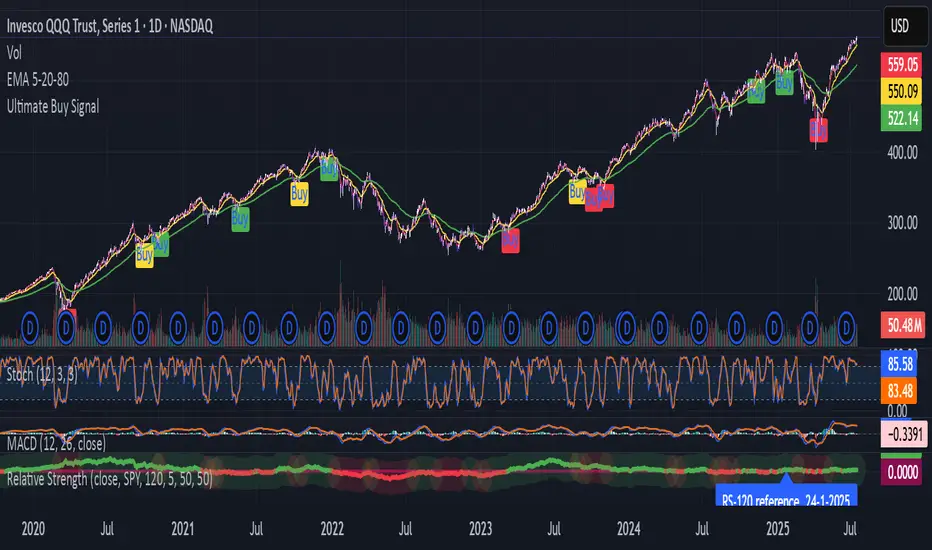
SPY Trend-Based Buy Signals🔹 Overview
This indicator identifies potential buy signals on any asset by combining MACD and Stochastic Oscillator crossovers, while using the SPY’s trend (via exponential moving averages) as a broader market filter.
It helps traders stay aligned with macro momentum and avoid counter-trend entries.
🔍 How it works
SPY Trend Filter (Daily Timeframe):
Pulls SPY (S&P 500 ETF) data using EMAs (5, 20, 80)
Categorizes SPY market trend with color codes:
🟢 Green: Strong uptrend (EMA5 > EMA20 > EMA80)
🟡 Yellow: Potential uptrend / early momentum (EMA5 < EMA20 > EMA80)
🔴 Red: Downtrend (EMA5 < EMA20 < EMA80)
🔵 Blue: Possible trend reversal or mixed trend (EMA5 > EMA20 < EMA80)
Buy Signal Conditions (Combined Logic):
A signal is only triggered when:
- SPY trend is either yellow or blue (indicating a neutral-to-bullish or early recovery environment)
-The Stochastic Oscillator's %D line is below 50, showing possible upside
- A bullish MACD crossover occurs on the current symbol
🟢 Green signal: MACD crossover occurs below 0 (early reversal)
🟠 Orange signal: MACD crossover occurs above 0 (momentum continuation)
📈 Visual Output
🟢 Green label below the bar when an early reversal setup occurs
🟠 Orange label above the bar when a trend continuation signal appears
✅ Best Use Case
Ideal for:
Swing traders and position traders
LEAPS (long-term options) traders aligning entries with SPY trend
Anyone seeking clean, contextual entries filtered by market momentum
⚠️ Note: This indicator is most effective when used on fundamentally strong stocks that are sector leaders with solid earnings growth and market presence. Use technical signals as a complement to quality fundamentals.
ℹ️ Clarification: The moving averages displayed on the chart (e.g., on QQQ) are for visual reference only, to help users understand the color logic of the SPY trend filter. The actual logic and signals are based on SPY’s moving averages, regardless of the charted symbol.
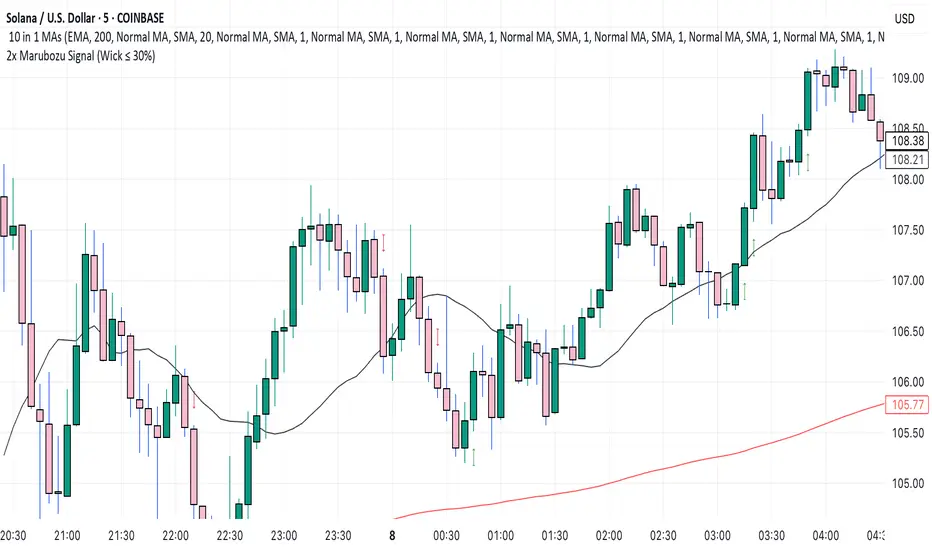
2x Marubozu Signal (Wick ≤ 30%)The 2x Marubozu Signal (Wick ≤ 30%) is a powerful, momentum-based price action indicator designed to catch strong bullish or bearish trends early. It scans for two consecutive Marubozu-style candles (where wicks are ≤ 30% of the total candle size) to identify moments of solid conviction from buyers or sellers.
This indicator detects:
Bullish Signal: Two green candles in a row, both with tiny wicks (≤ 30% of total candle size), indicating strong buying pressure and momentum.
Bearish Signal: Two red candles in a row, both with tiny wicks (≤ 30%), signaling dominant selling pressure.
The signal appears on the second candle — confirming the continuation move after initial momentum.
Key Features:
🔍 Wick Ratio Filter: Only triggers if both candles have upper and lower wicks less than or equal to 30% of the full candle range (High - Low).
📈 Visual Signal Arrows:
Green Up Arrow on bullish 2x Marubozu
Red Down Arrow on bearish 2x Marubozu
⚙️ Clean and Lightweight: No lag, perfect for intraday, swing, or trend-based strategies.
🎯 Use Case:
Trend Confirmation: Enter after the second strong Marubozu to ride breakout moves.
Momentum Filter: Combine with your existing strategy to filter only high-conviction price action setups.
Reversal Spotting: Catch reversals at key support/resistance when Marubozus form.
🧠 Pro Tips:
Works best on 15m–1D charts, especially after consolidation.
Combine with support/resistance, volume, or EMA/SMA zones for confirmation.
Avoid overtrading in choppy zones—this is a momentum-only tool.
🚀 Who’s It For?
Price Action Traders
Scalpers & Swing Traders
Trend-followers
Crypto, Forex, Stocks
📌 Author Note:
This indicator was crafted for traders who trust pure candle structure over lagging indicators. If you respect momentum, this is your edge.
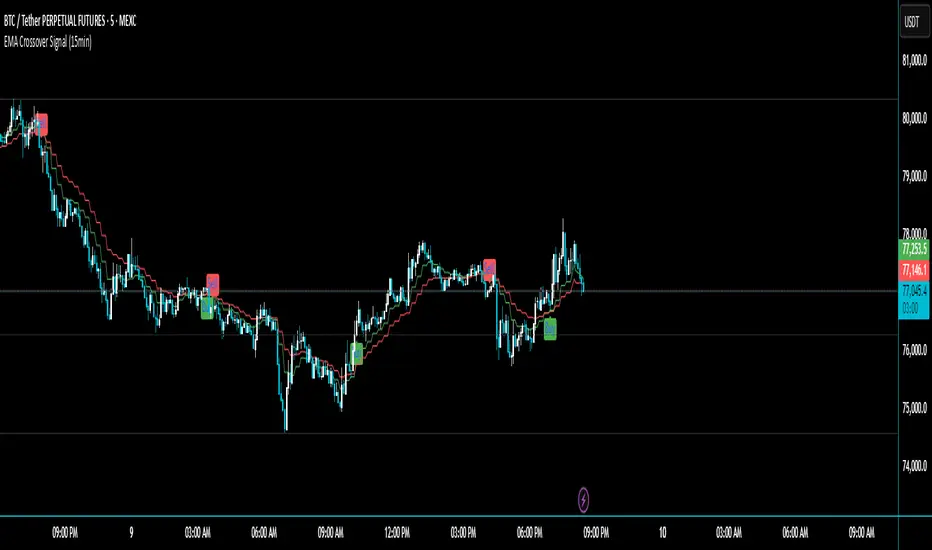
EMA Crossover Signal (15min)📈 EMA Crossover Signal (15min)
This indicator generates Buy and Sell signals based on a simple yet effective Exponential Moving Average (EMA) crossover strategy, strictly evaluated on the 15-minute timeframe.
✅ Strategy:
Buy Signal: Triggered when the 5 EMA crosses above the 10 EMA.
Sell Signal: Triggered when the 5 EMA crosses below the 10 EMA.
📌 Features:
Signals are evaluated using 15-minute data, regardless of your current chart timeframe.
Clear Buy/Sell labels are displayed directly on the chart.
Optional plotting of the 5 EMA and 10 EMA from the 15-minute chart for visual confirmation.
This tool is ideal for traders who want to follow short-term momentum shifts with high clarity and precision.
Uptrick: Acceleration ShiftsIntroduction
Uptrick: Acceleration Shifts is designed to measure and visualize price momentum shifts by focusing on acceleration —the rate of change in velocity over time. It uses various moving average techniques as a trend filter, providing traders with a clearer perspective on market direction and potential trade entries or exits.
Purpose
The main goal of this indicator is to spot strong momentum changes (accelerations) and confirm them with a chosen trend filter. It attempts to distinguish genuine market moves from noise, helping traders make more informed decisions. The script can also trigger multiple entries (smart pyramiding) within the same trend, if desired.
Overview
By measuring how quickly price velocity changes (acceleration) and comparing it against a smoothed average of itself, this script generates buy or sell signals once the acceleration surpasses a given threshold. A trend filter is added for further validation. Users can choose from multiple smoothing methods and color schemes, and they can optionally enable a small table that displays real-time acceleration values.
Originality and Uniqueness
This script offers an acceleration-based approach, backed by several different moving average choices. The blend of acceleration thresholds, a trend filter, and an optional extra-entry (pyramiding) feature provides a flexible toolkit for various trading styles. The inclusion of multiple color themes and a slope-based coloring of the trend line adds clarity and user customization.
Inputs & Features
1. Acceleration Length (length)
This input determines the number of bars used when calculating velocity. Specifically, the script computes velocity by taking the difference in closing prices over length bars, and then calculates acceleration based on how that velocity changes over an additional length. The default is 14.
2. Trend Filter Length (smoothing)
This sets the lookback period for the chosen trend filter method. The default of 50 results in a moderately smooth trend line. A higher smoothing value will create a slower-moving trend filter.
3. Acceleration Threshold (threshold)
This multiplier determines when acceleration is considered strong enough to trigger a main buy or sell signal. A default value of 2.5 means the current acceleration must exceed 2.5 times the average acceleration before signaling.
4. Smart Pyramiding Strength (pyramidingThreshold)
This lower threshold is used for additional (pyramiding) entries once the main trend has already been identified. For instance, if set to 0.5, the script looks for acceleration crossing ±0.5 times its average acceleration to add extra positions.
5. Max Pyramiding Entries (maxPyramidingEntries)
This sets a limit on how many extra positions can be opened (beyond the first main signal) in a single directional trend. The default of 3 ensures traders do not become overexposed.
6. Show Acceleration Table (showTable)
When enabled, a small table displaying the current acceleration and its average is added to the top-right corner of the chart. This table helps monitor real-time momentum changes.
7. Smart Pyramiding (enablePyramiding)
This toggle decides whether additional entries (buy or sell) will be generated once a main signal is active. If enabled, these extra signals act as filtered entries, only firing when acceleration re-crosses a smaller threshold (pyramidingThreshold). These signals have a '+' next to their signal on the label.
8. Select Color Scheme (selectedColorScheme)
Allows choosing between various pre-coded color themes, such as Default, Emerald, Sapphire, Golden Blaze, Mystic, Monochrome, Pastel, Vibrant, Earth, or Neon. Each theme applies a distinct pair of colors for bullish and bearish conditions.
9. Trend Filter (TrendFilter)
Lets the user pick one of several moving average approaches to determine the prevailing trend. The options include:
Short Term (TEMA)
EWMA
Medium Term (HMA)
Classic (SMA)
Quick Reaction (DEMA)
Each method behaves differently, balancing reactivity and smoothness.
10. Slope Lookback (slopeOffset)
Used to measure the slope of the trend filter over a set number of bars (default is 10). This slope then influences the coloring of the trend filter line, indicating bullish or bearish tilt.
Note: The script refers to this as the "Massive Slope Index," but it effectively serves as a Trend Slope Calculation, measuring how the chosen trend filter changes over a specified period.
11. Alerts for Buy/Sell and Pyramiding Signals
The script includes built-in alert conditions that can be enabled or configured. These alerts trigger whenever the script detects a main Buy or Sell signal, as well as extra (pyramiding) signals if Smart Pyramiding is active. This feature allows traders to receive immediate notifications or automate a trading response.
Calculation Methodology
1. Velocity and Acceleration
Velocity is derived by subtracting the closing price from its value length bars ago. Acceleration is the difference in velocity over an additional length period. This highlights how quickly momentum is shifting.
2. Average Acceleration
The script smooths raw acceleration with a simple moving average (SMA) using the smoothing input. Comparing current acceleration against this average provides a threshold-based signal mechanism.
3. Trend Filter
Users can pick one of five moving average types to form a trend baseline. These range from quick-reacting methods (DEMA, TEMA) to smoother options (SMA, HMA, EWMA). The script checks whether the price is above or below this filter to confirm trend direction.
4. Buy/Sell Logic
A buy occurs when acceleration surpasses avgAcceleration * threshold and price closes above the trend filter. A sell occurs under the opposite conditions. An additional overbought/oversold check (based on a longer SMA) refines these signals further.
When price is considered oversold (i.e., close is below a longer-term SMA), a bullish acceleration signal has a higher likelihood of success because it indicates that the market is attempting to reverse from a lower price region. Conversely, when price is considered overbought (close is above this longer-term SMA), a bearish acceleration signal is more likely to be valid. This helps reduce false signals by waiting until the market is extended enough that a reversal or continuation has a stronger chance of following through.
5. Smart Pyramiding
Once a main buy or sell signal is triggered, additional (filtered) entries can be taken if acceleration crosses a smaller multiplier (pyramidingThreshold). This helps traders scale into strong moves. The script enforces a cap (maxPyramidingEntries) to limit risk.
6. Visual Elements
Candles can be recolored based on the active signal. Labels appear on the chart whenever a main or pyramiding entry signal is triggered. An optional table can show real-time acceleration values.
Color Schemes
The script includes a variety of predefined color themes. For bullish conditions, it might use turquoise or green, and for bearish conditions, magenta or red—depending on which color scheme the user selects. Each scheme aims to provide clear visual differentiation between bullish and bearish market states.
Why Each Indicator Was Part of This Component
Acceleration is employed to detect swift changes in momentum, capturing shifts that may not yet appear in more traditional measures. To further adapt to different trading styles and market conditions, several moving average methods are incorporated:
• TEMA (Triple Exponential Moving Average) is chosen for its ability to reduce lag more effectively than a standard EMA while still reacting swiftly to price changes. Its construction layers exponential smoothing in a way that can highlight sudden momentum shifts without sacrificing too much smoothness.
• DEMA (Double Exponential Moving Average) provides a faster response than a single EMA by using two layers of exponential smoothing. It is slightly less smoothed than TEMA but can alert traders to momentum changes earlier, though with a higher risk of noise in choppier markets.
• HMA (Hull Moving Average) is known for its balance of smoothness and reduced lag. Its weighted calculations help track trend direction clearly, making it useful for traders who want a smoother line that still reacts fairly quickly.
• SMA (Simple Moving Average) is the classic baseline for smoothing price data. It offers a clear, stable perspective on long-term trends, though it reacts more slowly than other methods. Its simplicity can be beneficial in lower-volatility or more stable market environments.
• EWMA (Exponentially Weighted Moving Average) provides a middle ground by emphasizing recent price data while still retaining some degree of smoothing. It typically responds faster than an SMA but is less aggressive than DEMA or TEMA.
Alongside these moving average techniques, the script employs a slope calculation (referred to as the “Massive Slope Index”) to visually indicate whether the chosen filter is sloping upward or downward. This adds an extra layer of clarity to directional analysis. The indicator also uses overbought/oversold checks, based on a longer-term SMA, to help filter out signals in overstretched markets—reducing the likelihood of false entries in conditions where the price is already extensively extended.
Additional Features
Alerts can be set up for both main signals and additional pyramiding signals, which is helpful for automated or semi-automated trading. The optional acceleration table offers quick reference values, making momentum monitoring more intuitive. Including explicit alert conditions for Buy/Sell and Pyramiding ensures traders can respond promptly to market movements or integrate these triggers into automated strategies.
Summary
This script serves as a comprehensive momentum-based trading framework, leveraging acceleration metrics and multiple moving average filters to identify potential shifts in market direction. By combining overbought/oversold checks with threshold-based triggers, it aims to reduce the noise that commonly plagues purely reactive indicators. The flexibility of Smart Pyramiding, customizable color schemes, and built-in alerts allows users to tailor their experience and respond swiftly to valid signals, potentially enhancing trading decisions across various market conditions.
Disclaimer
All trading involves significant risk, and users should apply their own judgment, risk management, and broader analysis before making investment decisions.

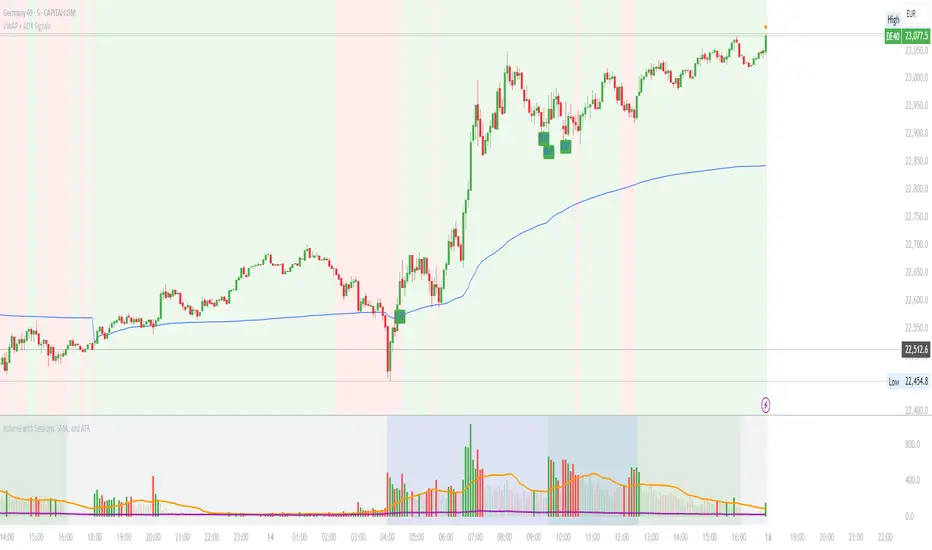
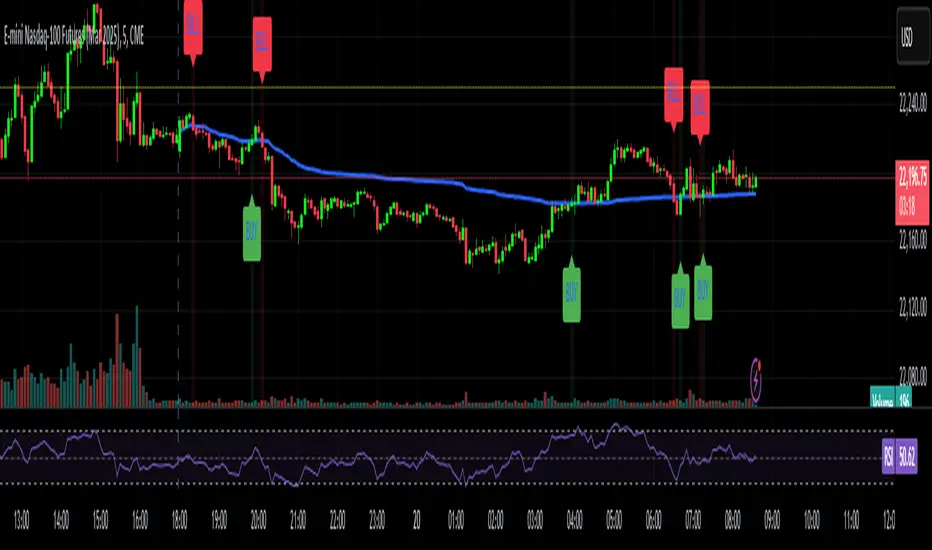
VWAP with ADX Buy/Sell Signals and 50 MA BackgroundThis Pine Script combines several technical indicators to create a comprehensive chart with buy and sell signals based on the ADX and VWAP, as well as background color changes depending on the price relative to the 50-period simple moving average (SMA). Here's a breakdown of what each part of the code does:
1. VWAP Settings
Anchor Period: You can select different periods such as "Session", "Week", "Month", etc. to define the anchor period for the VWAP.
Source: The source for VWAP is set to the typical price (hlc3).
Offset: Allows for shifting the VWAP by a specified amount.
2. ADX Settings
ADX Length: The period used to calculate the ADX.
ADX Smoothing: Used to smooth the ADX for better clarity.
ADX Threshold: Used to filter out weak trends (i.e., signals when ADX > 20).
3. ADX and VWAP Calculation
The ADX values are calculated using ta.dmi(), which returns the +DI, -DI, and ADX lines.
VWAP is calculated using ta.vwap(), based on the selected price source.
4. Buy/Sell Conditions
Buy Signal: A buy signal is generated when:
The +DI crosses above the -DI (indicating an uptrend).
The ADX is above 20 (indicating a strong trend).
The closing price is above the VWAP (indicating bullish market sentiment).
Sell Signal: A sell signal occurs when:
The -DI crosses above the +DI (indicating a downtrend).
The ADX is above 20 (indicating a strong trend).
The closing price is below the VWAP (indicating bearish market sentiment).
5. VWAP Bands
The standard deviation of the price is calculated using ta.stdev(), and the bands are plotted at multiples of the standard deviation (1, 2, and 3).
These bands are used to highlight possible overbought or oversold conditions.
6. 50-period SMA and Background Color
The script calculates a 50-period Simple Moving Average (SMA).
The background color is then changed based on whether the price is above or below the 50-period SMA. If the price is above the SMA, the background is green (bullish), and if it’s below, it’s red (bearish).
7. Plots
The script includes plots for the VWAP line, the ADX and DI lines (optional), and the upper and lower bands.
The buy and sell signals are plotted as shapes with text labels ("BUY" and "SELL") that appear below or above the price bars.
Final Notes:
Band Plots: Three levels of bands (green, olive, teal) are plotted using standard deviation multipliers (1, 2, and 3 times the standard deviation).
Background Color: The background color changes depending on whether the price is above or below the 50 SMA, giving a visual cue for bullish or bearish market conditions.
This indicator aims to offer a multi-faceted view of the market with trend-following signals (via ADX), VWAP for intraday support/resistance, and background coloring to indicate the current trend strength based on the 50 SMA.
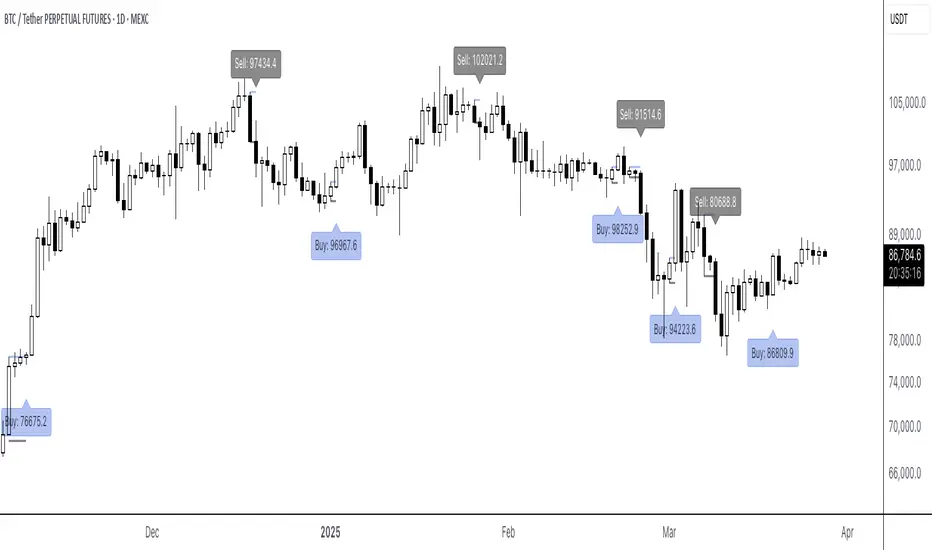
6F Signals (With Labels)6F Signals (With Labels)
This TradingView indicator plots potential buy and sell signals.
Signals
- Buy signals: "Buy: " labels appear below the bar.
- Sell signals: "Sell: " labels appear above the bar.
Perfect for traders looking for straightforward, labeled entry and exit points directly on their price chart!
Cumulative Price Change AlertCumulative Price Change Alert
Version: 1.0
Author: QCodeTrader 🚀
Overview 🔍
The Cumulative Price Change Alert indicator analyzes the percentage change between the current and previous open prices and sums these changes over a user-defined number of bars. It then generates visual buy and sell signals using arrows and labels on the chart, helping traders spot cumulative price momentum and potential trading opportunities.
Key Features ⚙️
Customizable Timeframe 🕒:
Use a custom timeframe or default to the chart's timeframe for price data.
User-Defined Summation 🔢:
Specify the number of bars to sum, allowing you to analyze cumulative price changes.
Custom Buy & Sell Conditions 🔔:
Set individual percentage change thresholds and cumulative sum thresholds to tailor signals for
your strategy.
Visual Alerts 🚀:
Displays green upward arrows for buy signals and red downward arrows for sell signals directly
on the chart.
Informative Labels 📝:
Provides labels with formatted percentage change and cumulative sum details for the analyzed
bars.
Versatile Application 📊:
Suitable for stocks, forex, crypto, commodities, and more.
How It Works ⚡
Price Change Calculation ➗:
The indicator calculates the percentage change between the current bar's open price and the
previous bar's open price.
Cumulative Sum ➕:
It then sums these percentage changes over the last N bars (as specified by the user).
Signal Generation 🚦:
Buy Signal 🟢: When both the individual percentage change and the cumulative sum exceed
their respective buy thresholds, a green arrow and label are displayed.
Sell Signal 🔴: Conversely, if the individual change and cumulative sum fall below the sell
thresholds, a red arrow and label are shown.
How to Use 💡
Add the Indicator ➕:
Apply the indicator to your chart.
Customize Settings ⚙️:
Set a custom timeframe if desired.
Define the number of bars to sum.
Adjust the buy/sell percentage change and cumulative sum thresholds to match your trading
strategy.
Interpret Visual Cues 👀:
Monitor the chart for green or red arrows and corresponding labels that signal potential buy or
sell opportunities based on cumulative price movements.
Settings Explained 🛠️
Custom Timeframe:
Select an alternative timeframe for analysis, or leave empty to use the current chart's timeframe.
Number of Last Bars to Sum:
Determines how many bars are used to compute the cumulative percentage change.
Buy Condition - Min % Change:
The minimum individual percentage change required to consider a buy signal.
Buy Condition - Min Sum of Bars:
The minimum cumulative percentage change over the defined bars needed for a buy signal.
Sell Condition - Max % Change:
The maximum individual percentage change threshold for a sell signal.
Sell Condition - Max Sum of Bars:
The maximum cumulative percentage change over the defined bars for triggering a sell signal.
Best Use Cases 🎯
Momentum Identification 📈:
Quickly spot strong cumulative price movements and momentum shifts.
Entry/Exit Signals 🚪:
Use the visual signals to determine potential entry and exit points in your trading.
Versatile Strategy Application 🔄:
Effective for scalping, swing trading, and longer-term analysis across various markets.
UPD: uncheck labels for better performance

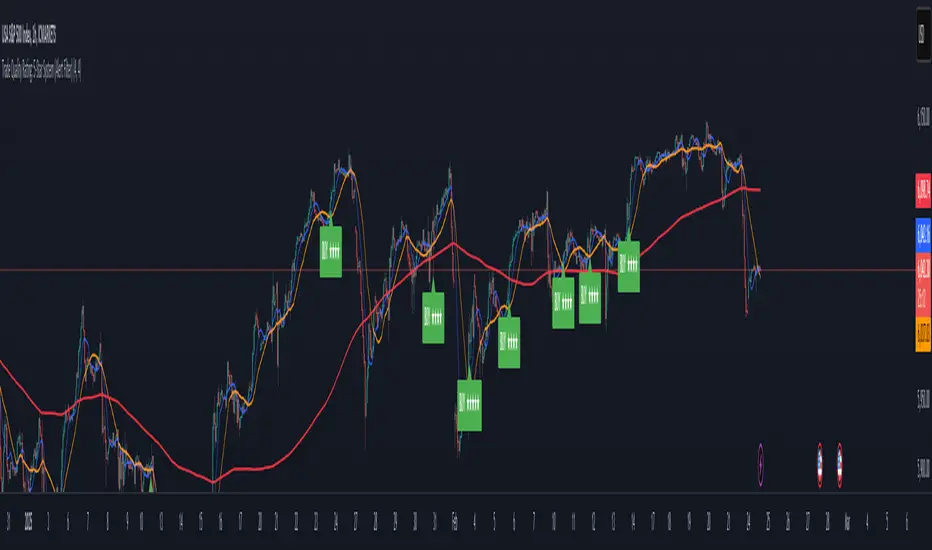
Trade Quality Rating: signal rating from 1 to 5 starsOverview
The indicator is built to generate trading signals based on a combination of technical indicators and then assign each signal a quality rating from 1 to 5 stars. The idea is that the more filters that are met, the stronger (or higher quality) the signal is assumed to be. You can then use these quality ratings to decide which signals to act upon, keeping in mind that a higher-rated signal has more confirming factors.
Components of the Indicator
Simple Moving Averages (SMAs):
SMA9 and SMA20:
These two moving averages are used to detect short-term trend changes via crossovers. A bullish signal is generated when the SMA9 crosses above the SMA20, and a bearish signal when it crosses below.
SMA200 (on the current timeframe) & Daily SMA200:
The SMA200 on your current chart helps smooth out the price action.
The Daily SMA200 serves as a long-term trend filter. For a valid long signal, the price must be above the Daily SMA200, and vice versa for a short signal.
MACD (Moving Average Convergence Divergence):
The MACD is calculated using standard parameters (12, 26, 9).
It adds momentum confirmation to the signal. For a long trade, the MACD line should be above its signal line, and for a short trade, below.
RSI (Relative Strength Index):
Calculated with a 14-period setting.
For long signals, the RSI must be above 50 (indicating upward momentum), while for short signals, it should be below 50.
This filter is one of the additional conditions that add to the quality rating.
Volume Filter:
A 20-period moving average of volume is computed.
The current volume must exceed this average, suggesting that there is enough market participation backing the move.
This is another extra filter that adds to the overall quality score.
ADX (Average Directional Index):
The ADX is manually calculated in the script (using a 14-period setting) to gauge the strength of the trend.
A value above 25 is considered to confirm that a strong trend is in place, making the signal more reliable.
VWAP (Volume Weighted Average Price):
The session VWAP is computed on a daily basis.
For long trades, the price should be above the VWAP, and for short trades, below.
This serves as a confirmation that the current price is moving in the right direction relative to the volume-weighted average.
Signal Generation and Quality Rating
Base Signal (1 Star):
The fundamental trade signal is generated when the SMA9/SMA20 crossover occurs, in combination with the MACD confirmation and the condition that the price is on the correct side of the Daily SMA200. This base signal provides a 1-star quality rating.
Additional Filters (Adding Extra Stars):
RSI Filter: Adds 1 extra star if the RSI condition is met (RSI > 50 for long or RSI < 50 for short).
Volume Filter: Adds 1 extra star if the current volume exceeds its 20-period moving average.
ADX Filter: Adds 1 extra star if the ADX value is above 25, confirming a strong trend.
VWAP Filter: Adds 1 extra star if the price is above the VWAP for long trades (or below for short trades).
When all filters are met, you get a 5-star rating (1 star base + 4 extra stars).
Display and Alerts:
The indicator plots your SMAs on the chart.
When a signal occurs, it places a label on the chart showing the trade direction ("BUY" or "SELL") along with the quality rating in stars.
Additionally, alert conditions are set up so that you can receive notifications when a valid signal (based on the base criteria) is generated.
How to Use This Indicator
Filtering Trades:
Use the quality rating as a visual guide. For instance, if you want to only act on the most reliable setups, you might decide to trade only signals that are rated 4 or 5 stars.
Manual Confirmation:
Even with a high star rating, you can perform your own final checks (e.g., checking price action or additional chart patterns) before entering a trade.
Backtesting and Adjustment:
Because market conditions differ, it’s advisable to backtest the indicator on your instrument of choice and adjust the parameters (such as the ADX threshold or the period for volume averaging) to better suit your trading style.
Conclusion
This 5-star system indicator is designed to provide a comprehensive overview of trade quality by integrating multiple technical filters into one visual signal. It helps filter out noise by ensuring that a trade signal not only meets a basic SMA and MACD condition but also aligns with volume, trend strength (ADX), and VWAP criteria. This multi-layered approach can lead to fewer but higher quality trades, allowing you to focus on setups that have more confluence.
Happy trading!
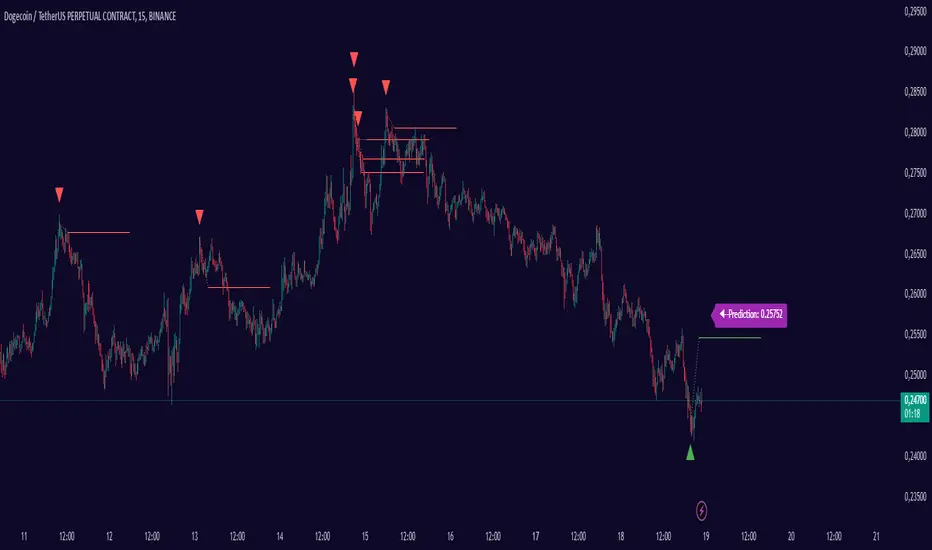
Smart Adaptive Signal SystemSmart Adaptive Signal System
Description: The Smart Adaptive Signal System is a sophisticated indicator that generates intelligent buy/sell signals by dynamically adapting to market conditions. It predicts target prices based on momentum and volatility, providing more accurate and reliable trading opportunities.
How It Works:
Dynamic Signal Generation: The system predicts target prices by considering factors such as volatility and momentum. This allows it to react instantly to trend changes and market fluctuations.
Adaptive Thresholds: Buy and sell signals are triggered with adaptive thresholds, adjusting according to market volatility. This ensures flexibility in the face of sudden market changes.
Trend-Based Reset: Users can choose to reset threshold values based on a time interval or trend change. This feature helps the system re-adapt to current market conditions for greater accuracy.
Target Price Prediction: Target prices are calculated using momentum and volatility, helping the system predict future price movements.
How to Use:
Buy/Sell Signals: The indicator generates buy and sell signals based on market conditions. Look for a "down arrow" for a buy signal and an "up arrow" for a sell signal on the chart.
Target Price Lines: Along with buy and sell signals, the system draws target price lines. This helps you visualize potential future price levels.
Flexible Settings: Users can customize analysis periods, minimum change percentages, and other parameters to fit their needs.
Features:
Dynamic buy and sell signals
Target price predictions
Volatility and momentum-based analysis
User-friendly and flexible settings
Trend-based adaptive resetting
Alerts: The Smart Adaptive Signal System responds quickly to sudden market changes, but always use it in conjunction with other indicators like support and resistance levels. Signal accuracy may vary depending on market conditions.
Anchored VWAP with Buy/Sell SignalsAnchored VWAP Calculation:
The script calculates the AVWAP starting from a user-defined anchor point (anchor_date).
The AVWAP is calculated using the formula:
AVWAP
=
∑
(
Volume
×
Average Price
)
∑
Volume
AVWAP=
∑Volume
∑(Volume×Average Price)
where the average price is
(
h
i
g
h
+
l
o
w
+
c
l
o
s
e
)
/
3
(high+low+close)/3.
Buy Signal:
A buy signal is generated when the price closes above the AVWAP (ta.crossover(close, avwap)).
Sell Signal:
A sell signal is generated when the price closes below the AVWAP (ta.crossunder(close, avwap)).
Plotting:
The AVWAP is plotted on the chart.
Buy and sell signals are displayed as labels on the chart.
Background Highlighting:
The background is highlighted in green for buy signals and red for sell signals (optional).
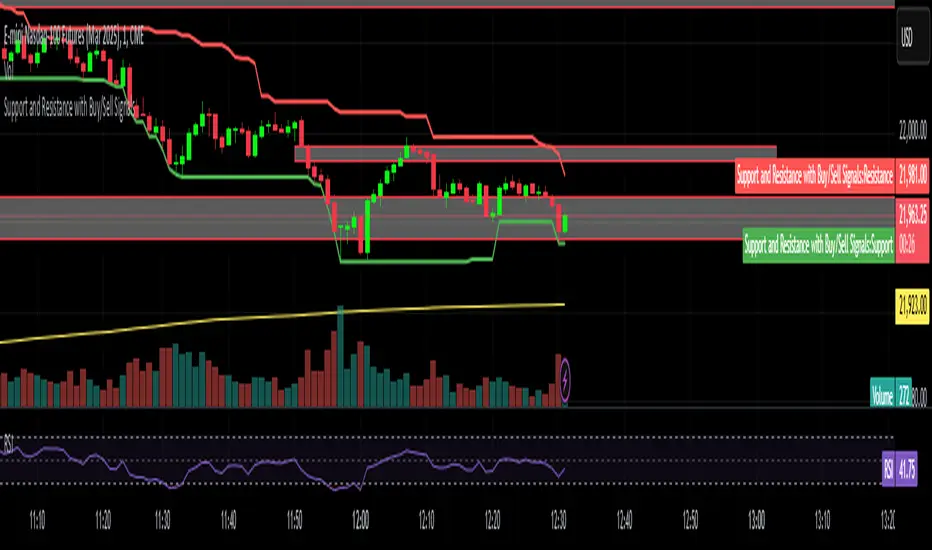
Support and Resistance with Buy/Sell SignalsSwing Highs and Lows:
The script identifies swing highs and lows using the ta.highest and ta.lowest functions over a user-defined swing_length period.
Swing highs are treated as resistance levels.
Swing lows are treated as support levels.
Buy Signal:
A buy signal is generated when the price closes above the resistance level (ta.crossover(close, swing_high)).
Sell Signal:
A sell signal is generated when the price closes below the support level (ta.crossunder(close, swing_low)).
Plotting:
Support and resistance levels are plotted on the chart.
Buy and sell signals are displayed as labels on the chart.
Background Highlighting:
The background is highlighted in green for buy signals and red for sell signals (optional).
Phase Cross Strategy with Zone### Introduction to the Strategy
Welcome to the **Phase Cross Strategy with Zone and EMA Analysis**. This strategy is designed to help traders identify potential buy and sell opportunities based on the crossover of smoothed oscillators (referred to as "phases") and exponential moving averages (EMAs). By combining these two methods, the strategy offers a versatile tool for both trend-following and short-term trading setups.
### Key Features
1. **Phase Cross Signals**:
- The strategy uses two smoothed oscillators:
- **Leading Phase**: A simple moving average (SMA) with an upward offset.
- **Lagging Phase**: An exponential moving average (EMA) with a downward offset.
- Buy and sell signals are generated when these phases cross over or under each other, visually represented on the chart with green (buy) and red (sell) labels.
2. **Phase Zone Visualization**:
- The area between the two phases is filled with a green or red zone, indicating bullish or bearish conditions:
- Green zone: Leading phase is above the lagging phase (potential uptrend).
- Red zone: Leading phase is below the lagging phase (potential downtrend).
3. **EMA Analysis**:
- Includes five commonly used EMAs (13, 26, 50, 100, and 200) for additional trend analysis.
- Crossovers of the EMA 13 and EMA 26 act as secondary buy/sell signals to confirm or enhance the phase-based signals.
4. **Customizable Parameters**:
- You can adjust the smoothing length, source (price data), and offset to fine-tune the strategy for your preferred trading style.
### What to Pay Attention To
1. **Phases and Zones**:
- Use the green/red phase zone as an overall trend guide.
- Avoid taking trades when the phases are too close or choppy, as it may indicate a ranging market.
2. **EMA Trends**:
- Align your trades with the longer-term trend shown by the EMAs. For example:
- In an uptrend (price above EMA 50 or EMA 200), prioritize buy signals.
- In a downtrend (price below EMA 50 or EMA 200), prioritize sell signals.
3. **Signal Confirmation**:
- Consider combining phase cross signals with EMA crossovers for higher-confidence trades.
- Look for confluence between the phase signals and EMA trends.
4. **Risk Management**:
- Always set stop-loss and take-profit levels to manage risk.
- Use the phase and EMA zones to estimate potential support/resistance areas for exits.
5. **Whipsaws and False Signals**:
- Be cautious in low-volatility or sideways markets, as the strategy may generate false signals.
- Use additional indicators or filters to avoid entering trades during unclear market conditions.
### How to Use
1. Add the strategy to your chart in TradingView.
2. Adjust the input settings (e.g., smoothing length, offsets) to suit your trading preferences.
3. Enable the strategy tester to evaluate its performance on historical data.
4. Combine the signals with your own analysis and risk management plan for best results.
This strategy is a versatile tool, but like any trading method, it requires proper understanding and discretion. Always backtest thoroughly and trade with discipline. Let me know if you need further assistance or adjustments to the strategy!

BTC Trendline Patterns with Signals BTC Trendline Patterns with Signals
This custom Pine Script indicator automatically detects key pivot points in Bitcoin price action and draws support and resistance trendlines. The indicator provides buy (long) and sell (short) signals when these trendlines are broken. This can help traders identify potential breakout opportunities and trend reversals based on established price levels.
Features:
Pivot Point Detection: Automatically identifies pivot highs and lows in the price chart, based on customizable parameters (Pivot Left and Pivot Right).
Support and Resistance Trendlines: Draws trendlines based on the identified pivot points. These lines represent significant price levels where price may experience support or resistance.
Breakout Signals: Provides buy (long) and sell (short) signals when the price breaks above the resistance trendline (for buy signals) or below the support trendline (for sell signals).
Customizable Pivot Lengths: Adjust the number of bars considered for determining pivot points using the Pivot Left and Pivot Right input parameters.
How it Works:
Pivot Detection: The script identifies the highest high (pivotHigh) and the lowest low (pivotLow) within a specific range of bars (defined by Pivot Left and Pivot Right).
Trendline Plotting: Once pivots are detected, the script draws resistance (red) and support (green) trendlines connecting the most recent pivots. These trendlines act as dynamic support and resistance levels.
Breakout Signals: The script generates signals:
BUY (Long): Triggered when the price breaks above the most recent resistance trendline.
SELL (Short): Triggered when the price breaks below the most recent support trendline.
Parameters:
Pivot Left: Number of bars to the left of the pivot point to consider.
Pivot Right: Number of bars to the right of the pivot point to consider.
Line Width: Customizable line width for drawing trendlines.
Ideal Use:
Timeframes: This indicator works well on timeframes ranging from 1-minute to daily charts. For best results, use it on 1-hour, 4-hour, or daily charts.
Strategy: Ideal for breakout traders or trend-following strategies. Use it to identify potential entry points when price breaks key levels of support or resistance.
Example Use Case:
Swing Traders: Traders looking for potential breakouts can use this script to identify key levels in the market and wait for the price to break through resistance for a long trade or support for a short trade.
Day Traders: For those looking to enter and exit trades in a single day, this indicator can help pinpoint areas of support and resistance, and provide actionable signals when price breaks those levels.
Disclaimer:
This script is not a guarantee of success and should be used in conjunction with other technical analysis tools. Always perform additional research and backtesting before live trading.
Important Notes:
The pivot points and trendlines may adjust dynamically as the price evolves. Adjust the pivot settings to suit the volatility and timeframe of the market you're trading.
This indicator works best when combined with other indicators such as volume, RSI, or MACD for confirmation.
How to Use:
Add the indicator to your chart.
Adjust the Pivot Left and Pivot Right parameters to fine-tune the pivot point detection.
Monitor for trendline breakouts. When the price breaks above the resistance line, a BUY signal will appear. When the price breaks below the support line, a SELL signal will appear.
Use the signals to enter trades at the right moment.
Final Notes:
If you're submitting to TradingView for publishing, keep your description clear and informative, but also concise. Traders need to quickly understand how your indicator works, what parameters they can adjust, and how it might fit into their trading strategy.

Dynamic Signal EngineDynamic Signal Engine
The Dynamic Signal Engine is a powerful and versatile indicator, designed to help traders make informed decisions by combining trend analysis with key support and resistance levels. This tool is inspired by the Linear Regression Oscillator , which laid the foundation for this enhanced implementation. By building on the original concept, this script introduces additional features, customization, and integration with dynamic trading strategies to suit diverse trading styles.
Key Features
Inspiration and Foundation
This indicator draws inspiration from the Linear Regression Oscillator , leveraging its robust trend detection capabilities while adding custom enhancements for broader functionality and user adaptability.
Trading Style Customization
Adaptable for Scalping, Intraday, and Swing Trading with dynamic parameter adjustments for each style.
User-defined inputs for thresholds, lookback periods, and visualization options provide further control.
Enhanced Linear Regression Oscillator (LRO)
A refined implementation of the LRO calculates deviations from a regression line, normalized for improved trend detection.
Identifies bullish and bearish crossovers with added alerts and visual markers.
Includes proximity alerts for critical thresholds to help traders anticipate key market movements.
Dynamic Support and Resistance Integration
Incorporates ENIGMA Signal Logic to identify swing highs and lows, dynamically marking them as fractal support and resistance levels.
When a sell signal from ENIGMA is generated, traders can choose to sell immediately or use the low of the previous candle as the entry point. Similarly, for a buy signal, traders can buy immediately or use the high of the previous candle for entry. These signals are visually indicated by a green triangle for buy signals, ensuring clear and actionable insights.
Advanced Visualization
Displays key levels with customizable horizontal lines (solid, dashed, or dotted) and labels for clarity.
Candle colours and mini arrows highlight trends and potential trading opportunities.
Real-Time Alerts
Alerts for LRO threshold crossings and swing-level breaches keep you updated without the need for constant monitoring.
Optimized for Usability
Designed to keep charts clean by limiting displayed trades and signals to recent activity.
Adjustable parameters ensure flexibility and a user-friendly experience.
How It Works
Trend Detection with Enhanced LRO
The indicator builds on the Linear Regression Oscillator , calculating oscillations of price movements and normalizing them for trend analysis. Crossovers and threshold proximity are visualized on the chart and trigger alerts for potential market shifts.
Dynamic Support and Resistance Levels
The ENIGMA Signal Logic identifies recent swing highs and lows, marking them as key levels. These levels are dynamically updated as new swing points are detected, providing actionable support and resistance zones.
Signal Confirmation
Buy or sell signals are confirmed when:
Price breaches the swing levels.
The LRO aligns with directional bias (e.g., bearish crossover for sell signals).
Signals are further clarified by ENIGMA's green triangle indicators, showing key buy and sell opportunities.
Visualization and Alerts
Signals are displayed using arrows, labelled horizontal lines, and optional candle colours. Alerts notify traders of key events, such as LRO threshold crossings or swing-level breaches.
How to Use
Choose your Trading Style: Scalping, Intraday, or Swing Trading. The indicator adjusts its default settings automatically.
Fine-tune parameters like LRO thresholds, line lengths, and the number of visible trades to suit your preferences.
Observe the chart for signals:
Green arrows and lines indicate buy opportunities.
Red arrows and lines signal sell opportunities.
Use the alert system to stay informed about LRO thresholds and signal confirmations.
Integrate the indicator with your existing trading strategy for better decision-making.
Acknowledgement
This script was inspired by the Linear Regression Oscillator . While it builds on the core concept, this implementation introduces unique enhancements, such as dynamic signal integration, trading style adaptability, and advanced visualization tools, making it a highly customizable and versatile tool for traders.
Disclaimer
This indicator is intended for educational purposes only and should not be considered financial advice. Always perform due diligence and apply appropriate risk management when trading.

RSI + Normalized Fisher Transform with SignalsThis indicator combines three tools for market analysis: the Relative Strength Index (RSI), the RSI's moving average, and the Fisher Transform. RSI is a momentum oscillator that measures the speed and change of price movements, helping identify overbought and oversold conditions. The RSI moving average is a smoothed version of the RSI that filters noise and confirms trends. The Fisher Transform is a mathematical technique that transforms price data into a Gaussian normal distribution, making it easier to identify turning points. It has been normalized to the same scale as the RSI (0-100) for consistency.
Purpose
The goal of this indicator is to identify potential buy and sell opportunities with varying degrees of strength (strong and weak). By combining the RSI, its moving average, and the Fisher Transform, the indicator ensures signals are based on both momentum and reversals, making it highly versatile across different market conditions.
Key Features
This indicator provides strong and weak buy and sell signals. A strong buy occurs when the RSI crosses above its moving average while both the RSI and its moving average are oversold (below the default threshold of 30), and the Fisher Transform reverses direction within the same or prior bar while also being oversold. A weak buy occurs when the Fisher Transform is oversold, and the RSI crosses above its moving average while its value is between the default oversold threshold (30) and 50. A strong sell occurs when the RSI crosses below its moving average while both the RSI and its moving average are overbought (above the default threshold of 70), and the Fisher Transform reverses direction within the same or prior bar while also being overbought. A weak sell occurs when the Fisher Transform is overbought, and the RSI crosses below its moving average while its value is between 50 and the default overbought threshold (70).
The indicator includes customizable thresholds and lengths. Users can adjust the oversold and overbought thresholds to suit their trading style. The RSI length, moving average length, and Fisher Transform length are also customizable. The Fisher Transform is scaled to the RSI’s range of 0-100 to simplify analysis and signal interpretation.
How to Use the Indicator
On the chart, you will see the RSI line in blue, the RSI moving average in orange, and the Fisher Transform in purple. Horizontal lines at the default oversold (30) and overbought (70) levels mark critical zones for signals. Adjust these thresholds in the indicator settings as needed.
Strong buy signals are shown as larger, darker green arrows below the price. Weak buy signals are small lime arrows below the price. Strong sell signals are larger, darker red arrows above the price. Weak sell signals are small fuchsia arrows above the price.
Signal Interpretation
A strong buy indicates a highly favorable buying opportunity. This typically occurs when the asset is in a downtrend but shows signs of reversal, particularly in oversold zones. A weak buy suggests a potential buying opportunity but with less conviction, often when the market is neutral to slightly bearish but showing upward momentum. A strong sell indicates a highly favorable selling opportunity, usually occurring when the asset is in an uptrend but shows signs of reversal, particularly in overbought zones. A weak sell suggests a potential selling opportunity but with less conviction, often in neutral to slightly bullish markets showing downward momentum.
Practical Tips
Avoid using signals in isolation. Combine this indicator with other tools such as trendlines, moving averages, or support/resistance levels for greater accuracy. Adjust the parameters for different assets to match their volatility. For volatile assets, consider wider thresholds like 20/80 for oversold/overbought levels. For less volatile assets, tighter thresholds like 35/65 may be more appropriate. Use higher timeframes to confirm signals before trading on lower timeframes. Be cautious in sideways markets, as both RSI and the Fisher Transform perform better in trending conditions.
Instructions for Adjustments
To change the oversold or overbought levels, open the indicator settings by clicking the gear icon and modify the "Oversold Threshold" and "Overbought Threshold" values. To adjust lengths for RSI and Fisher Transform, update the "RSI Length," "RSI Moving Average Length," and "Fisher Transform Length" settings. If needed, toggle signal visibility by enabling or disabling specific arrows (Strong Buy, Weak Buy, Strong Sell, Weak Sell) in the "Style" tab.
Best Practices
Risk management is essential. Always set appropriate stop-loss levels and position sizes based on your risk tolerance. Backtest the indicator on historical data to understand its performance and behavior for your chosen asset and timeframe. Combining this indicator with volume or volatility analysis (Bollinger Band Width, for example) can help confirm signal validity.
This indicator simplifies decision-making by identifying high-probability trading opportunities using a combination of momentum, trend, and reversals. Follow these instructions to fully utilize its capabilities without needing to analyze the underlying code.

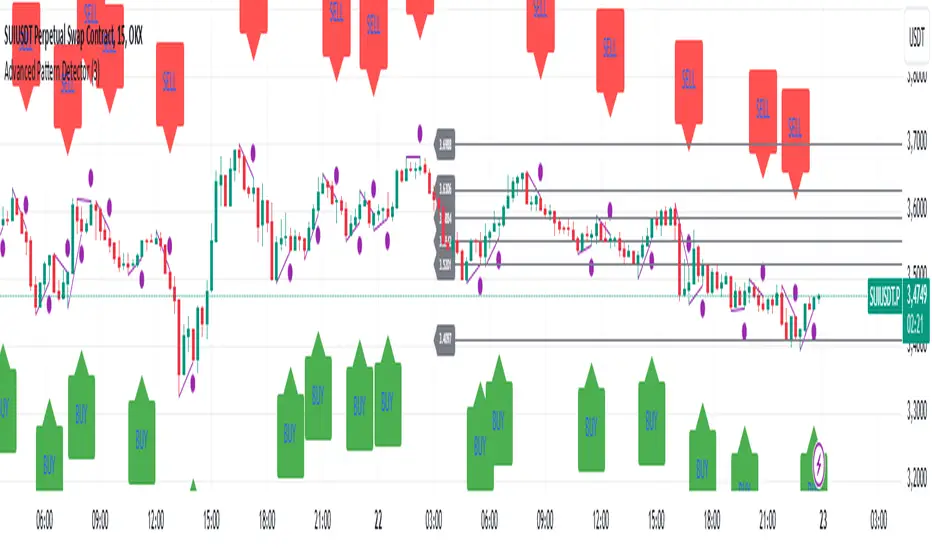
Advanced Pattern Detector**Script Overview**
**Indicator Name:** Advanced Pattern Detector
**Pine Script Version:** v5
**Indicator Type:** Overlaid on the chart (overlay=true)
**Main Features:**
- Detection and visualization of various technical patterns.
- Generation of BUY and SELL signals based on detected patterns.
- Display of Fibonacci levels to identify potential support and resistance levels.
- Ability to enable or disable each pattern through the indicator settings.
---
**Indicator Settings**
**Switches to Enable/Disable Patterns**
At the top of the indicator, there are parameters that allow the user to select which patterns will be displayed on the chart:
- Three Drives
- Rounding Top
- Rounding Bottom
- ZigZag Pattern
- Inverse Head and Shoulders
- Fibonacci Retracement
**Parameters for ZigZag**
Settings are also available for the ZigZag pattern, such as the depth of peak and trough detection, allowing the user to adjust the indicator's sensitivity to price changes.
---
**Pattern Detection**
Each pattern is implemented with its own logic, which checks specific conditions on the current bar (candle). Below are the main patterns:
1. **Three Drives**
- **Description:** This pattern consists of three consecutive price movements in one direction (up or down). It can signal the continuation of the current trend or its reversal.
- **How It Works:**
- **Upward Drive:** The indicator checks that the closing price of each subsequent candle is higher than the previous one for three bars.
- **Downward Drive:** The indicator checks that the closing price of each subsequent candle is lower than the previous one for three bars.
2. **Rounding Top**
- **Description:** A pattern representing a smooth decrease in maximum prices over several bars, which may indicate a potential downward trend reversal.
- **How It Works:**
- The indicator checks that the maximum prices of the last five bars are gradually decreasing, and the current bar shows a decrease in the maximum price.
3. **Rounding Bottom**
- **Description:** A pattern characterized by a smooth increase in minimum prices over several bars, signaling a possible upward trend reversal.
- **How It Works:**
- The indicator checks that the minimum prices of the last five bars are gradually increasing, and the current bar shows an increase in the minimum price.
4. **ZigZag Pattern**
- **Description:** Used to identify corrective movements on the chart. The pattern shows peak and trough points connected by lines, helping to visualize the main price movement.
- **How It Works:**
- The indicator uses a function to determine local maxima and minima based on the specified depth.
- Detected peaks and troughs are connected by lines to create a visual zigzag structure.
5. **Inverse Head and Shoulders**
- **Description:** An inverted head and shoulders formation signals a possible reversal of a downward trend to an upward one.
- **How It Works:**
- The indicator looks for three local minima: the left shoulder, the head (the lowest minimum), and the right shoulder.
- It checks that the left and right shoulders are approximately at the same level and below the head.
6. **Fibonacci Retracement Levels**
- **Description:** Automatically builds key Fibonacci levels based on the maximum and minimum prices over the last 50 bars. These levels are often used as potential support and resistance levels.
- **How It Works:**
- Daily, the minimum and maximum prices over the last 50 bars are calculated.
- Based on these values, Fibonacci levels are drawn: 100%, 23.6%, 38.2%, 50%, 61.8%, and 0%.
- Old levels are removed when a new day begins to keep the chart clean and up-to-date.
---
**Generation of Buy and Sell Signals**
The indicator combines the results of detected patterns to generate trading signals:
- **Buy Signals (BUY):**
- Rounding Bottom
- Three Drives Up
- Inverse Head and Shoulders
- ZigZag Low
- **Sell Signals (SELL):**
- Rounding Top
- Three Drives Down
- Inverse Head and Shoulders
- ZigZag High
**How It Works:**
- If one or more buy conditions are met, a "BUY" label is displayed below the corresponding bar on the chart.
- If one or more sell conditions are met, a "SELL" label is displayed above the corresponding bar on the chart.
---
**Visualization of Patterns on the Chart**
Each detected pattern is visualized using various graphical elements, allowing traders to easily identify them on the chart:
- **Three Drives Up:** Green upward triangle below the bar.
- **Three Drives Down:** Red downward triangle above the bar.
- **Rounding Top:** Orange "RT" label above the bar.
- **Rounding Bottom:** Blue "RB" label below the bar.
- **Inverse Head and Shoulders:** Turquoise "iH&S" label below the bar.
- **ZigZag High/Low:** Purple circles at the peaks and troughs of the zigzag.
---
**Displaying Fibonacci Levels**
Fibonacci levels are displayed as horizontal lines on the chart with corresponding labels. These levels help traders determine potential entry and exit points, as well as support and resistance levels.
---
**Drawing ZigZag Lines**
ZigZag lines connect the detected peaks and troughs, visualizing corrective movements. To avoid cluttering the chart, the number of lines is limited, and old lines are automatically removed as new ones are added.
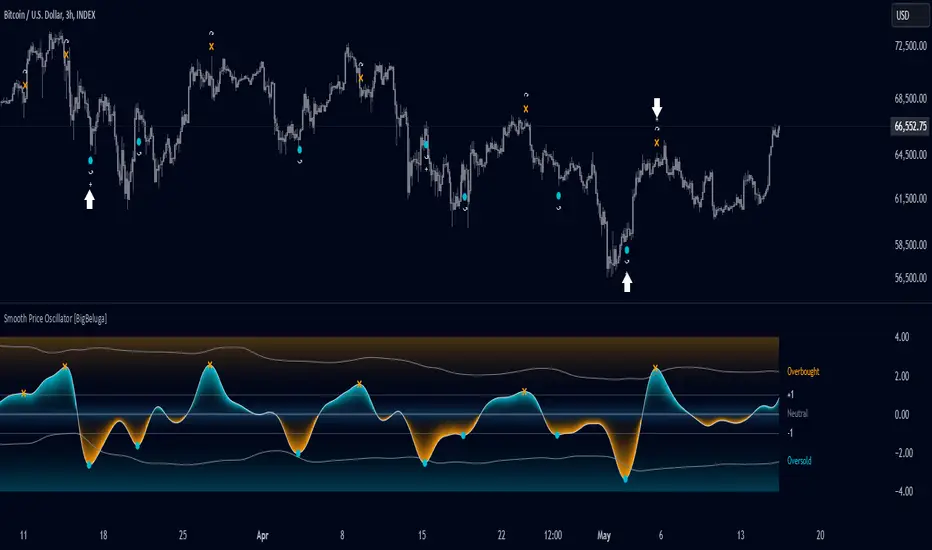
Smooth Price Oscillator [BigBeluga]The Smooth Price Oscillator by BigBeluga leverages John Ehlers' SuperSmoother filter to produce a clear and smooth oscillator for identifying market trends and mean reversion points. By filtering price data over two distinct periods, this indicator effectively removes noise, allowing traders to focus on significant signals without the clutter of market fluctuations.
🔵 KEY FEATURES & USAGE
● SuperSmoother-Based Oscillator:
This oscillator uses Ehlers' SuperSmoother filter, applied to two different periods, to create a smooth output that highlights price momentum and reduces market noise. The dual-period application enables a comparison of long-term and short-term price movements, making it suitable for both trend-following and reversion strategies.
// @function SuperSmoother filter based on Ehlers Filter
// @param price (float) The price series to be smoothed
// @param period (int) The smoothing period
// @returns Smoothed price
method smoother_F(float price, int period) =>
float step = 2.0 * math.pi / period
float a1 = math.exp(-math.sqrt(2) * math.pi / period)
float b1 = 2 * a1 * math.cos(math.sqrt(2) * step / period)
float c2 = b1
float c3 = -a1 * a1
float c1 = 1 - c2 - c3
float smoothed = 0.0
smoothed := bar_index >= 4
? c1 * (price + price ) / 2 + c2 * smoothed + c3 * smoothed
: price
smoothed
● Mean Reversion Signals:
The indicator identifies two types of mean reversion signals:
Simple Mean Reversion Signals: Triggered when the oscillator moves between thresholds of 1 and Overbought or between thresholds -1 and Ovesold, providing additional reversion opportunities. These signals are useful for capturing shorter-term corrections in trending markets.
Strong Mean Reversion Signals: Triggered when the oscillator above the overbought (upper band) or below oversold (lower band) thresholds, indicating a strong reversal point. These signals are marked with a "+" symbol on the chart for clear visibility.
Both types of signals are plotted on the oscillator and the main chart, helping traders to quickly identify potential trade entries or exits.
● Dynamic Bands and Thresholds:
The oscillator includes overbought and oversold bands based on a dynamically calculated standard deviation and EMA. These bands provide visual boundaries for identifying extreme price conditions, helping traders anticipate potential reversals at these levels.
● Real-Time Labels:
Labels are displayed at key thresholds and bands to indicate the oscillator’s status: "Overbought," "Oversold," and "Neutral". Mean reversion signals are also displayed on the main chart, providing an at-a-glance summary of current indicator conditions.
● Customizable Threshold Levels:
Traders can adjust the primary threshold and smoothing length according to their trading style. A higher threshold can reduce signal frequency, while a lower setting will provide more sensitivity to market reversals.
The Smooth Price Oscillator by BigBeluga is a refined, noise-filtered indicator designed to highlight mean reversion points with enhanced clarity. By providing both strong and simple reversion signals, as well as dynamic overbought/oversold bands, this tool allows traders to spot potential reversals and trend continuations with ease. Its dual representation on the oscillator and the main price chart offers flexibility and precision for any trading strategy focused on capturing cyclical market movements.
ATT Model with Buy/Sell SignalsIndicator Summary
This indicator is based on the ATT (Arithmetic Time Theory) model, using specific turning points derived from the ATT sequence (3, 11, 17, 29, 41, 47, 53, 59) to identify potential market reversals. It also integrates the RSI (Relative Strength Index) to confirm overbought and oversold conditions, triggering buy and sell signals when conditions align with the ATT sequence and RSI level.
Turning Points: Detected based on the ATT sequence applied to bar count. This suggests high-probability areas where the market could turn.
RSI Filter: Adds strength to the signals by ensuring buy signals occur when RSI is oversold (<30) and sell signals when RSI is overbought (>70).
Max Signals Per Session: Limits signals to two per session to reduce over-trading.
Entry Criteria
Buy Signal: Enter a buy trade if:
The indicator displays a green "BUY" marker.
RSI is below the oversold level (default <30), suggesting a potential upward reversal.
Sell Signal: Enter a sell trade if:
The indicator displays a red "SELL" marker.
RSI is above the overbought level (default >70), indicating a potential downward reversal.
Exit Criteria
Take Profit (TP):
Define TP as a fixed percentage or point value based on the asset's volatility. For example, set TP at 1.5-2x the risk, or a predefined point target (like 50-100 points).
Alternatively, exit the position when price approaches a key support/resistance level or the next significant swing high/low.
Stop Loss (SL):
Place the SL below the recent low (for buys) or above the recent high (for sells).
Set a fixed SL in points or percentage based on the asset’s average movement range, like an ATR-based stop, or limit it to a specific risk amount per trade (1-2% of account).
Trailing into Profit
Use a trailing strategy to lock in profits and let winning trades run further. Two main options:
ATR Trailing Stop:
Set the trailing stop based on the ATR (Average True Range), adjusting every time a new candle closes. This can help in volatile markets by keeping the stop at a consistent distance based on recent price movement.
Break-Even and Partial Profits:
When the price moves in your favor by a set amount (e.g., 1:1 risk/reward), move SL to the entry (break-even).
Take partial profit at intermediate levels (e.g., 50% at 1:1 RR) and trail the remainder.
Risk Management for Prop Firm Evaluation
Prop firms often have strict rules on daily loss limits, max drawdowns, and minimum profit targets. Here’s how to align your strategy with these:
Limit Risk per Trade:
Keep risk per trade to a conservative level (e.g., 1% or lower of your account balance). This allows for more room in case of a drawdown and aligns with most prop firm requirements.
Daily Loss Limits:
Set a daily stop-loss that ensures you don’t exceed the firm’s rules. For example, if the daily limit is 5%, stop trading once you reach a 3-4% drawdown.
Avoid Over-Trading:
Stick to the max signals per session rule (one or two trades). Taking only high-probability setups reduces emotional and reactive trades, preserving capital.
Stick to a Profit Target:
Aim to meet the evaluation’s profit goal efficiently but avoid risky or oversized trades to reach it faster.
Avoid Major Economic Events:
News events can disrupt technical setups. Avoid trading around significant releases (like FOMC or NFP) to reduce the chance of sudden losses due to high volatility.
Summary
Using this strategy with discipline, a structured entry/exit approach, and tight risk management can maximize your chances of passing a prop firm evaluation. The ATT model’s turning points, combined with the RSI, provide an edge by highlighting reversal zones, while limiting trades to 1-2 per session helps maintain controlled risk.
