samc's FX SESSIONS - on candles So, based on my 8 yrs of experience and over a 2 decade worth of back testing on FX majors pairs one thing i can univocally affirm to the fact that Timing is everything especially in the currency markets.
so i made this indicator to help reduce the noise and focus on signals which is coded by time,
now i made this as GMT+8 in focus but you can adjust based on your requirements.
I classified my indicator colors according to the inter-SESSION High Impact areas only as following :
Primary session colors:
ASIAN - YELLOW
EU - BLUE
US - Magenta (light)
and every first 10 mins of the hour (Great for scalping)
i marked them in a shade of grey.
secondary sessions i marked them as minor sessions.
PRE-EU 1hr of expected trend i marked in color green
and
after hours in a shade of color violet.
so i usually make my candles into light grey by default and remove the body and wicks to minimize the visual stimulus so that this indicator will work great with both dark and light themes and does not obstruct other indicators.
also i made an option to uncheck my naming scheme of session on the top right.
In den Scripts nach "session" suchen

VWAP Open Session Anchored by HampehThe VWAP Open Session Anchored indicator differs from traditional VWAP indicators by automatically anchoring the Volume Weighted Average Price calculation to three market session starts Morning, Evening, and Night. Each session represents a distinct time period within the trading day, offering traders and investors a more comprehensive view of the volume-weighted average price within specific sessions.
What Is the Volume-Weighted Average Price (VWAP)?
The volume-weighted average price (VWAP) is a technical analysis indicator used on intraday charts that resets at the start of every new trading session.
VWAP is important because it provides traders with pricing insight into both the trend and value of a security.
KEY TAKEAWAYS
1. The volume-weighted average price (VWAP) is a single line on intraday charts.
2. It looks similar to a moving average line but smoother.
3. VWAP represents a view of price action throughout a single day's trading session.
4. Retail and professional traders may use the VWAP to help them determine intraday price trends.
5. VWAP typically is most useful to short-term traders.
VWAP is calculated by totaling the dollars traded for every transaction (price multiplied by the volume) and then dividing by the total shares traded.
VWAP = Cumulative Typical Price x Volume/Cumulative Volume
Where Typical Price = High price + Low price + Closing Price/3
Cumulative = total since the trading session opened.
How Is VWAP Used?
VWAP is used in different ways by traders. Traders may use VWAP as a trend confirmation tool and build trading rules around it. For instance, they may consider stocks with prices below VWAP as undervalued and those with prices above it, as overvalued. If prices below VWAP move above it, traders may go long on the stock. If prices above VWAP move below it, they may sell their positions or initiate short positions.
Institutional buyers including mutual funds use VWAP to help move into or out of stocks with as small of a market impact as possible. Therefore, when they can, institutions will try to buy below the VWAP or sell above it. This way their actions push the price back toward the average, instead of away from it.
Source: www.investopedia.com

Chart Champions - Part 3 - SessionsThank you for sparing you time to read my indicator.
This indicator has been created as a suite of 3. This was to ensure that those with only the Free Trading View account could benefit (with their restriction to 3 indicators). Please ensure you install each indicator and read each indicator write up to fully understand what has tried to achieved.
Chart Champions – Part 1 –Lvls nPOC VWAPS
This indicator is broken down into:
• Levels
• VWAPS
• Naked Point of Control
Levels
It displays the levels to the right of the price Axis to enable the user to have a cleaner chart.
The below levels will automatically appear:
dOpen – pdHigh – pdLow – pdEQ – pwEQ
Optional Levels include:
mOpen – pmOpen – pdOpen – dbyOpen – wOpen – pwOpen
VWAPs
Optional VWAPs
Daily (including pdVWAP close) – Weekly – Monthly
Naked Points of Control (nPOC)
To view the nPOC move the chart back in time to pick up the nPOCs.
Chart Champions – Part 2 – CCV IBs POC
This indicator is broken down into:
• Chart Champions Value
• Initial Balance
• Points of Control
Chart Champions Value (CCV)
CCV is based on the 80% rule of the dOpen opening outside of the pdVAH/pdVAL. Please do you own research to fully understand how this trading strategy works (readily avaliable online).
Initial Balance (IB)
IB is based on the first 60 minutes of the market opening. It captures the highest and lowest points within that 60 minutes. Please do you own research to fully understand how this trading strategy works (readily avaliable online).
Points of Control (POCs)
POC are the price levels where the most volume was traded.
Developing POC (dPOC) will constantly move with volume/price action through out the day.
Optional POCs
Previous Day POC (pdPOC) – Day Before Yesterday POC (dbyPOC)
Chart Champions – Part 3 – Sessions - Manual Input
This indicator is broken down into:
• Manual Inputs (daily, weekly, monthly)
• IGOR SessionsTtimes
• Pre + Market Openings
Manual Input
Daily x3
Weekly x 3
Monthly x 3
This allows the trader to put in specific levels.
IGOR Session Times
This is a user specific requirement to highlight cetain times during the day, displayed at the bottom of the chart in the colour strip.
Pre + Market Openings
This allows the user to see when pre market trading has started and with the live maket has started, displayed at the top of the chart in colours.
A huge thank you goes out to:
Stackoverflow users AnyDozer and Bjorn.
TV user ahancock for allow me use of this code.
Disclaimer the lower the timeframe the more information it processes.

Kviateq - Session Pivots for CryptoPretty much the exact same indicator as my other Session Pivots, however this one also shows the weekends and the session times are set to Bitmex exchange (note: I'm in a GMT+7 timezone myself).
KZ SessionsThis shows killzone sessions for London NY, Asia sessions.
In addition to the opening hours of session, the pre-market and closing time periods are also marked with a grey color
Generally these are consided period of high activity and can experience more volatility in these periods
I also have enabled it to display the session times even on weekends. There is no session open at such times but heightened activity is noticed in these periods even on weekends.
If want to disable showing it on weekends, then remove ":1234567" from all the lines in code

ICT Sessions [Killzones]This indicator was initially Created by @BryceWH.
Modification by @leonsholo
The indicator uses New York Time
I modified it to match my own criteria which includes:
- I adjusted the time zones.
- Added tags to the settings to make it easy to know which kill zones you are toggling on or off.
- Added the Asia session
- Added the London Close session
How The Indicator Works
Plots the Asia, London, New York and London Close Kill zone as overlay boxes using current daily high / lows.
Marked ranges will move as days range / high and low widens.
Middle fills can be turned on and off.
Colours can be changed to match your preference.
Created this indicator because I didn't like highlighting the whole chart background as seen in other ICT Kill zone indicators on trading view and wanted something visually clearer.
Boxes height can be changed. Positive number puts the box outside current days high and low, negative number puts box inside current days high and low.
" Adapted from Chris Moody's original indicator HLOC" - BryceWH

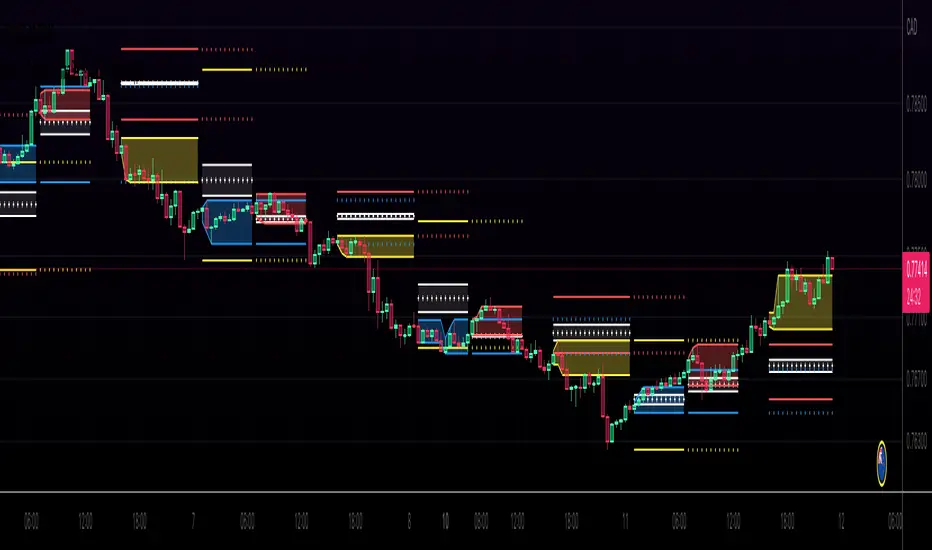
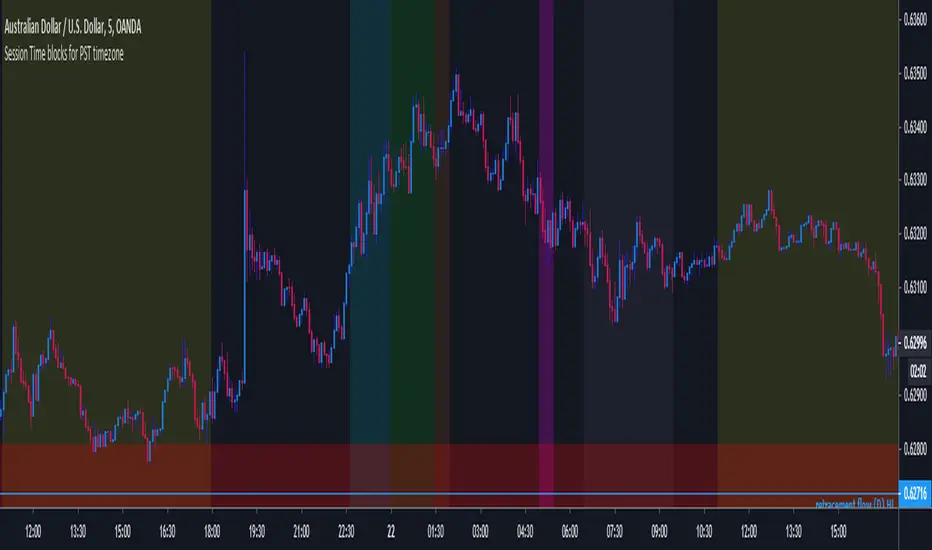
MF Custom Sessions (PST)Public Version - This is a session timing indicator for people in the PST time zone and represents each major session with a different color time block for intraday studies.

3 Sessions DividerAsia (Syndey + Tokio)
London
NY
Made for GMT-6 (Central US Time)
Sessions may Overlap.

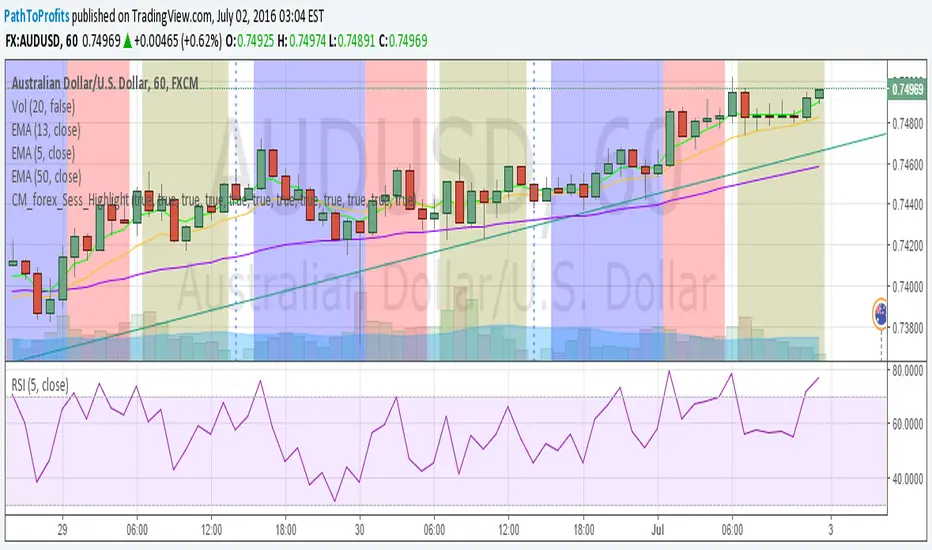
Simple (Forex) Sessions - Asia,London, NYSimple Sessions separator for Forex Traders.
Originally created by ChrisMoody, Edited by Me.
Adjusting the time/color is very easy, but default is EST and should work out of the box.
Hope this helps some people.
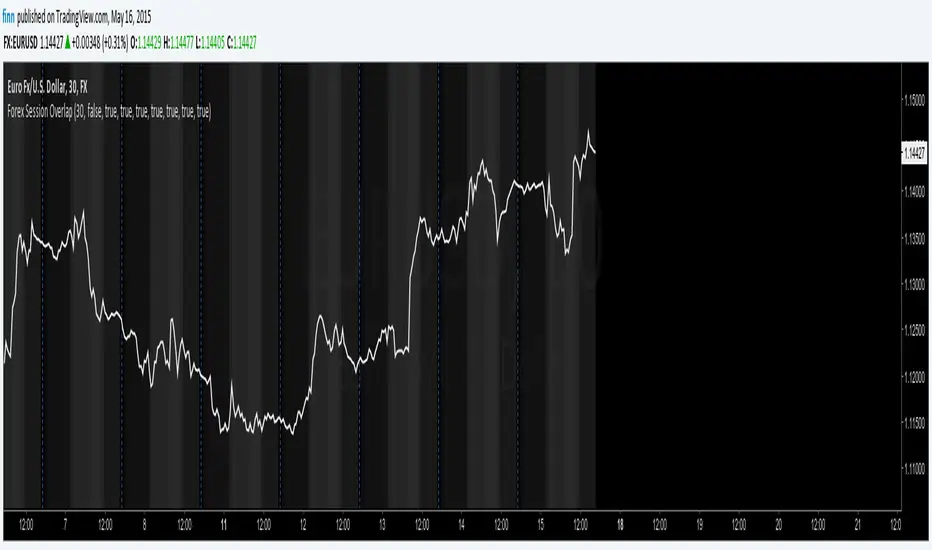
Forex Session OverlapApplies gray background coloring for each major active Forex session, the more sessions active the lighter the background. Adjusted coloring for low (Sydney, Tokyo) and high (Frankfurt, London, New York) liquidity. Market opening hours for Sydney, Tokyo, Frankfurt, London and New York have been set to 08:00 - 17:00 local time and are converted to EST while taking daylight saving time into account across regions (REMEMBER: configure manually!). Sessions can be turned on or off separately. By default this indicator hides itself in larger time-frames (>30min by default). Enabling session breaks or daily pivots helps distinguish between sessions.
Tokyo Sessions HighlighterOverview
This indicator provides a clean, visual representation of the Asian (Tokyo) trading session by highlighting its specific price range. It is designed to help traders identify the initial intraday range and key liquidity levels established during the Tokyo open.
Features
Dynamic Range Box: Automatically plots a box from the session's highest high to its lowest low.
Real-Time Updates: The box height and price labels update live as new session extremes are reached during the designated hours.
Professional Aesthetic: Features a minimalist gray fill, solid black borders, and black text for a clean, professional look on both light and dark chart themes.
Instant Data: Displays a label at the bottom of the box showing the exact price range in the format: Tokyo (Lowest Value - Highest Value).
How To Use
Settings: Adjust the Tokyo Session Time and Timezone in the indicator inputs to match your broker's server time or local requirements.
Strategy: Use the highlighted range to identify potential breakouts or to treat the session high and low as institutional liquidity zones for the London and New York sessions.
Customization: You can adjust the colors and transparency of the box through the script settings menu.

Active Market SessionsThis indicator displays non-intrusive colored squares that indicate which market session is currently active. When you hover over each square, it shows the active session and the remaining time before that session closes.
The following colors let you identify the active session at a glance:
London (European Session) = Purple
New York (American Session) = Blue
Sydney (Pacific Session) = Yellow
Tokyo (Asian Session) = Red
You can change the indicator’s position on the chart through the settings. This indicator is also DST-aware and automatically adjusts its behavior based on the current daylight saving time status of each session.

TTW-Day/Session Separator🗓️ Day Separator – Highlight Markers start times and days for Your Chart
This script adds automatic vertical lines to visually separate each trading day on your chart. It helps you quickly identify where each day starts and ends — especially useful for intraday and scalping strategies.
✅ Features:
Distinct lines for each weekday, month, week, trading session
Optional day-of-week labels (toggle on/off)
Custom label position (top or bottom of the chart)
Works on any timeframe
Whether you're tracking market sessions or reviewing daily price action, this tool gives you a clean structure to navigate your charts with more clarity.
Incomplete Session Candle - Incomplete Timeframe Candle Marker The "Incomplete Session Candle - Incomplete Timeframe Candle Marker" is an advanced tool tailored for technical analysts who understand the importance of accurate timeframes in their charting. While the indicator is not limited to the Indian market, its genesis is rooted in the nuances of trading sessions like those in India, which span 375 minutes from 9:15 AM to 3:30 PM.
Key Features:
Detects if the current timeframe is intraday (minutes or hours).
Calculates the expected duration of the candle for the chosen timeframe.
Highlights candles that don't achieve their expected session duration by placing a cross shape above the bar.
Compatible across various intraday timeframes, aiding traders in spotting discrepancies promptly.
Why We Made This: Not Just for India:
While we looked at the Indian market, this indicator works everywhere. Regular timeframes like 30 minutes, 1 hour, and 2 hours often end with incomplete candles, especially at the end of the trading day. For example:
A 30-minute timeframe makes 13 candles, but the last one is only 15 minutes long.
A 1-hour timeframe shows 7 candles, but the last one is just the last 15 minutes.
By switching to different timeframes like 25 minutes, 75 minutes, and 125 minutes, you get more complete information for better trading decisions. Learn more about this in our article: "Power of 25, 75, and 125-Minute Timeframes in the Indian Market", recognized by Trading View's Editors' Pick.
Benefits:
The indicator extends its benefits even to users without access to certain timeframes. It accommodates traders using a 1-hour timeframe (pertaining to Indian traders). By employing this indicator, traders consistently remain mindful of incomplete candles within their chosen timeframe
For those who utilize concepts like RBR, RBD, DBR, and DBD, this indicator is paramount. An incomplete candle can skew analysis, leading to potential misinterpretations of base or leg candles.
Final thoughts:
In markets like the Indian stock market, adopting such a tool is not just beneficial, but necessary. Whether you have access to unconventional timeframes or are using traditional ones, recognizing and accounting for the limitations of incomplete candles is critical & it's important to know if your candles fit the timeframe properly. This indicator gives you a better view of the market, which helps you make smarter trades.
Lastly, Thank you for your support! Your likes & comments. If you want to give any feedback then you can give in comment section.
Let's conquer the markets together!

Futures Exchange Sessions 3.0Description
The ultimate conclusion to the Futures Exchange Sessions 2.0 indicator. In version 3.0 the user gets full control of the start and end times of three separate dynamic boxes and one horizontal line. If the user wants to visually keep track of killzones, lunches, or any other time span in a trading day, version 3.0 will dynamically expand and keep track of price within the time specified by the user.
Inputs and Style
Everything about the three dynamic boxes and one horizontal line can but independently configured. Color, style, border, width can all be adjusted. In the Settings each box has a text box so the user can give each one a unique name.
Timezone
All of the start and end times are in EST. Additionally, each box and line need a dependent start of each day. This is controlled by a setting where the user can specify a timezone called Start Day Timezone which would be midnight of the respective timezone. In general if a box or line resides within a particular Session pick the corresponding timezone. If the users box/line fits in the Asian Session then choose Asia/Shanghai. If the box/line is within the London Session then choose Europe/London. And the same goes for the New York Session.
Special Notes
If start time is within one period of the Start Day Timezone in the Settings, then the line/box won't display
Boxes and time lines only display when timeframe is <= 30 minute
To turn off box text label set opacity to 0%
Phantom - My Session RangeThis is a modification of a script by RobMinty, "FXN - Asian Session Range" The script provides functionality to track specific trading sessions based on user preference rather than just the market sessions open and close. The idea is to help you hold yourself accountable to your specific trading times as well as backtest various marketing timings suitable to your schedule.
This script utilizes RobMinty's pine code to visualize your market session. We have adjusted the script to project the end of the session before the candles print - as well as adding/subtracting the horizontal and/or vertical lines around the current session box. This should help you understand how much time you have left in your session with a quick visual representation. While we have made some additions and adjustments to RobMinty's script- The inputs and functions of the combined script have not changed significantly from the originals. Like the originals, the code has been made open-source. If this script is reused or modified, please provide credit to RobMinty. If you plan to use this specific code with the ability to remove lines from the box and project session end forward, please credit both of us.
FxAST Session Encapsulation + VWAP [ALLDYN]-This tool allows the user to encapsulate ( box-in ) a single session ( Asian, London, New York - Only on the 1H Time Frame) trading range and then calculates the 50% midpoint of the single session high and low (the past six sessions are displayed).
-This information is beneficial if you are looking to trade during specific Time Price Opportunities during a given session (TPO). If you understand Supply & Demand , this additional information on your chart will help filter out a lot of the noise, allowing you to focus on associated price movement during those specific TPOs around your Supply & Demand Zones.
-This tool includes VWAP (Volume Weighted Average Price)
- Why do we need it? The volume-weighted average price (VWAP) is a statistic traders use to determine the average price of an instrument based on BOTH price AND volume.
- Why is it important? VWAP is important because it provides traders with insight into both the traded instrument's trend and value.

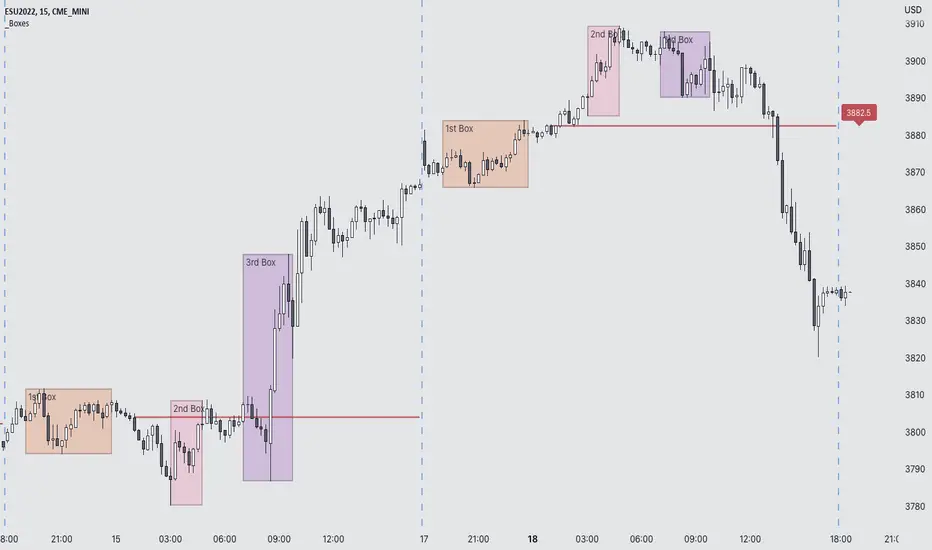
IB SessionsMarks the initial balance of each session (first hour).
Also the weekly IB is marked (first asian session)
Breakout lines for each session to determine possible breakouts on the session.

SMT for Time-Based Sessions [ufo]SMT for Time-Based Sessions identifies when one asset breaks a session’s high/low while another correlated asset fails to do so. This imbalance often signals engineered liquidity grabs, reversals, or continuation setups. By focusing on divergences within specific trading sessions (London, New York AM, Lunch, New York PM, Asia, Daily or your own custom windows), the tool filters out noise and pinpoints only the most meaningful SMT divergences across multiple symbols in real-time.
Core Concept:
SMT (Smart Money Technique/Tool/Time) is a concept popularized by Inner Circle Trader (ICT) that suggests that when correlated or inversely correlated instruments fail to confirm each other's price movements (e.g., one breaks a high/low while the other doesn’t), it often indicates:
Liquidity manipulation by institutional players
Potential reversal points in the market
Weakness or strength in the current trend
Stop hunt operations before significant moves
This indicator identifies these divergences by comparing your chart symbol against up to two comparison symbols across different sessions and timeframes.
How Time-Based SMT Works:
Unlike basic divergence tools, this indicator is built specifically for Session-Based and Timeframe-Based SMT tracking. It continuously monitors intraday sessions and higher timeframes, then plots divergences the moment they occur.
Time-Based Session SMT
Session Tracking: Monitors highs and lows during each session
Post-Session Analysis: After a session ends, tracks whether price breaks session levels
Divergence Detection: When the main symbol breaks a high/low but comparison symbols don’t (or vice versa), an SMT signal is triggered
(e.g. Nasdaq traded above London high while S&P500 does not)
Visual Confirmation: Lines connect the session reference to the current extreme, with labels showing the diverging session, high/low, and symbol, this information is also displayed in the Info Panel
This will update if a new high/low extreme is made while the SMT is still valid, if invalidated these will be removed from the chart
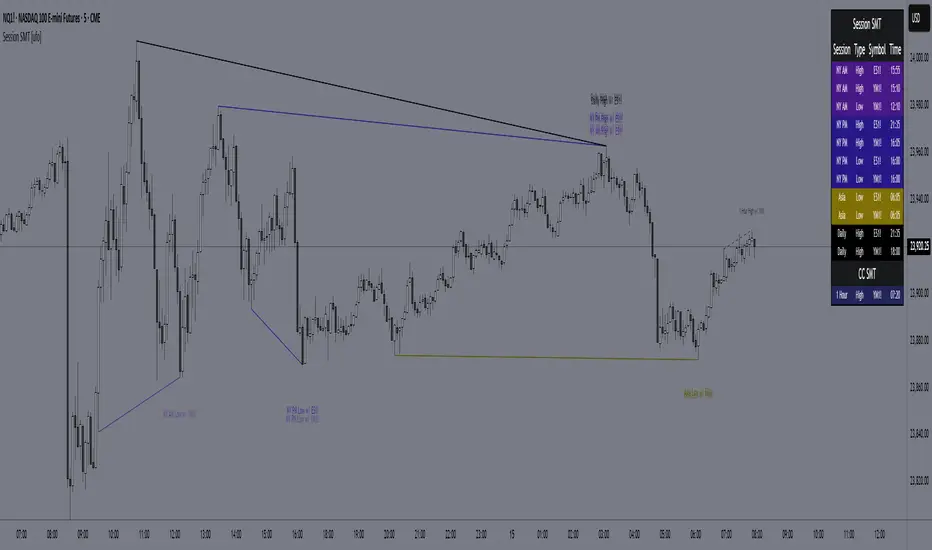
Example:
This NQ chart includes ES and YM as comparison symbols. At 03:20 AM New York time, both ES and YM broke the Asia session low (20:00 – 00:00), while NQ did not. This creates a bullish session divergence , which the indicator immediately detects and plots.
Although the chart shows three symbols for illustration, you don’t need to manually monitor comparison charts when using this indicator, the SMT divergence will be plotted automatically as soon as it occurs
Consecutive Candle SMT (CC SMT)
Previous Candle Reference: Uses the previous candle's high/low from the selected timeframe
Real-Time Comparison: Monitors if current price breaks these levels across all symbols
Instant Detection: Triggers SMT immediately when divergence occurs
Dynamic Updates: Lines and labels update in real-time as new extremes form and are automatically removed if invalidated
Example:
Here I configured CC SMT Timeframe 1 to monitor the previous 4-hour candle’s high/low. On this NQ chart with ES as a comparison symbol, ES broke above the prior 4-hour high at 14:00 New York time, while NQ did not, showing relative weakness creating a bearish CC SMT divergence
This chart is just an illustration. The indicator will automatically plot SMT divergences on your main chart, regardless of the timeframe you’re viewing
How To Use:
This indicator is not a buy/sell signal on its own. Instead, it is designed to highlight Time-Based SMT divergences so you can combine them with your existing trading strategy or model. It should be used as an extra layer of confluence, helping you confirm trade ideas.
Select your comparison symbols
For example:
Futures: NQ vs ES/YM
Forex: EURUSD vs GBPUSD/DXY(inversely)
Crypto: BTC vs ETH
Commodities: Gold vs Silver
Choose which sessions or candle timeframes you want the indicator to monitor
Watch for divergences the indicator plots when one symbol breaks a high/low while the other does not
Use these divergences as confluence, alongside your own strategy and risk management rules
Key Features:
Multiple Comparison Symbols
Symbol 1 & Symbol 2: Compare your main chart against up to 2 correlated instruments
Symbol Inversion: Perfect for inversely correlated pairs (e.g., EURUSD vs DXY)
Session-Based SMT Tracking
Monitors 7 fully customizable trading sessions with the default being:
London Session (2:00-5:00 NY time)
NY AM Session (9:30-12:00 NY time)
Lunch Session (12:00-13:00 NY time)
NY PM Session (13:00-16:00 NY time)
Asia Session (20:00-00:00 NY time)
Custom Session 6 (if you want to add an extra session)
Daily Session (18:00-18:00 NY time)
Fully customizable session times and names
Automatically detects when the main symbol breaks a session high/low while comparison symbols don't (and vice versa)
Consecutive Candle SMT (CC SMT)
Monitors 3 customizable timeframes
Tracking of divergences based on specific timeframe candles (15min, 60min, 4 hour, weekly, etc.)
Identifies when the current price breaks the previous candle's high/low differently than comparison symbols
Maintains history of past SMTs (configurable)
Timeframe 3 supports custom time shifts for non-standard candle boundaries
Example: 90min timeframe with a +60 shift changes the candle range from:
00:00-01:30, 01:30-03:00 etc
to:
01:00-02:30, 02:30-04:00 etc
Visual Customization
Line Styles: Customize the line styles for different symbols
Colors: Unique color schemes for instant session identification
Adjustable Offsets: Fine-tune label positions with multiplier settings
Show/Hide Controls: Complete control over visual elements
Custom Labels: Customize the SMT labels for highs and lows
Information Panel
Active SMT Conditions: Live tracking of all current divergences
Session Names: Clear identification of which session created the SMT
Symbol Information: Shows which comparison symbol is diverging
Timestamps: Optional time display showing when SMT was first detected
Flexible Positioning: 8 different panel positions
Smart Display Modes: Options to hide inactive sessions/timeframes
Alert System
Configurable alerts for specific sessions or timeframes
Get notified when new divergences appear instantly
Clear, informative alert descriptions
How To Setup Alerts:
Enable the "Enable Alerts" in the settings
Choose which sessions/timeframes to receive alerts for by choosing it in the setting below
(If you select "All Sessions" you will only be alerted for all the sessions you have enabled in the indicator settings)
Create an alert (ALT+A shortcut) or click the the 3 dots on the indicator "Add alert on Session SMT "
- Condition = Session SMT
- Function = Any alert() function call
- Alert name (Message) = Anything you prefer (e.g. SMT Alert)
If you want to create another alert for different settings, first input the new settings in the indicator, then create a new alert.
Note: Previous alerts will continue to notify you based on the settings they were originally set for, even if you change the indicator setting.
How This Helps Your Trading:
This tool automates the heavy lifting of tracking divergences across multiple markets and sessions, continuously monitoring highs and lows in real time and plotting only the most meaningful SMT signals so you can focus on execution, not chart-watching.
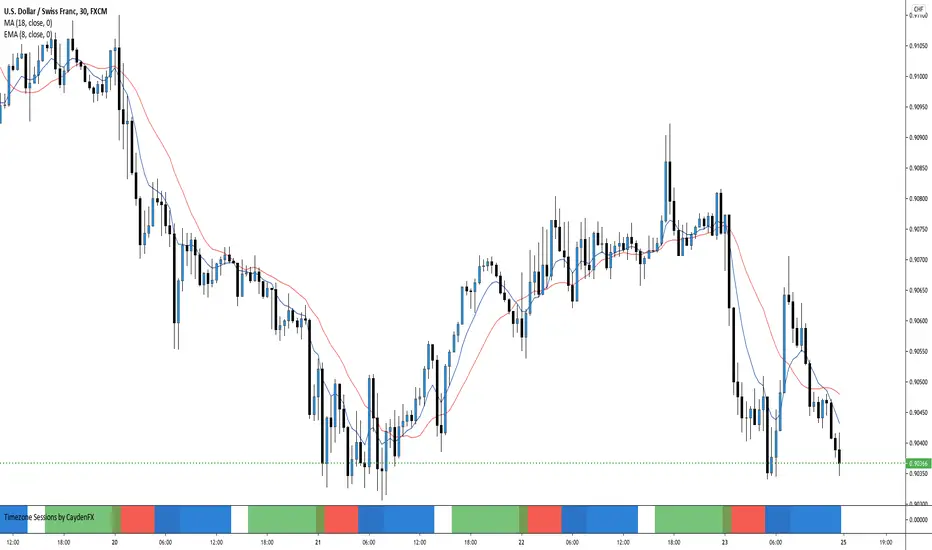
Timezone Sessions by CaydenFXThis indicator is used to tell when each market is in session. This is based on the Los Angeles time frame. You can customize the colors and opacity of each session. The sessions include London, New York, Sydney, and Tokyo. I only have three sessions being displayed in the picture.
Kviateq - Session PivotsFirst of all, I must say that this script wouldn't be possible without the help of one of the best script developers on TradingView - @ahancock (thanks a bunch for your help)
This script draws opening ranges for each of the sessions - Tokyo, London and New York and plots session high, low and pivot range of the previous session.
So if you trade London session - you would only take longs if we're above the Tokyo pivot range and vice versa for shorts.
Often times previous session's highs act as resistance and lows act as support, so careful trading around those levels.
It is obviously meant for lower timeframes, since each of the sessions only lasts a few hours.
Default settings are set to the exchange that I use and my timezone (GMT +7), so you might need to adjust the settings accordingly.
Tokyo - 12am GMT
London - 7am GMT
New York - 12pm GMT

ADO Sessions Indicator - New York, London, Asia - CustomizableADO Sessions is a clean and flexible session-highlighting indicator for intraday traders.
It allows you to clearly visualize the New York , London , and Asia trading sessions directly on your chart, with full control over how each session is displayed.
This indicator is designed for traders who want clarity without clutter.
Key Features
Three Major Trading Sessions
New York
London
Asia
Three Display Modes per Session
Off – No background, only session name and vertical start/end lines
Price Only – Background highlights only the session’s price range (High–Low)
Full Session – Background covers the entire chart vertically during the session
Session Labels
Session names are displayed at the session start
Labels stay aligned with the session when scrolling the chart
Vertical Session Lines
Precise vertical lines at session start and end
Always visible, independent of the background mode
Highly Customizable
Enable or disable each session independently
Custom colors and transparency per session
Works on all intraday timeframes
Compatible with crypto, futures, and forex markets
Why ADO Sessions
Clean visuals without clutter
No repainting
Built for professional intraday and session-based trading
Use Cases
Session-based trading strategies
Liquidity and volatility analysis
Market open and close timing
Crypto, futures, and forex trading
ADO Sessions focuses on one thing only:
making trading sessions clear, accurate, and fully customizable.
