Last 10 Sessions: High, Low, Pivot, GapLast 10 Sessions: High, Low, Pivot, Gap
This indicator highlights the most important price levels from the last 10 completed trading sessions to help intraday and swing traders quickly spot potential support, resistance, and price reaction zones.
Key Features:
Previous Highs and Lows : Visualize the high and low from each of the past 10 sessions. These are the most commonly tested breakout and reversal points for day trading.
Session Pivots: The classic pivot formula ((High + Low + Close) / 3) for each of the last 10 sessions, often acting as a market “equilibrium” or intraday magnet.
Gaps: Displays the difference between each day’s open and the previous session’s close (“gap”), showing sentiment shifts and possible gap fill targets.
Clean, Faded Visuals: All lines and labels are subtly faded so your chart remains clear and uncluttered, with each level labeled by how many sessions ago it occurred.
Full Customization: Instantly toggle any level type (High, Low, Pivot, Gap) ON/OFF in settings, extend lines to the right, and adjust their forward length.
Bulletproof Logic: Never throws runtime errors. Lines and labels only display when valid data is present.
How to Use:
Use recent highs/lows for breakout, breakdown, or mean reversion trades.
Spot where multiple levels from past sessions cluster together for high-probability reversal or breakout areas.
Watch pivots for intraday bias, and gaps for sentiment and possible fill plays.
Perfect for all intraday timeframes.
If you want a powerful yet minimal map of where price is most likely to react, this indicator is for you!
Developed by
In den Scripts nach "sentiment" suchen

Daily Candle BoxDaily candle overlay, high, low, and candle color based on open and close
Charts included in script: '3m', '5m', '15m', '1H'
1. Visualizes Key Daily Levels on Lower Timeframes:
The indicator overlays the previous day’s high and low as a box on a lower timeframe chart (e.g., 5-minute). This highlights critical support and resistance levels from the daily timeframe, making it easier to see where price might react without switching to a daily chart.
Use Case: Traders can identify potential reversal or breakout zones on intraday charts, aligning lower timeframe trades with higher timeframe structure.
2. Simplifies Intraday Trading Decisions:
By showing the previous day’s range (high to low) as a box, it provides a clear context for intraday price action. For example, if the price approaches the box’s top (previous day’s high), traders might anticipate resistance or a breakout.
Use Case: Useful for scalpers or day traders who need to quickly assess whether the price is near significant daily levels for entries, exits, or stop-loss placement.
3. Highlights Daily Candle Direction:
The box’s color (green for bullish, red for bearish) indicates whether the previous day’s close was above or below its open. This provides a quick visual cue about the prior day’s market sentiment.

Tensor Market Analysis Engine (TMAE)# Tensor Market Analysis Engine (TMAE)
## Advanced Multi-Dimensional Mathematical Analysis System
*Where Quantum Mathematics Meets Market Structure*
---
## 🎓 THEORETICAL FOUNDATION
The Tensor Market Analysis Engine represents a revolutionary synthesis of three cutting-edge mathematical frameworks that have never before been combined for comprehensive market analysis. This indicator transcends traditional technical analysis by implementing advanced mathematical concepts from quantum mechanics, information theory, and fractal geometry.
### 🌊 Multi-Dimensional Volatility with Jump Detection
**Hawkes Process Implementation:**
The TMAE employs a sophisticated Hawkes process approximation for detecting self-exciting market jumps. Unlike traditional volatility measures that treat price movements as independent events, the Hawkes process recognizes that market shocks cluster and exhibit memory effects.
**Mathematical Foundation:**
```
Intensity λ(t) = μ + Σ α(t - Tᵢ)
```
Where market jumps at times Tᵢ increase the probability of future jumps through the decay function α, controlled by the Hawkes Decay parameter (0.5-0.99).
**Mahalanobis Distance Calculation:**
The engine calculates volatility jumps using multi-dimensional Mahalanobis distance across up to 5 volatility dimensions:
- **Dimension 1:** Price volatility (standard deviation of returns)
- **Dimension 2:** Volume volatility (normalized volume fluctuations)
- **Dimension 3:** Range volatility (high-low spread variations)
- **Dimension 4:** Correlation volatility (price-volume relationship changes)
- **Dimension 5:** Microstructure volatility (intrabar positioning analysis)
This creates a volatility state vector that captures market behavior impossible to detect with traditional single-dimensional approaches.
### 📐 Hurst Exponent Regime Detection
**Fractal Market Hypothesis Integration:**
The TMAE implements advanced Rescaled Range (R/S) analysis to calculate the Hurst exponent in real-time, providing dynamic regime classification:
- **H > 0.6:** Trending (persistent) markets - momentum strategies optimal
- **H < 0.4:** Mean-reverting (anti-persistent) markets - contrarian strategies optimal
- **H ≈ 0.5:** Random walk markets - breakout strategies preferred
**Adaptive R/S Analysis:**
Unlike static implementations, the TMAE uses adaptive windowing that adjusts to market conditions:
```
H = log(R/S) / log(n)
```
Where R is the range of cumulative deviations and S is the standard deviation over period n.
**Dynamic Regime Classification:**
The system employs hysteresis to prevent regime flipping, requiring sustained Hurst values before regime changes are confirmed. This prevents false signals during transitional periods.
### 🔄 Transfer Entropy Analysis
**Information Flow Quantification:**
Transfer entropy measures the directional flow of information between price and volume, revealing lead-lag relationships that indicate future price movements:
```
TE(X→Y) = Σ p(yₜ₊₁, yₜ, xₜ) log
```
**Causality Detection:**
- **Volume → Price:** Indicates accumulation/distribution phases
- **Price → Volume:** Suggests retail participation or momentum chasing
- **Balanced Flow:** Market equilibrium or transition periods
The system analyzes multiple lag periods (2-20 bars) to capture both immediate and structural information flows.
---
## 🔧 COMPREHENSIVE INPUT SYSTEM
### Core Parameters Group
**Primary Analysis Window (10-100, Default: 50)**
The fundamental lookback period affecting all calculations. Optimization by timeframe:
- **1-5 minute charts:** 20-30 (rapid adaptation to micro-movements)
- **15 minute-1 hour:** 30-50 (balanced responsiveness and stability)
- **4 hour-daily:** 50-100 (smooth signals, reduced noise)
- **Asset-specific:** Cryptocurrency 20-35, Stocks 35-50, Forex 40-60
**Signal Sensitivity (0.1-2.0, Default: 0.7)**
Master control affecting all threshold calculations:
- **Conservative (0.3-0.6):** High-quality signals only, fewer false positives
- **Balanced (0.7-1.0):** Optimal risk-reward ratio for most trading styles
- **Aggressive (1.1-2.0):** Maximum signal frequency, requires careful filtering
**Signal Generation Mode:**
- **Aggressive:** Any component signals (highest frequency)
- **Confluence:** 2+ components agree (balanced approach)
- **Conservative:** All 3 components align (highest quality)
### Volatility Jump Detection Group
**Volatility Dimensions (2-5, Default: 3)**
Determines the mathematical space complexity:
- **2D:** Price + Volume volatility (suitable for clean markets)
- **3D:** + Range volatility (optimal for most conditions)
- **4D:** + Correlation volatility (advanced multi-asset analysis)
- **5D:** + Microstructure volatility (maximum sensitivity)
**Jump Detection Threshold (1.5-4.0σ, Default: 3.0σ)**
Standard deviations required for volatility jump classification:
- **Cryptocurrency:** 2.0-2.5σ (naturally volatile)
- **Stock Indices:** 2.5-3.0σ (moderate volatility)
- **Forex Major Pairs:** 3.0-3.5σ (typically stable)
- **Commodities:** 2.0-3.0σ (varies by commodity)
**Jump Clustering Decay (0.5-0.99, Default: 0.85)**
Hawkes process memory parameter:
- **0.5-0.7:** Fast decay (jumps treated as independent)
- **0.8-0.9:** Moderate clustering (realistic market behavior)
- **0.95-0.99:** Strong clustering (crisis/event-driven markets)
### Hurst Exponent Analysis Group
**Calculation Method Options:**
- **Classic R/S:** Original Rescaled Range (fast, simple)
- **Adaptive R/S:** Dynamic windowing (recommended for trading)
- **DFA:** Detrended Fluctuation Analysis (best for noisy data)
**Trending Threshold (0.55-0.8, Default: 0.60)**
Hurst value defining persistent market behavior:
- **0.55-0.60:** Weak trend persistence
- **0.65-0.70:** Clear trending behavior
- **0.75-0.80:** Strong momentum regimes
**Mean Reversion Threshold (0.2-0.45, Default: 0.40)**
Hurst value defining anti-persistent behavior:
- **0.35-0.45:** Weak mean reversion
- **0.25-0.35:** Clear ranging behavior
- **0.15-0.25:** Strong reversion tendency
### Transfer Entropy Parameters Group
**Information Flow Analysis:**
- **Price-Volume:** Classic flow analysis for accumulation/distribution
- **Price-Volatility:** Risk flow analysis for sentiment shifts
- **Multi-Timeframe:** Cross-timeframe causality detection
**Maximum Lag (2-20, Default: 5)**
Causality detection window:
- **2-5 bars:** Immediate causality (scalping)
- **5-10 bars:** Short-term flow (day trading)
- **10-20 bars:** Structural flow (swing trading)
**Significance Threshold (0.05-0.3, Default: 0.15)**
Minimum entropy for signal generation:
- **0.05-0.10:** Detect subtle information flows
- **0.10-0.20:** Clear causality only
- **0.20-0.30:** Very strong flows only
---
## 🎨 ADVANCED VISUAL SYSTEM
### Tensor Volatility Field Visualization
**Five-Layer Resonance Bands:**
The tensor field creates dynamic support/resistance zones that expand and contract based on mathematical field strength:
- **Core Layer (Purple):** Primary tensor field with highest intensity
- **Layer 2 (Neutral):** Secondary mathematical resonance
- **Layer 3 (Info Blue):** Tertiary harmonic frequencies
- **Layer 4 (Warning Gold):** Outer field boundaries
- **Layer 5 (Success Green):** Maximum field extension
**Field Strength Calculation:**
```
Field Strength = min(3.0, Mahalanobis Distance × Tensor Intensity)
```
The field amplitude adjusts to ATR and mathematical distance, creating dynamic zones that respond to market volatility.
**Radiation Line Network:**
During active tensor states, the system projects directional radiation lines showing field energy distribution:
- **8 Directional Rays:** Complete angular coverage
- **Tapering Segments:** Progressive transparency for natural visual flow
- **Pulse Effects:** Enhanced visualization during volatility jumps
### Dimensional Portal System
**Portal Mathematics:**
Dimensional portals visualize regime transitions using category theory principles:
- **Green Portals (◉):** Trending regime detection (appear below price for support)
- **Red Portals (◎):** Mean-reverting regime (appear above price for resistance)
- **Yellow Portals (○):** Random walk regime (neutral positioning)
**Tensor Trail Effects:**
Each portal generates 8 trailing particles showing mathematical momentum:
- **Large Particles (●):** Strong mathematical signal
- **Medium Particles (◦):** Moderate signal strength
- **Small Particles (·):** Weak signal continuation
- **Micro Particles (˙):** Signal dissipation
### Information Flow Streams
**Particle Stream Visualization:**
Transfer entropy creates flowing particle streams indicating information direction:
- **Upward Streams:** Volume leading price (accumulation phases)
- **Downward Streams:** Price leading volume (distribution phases)
- **Stream Density:** Proportional to information flow strength
**15-Particle Evolution:**
Each stream contains 15 particles with progressive sizing and transparency, creating natural flow visualization that makes information transfer immediately apparent.
### Fractal Matrix Grid System
**Multi-Timeframe Fractal Levels:**
The system calculates and displays fractal highs/lows across five Fibonacci periods:
- **8-Period:** Short-term fractal structure
- **13-Period:** Intermediate-term patterns
- **21-Period:** Primary swing levels
- **34-Period:** Major structural levels
- **55-Period:** Long-term fractal boundaries
**Triple-Layer Visualization:**
Each fractal level uses three-layer rendering:
- **Shadow Layer:** Widest, darkest foundation (width 5)
- **Glow Layer:** Medium white core line (width 3)
- **Tensor Layer:** Dotted mathematical overlay (width 1)
**Intelligent Labeling System:**
Smart spacing prevents label overlap using ATR-based minimum distances. Labels include:
- **Fractal Period:** Time-based identification
- **Topological Class:** Mathematical complexity rating (0, I, II, III)
- **Price Level:** Exact fractal price
- **Mahalanobis Distance:** Current mathematical field strength
- **Hurst Exponent:** Current regime classification
- **Anomaly Indicators:** Visual strength representations (○ ◐ ● ⚡)
### Wick Pressure Analysis
**Rejection Level Mathematics:**
The system analyzes candle wick patterns to project future pressure zones:
- **Upper Wick Analysis:** Identifies selling pressure and resistance zones
- **Lower Wick Analysis:** Identifies buying pressure and support zones
- **Pressure Projection:** Extends lines forward based on mathematical probability
**Multi-Layer Glow Effects:**
Wick pressure lines use progressive transparency (1-8 layers) creating natural glow effects that make pressure zones immediately visible without cluttering the chart.
### Enhanced Regime Background
**Dynamic Intensity Mapping:**
Background colors reflect mathematical regime strength:
- **Deep Transparency (98% alpha):** Subtle regime indication
- **Pulse Intensity:** Based on regime strength calculation
- **Color Coding:** Green (trending), Red (mean-reverting), Neutral (random)
**Smoothing Integration:**
Regime changes incorporate 10-bar smoothing to prevent background flicker while maintaining responsiveness to genuine regime shifts.
### Color Scheme System
**Six Professional Themes:**
- **Dark (Default):** Professional trading environment optimization
- **Light:** High ambient light conditions
- **Classic:** Traditional technical analysis appearance
- **Neon:** High-contrast visibility for active trading
- **Neutral:** Minimal distraction focus
- **Bright:** Maximum visibility for complex setups
Each theme maintains mathematical accuracy while optimizing visual clarity for different trading environments and personal preferences.
---
## 📊 INSTITUTIONAL-GRADE DASHBOARD
### Tensor Field Status Section
**Field Strength Display:**
Real-time Mahalanobis distance calculation with dynamic emoji indicators:
- **⚡ (Lightning):** Extreme field strength (>1.5× threshold)
- **● (Solid Circle):** Strong field activity (>1.0× threshold)
- **○ (Open Circle):** Normal field state
**Signal Quality Rating:**
Democratic algorithm assessment:
- **ELITE:** All 3 components aligned (highest probability)
- **STRONG:** 2 components aligned (good probability)
- **GOOD:** 1 component active (moderate probability)
- **WEAK:** No clear component signals
**Threshold and Anomaly Monitoring:**
- **Threshold Display:** Current mathematical threshold setting
- **Anomaly Level (0-100%):** Combined volatility and volume spike measurement
- **>70%:** High anomaly (red warning)
- **30-70%:** Moderate anomaly (orange caution)
- **<30%:** Normal conditions (green confirmation)
### Tensor State Analysis Section
**Mathematical State Classification:**
- **↑ BULL (Tensor State +1):** Trending regime with bullish bias
- **↓ BEAR (Tensor State -1):** Mean-reverting regime with bearish bias
- **◈ SUPER (Tensor State 0):** Random walk regime (neutral)
**Visual State Gauge:**
Five-circle progression showing tensor field polarity:
- **🟢🟢🟢⚪⚪:** Strong bullish mathematical alignment
- **⚪⚪🟡⚪⚪:** Neutral/transitional state
- **⚪⚪🔴🔴🔴:** Strong bearish mathematical alignment
**Trend Direction and Phase Analysis:**
- **📈 BULL / 📉 BEAR / ➡️ NEUTRAL:** Primary trend classification
- **🌪️ CHAOS:** Extreme information flow (>2.0 flow strength)
- **⚡ ACTIVE:** Strong information flow (1.0-2.0 flow strength)
- **😴 CALM:** Low information flow (<1.0 flow strength)
### Trading Signals Section
**Real-Time Signal Status:**
- **🟢 ACTIVE / ⚪ INACTIVE:** Long signal availability
- **🔴 ACTIVE / ⚪ INACTIVE:** Short signal availability
- **Components (X/3):** Active algorithmic components
- **Mode Display:** Current signal generation mode
**Signal Strength Visualization:**
Color-coded component count:
- **Green:** 3/3 components (maximum confidence)
- **Aqua:** 2/3 components (good confidence)
- **Orange:** 1/3 components (moderate confidence)
- **Gray:** 0/3 components (no signals)
### Performance Metrics Section
**Win Rate Monitoring:**
Estimated win rates based on signal quality with emoji indicators:
- **🔥 (Fire):** ≥60% estimated win rate
- **👍 (Thumbs Up):** 45-59% estimated win rate
- **⚠️ (Warning):** <45% estimated win rate
**Mathematical Metrics:**
- **Hurst Exponent:** Real-time fractal dimension (0.000-1.000)
- **Information Flow:** Volume/price leading indicators
- **📊 VOL:** Volume leading price (accumulation/distribution)
- **💰 PRICE:** Price leading volume (momentum/speculation)
- **➖ NONE:** Balanced information flow
- **Volatility Classification:**
- **🔥 HIGH:** Above 1.5× jump threshold
- **📊 NORM:** Normal volatility range
- **😴 LOW:** Below 0.5× jump threshold
### Market Structure Section (Large Dashboard)
**Regime Classification:**
- **📈 TREND:** Hurst >0.6, momentum strategies optimal
- **🔄 REVERT:** Hurst <0.4, contrarian strategies optimal
- **🎲 RANDOM:** Hurst ≈0.5, breakout strategies preferred
**Mathematical Field Analysis:**
- **Dimensions:** Current volatility space complexity (2D-5D)
- **Hawkes λ (Lambda):** Self-exciting jump intensity (0.00-1.00)
- **Jump Status:** 🚨 JUMP (active) / ✅ NORM (normal)
### Settings Summary Section (Large Dashboard)
**Active Configuration Display:**
- **Sensitivity:** Current master sensitivity setting
- **Lookback:** Primary analysis window
- **Theme:** Active color scheme
- **Method:** Hurst calculation method (Classic R/S, Adaptive R/S, DFA)
**Dashboard Sizing Options:**
- **Small:** Essential metrics only (mobile/small screens)
- **Normal:** Balanced information density (standard desktop)
- **Large:** Maximum detail (multi-monitor setups)
**Position Options:**
- **Top Right:** Standard placement (avoids price action)
- **Top Left:** Wide chart optimization
- **Bottom Right:** Recent price focus (scalping)
- **Bottom Left:** Maximum price visibility (swing trading)
---
## 🎯 SIGNAL GENERATION LOGIC
### Multi-Component Convergence System
**Component Signal Architecture:**
The TMAE generates signals through sophisticated component analysis rather than simple threshold crossing:
**Volatility Component:**
- **Jump Detection:** Mahalanobis distance threshold breach
- **Hawkes Intensity:** Self-exciting process activation (>0.2)
- **Multi-dimensional:** Considers all volatility dimensions simultaneously
**Hurst Regime Component:**
- **Trending Markets:** Price above SMA-20 with positive momentum
- **Mean-Reverting Markets:** Price at Bollinger Band extremes
- **Random Markets:** Bollinger squeeze breakouts with directional confirmation
**Transfer Entropy Component:**
- **Volume Leadership:** Information flow from volume to price
- **Volume Spike:** Volume 110%+ above 20-period average
- **Flow Significance:** Above entropy threshold with directional bias
### Democratic Signal Weighting
**Signal Mode Implementation:**
- **Aggressive Mode:** Any single component triggers signal
- **Confluence Mode:** Minimum 2 components must agree
- **Conservative Mode:** All 3 components must align
**Momentum Confirmation:**
All signals require momentum confirmation:
- **Long Signals:** RSI >50 AND price >EMA-9
- **Short Signals:** RSI <50 AND price 0.6):**
- **Increase Sensitivity:** Catch momentum continuation
- **Lower Mean Reversion Threshold:** Avoid counter-trend signals
- **Emphasize Volume Leadership:** Institutional accumulation/distribution
- **Tensor Field Focus:** Use expansion for trend continuation
- **Signal Mode:** Aggressive or Confluence for trend following
**Range-Bound Markets (Hurst <0.4):**
- **Decrease Sensitivity:** Avoid false breakouts
- **Lower Trending Threshold:** Quick regime recognition
- **Focus on Price Leadership:** Retail sentiment extremes
- **Fractal Grid Emphasis:** Support/resistance trading
- **Signal Mode:** Conservative for high-probability reversals
**Volatile Markets (High Jump Frequency):**
- **Increase Hawkes Decay:** Recognize event clustering
- **Higher Jump Threshold:** Avoid noise signals
- **Maximum Dimensions:** Capture full volatility complexity
- **Reduce Position Sizing:** Risk management adaptation
- **Enhanced Visuals:** Maximum information for rapid decisions
**Low Volatility Markets (Low Jump Frequency):**
- **Decrease Jump Threshold:** Capture subtle movements
- **Lower Hawkes Decay:** Treat moves as independent
- **Reduce Dimensions:** Simplify analysis
- **Increase Position Sizing:** Capitalize on compressed volatility
- **Minimal Visuals:** Reduce distraction in quiet markets
---
## 🚀 ADVANCED TRADING STRATEGIES
### The Mathematical Convergence Method
**Entry Protocol:**
1. **Fractal Grid Approach:** Monitor price approaching significant fractal levels
2. **Tensor Field Confirmation:** Verify field expansion supporting direction
3. **Portal Signal:** Wait for dimensional portal appearance
4. **ELITE/STRONG Quality:** Only trade highest quality mathematical signals
5. **Component Consensus:** Confirm 2+ components agree in Confluence mode
**Example Implementation:**
- Price approaching 21-period fractal high
- Tensor field expanding upward (bullish mathematical alignment)
- Green portal appears below price (trending regime confirmation)
- ELITE quality signal with 3/3 components active
- Enter long position with stop below fractal level
**Risk Management:**
- **Stop Placement:** Below/above fractal level that generated signal
- **Position Sizing:** Based on Mahalanobis distance (higher distance = smaller size)
- **Profit Targets:** Next fractal level or tensor field resistance
### The Regime Transition Strategy
**Regime Change Detection:**
1. **Monitor Hurst Exponent:** Watch for persistent moves above/below thresholds
2. **Portal Color Change:** Regime transitions show different portal colors
3. **Background Intensity:** Increasing regime background intensity
4. **Mathematical Confirmation:** Wait for regime confirmation (hysteresis)
**Trading Implementation:**
- **Trending Transitions:** Trade momentum breakouts, follow trend
- **Mean Reversion Transitions:** Trade range boundaries, fade extremes
- **Random Transitions:** Trade breakouts with tight stops
**Advanced Techniques:**
- **Multi-Timeframe:** Confirm regime on higher timeframe
- **Early Entry:** Enter on regime transition rather than confirmation
- **Regime Strength:** Larger positions during strong regime signals
### The Information Flow Momentum Strategy
**Flow Detection Protocol:**
1. **Monitor Transfer Entropy:** Watch for significant information flow shifts
2. **Volume Leadership:** Strong edge when volume leads price
3. **Flow Acceleration:** Increasing flow strength indicates momentum
4. **Directional Confirmation:** Ensure flow aligns with intended trade direction
**Entry Signals:**
- **Volume → Price Flow:** Enter during accumulation/distribution phases
- **Price → Volume Flow:** Enter on momentum confirmation breaks
- **Flow Reversal:** Counter-trend entries when flow reverses
**Optimization:**
- **Scalping:** Use immediate flow detection (2-5 bar lag)
- **Swing Trading:** Use structural flow (10-20 bar lag)
- **Multi-Asset:** Compare flow between correlated assets
### The Tensor Field Expansion Strategy
**Field Mathematics:**
The tensor field expansion indicates mathematical pressure building in market structure:
**Expansion Phases:**
1. **Compression:** Field contracts, volatility decreases
2. **Tension Building:** Mathematical pressure accumulates
3. **Expansion:** Field expands rapidly with directional movement
4. **Resolution:** Field stabilizes at new equilibrium
**Trading Applications:**
- **Compression Trading:** Prepare for breakout during field contraction
- **Expansion Following:** Trade direction of field expansion
- **Reversion Trading:** Fade extreme field expansion
- **Multi-Dimensional:** Consider all field layers for confirmation
### The Hawkes Process Event Strategy
**Self-Exciting Jump Trading:**
Understanding that market shocks cluster and create follow-on opportunities:
**Jump Sequence Analysis:**
1. **Initial Jump:** First volatility jump detected
2. **Clustering Phase:** Hawkes intensity remains elevated
3. **Follow-On Opportunities:** Additional jumps more likely
4. **Decay Period:** Intensity gradually decreases
**Implementation:**
- **Jump Confirmation:** Wait for mathematical jump confirmation
- **Direction Assessment:** Use other components for direction
- **Clustering Trades:** Trade subsequent moves during high intensity
- **Decay Exit:** Exit positions as Hawkes intensity decays
### The Fractal Confluence System
**Multi-Timeframe Fractal Analysis:**
Combining fractal levels across different periods for high-probability zones:
**Confluence Zones:**
- **Double Confluence:** 2 fractal levels align
- **Triple Confluence:** 3+ fractal levels cluster
- **Mathematical Confirmation:** Tensor field supports the level
- **Information Flow:** Transfer entropy confirms direction
**Trading Protocol:**
1. **Identify Confluence:** Find 2+ fractal levels within 1 ATR
2. **Mathematical Support:** Verify tensor field alignment
3. **Signal Quality:** Wait for STRONG or ELITE signal
4. **Risk Definition:** Use fractal level for stop placement
5. **Profit Targeting:** Next major fractal confluence zone
---
## ⚠️ COMPREHENSIVE RISK MANAGEMENT
### Mathematical Position Sizing
**Mahalanobis Distance Integration:**
Position size should inversely correlate with mathematical field strength:
```
Position Size = Base Size × (Threshold / Mahalanobis Distance)
```
**Risk Scaling Matrix:**
- **Low Field Strength (<2.0):** Standard position sizing
- **Moderate Field Strength (2.0-3.0):** 75% position sizing
- **High Field Strength (3.0-4.0):** 50% position sizing
- **Extreme Field Strength (>4.0):** 25% position sizing or no trade
### Signal Quality Risk Adjustment
**Quality-Based Position Sizing:**
- **ELITE Signals:** 100% of planned position size
- **STRONG Signals:** 75% of planned position size
- **GOOD Signals:** 50% of planned position size
- **WEAK Signals:** No position or paper trading only
**Component Agreement Scaling:**
- **3/3 Components:** Full position size
- **2/3 Components:** 75% position size
- **1/3 Components:** 50% position size or skip trade
### Regime-Adaptive Risk Management
**Trending Market Risk:**
- **Wider Stops:** Allow for trend continuation
- **Trend Following:** Trade with regime direction
- **Higher Position Size:** Trend probability advantage
- **Momentum Stops:** Trail stops based on momentum indicators
**Mean-Reverting Market Risk:**
- **Tighter Stops:** Quick exits on trend continuation
- **Contrarian Positioning:** Trade against extremes
- **Smaller Position Size:** Higher reversal failure rate
- **Level-Based Stops:** Use fractal levels for stops
**Random Market Risk:**
- **Breakout Focus:** Trade only clear breakouts
- **Tight Initial Stops:** Quick exit if breakout fails
- **Reduced Frequency:** Skip marginal setups
- **Range-Based Targets:** Profit targets at range boundaries
### Volatility-Adaptive Risk Controls
**High Volatility Periods:**
- **Reduced Position Size:** Account for wider price swings
- **Wider Stops:** Avoid noise-based exits
- **Lower Frequency:** Skip marginal setups
- **Faster Exits:** Take profits more quickly
**Low Volatility Periods:**
- **Standard Position Size:** Normal risk parameters
- **Tighter Stops:** Take advantage of compressed ranges
- **Higher Frequency:** Trade more setups
- **Extended Targets:** Allow for compressed volatility expansion
### Multi-Timeframe Risk Alignment
**Higher Timeframe Trend:**
- **With Trend:** Standard or increased position size
- **Against Trend:** Reduced position size or skip
- **Neutral Trend:** Standard position size with tight management
**Risk Hierarchy:**
1. **Primary:** Current timeframe signal quality
2. **Secondary:** Higher timeframe trend alignment
3. **Tertiary:** Mathematical field strength
4. **Quaternary:** Market regime classification
---
## 📚 EDUCATIONAL VALUE AND MATHEMATICAL CONCEPTS
### Advanced Mathematical Concepts
**Tensor Analysis in Markets:**
The TMAE introduces traders to tensor analysis, a branch of mathematics typically reserved for physics and advanced engineering. Tensors provide a framework for understanding multi-dimensional market relationships that scalar and vector analysis cannot capture.
**Information Theory Applications:**
Transfer entropy implementation teaches traders about information flow in markets, a concept from information theory that quantifies directional causality between variables. This provides intuition about market microstructure and participant behavior.
**Fractal Geometry in Trading:**
The Hurst exponent calculation exposes traders to fractal geometry concepts, helping understand that markets exhibit self-similar patterns across multiple timeframes. This mathematical insight transforms how traders view market structure.
**Stochastic Process Theory:**
The Hawkes process implementation introduces concepts from stochastic process theory, specifically self-exciting point processes. This provides mathematical framework for understanding why market events cluster and exhibit memory effects.
### Learning Progressive Complexity
**Beginner Mathematical Concepts:**
- **Volatility Dimensions:** Understanding multi-dimensional analysis
- **Regime Classification:** Learning market personality types
- **Signal Democracy:** Algorithmic consensus building
- **Visual Mathematics:** Interpreting mathematical concepts visually
**Intermediate Mathematical Applications:**
- **Mahalanobis Distance:** Statistical distance in multi-dimensional space
- **Rescaled Range Analysis:** Fractal dimension measurement
- **Information Entropy:** Quantifying uncertainty and causality
- **Field Theory:** Understanding mathematical fields in market context
**Advanced Mathematical Integration:**
- **Tensor Field Dynamics:** Multi-dimensional market force analysis
- **Stochastic Self-Excitation:** Event clustering and memory effects
- **Categorical Composition:** Mathematical signal combination theory
- **Topological Market Analysis:** Understanding market shape and connectivity
### Practical Mathematical Intuition
**Developing Market Mathematics Intuition:**
The TMAE serves as a bridge between abstract mathematical concepts and practical trading applications. Traders develop intuitive understanding of:
- **How markets exhibit mathematical structure beneath apparent randomness**
- **Why multi-dimensional analysis reveals patterns invisible to single-variable approaches**
- **How information flows through markets in measurable, predictable ways**
- **Why mathematical models provide probabilistic edges rather than certainties**
---
## 🔬 IMPLEMENTATION AND OPTIMIZATION
### Getting Started Protocol
**Phase 1: Observation (Week 1)**
1. **Apply with defaults:** Use standard settings on your primary trading timeframe
2. **Study visual elements:** Learn to interpret tensor fields, portals, and streams
3. **Monitor dashboard:** Observe how metrics change with market conditions
4. **No trading:** Focus entirely on pattern recognition and understanding
**Phase 2: Pattern Recognition (Week 2-3)**
1. **Identify signal patterns:** Note what market conditions produce different signal qualities
2. **Regime correlation:** Observe how Hurst regimes affect signal performance
3. **Visual confirmation:** Learn to read tensor field expansion and portal signals
4. **Component analysis:** Understand which components drive signals in different markets
**Phase 3: Parameter Optimization (Week 4-5)**
1. **Asset-specific tuning:** Adjust parameters for your specific trading instrument
2. **Timeframe optimization:** Fine-tune for your preferred trading timeframe
3. **Sensitivity adjustment:** Balance signal frequency with quality
4. **Visual customization:** Optimize colors and intensity for your trading environment
**Phase 4: Live Implementation (Week 6+)**
1. **Paper trading:** Test signals with hypothetical trades
2. **Small position sizing:** Begin with minimal risk during learning phase
3. **Performance tracking:** Monitor actual vs. expected signal performance
4. **Continuous optimization:** Refine settings based on real performance data
### Performance Monitoring System
**Signal Quality Tracking:**
- **ELITE Signal Win Rate:** Track highest quality signals separately
- **Component Performance:** Monitor which components provide best signals
- **Regime Performance:** Analyze performance across different market regimes
- **Timeframe Analysis:** Compare performance across different session times
**Mathematical Metric Correlation:**
- **Field Strength vs. Performance:** Higher field strength should correlate with better performance
- **Component Agreement vs. Win Rate:** More component agreement should improve win rates
- **Regime Alignment vs. Success:** Trading with mathematical regime should outperform
### Continuous Optimization Process
**Monthly Review Protocol:**
1. **Performance Analysis:** Review win rates, profit factors, and maximum drawdown
2. **Parameter Assessment:** Evaluate if current settings remain optimal
3. **Market Adaptation:** Adjust for changes in market character or volatility
4. **Component Weighting:** Consider if certain components should receive more/less emphasis
**Quarterly Deep Analysis:**
1. **Mathematical Model Validation:** Verify that mathematical relationships remain valid
2. **Regime Distribution:** Analyze time spent in different market regimes
3. **Signal Evolution:** Track how signal characteristics change over time
4. **Correlation Analysis:** Monitor correlations between different mathematical components
---
## 🌟 UNIQUE INNOVATIONS AND CONTRIBUTIONS
### Revolutionary Mathematical Integration
**First-Ever Implementations:**
1. **Multi-Dimensional Volatility Tensor:** First indicator to implement true tensor analysis for market volatility
2. **Real-Time Hawkes Process:** First trading implementation of self-exciting point processes
3. **Transfer Entropy Trading Signals:** First practical application of information theory for trade generation
4. **Democratic Component Voting:** First algorithmic consensus system for signal generation
5. **Fractal-Projected Signal Quality:** First system to predict signal quality at future price levels
### Advanced Visualization Innovations
**Mathematical Visualization Breakthroughs:**
- **Tensor Field Radiation:** Visual representation of mathematical field energy
- **Dimensional Portal System:** Category theory visualization for regime transitions
- **Information Flow Streams:** Real-time visual display of market information transfer
- **Multi-Layer Fractal Grid:** Intelligent spacing and projection system
- **Regime Intensity Mapping:** Dynamic background showing mathematical regime strength
### Practical Trading Innovations
**Trading System Advances:**
- **Quality-Weighted Signal Generation:** Signals rated by mathematical confidence
- **Regime-Adaptive Strategy Selection:** Automatic strategy optimization based on market personality
- **Anti-Spam Signal Protection:** Mathematical prevention of signal clustering
- **Component Performance Tracking:** Real-time monitoring of algorithmic component success
- **Field-Strength Position Sizing:** Mathematical volatility integration for risk management
---
## ⚖️ RESPONSIBLE USAGE AND LIMITATIONS
### Mathematical Model Limitations
**Understanding Model Boundaries:**
While the TMAE implements sophisticated mathematical concepts, traders must understand fundamental limitations:
- **Markets Are Not Purely Mathematical:** Human psychology, news events, and fundamental factors create unpredictable elements
- **Past Performance Limitations:** Mathematical relationships that worked historically may not persist indefinitely
- **Model Risk:** Complex models can fail during unprecedented market conditions
- **Overfitting Potential:** Highly optimized parameters may not generalize to future market conditions
### Proper Implementation Guidelines
**Risk Management Requirements:**
- **Never Risk More Than 2% Per Trade:** Regardless of signal quality
- **Diversification Mandatory:** Don't rely solely on mathematical signals
- **Position Sizing Discipline:** Use mathematical field strength for sizing, not confidence
- **Stop Loss Non-Negotiable:** Every trade must have predefined risk parameters
**Realistic Expectations:**
- **Mathematical Edge, Not Certainty:** The indicator provides probabilistic advantages, not guaranteed outcomes
- **Learning Curve Required:** Complex mathematical concepts require time to master
- **Market Adaptation Necessary:** Parameters must evolve with changing market conditions
- **Continuous Education Important:** Understanding underlying mathematics improves application
### Ethical Trading Considerations
**Market Impact Awareness:**
- **Information Asymmetry:** Advanced mathematical analysis may provide advantages over other market participants
- **Position Size Responsibility:** Large positions based on mathematical signals can impact market structure
- **Sharing Knowledge:** Consider educational contributions to trading community
- **Fair Market Participation:** Use mathematical advantages responsibly within market framework
### Professional Development Path
**Skill Development Sequence:**
1. **Basic Mathematical Literacy:** Understand fundamental concepts before advanced application
2. **Risk Management Mastery:** Develop disciplined risk control before relying on complex signals
3. **Market Psychology Understanding:** Combine mathematical analysis with behavioral market insights
4. **Continuous Learning:** Stay updated on mathematical finance developments and market evolution
---
## 🔮 CONCLUSION
The Tensor Market Analysis Engine represents a quantum leap forward in technical analysis, successfully bridging the gap between advanced pure mathematics and practical trading applications. By integrating multi-dimensional volatility analysis, fractal market theory, and information flow dynamics, the TMAE reveals market structure invisible to conventional analysis while maintaining visual clarity and practical usability.
### Mathematical Innovation Legacy
This indicator establishes new paradigms in technical analysis:
- **Tensor analysis for market volatility understanding**
- **Stochastic self-excitation for event clustering prediction**
- **Information theory for causality-based trade generation**
- **Democratic algorithmic consensus for signal quality enhancement**
- **Mathematical field visualization for intuitive market understanding**
### Practical Trading Revolution
Beyond mathematical innovation, the TMAE transforms practical trading:
- **Quality-rated signals replace binary buy/sell decisions**
- **Regime-adaptive strategies automatically optimize for market personality**
- **Multi-dimensional risk management integrates mathematical volatility measures**
- **Visual mathematical concepts make complex analysis immediately interpretable**
- **Educational value creates lasting improvement in trading understanding**
### Future-Proof Design
The mathematical foundations ensure lasting relevance:
- **Universal mathematical principles transcend market evolution**
- **Multi-dimensional analysis adapts to new market structures**
- **Regime detection automatically adjusts to changing market personalities**
- **Component democracy allows for future algorithmic additions**
- **Mathematical visualization scales with increasing market complexity**
### Commitment to Excellence
The TMAE represents more than an indicator—it embodies a philosophy of bringing rigorous mathematical analysis to trading while maintaining practical utility and visual elegance. Every component, from the multi-dimensional tensor fields to the democratic signal generation, reflects a commitment to mathematical accuracy, trading practicality, and educational value.
### Trading with Mathematical Precision
In an era where markets grow increasingly complex and computational, the TMAE provides traders with mathematical tools previously available only to institutional quantitative research teams. Yet unlike academic mathematical models, the TMAE translates complex concepts into intuitive visual representations and practical trading signals.
By combining the mathematical rigor of tensor analysis, the statistical power of multi-dimensional volatility modeling, and the information-theoretic insights of transfer entropy, traders gain unprecedented insight into market structure and dynamics.
### Final Perspective
Markets, like nature, exhibit profound mathematical beauty beneath apparent chaos. The Tensor Market Analysis Engine serves as a mathematical lens that reveals this hidden order, transforming how traders perceive and interact with market structure.
Through mathematical precision, visual elegance, and practical utility, the TMAE empowers traders to see beyond the noise and trade with the confidence that comes from understanding the mathematical principles governing market behavior.
Trade with mathematical insight. Trade with the power of tensors. Trade with the TMAE.
*"In mathematics, you don't understand things. You just get used to them." - John von Neumann*
*With the TMAE, mathematical market understanding becomes not just possible, but intuitive.*
— Dskyz, Trade with insight. Trade with anticipation.

Cycle Composite 3.6 WeightedThe Cycle Composite is a multi-factor market cycle model designed to classify long-term market behavior into distinct phases using normalized and weighted data inputs.
It combines ten key on-chain, dominance, volatility, sentiment, and trend-following metrics into a single composite output. The goal is to provide a clearer understanding of where the market may stand in the broader cycle (e.g., accumulation, early bull, late bull, or euphoria).
This version (3.4) introduces flexible weighting, trend strength markers, and additional context-aware signals such as risk-on confirmations and altseason flags.
Phases Identified:
The model categorizes the market into one of five zones:
Euphoria (> 85)
Late Bull (70 – 85)
Mid Bull (50 – 70)
Early Bull (30 – 50)
Fear (< 30)
Each phase is determined by a smoothed EMA of the weighted composite score.
Data Sources and Metrics Used (10 total):
BTC Dominance (CRYPTOCAP:BTC.D)
Stablecoin Dominance (USDT + USDC average) (inverted for risk-on)
ETH Dominance (CRYPTOCAP:ETH.D)
BBWP (normalized Bollinger Band Width % over 1-year window)
WVF (Williams VIX Fix for volatility spike detection)
NUPL (Net Unrealized Profit/Loss, external source)
CMF (Chaikin Money Flow, smoothed volume accumulation)
CEX Open Interest (custom input from DAO / external source)
Whale Inflows (custom input from whale exchange transfer data)
Google Trends Average (BTC, Crypto, Altcoin terms)
All inputs are normalized over a 200-bar window and combined via weighted averaging, where each weight is user-configurable.
Additional Features:
Phase Labels: Labels are printed only when a new phase is entered.
Bull Continuation Marker: Triangle up when composite makes higher highs and NUPL increases.
Weakening Marker: Triangle down when composite rolls over in Late Bull and NUPL falls.
Risk-On Signal: Green circle appears when CMF and Google Trends are both rising.
Altseason Flag: Orange diamond appears when dominance of "others.d" exceeds BTC.D and ETH.D and composite is above 50.
Background Shading: Each phase is shaded with a semi-transparent background color.
Timeframe-Aware Display: All markers and signals are shown only on weekly timeframe for clarity.
Intended Use:
This script is intended for educational and macro-trend analysis purposes.
It can be used to:
Identify macro cycle position (accumulation, bull phases, euphoria, etc.)
Spot long-term trend continuation or weakening signals
Add context to price action with external on-chain and sentiment data
Time rotation events such as altseason risk
Disclaimer:
This script does not constitute financial advice.
It is intended for informational and research purposes only.
Users should conduct their own due diligence and analysis before making investment decisions.

Heatmap Trailing Stop with Breakouts (Zeiierman)█ Overview
Heatmap Trailing Stop with Breakouts (Zeiierman) is a trend and breakout detection tool that combines dynamic trailing stop logic, Fibonacci-based levels, and a real-time market heatmap into a single, intuitive system.
This indicator is designed to help traders visualize pressure zones, manage stop placement, and identify breakout opportunities supported by contextual price–derived heat. Whether you're trailing trends, detecting reversals, or entering on explosive breakouts — this tool keeps you anchored in structure and sentiment.
It projects adaptive trailing stop levels and calculates Fibonacci extensions from swing-based extremes. These levels are then colored by a market heatmap engine that tracks price interaction intensity — showing where the market is "hot" and likely to respond.
On top of that, it includes breakout signals powered by HTF momentum conditions, trend direction, and heatmap validation — giving you signals only when the context is strong.
█ How It Works
⚪ Trailing Stop Engine
At its core, the script uses an ATR-based trailing stop with trend detection:
ATR Length – Defines volatility smoothing using EMA MA of true range.
Multiplier – Expands/retracts the trailing offset depending on market aggression.
Real-Time Extremum Tracking – Uses local highs/lows to define Fibonacci anchors.
⚪ Fibonacci Projection + Heatmap
With each trend shift, Fibonacci levels are projected from the new swing to the current trailing stop. These include:
Fib 61.8, 78.6, 88.6, and 100% (trailing stop) lines
Heatmap Coloring – Each level'slevel's color is determined by how frequently price has interacted with that level in the recent range (defined by ATR).
Strength Score (1–10) – The number of touches per level is normalized and averaged to create a heatmap ""score"" displayed as a colored bar on the chart.
⚪ Breakout Signal System
This engine detects high-confidence breakout signals using a higher timeframe candle structure:
Bullish Breakout – Strong bullish candle + momentum + trend confirmation + heatmap score threshold.
Bearish Breakout – Strong bearish candle + momentum + trend confirmation + heatmap score threshold.
Cooldown Logic – Prevents signals from clustering too frequently during volatile periods.
█ How to Use
⚪ Trend Following & Trail Stops
Use the Trailing Stop line to manage positions or time entries in line with trend direction. Trailing stop flips are highlighted with dot markers.
⚪ Fibonacci Heat Zones
The projected Fibonacci levels serve as price magnets or support/resistance zones. Watch how price reacts at Fib 61.8/78.6/88.6 levels — especially when they're glowing with high heatmap scores (more glow = more historical touches = stronger significance).
⚪ Breakout Signals
Enable breakout signals when you want to trade breakouts only under strong context. Use the "Heatmap Strength Threshold" to require a minimum score (1–10).
█ Settings
Stop Distance ATR Length – ATR period for volatility smoothing
Stop Distance Multiplier – Adjusts the trailing stop'sstop's distance from price
Heatmap Range ATR Length – Defines how far back the heatmap scans for touches
Number of Heat Levels – Total levels used in the heatmap (more = finer resolution)
Minimum Touches per Level – Defines what counts as a ""hot"" level
Heatmap Strength Threshold – Minimum average heat score (1–10) required for breakouts
Timeframe – HTF source used to evaluate breakout momentum structure
-----------------
Disclaimer
The content provided in my scripts, indicators, ideas, algorithms, and systems is for educational and informational purposes only. It does not constitute financial advice, investment recommendations, or a solicitation to buy or sell any financial instruments. I will not accept liability for any loss or damage, including without limitation any loss of profit, which may arise directly or indirectly from the use of or reliance on such information.
All investments involve risk, and the past performance of a security, industry, sector, market, financial product, trading strategy, backtest, or individual's trading does not guarantee future results or returns. Investors are fully responsible for any investment decisions they make. Such decisions should be based solely on an evaluation of their financial circumstances, investment objectives, risk tolerance, and liquidity needs.

Volumetric Expansion/Contraction### Indicator Title: Volumetric Expansion/Contraction
### Summary
The Volumetric Expansion/Contraction (PCC) indicator is a comprehensive momentum oscillator designed to identify high-conviction price moves. Unlike traditional oscillators that only look at price, the PCC integrates four critical dimensions of market activity: **Price Change**, **Relative Volume (RVOL)**, **Cumulative Volume Delta (CVD)**, and **Average True Range (ATR)**.
Its primary purpose is to help traders distinguish between meaningful, volume-backed market expansions and noisy, unsustainable price action. It gives more weight to moves that occur in a controlled, low-volatility environment, highlighting potential starts of new trends or significant shifts in market sentiment.
### Key Concepts & Purpose
The indicator's unique formula synthesizes the following concepts:
1. **Price Change:** Measures the magnitude and direction of the primary move.
2. **Relative Volume (RVOL):** Confirms that the move is backed by significant volume compared to its recent average, indicating institutional participation.
3. **Cumulative Volume Delta (CVD):** Measures the underlying buying and selling pressure, confirming that the price move is aligned with the net flow of market orders.
4. **Inverse Volatility (ATR):** This is the indicator's unique twist. It normalizes the signal by the inverse of the Average True Range. This means the indicator's value is **amplified** when volatility (ATR) is low (signifying a controlled, confident expansion) and **dampened** when volatility is high (filtering out chaotic, less predictable moves).
The goal is to provide a single, easy-to-read oscillator that signals when price, volume, and order flow are all in alignment, especially during a breakout from a period of contraction.
### Features
* **Main Oscillator Line:** A single line plotted in a separate pane that represents the calculated strength of the volumetric expansion or contraction.
* **Zero Line:** A dotted reference line to easily distinguish between bullish (above zero) and bearish (below zero) regimes.
* **Visual Threshold Zones:** The background automatically changes color to highlight periods of significant strength:
* **Bright Green:** Indicates a "Strong Up Move" when the oscillator crosses above the user-defined upper threshold.
* **Bright Fuchsia:** Indicates a "Strong Down Move" when the oscillator crosses below the user-defined lower threshold.
### Configurable Settings & Filters
The indicator is fully customizable to allow for extensive testing and adaptation to different assets and timeframes.
#### Main Calculation Inputs
* **Price Change Lookback:** Sets the period for calculating the primary price change.
* **CVD Normalization Length:** The lookback period for normalizing the Cumulative Volume Delta.
* **RVOL Avg Volume Length:** The lookback for the simple moving average of volume, used to calculate RVOL.
* **RVOL Normalization Length:** The lookback period for normalizing the RVOL score.
* **ATR Length & Normalization Length:** Sets the periods for calculating the ATR and its longer-term average for normalization.
#### Weights
* Fine-tune the impact of each core component on the final calculation, allowing you to emphasize what matters most to your strategy (e.g., give more weight to CVD or RVOL).
#### External Market Filter (Powerful Feature)
* **Enable SPY/QQQ Filter for Up Moves?:** A checkbox to activate a powerful regime filter.
* **Symbol:** A dropdown to choose whether to filter signals based on the trend of **SPY** or **QQQ**.
* **SMA Period:** Sets the lookback period for the Simple Moving Average (default is 50).
* **How it works:** When enabled, this filter will **only allow "Strong Up Move" signals to appear if the chosen symbol (SPY or QQQ) is currently trading above its specified SMA**. This is an excellent tool for aligning your signals with the broader market trend and avoiding bullish entries in a bearish market.
#### Visuals
* **Upper/Lower Threshold:** Allows you to define what level the oscillator must cross to trigger the colored background zones, letting you customize the indicator's sensitivity.
***
**Disclaimer:** This tool is designed for market analysis and confluence. It is not a standalone trading system. Always use this indicator in conjunction with your own trading strategy, risk management, and other forms of analysis.

Murrey Math Lines v6Murrey Math Lines v6
This is not just another Murrey Math indicator. It's a complete, ground-up modernization of the classic concept, rebuilt with the latest Pine Script features for unparalleled performance, accuracy, and usability. While preserving the core mathematical genius of T.H. Murrey's system, this version introduces a suite of modern tools designed for today's trader.
What are Murrey Math Lines?
Murrey Math Lines (MML) are a powerful system of support and resistance based on geometric formulas developed by T.H. Murrey. As a derivation of W.D. Gann's observations, Murrey's geometry simplifies Gann's theories into a more accessible application. The core principle is that price action tends to trend and retrace in 1/8th intervals.
These intervals create a "trading octave" with distinct levels, each having its own characteristic behavior:
& - Ultimate Resistance & Support: These lines are the hardest to break. They represent the top and bottom of the expected price range and are prime areas for reversals.
- Major Pivot: This is the most significant level, offering the strongest support and resistance within the octave. Price has a high probability of stopping and reversing here.
& - Strong Pivot/Reversal: These are strong, secondary pivot points where price often struggles to pass through.
& - The Trading Range: The price tends to consolidate between these two lines about 50% of the time. A decisive break outside this range often signals the start of a new trend.
& - Weak Support/Resistance: These levels are weaker, but when price moves too quickly towards them, they can act as initial stopping points or areas for a minor reversal.
& - Extended Octave: These lines show extreme overbought and oversold conditions beyond the primary 0/8 to 8/8 octave.
Modern Enhancements in This Version
Session-Locked Precision: Anchor the Murrey Lines to the start of a specific trading session (e.g., NYSE open). The levels remain constant for the entire session, providing a stable and reliable framework for your daily analysis.
Visual Trading & Reversal Zones: Instead of just lines, this indicator can fill the key trading range (3/8 to 5/8) and reversal zones (0/8-1/8 & 7/8-8/8) with color, giving you an instant visual reference of market sentiment.
Dynamic "Closest Price" Labels: Declutter your chart! The indicator can intelligently display only the label for the Murrey level closest to the current price, keeping your view clean while providing critical information at a glance.
Integrated Alert System: Never miss a key level touch again. Set up alerts for when the price approaches major lines, the trading range, or all lines, customized to your trading style.
Advanced Pine Script Engine: Built on a modern codebase using User-Defined Types and dynamic drawing objects (line, box, label). This ensures the indicator is fast, efficient, and non-repainting, even on lower timeframes.
Intuitive User Interface: Settings are neatly organized into collapsible groups with clear tooltips, making it incredibly easy to customize every aspect of the indicator, from calculation parameters to colors.
A Note on Accuracy
Some of the other Murrey Math indicators on TradingView use different formulas and therefore produce varying results. This version has been carefully checked against MML indicators on other professional platforms to ensure its calculations are accurate and reliable.
Credits
This indicator is a complete overhaul and modernization of the original "MM Lines " script. Full credit for the original calculation logic and concept goes to its author, JRL_6.

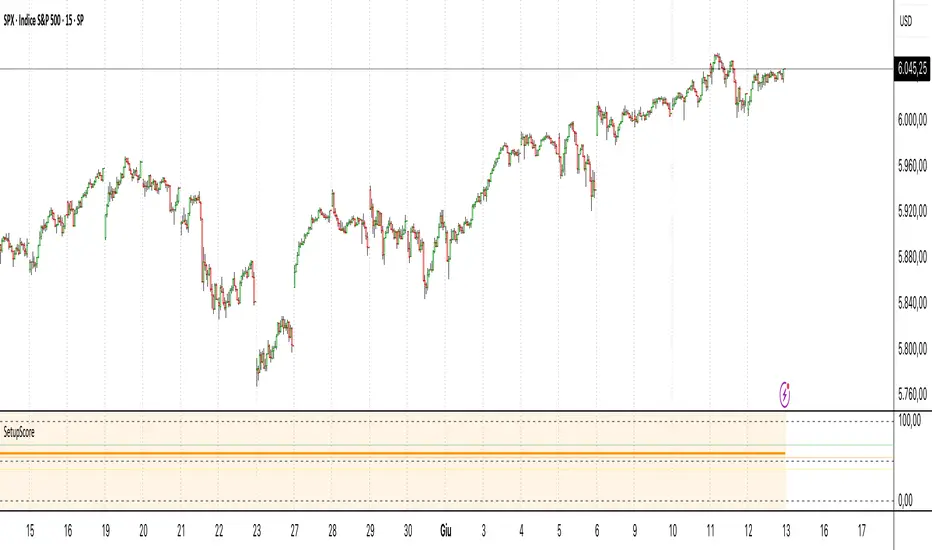
Setup Score OscillatorSetup Score Oscillator – Full Description
🎯 Purpose of the Script
This script is a manual trading setup scoring tool, designed to help traders quantify the quality of a trade setup by combining multiple technical, cyclical, and contextual signals.
Instead of relying on a single indicator, the trader manually selects which signals are present, and the script calculates a total score (0–100%), displayed as an oscillator in a separate panel (like RSI or MACD).
🔧 How it works in practice
1. Manual signal inputs
The script presents a set of checkboxes in the settings, where the trader can enable/disable the following signals:
✅ Confirmed Support/Resistance
✅ Aligned Volume Profile
✅ Favorable Cyclic Timing
✅ Valid Trend Line
✅ Aligned Cyclical Moving Averages
✅ Relevant Fibonacci Level
✅ Classic Volume Signal (spike, dry-up, etc.)
✅ Oscillator confirmation (e.g., divergences)
✅ Extreme Sentiment
✅ Relevant or incoming News
Each selected signal contributes to the total score based on its weight.
2. Scoring system
Each signal has a default weight (e.g., 20% for support/resistance, 15% for cycles, etc.).
Optionally, the trader can enable the “custom weights” checkbox and adjust each signal’s weight directly in the settings.
3. Score visualization
The final score (sum of all active weights) is plotted as an oscillator ranging from 0 to 100%, with dynamic coloring:
Range Color Meaning
0–39% Red No valid setup
40–54% Yellow Watchlist only
55–69% Orange Good setup
70–100% Green Strong setup
Several horizontal threshold lines are displayed:
50% → neutral threshold
40%, 55%, 70% → operational levels
4. Optional background coloring
When the score exceeds 55% or 70%, the oscillator background lightly changes color to highlight stronger setups (non-intrusive).
📌 Practical benefits
Objectifies subjective analysis: each decision becomes a number.
Prevents overtrading: no entries if the score is too low.
Adaptable to any trading style: swing, intraday, positional.
User-friendly: no coding needed – just tick boxes.
Italiano:
Setup Score Oscillator – Descrizione completa
🎯 Obiettivo dello script
Lo script è uno strumento manuale di valutazione dei setup di trading, pensato per aiutare il trader a quantificare la qualità di un'opportunità operativa basandosi su più segnali tecnici, ciclici e contestuali.
Invece di affidarsi a un solo indicatore, il trader seleziona manualmente quali segnali sono presenti, e lo script calcola un punteggio complessivo percentuale (0–100%), rappresentato come oscillatore in una finestra separata (tipo RSI, MACD, ecc.).
🔧 Come funziona operativamente
1. Input manuale dei segnali
Lo script mostra una serie di checkbox nelle impostazioni, dove il trader può attivare o disattivare i seguenti segnali:
✅ Supporto/Resistenza confermata
✅ Volume Profile allineato
✅ Cicli o timing favorevole
✅ Trend line valida
✅ Medie mobili cicliche allineate
✅ Livello di Fibonacci rilevante
✅ Volume classico significativo (spike, dry-up)
✅ Conferme da oscillatori (es. divergenze)
✅ Sentiment estremo (es. euforia o panico)
✅ News importanti imminenti o appena uscite
Ogni casella attiva contribuisce al punteggio totale, con un peso specifico.
2. Sistema di punteggio
Ogni segnale ha un peso predefinito (es. 20% per supporti/resistenze, 15% per cicli, ecc.).
Facoltativamente, il trader può attivare la funzione “Enable custom weights” per personalizzare i pesi di ciascun segnale direttamente da input.
3. Visualizzazione del punteggio
Il punteggio complessivo (somma dei pesi attivati) viene tracciato come oscillatore da 0 a 100%, con colori dinamici:
Range Colore Significato
0–39% Rosso Nessun setup valido
40–54% Giallo Osservazione
55–69% Arancione Setup buono
70–1005 Verde Setup forte
Sono tracciate anche delle linee guida orizzontali a:
50% → soglia neutra
40%, 55%, 70% → soglie operative
4. Colorazione dello sfondo (facoltativa)
Quando il punteggio supera 55% o 70%, lo sfondo dell’oscillatore cambia leggermente colore per evidenziare il segnale (non invasivo).
📌 Vantaggi pratici
Oggettivizza l’analisi soggettiva: ogni decisione manuale si trasforma in un numero.
Evita overtrading: se il punteggio è troppo basso, non si entra.
Adattabile a ogni stile: swing, intraday, position.
Facile da usare anche senza codice: basta spuntare le caselle.
MACD Breakout SuperCandlesMACD Breakout SuperCandles
The MACD Breakout SuperCandles indicator is a candle-coloring tool that monitors trend alignment across multiple timeframes using a combination of MACD behavior and simple price structure. It visually reflects market sentiment directly on price candles, helping traders quickly recognize shifting momentum conditions.
How It Works
The script evaluates trend behavior based on:
- Multi-timeframe MACD Analysis: Uses MACD values and signal line relationships to gauge trend direction and strength.
- Price Relative to SMA Zones: Analyzes whether price is positioned above or below the 20-period high and low SMAs on each timeframe.
For each timeframe, the script assigns one of five possible trend statuses:
- SUPERBULL: Strong bullish MACD signal with price above both SMAs.
- Bullish: Bullish MACD crossover with price showing upward bias.
- Basing: MACD flattening or neutralizing near zero with no directional dominance.
- Bearish: Bearish MACD signal without confirmation of stronger trend.
- SUPERBEAR: Strong bearish MACD signal with price below both SMAs.
-Ghost Candles: Candles with basing attributes that can signal directional change or trend strength.
Signal Scoring System
The script compares conditions across four timeframes:
- TF1 (Short)
- TF2 (Medium)
- TF3 (Long)
- MACD at a fixed 10-minute resolution
Each status type is tracked independently. A colored candle is only applied when a status type (e.g., SUPERBULL) reaches the minimum match threshold, defined by the "Min Status Matches for Candle Color" setting. If no status meets the required threshold, the candle is displayed in a neutral "Ghost" color.
Customizable Visuals
The indicator offers full control over candle appearance via grouped settings:
Body Colors
- SUPERBULL Body
- Bullish Body
- Basing Body
- Bearish Body
- SUPERBEAR Body
- Ghost Candle Body (used when no match)
Border & Wick Colors
- SUPERBULL Border/Wick
- Bullish Border/Wick
- Basing Border/Wick
- Bearish Border/Wick
- SUPERBEAR Border/Wick
- Ghost Border/Wick
Colors are grouped by function and can be adjusted independently to match your chart theme or personal preferences.
Settings Overview
- TF1, TF2, TF3: Select short, medium, and long timeframes to monitor trend structure.
- Min Status Matches: Set how many timeframes must agree before a candle status is applied.
- MACD Settings: Customize MACD fast, slow, and signal lengths, and choose MA type (EMA, SMA, WMA).
This tool helps visualize how aligned various timeframe conditions are by embedding sentiment into the candles themselves. It can assist with trend identification, momentum confirmation, or visual filtering for discretionary strategies.

Trendline Breakouts With Volume Strength [TradeDots]Trendline Breakouts With Volume Strength is an innovative indicator designed to identify potential market turning points using pivot-based trendline detection and volume confirmation. By merging dynamic trendline analysis with multi-tiered volume filters, this tool helps traders quickly spot breakouts or breakdowns that may signal significant shifts in price action.
📝 HOW IT WORKS
1. Pivot-Based Trendline Detection
The script automatically scans for recent pivot highs and lows over a user-defined lookback period.
When it finds higher pivot lows, it plots green uptrend lines; when it finds lower pivot highs, it plots red downtrend lines.
These dynamic lines update as new pivots form, providing continuously refreshed trend guidance.
2. Volume Ratio Analysis
A moving average of volume is compared against the current bar’s volume to calculate a ratio (e.g., 1.5×, 2×).
Higher ratios suggest above-average volume, often interpreted as stronger participation.
The script applies color-coded cues to highlight the intensity of volume surges.
3. Breakout & Breakdown Detection
Each trendline is monitored for a defined “break threshold,” which helps avoid minor penetrations that can trigger premature signals.
When price closes beyond a threshold below an uptrend line, the indicator labels it a “BREAKDOWN.” If it closes above a threshold on a downtrend line, it labels it a “BREAKOUT.”
Volume surges accompanying these breaks are highlighted with contextual emojis and distinct color gradients for quick visual reference.
4. Trend Direction Table
A small on-chart table provides a snapshot of the current market trend—Uptrend, Downtrend, or Sideways—based on a simple moving average slope and the number of active uptrend or downtrend lines.
This table also displays quick stats on how many lines are actively tracked, helping traders assess the broader market posture at a glance.
🛠️ HOW TO USE
1. Choose a Timeframe
This script works on multiple timeframes. Intraday traders can monitor minute or hourly charts for frequent pivot updates, while swing and position traders may prefer daily or weekly intervals to reduce noise.
2. Observe Trendlines & Labels
Watch for newly drawn green/red lines connecting pivots.
When you see a “BREAKOUT” or “BREAKDOWN” label, confirm whether volume was abnormally high based on the ratio or color-coded bars.
3. Consult the Trend Table
Use the table in the bottom-right corner to quickly check if the market is trending or range-bound.
Look at the count of active uptrend vs. downtrend lines to gauge broader sentiment.
4. Employ Additional Analysis
Combine these signals with other tools (e.g., candlestick patterns, oscillators, or fundamental analysis).
Validate potential breakouts using standard techniques like retests or support/resistance checks.
❗️LIMITATIONS
Delayed Pivots: Trendlines only adjust once new pivot highs or lows form, which can introduce a slight lag in highly volatile environments.
Choppy Markets: Rapid, back-and-forth price moves may produce conflicting trendline signals and frequent breakouts/breakdowns.
Volume Data Reliability: Gaps in volume data or unusual market conditions (holidays, low-liquidity sessions) can skew ratio readings.
RISK DISCLAIMER
Trading any financial instrument involves substantial risk, and this indicator does not guarantee profits or prevent losses. All signals and visual cues are for educational and informational purposes only; past performance does not assure future outcomes. You retain full responsibility for your trading decisions, including proper risk management, position sizing, and the use of additional confirmation methods. Always consider the possibility of losing some or all of your original investment.

Discount to Net Asset ValueOverview
This indicator helps investors and analysts identify when a company’s stock is trading below or above its intrinsic value. A persistent discount may highlight potential value opportunities, while a sustained premium could signal overvaluation or strong market sentiment. By visually shading the background and plotting the discount/premium percentage, users can quickly screen for undervalued stocks, confirm fundamental research, and make more informed buy or sell decisions.
Usage
Calculates the Net Asset Value discount (or premium) for any symbol.
By default the indicator uses the current chart symbol’s TOTAL_ASSETS, TOTAL_LIABILITIES, and TOTAL_SHARES_OUTSTANDING.
You can select another symbol by checking “Use Custom Symbol” and entering the ticker of the other symbol. This is useful for comparing the Discount to NAV across symbols.
Shows the percentage discount (or premium) of market capitalization relative to net asset value.
Recommended timeframes: daily bars or higher.
Reporting Periods:
• FQ = Fiscal Quarter
• FY = Fiscal Year
• TTM = Trailing Twelve Months
Note: NAV is pulled on the chosen reporting period (FQ, FY, TTM).
By default the background is shaded red to illustrate a discount to NAV and green to illustrate a premium to NAV. This can be toggled in the settings.

Bilateral Filter For Loop [BackQuant]Bilateral Filter For Loop
The Bilateral Filter For Loop is an advanced technical indicator designed to filter out market noise and smooth out price data, thus improving the identification of underlying market trends. It employs a bilateral filter, which is a sophisticated non-linear filter commonly used in image processing and price time series analysis. By considering both spatial and range differences between price points, this filter is highly effective at preserving significant trends while reducing random fluctuations, ultimately making it suitable for dynamic trend-following strategies.
Please take the time to read the following:
Key Features
1. Bilateral Filter Calculation:
The bilateral filter is the core of this indicator and works by applying a weight to each data point based on two factors: spatial distance and price range difference. This dual weighting process allows the filter to preserve important price movements while reducing the impact of less relevant fluctuations. The filter uses two primary parameters:
Spatial Sigma (σ_d): This parameter adjusts the weight applied based on the distance of each price point from the current price. A larger spatial sigma means more smoothing, as further away values will contribute more heavily to the result.
Range Sigma (σ_r): This parameter controls how much weight is applied based on the difference in price values. Larger price differences result in smaller weights, while similar price values result in larger weights, thereby preserving the trend while filtering out noise.
The output of this filter is a smoothed version of the original price series, which eliminates short-term fluctuations, helping traders focus on longer-term trends. The bilateral filter is applied over a rolling window, adjusting the level of smoothing dynamically based on both the distance between values and their relative price movements.
2. For Loop Calculation for Trend Scoring:
A for-loop is used to calculate the trend score based on the filtered price data. The loop compares the current value to previous values within the specified window, scoring the trend as follows:
+1 for upward movement (when the filtered value is greater than the previous value).
-1 for downward movement (when the filtered value is less than the previous value).
The cumulative result of this loop gives a continuous trend score, which serves as a directional indicator for the market's momentum. By summing the scores over the window period, the loop provides an aggregate value that reflects the overall trend strength. This score helps determine whether the market is experiencing a strong uptrend, downtrend, or sideways movement.
3. Long and Short Conditions:
Once the trend score has been calculated, it is compared against predefined threshold levels:
A long signal is generated when the trend score exceeds the upper threshold, indicating that the market is in a strong uptrend.
A short signal is generated when the trend score crosses below the lower threshold, signaling a potential downtrend or trend reversal.
These conditions provide clear signals for potential entry points, and the color-coding helps traders quickly identify market direction:
Long signals are displayed in green.
Short signals are displayed in red.
These signals are designed to provide high-confidence entries for trend-following strategies, helping traders capture profitable movements in the market.
4. Trend Background and Bar Coloring:
The script offers customizable visual settings to enhance the clarity of the trend signals. Traders can choose to:
Color the bars based on the trend direction: Bars are colored green for long signals and red for short signals.
Change the background color to provide additional context: The background will be shaded green for a bullish trend and red for a bearish trend. This visual feedback helps traders to stay aligned with the prevailing market sentiment.
These features offer a quick visual reference for understanding the market's direction, making it easier for traders to identify when to enter or exit positions.
5. Threshold Lines for Visual Feedback:
Threshold lines are plotted on the chart to represent the predefined long and short levels. These lines act as clear markers for when the market reaches a critical threshold, triggering a potential buy (long) or sell (short) signal. By showing these threshold lines on the chart, traders can quickly gauge the strength of the market and assess whether the trend is strong enough to warrant action.
These thresholds can be adjusted based on the trader's preferences, allowing them to fine-tune the indicator for different market conditions or asset behaviors.
6. Customizable Parameters for Flexibility:
The indicator offers several parameters that can be adjusted to suit individual trading preferences:
Window Period (Bilateral Filter): The window size determines how many past price values are used to calculate the bilateral filter. A larger window increases smoothing, while a smaller window results in more responsive, but noisier, data.
Spatial Sigma (σ_d) and Range Sigma (σ_r): These values control how sensitive the filter is to price changes and the distance between data points. Fine-tuning these parameters allows traders to adjust the degree of noise reduction applied to the price series.
Threshold Levels: The upper and lower thresholds determine when the trend score crosses into long or short territory. These levels can be customized to better match the trader's risk tolerance or asset characteristics.
Visual Settings: Traders can customize the appearance of the chart, including the line width of trend signals, bar colors, and background shading, to make the indicator more readable and aligned with their charting style.
7. Alerts for Trend Reversals:
The indicator includes alert conditions for real-time notifications when the market crosses the defined thresholds. Traders can set alerts to be notified when:
The trend score crosses the long threshold, signaling an uptrend.
The trend score crosses the short threshold, signaling a downtrend.
These alerts provide timely information, allowing traders to take immediate action when the market shows a significant change in direction.
Final Thoughts
The Bilateral Filter For Loop indicator is a robust tool for trend-following traders who wish to reduce market noise and focus on the underlying trend. By applying the bilateral filter and calculating trend scores, this indicator helps traders identify strong uptrends and downtrends, providing reliable entry signals with minimal market noise. The customizable parameters, visual feedback, and alerting system make it a versatile tool for traders seeking to improve their timing and capture profitable market movements.
Thus following all of the key points here are some sample backtests on the 1D Chart
Disclaimer: Backtests are based off past results, and are not indicative of the future.
INDEX:BTCUSD
INDEX:ETHUSD
CRYPTO:SOLUSD

Cumulative Intraday Volume with Long/Short LabelsThis indicator calculates a running total of volume for each trading day, then shows on the price chart when that total crosses levels you choose. Every day at 6:00 PM Eastern Time, the total goes back to zero so it always reflects only the current day’s activity. From that moment on, each time a new candle appears the indicator looks at whether the candle closed higher than it opened or lower. If it closed higher, the candle’s volume is added to the running total; if it closed lower, the same volume amount is subtracted. As a result, the total becomes positive when buyers have dominated so far today and negative when sellers have dominated.
Because futures markets close at 6 PM ET, the running total resets exactly then, mirroring the way most intraday traders think in terms of a single session. Throughout the day, you will see this running total move up or down according to whether more volume is happening on green or red candles. Once the total goes above a number you specify (for example, one hundred thousand contracts), the indicator will place a small “Long” label at that candle on the main price chart to let you know buying pressure has reached that level. Similarly, once the total goes below a negative number you choose (for example, minus one hundred thousand), a “Short” label will appear at that candle to signal that selling pressure has reached your chosen threshold. You can set these threshold numbers to whatever makes sense for your trading style or the market you follow.
Because raw volume alone never turns negative, this design uses candle direction as a sign. Green candles (where the close is higher than the open) add volume, and red candles (where the close is lower than the open) subtract volume. Summing those signed volume values tells you in a single number whether buying or selling has been stronger so far today. That number resets every evening, so it does not carry over any buying or selling from previous sessions.
Once you have this indicator on your chart, you simply watch the “summed volume” line as it moves throughout the day. If it climbs past your long threshold, you know buyers are firmly in control and a long entry might make sense. If it falls past your short threshold, you know sellers are firmly in control and a short entry might make sense. In quieter markets or times of low volume, you might use a smaller threshold so that even modest buying or selling pressure will trigger a label. During very active periods, a larger threshold will prevent too many signals when volume spikes frequently.
This approach is straightforward but can be surprisingly powerful. It does not rely on complex formulas or hidden statistical measures. Instead, it simply adds and subtracts daily volume based on candle color, then alerts you when that total reaches levels you care about. Over several years of historical testing, this formula has shown an ability to highlight moments when intraday sentiment shifts decisively from buyers to sellers or vice versa. Because the indicator resets every day at 6 PM, it always reflects only today’s sentiment and remains easy to interpret without carrying over past data. You can use it on any intraday timeframe, but it works especially well on five-minute or fifteen-minute charts for futures contracts.
If you want a clear gauge of whether buyers or sellers are dominating in real time, and you prefer a rule-based method rather than a complex model, this indicator gives you exactly that. It shows net buying or selling pressure at a glance, resets each session like most intraday traders do, and marks the moments when that pressure crosses the levels you decide are important. By combining a daily reset with signed volume, you get a single number that tells you precisely what the crowd is doing at any given moment, without any of the guesswork or hidden calculations that more complicated indicators often carry.

Key Levels with Alerts
Introducing the "Key Levels with Alerts" Indicator
This powerful and fully customizable indicator for the TradingView platform helps you easily identify and monitor crucial **daily, weekly, and monthly price levels** directly on your chart. Beyond just visual representation, the indicator offers advanced alert capabilities to notify you of any price breaks at these significant areas.
Key Levels Identified by the Indicator
This indicator calculates and displays six vital price levels based on the previous day's, week's, and month's closed candles:
1. **PDH (Previous Day High):** The highest price of the previous day.
2. **PDL (Previous Day Low):** The lowest price of the previous day.
3. **PWH (Previous Week High):** The highest price of the previous week.
4. **PWL (Previous Week Low):** The lowest price of the previous week.
5. **PMH (Previous Month High):** The highest price of the previous month.
6. **PML (Previous Month Low):** The lowest price of the previous month.
Core Features
* **Visual Line Display:** Each of these six levels is plotted as a **horizontal line** on your chart. These lines start from the current candle and extend forward for a specified number of candles (defaulting to 20 candles).
* **Complete Style Customization:** For every level (PDH, PDL, PWH, PWL, PMH, PML), you can **independently customize** the line's color, width, and style (solid, dashed, dotted) directly through the indicator's settings. This feature allows you to easily differentiate between the various levels.
* **Toggleable Labels:** You can choose whether to display text labels like "PDH", "PDL", "PWH", "PWL", "PMH", "PML" at the end of each line. The style of these labels will also automatically match their corresponding line colors.
* **Line Visibility Control:** Beyond just labels, you can also independently **show or hide the lines themselves** for PDH, PDL, PWH, PWL, PMH, and PML.
* **Price Break Alerts:** This is one of the indicator's most important features. You can set up alerts for each of these levels:
* **PDH Break Alert:** Triggers when the price moves above the **Previous Day High**.
* **PDL Break Alert:** Triggers when the price moves below the **Previous Day Low**.
* **PWH Break Alert:** Triggers when the price moves above the **Previous Week High**.
* **PWL Break Alert:** Triggers when the price moves below the **Previous Week Low**.
* **PMH Break Alert:** Triggers when the price moves above the **Previous Month High**.
* **PML Break Alert:** Triggers when the price moves below the **Previous Month Low**.
* **Clear Alert Messages:** Each alert message includes the **symbol or ticker name** (e.g., ` `) so you can quickly identify which asset the alert pertains to and which level has been broken.
* **Enable/Disable Alerts:** You have the flexibility to enable or disable each PDH, PDL, PWH, PWL, PMH, and PML alert independently via the indicator's settings.
Why This Indicator Is Useful
Daily, weekly, and monthly High and Low levels often act as **key support and resistance areas**. Traders use these levels to identify potential entry and exit points, set stop-loss and take-profit targets, and understand overall market sentiment. This indicator, with its clear visualization and timely alerts, helps you effectively leverage this crucial information in your trading strategies.

Ergodic Market Divergence (EMD)Ergodic Market Divergence (EMD)
Bridging Statistical Physics and Market Dynamics Through Ensemble Analysis
The Revolutionary Concept: When Physics Meets Trading
After months of research into ergodic theory—a fundamental principle in statistical mechanics—I've developed a trading system that identifies when markets transition between predictable and unpredictable states. This indicator doesn't just follow price; it analyzes whether current market behavior will persist or revert, giving traders a scientific edge in timing entries and exits.
The Core Innovation: Ergodic Theory Applied to Markets
What Makes Markets Ergodic or Non-Ergodic?
In statistical physics, ergodicity determines whether a system's future resembles its past. Applied to trading:
Ergodic Markets (Mean-Reverting)
- Time averages equal ensemble averages
- Historical patterns repeat reliably
- Price oscillates around equilibrium
- Traditional indicators work well
Non-Ergodic Markets (Trending)
- Path dependency dominates
- History doesn't predict future
- Price creates new equilibrium levels
- Momentum strategies excel
The Mathematical Framework
The Ergodic Score combines three critical divergences:
Ergodic Score = (Price Divergence × Market Stress + Return Divergence × 1000 + Volatility Divergence × 50) / 3
Where:
Price Divergence: How far current price deviates from market consensus
Return Divergence: Momentum differential between instrument and market
Volatility Divergence: Volatility regime misalignment
Market Stress: Adaptive multiplier based on current conditions
The Ensemble Analysis Revolution
Beyond Single-Instrument Analysis
Traditional indicators analyze one chart in isolation. EMD monitors multiple correlated markets simultaneously (SPY, QQQ, IWM, DIA) to detect systemic regime changes. This ensemble approach:
Reveals Hidden Divergences: Individual stocks may diverge from market consensus before major moves
Filters False Signals: Requires broader market confirmation
Identifies Regime Shifts: Detects when entire market structure changes
Provides Context: Shows if moves are isolated or systemic
Dynamic Threshold Adaptation
Unlike fixed-threshold systems, EMD's boundaries evolve with market conditions:
Base Threshold = SMA(Ergodic Score, Lookback × 3)
Adaptive Component = StDev(Ergodic Score, Lookback × 2) × Sensitivity
Final Threshold = Smoothed(Base + Adaptive)
This creates context-aware signals that remain effective across different market environments.
The Confidence Engine: Know Your Signal Quality
Multi-Factor Confidence Scoring
Every signal receives a confidence score based on:
Signal Clarity (0-35%): How decisively the ergodic threshold is crossed
Momentum Strength (0-25%): Rate of ergodic change
Volatility Alignment (0-20%): Whether volatility supports the signal
Market Quality (0-20%): Price convergence and path dependency factors
Real-Time Confidence Updates
The Live Confidence metric continuously updates, showing:
- Current opportunity quality
- Market state clarity
- Historical performance influence
- Signal recency boost
- Visual Intelligence System
Adaptive Ergodic Field Bands
Dynamic bands that expand and contract based on market state:
Primary Color: Ergodic state (mean-reverting)
Danger Color: Non-ergodic state (trending)
Band Width: Expected price movement range
Squeeze Indicators: Volatility compression warnings
Quantum Wave Ribbons
Triple EMA system (8, 21, 55) revealing market flow:
Compressed Ribbons: Consolidation imminent
Expanding Ribbons: Directional move developing
Color Coding: Matches current ergodic state
Phase Transition Signals
Clear entry/exit markers at regime changes:
Bull Signals: Ergodic restoration (mean reversion opportunity)
Bear Signals: Ergodic break (trend following opportunity)
Confidence Labels: Percentage showing signal quality
Visual Intensity: Stronger signals = deeper colors
Professional Dashboard Suite
Main Analytics Panel (Top Right)
Market State Monitor
- Current regime (Ergodic/Non-Ergodic)
- Ergodic score with threshold
- Path dependency strength
- Quantum coherence percentage
Divergence Metrics
- Price divergence with severity
- Volatility regime classification
- Strategy mode recommendation
- Signal strength indicator
Live Intelligence
- Real-time confidence score
- Color-coded risk levels
- Dynamic strategy suggestions
Performance Tracking (Left Panel)
Signal Analytics
- Total historical signals
- Win rate with W/L breakdown
- Current streak tracking
- Closed trade counter
Regime Analysis
- Current market behavior
- Bars since last signal
- Recommended actions
- Average confidence trends
Strategy Command Center (Bottom Right)
Adaptive Recommendations
- Active strategy mode
- Primary approach (mean reversion/momentum)
- Suggested indicators ("weapons")
- Entry/exit methodology
- Risk management guidance
- Comprehensive Input Guide
Core Algorithm Parameters
Analysis Period (10-100 bars)
Scalping (10-15): Ultra-responsive, more signals, higher noise
Day Trading (20-30): Balanced sensitivity and stability
Swing Trading (40-100): Smooth signals, major moves only Default: 20 - optimal for most timeframes
Divergence Threshold (0.5-5.0)
Hair Trigger (0.5-1.0): Catches every wiggle, many false signals
Balanced (1.5-2.5): Good signal-to-noise ratio
Conservative (3.0-5.0): Only extreme divergences Default: 1.5 - best risk/reward balance
Path Memory (20-200 bars)
Short Memory (20-50): Recent behavior focus, quick adaptation
Medium Memory (50-100): Balanced historical context
Long Memory (100-200): Emphasizes established patterns Default: 50 - captures sufficient history without lag
Signal Spacing (5-50 bars)
Aggressive (5-10): Allows rapid-fire signals
Normal (15-25): Prevents clustering, maintains flow
Conservative (30-50): Major setups only Default: 15 - optimal trade frequency
Ensemble Configuration
Select markets for consensus analysis:
SPY: Broad market sentiment
QQQ: Technology leadership
IWM: Small-cap risk appetite
DIA: Blue-chip stability
More instruments = stronger consensus but potentially diluted signals
Visual Customization
Color Themes (6 professional options):
Quantum: Cyan/Pink - Modern trading aesthetic
Matrix: Green/Red - Classic terminal look
Heat: Blue/Red - Temperature metaphor
Neon: Cyan/Magenta - High contrast
Ocean: Turquoise/Coral - Calming palette
Sunset: Red-orange/Teal - Warm gradients
Display Controls:
- Toggle each visual component
- Adjust transparency levels
- Scale dashboard text
- Show/hide confidence scores
- Trading Strategies by Market State
- Ergodic State Strategy (Primary Color Bands)
Market Characteristics
- Price oscillates predictably
- Support/resistance hold
- Volume patterns repeat
- Mean reversion dominates
Optimal Approach
Entry: Fade moves at band extremes
Target: Middle band (equilibrium)
Stop: Just beyond outer bands
Size: Full confidence-based position
Recommended Tools
- RSI for oversold/overbought
- Bollinger Bands for extremes
- Volume profile for levels
- Non-Ergodic State Strategy (Danger Color Bands)
Market Characteristics
- Price trends persistently
- Levels break decisively
- Volume confirms direction
- Momentum accelerates
Optimal Approach
Entry: Breakout from bands
Target: Trail with expanding bands
Stop: Inside opposite band
Size: Scale in with trend
Recommended Tools
- Moving average alignment
- ADX for trend strength
- MACD for momentum
- Advanced Features Explained
Quantum Coherence Metric
Measures phase alignment between individual and ensemble behavior:
80-100%: Perfect sync - strong mean reversion setup
50-80%: Moderate alignment - mixed signals
0-50%: Decoherence - trending behavior likely
Path Dependency Analysis
Quantifies how much history influences current price:
Low (<30%): Technical patterns reliable
Medium (30-50%): Mixed influences
High (>50%): Fundamental shift occurring
Volatility Regime Classification
Contextualizes current volatility:
Normal: Standard strategies apply
Elevated: Widen stops, reduce size
Extreme: Defensive mode required
Signal Strength Indicator
Real-time opportunity quality:
- Distance from threshold
- Momentum acceleration
- Cross-validation factors
Risk Management Framework
Position Sizing by Confidence
90%+ confidence = 100% position size
70-90% confidence = 75% position size
50-70% confidence = 50% position size
<50% confidence = 25% or skip
Dynamic Stop Placement
Ergodic State: ATR × 1.0 from entry
Non-Ergodic State: ATR × 2.0 from entry
Volatility Adjustment: Multiply by current regime
Multi-Timeframe Alignment
- Check higher timeframe regime
- Confirm ensemble consensus
- Verify volume participation
- Align with major levels
What Makes EMD Unique
Original Contributions
First Ergodic Theory Trading Application: Transforms abstract physics into practical signals
Ensemble Market Analysis: Revolutionary multi-market divergence system
Adaptive Confidence Engine: Institutional-grade signal quality metrics
Quantum Coherence: Novel market alignment measurement
Smart Signal Management: Prevents clustering while maintaining responsiveness
Technical Innovations
Dynamic Threshold Adaptation: Self-adjusting sensitivity
Path Memory Integration: Historical dependency weighting
Stress-Adjusted Scoring: Market condition normalization
Real-Time Performance Tracking: Built-in strategy analytics
Optimization Guidelines
By Timeframe
Scalping (1-5 min)
Period: 10-15
Threshold: 0.5-1.0
Memory: 20-30
Spacing: 5-10
Day Trading (5-60 min)
Period: 20-30
Threshold: 1.5-2.5
Memory: 40-60
Spacing: 15-20
Swing Trading (1H-1D)
Period: 40-60
Threshold: 2.0-3.0
Memory: 80-120
Spacing: 25-35
Position Trading (1D-1W)
Period: 60-100
Threshold: 3.0-5.0
Memory: 100-200
Spacing: 40-50
By Market Condition
Trending Markets
- Increase threshold
- Extend memory
- Focus on breaks
Ranging Markets
- Decrease threshold
- Shorten memory
- Focus on restores
Volatile Markets
- Increase spacing
- Raise confidence requirement
- Reduce position size
- Integration with Other Analysis
- Complementary Indicators
For Ergodic States
- RSI divergences
- Bollinger Band squeezes
- Volume profile nodes
- Support/resistance levels
For Non-Ergodic States
- Moving average ribbons
- Trend strength indicators
- Momentum oscillators
- Breakout patterns
- Fundamental Alignment
- Check economic calendar
- Monitor sector rotation
- Consider market themes
- Evaluate risk sentiment
Troubleshooting Guide
Too Many Signals:
- Increase threshold
- Extend signal spacing
- Raise confidence minimum
Missing Opportunities
- Decrease threshold
- Reduce signal spacing
- Check ensemble settings
Poor Win Rate
- Verify timeframe alignment
- Confirm volume participation
- Review risk management
Disclaimer
This indicator is for educational and informational purposes only. It does not constitute financial advice. Trading involves substantial risk of loss and is not suitable for all investors. Past performance does not guarantee future results.
The ergodic framework provides unique market insights but cannot predict future price movements with certainty. Always use proper risk management, conduct your own analysis, and never risk more than you can afford to lose.
This tool should complement, not replace, comprehensive trading strategies and sound judgment. Markets remain inherently unpredictable despite advanced analysis techniques.
Transform market chaos into trading clarity with Ergodic Market Divergence.
Created with passion for the TradingView community
Trade with insight. Trade with anticipation.
— Dskyz , for DAFE Trading Systems

Linear Volume MACD | Lyro RS📊 Linear Volume MACD | Lyro RS is an advanced momentum and trend detection tool that fuses price action with volume-weighted MACD logic and linear regression analysis . Designed for traders seeking deeper insights into market strength and directional conviction, this indicator highlights trend shifts, volume anomalies, and potential reversal zones with precision.
✨ Key Features :
🔁 Multi-Mode Analysis: Switch between Linear Regression , Strong/Weak Trend , or Volume MACD logic.
📐 Volume-Adjusted MACD: Incorporates volume for a more realistic momentum view.
📊 Linear Regression Signal: Smoother and more reactive trend analysis.
🎯 Dynamic Stdev Bands: Visualize ±1 and ±2 standard deviation thresholds for anomaly detection.
🌈 Custom Color Themes: Choose from built-in palettes or define your own bullish/bearish signal colors.
⚠️ Alert Conditions: Built-in alerts notify you of potential trend shifts across all signal modes.
📈 How It Works :
🧮 MACD Core: Uses volume-weighted price to generate fast and slow EMAs, forming the MACD and signal lines.
📉 Histogram Logic: Histogram is either the traditional MACD histogram or its linear regression version.
📊 Signal Modes:
• Linear Regression: Detect trend based on smoothed MACD behavior.
• Strong/Weak Trend: Identifies accelerating/decelerating trend strength.
• Volume MACD: Classic volume MACD behavior for divergence spotting.
📏 Stdev Bands: Calculated over a long period (default 200) to highlight statistically significant moves.
🎨 Color-coded Feedback: Bar and background colors adjust dynamically with market condition.
⚙️ Customization Options :
🔄 Choose your Signal Type from three unique analysis modes.
📏 Modify Fast/Slow/Signal lengths and Regression parameters to suit your strategy.
📈 Enable or disable Stdev Bands and adjust multiplier.
🎨 Select from Classic, Mystic, Accented, or Royal color palettes — or create your own.
📌 Use Cases :
🟢 Identify trend continuation or reversal zones with volume-adjusted signals.
🔴 Detect volatility breakouts using standard deviation bands.
🧭 Use in confluence with price structure, RSI, or market sentiment.
⚠️ Disclaimer :
This indicator is for educational purposes only. It is not financial advice. Always use in conjunction with your own research and risk management strategy.

SMC ICT – Simplified Daily Trend & Reversal AnalyzerThis Pine Script provides a simplified approach to analyzing daily trends and potential reversals using concepts inspired by Smart Money Concepts (SMC) and ICT (Inner Circle Trader).
What It Does:
• Detects daily uptrend and downtrend conditions by comparing the current daily high/low to the previous day’s values.
• Highlights potential bullish or bearish reversal zones when price behavior suggests a shift in sentiment.
• Automatically draws dashed lines for the previous day's high and low.
• Labels these high/low levels for quick visual reference.
How to Use:
Apply this indicator to any timeframe chart. Use the plotted trend markers to assess daily direction and potential reversal signals. The dashed lines (previous high/low) can be used as reference points for liquidity zones or break/retest entries.
User Interface:
The indicator displays labels and shapes in English. This script is intended for educational and trading workflow enhancement purposes.
Note:
This is an open-source tool designed for clarity and basic SMC/ICT application. It is best used in combination with other confluences like FVGs, order blocks, and liquidity sweeps.

[blackcat] L1 Rhythm OscillatorOVERVIEW 📊💡
The L1 Rhythm Oscillator is an advanced oscillator designed to identify potential entry points in financial markets using a combination of Williams %R indicators and Time-Varying Moving Averages (TVMAs). This script provides traders with clear buy and sell signals that help them capitalize on trends while minimizing risk.
FEATURES 💡🌟
Williams %R Analysis:
Base Indicator (WR0): Measures overbought/oversold conditions within a specified period.
Smoothed Indicators (WR1 & WR2): Further refined versions of WR0 to filter out noise and highlight significant trends.
Dynamic Bands:
Bull Band: Shaded area between WR0 and the bullish threshold when WR0 falls below the defined level.
Bear Band: Shaded area between WR0 and the bearish threshold when WR0 exceeds the defined level.
Trading Signals:
Buy Signal: Generated when WR1 crosses above WR2, indicating a potential upward trend reversal.
Sell Signal: Triggered when WR1 crosses below WR2, suggesting a downward trend shift.
Thresholds:
Bull Threshold (default 60%): Marks levels where the asset is considered relatively undervalued.
Bear Threshold (default 40%): Indicates regions where the asset might be overvalued.
Visual Enhancements:
Colored Bands: Clearly distinguish between bullish and bearish areas.
Horizontal Lines: Provide quick reference points for overbought/oversold levels.
Labels: Display "BUY" and "SELL" markers at key signal locations.
HOW TO USE ⚙️📈
Add the Indicator to Your Chart:
Open your preferred asset's chart on TradingView.
Click on “Indicators” and search for “ L1 Rhythm Oscillator.”
Add the indicator to your chart.
Customize Parameters:
Adjust these inputs according to your trading strategy:
WR Period: Sets the lookback window for calculating Williams %R.
Bull Threshold: Defines the upper limit for bullish territory.
Bear Threshold: Establishes the lower boundary for bearish territory.
TVMA Length: Controls the sensitivity of the moving average used in calculations.
Interpret Visual Elements:
Yellow Line (WR1): The first smoothed version of the base Williams %R.
Fuchsia Line (WR2): The second smoothed line derived from WR1 via TVMA.
Lime-Shaded Area: Represents Bull Band where prices are potentially undervalued.
Red-Shaded Area: Symbolizes Bear Band indicating possible overvaluation.
Horizontal Lines:
Value 0% represents perfect overbought condition.
Value 100% indicates extreme oversold state.
Bull/Bear thresholds provide additional context for interpreting market sentiment.
Act on Crossovers:
Look for instances where WR1 crosses through WR2:
When WR1 moves above WR2 → Potential BUY opportunity.
When WR1 dips below WR2 → Likely SELL scenario.
Consider Contextual Factors:
Combine the oscillator signals with other technical indicators like MACD, RSI, or volume analysis for more robust decision-making.
Be aware of broader market trends and news events that could impact price movements.
Manage Risk:
Always use proper stop-loss orders to protect against adverse price movements.
Consider position sizing based on available capital and risk tolerance.
LIMITATIONS ⚠️🔍
Historical Data Dependency: Like most oscillators, this tool relies on past data patterns which may not always predict future behavior accurately.
False Signals: No single indicator can guarantee correct predictions; false positives/negatives can arise during volatile periods.
Overfitting Risks: Customized settings might work well historically but fail under different market conditions without careful validation.
Complexity: Multiple layers of smoothing and crossover logic require understanding to interpret correctly.
NOTES 🔍📝
Parameter Optimization: Experiment with various combinations of WR Period, Bull/Bear Thresholds, and TVMA Length to find what works best for specific assets and timeframes.
Regular Review: Continuously monitor the performance of the indicator versus actual outcomes, adjusting parameters as needed.
Educational Resources: Deepen your knowledge about oscillator strategies, particularly focusing on how they detect reversals and momentum shifts.
Consistency Key: For successful implementation, maintain consistent rules regarding trade entries/exits regardless of short-term fluctuations.
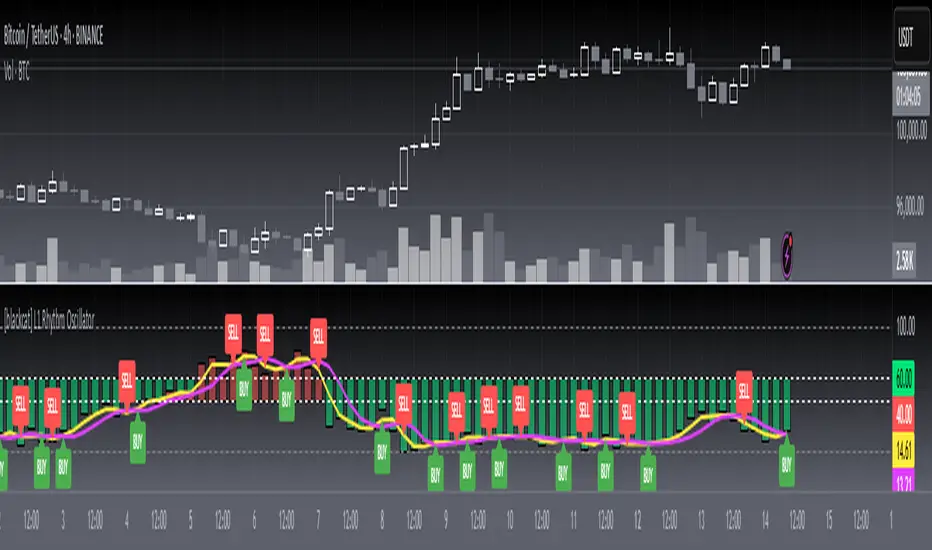
Disparity Index with Volatility ZonesDisparity Index with Volatility Zones
is a momentum oscillator that measures the percentage difference between the current price and its simple moving average (SMA). This allows traders to identify overbought/oversold conditions, assess momentum strength, and detect potential trend reversals or continuations.
🔍 Core Concept:
The Disparity Index (DI) is calculated as:
DI = 100 × (Price − SMA) / SMA
A positive DI indicates the price is trading above its moving average (potential bullish sentiment), while a negative DI suggests the price is below the average (potential bearish sentiment).
This version of the Disparity Index introduces a dual-zone volatility framework, offering deeper insight into the market's current state.
🧠 What Makes This Version Unique?
1. High Volatility Zones
When DI crosses above +1.0% or below –1.0%, it often indicates the start or continuation of a strong trend.
Sustained readings beyond these thresholds typically align with trending phases, offering opportunities for momentum-based entries.
A reversal back within ±1.0% after exceeding these levels can suggest a shift in momentum — similar to how RSI exits the overbought/oversold zones before reversals.
These thresholds act as dynamic markers for breakout confirmation and potential trend exhaustion.
2. Low Volatility Zones
DI values between –0.5% and +0.5% define the low-volatility zone, shaded for visual clarity.
This area typically indicates market indecision, sideways price action, or consolidation.
Trading within this range may favor range-bound or mean-reversion strategies, as trend momentum is likely limited.
The logic is similar to interpreting a flat ADX, tight Bollinger Bands, or contracting Keltner Channels — all suggesting consolidation.
⚙️ Features:
Customizable moving average length and input source
Adjustable thresholds for overbought/oversold and low-volatility zones
Optional visual fill between low-volatility bounds
Clean and minimal chart footprint (non-essential plots hidden by default)
📈 How to Use:
1. Trend Confirmation:
A break above +1.0% can be used as a bullish continuation signal.
A break below –1.0% may confirm bearish strength.
Long periods above/below these thresholds support trend-following entries.
2. Reversal Detection:
If DI returns below +1.0% after exceeding it, bullish momentum may be fading.
If DI rises above –1.0% after falling below, bearish pressure may be weakening.
These shifts resemble overbought/oversold transitions in oscillators like RSI or Stochastic, and can be paired with divergence, volume, or price structure analysis for higher reliability.
3. Sideways Market Detection:
DI values within ±0.5% indicate low volatility or a non-trending environment.
Traders may avoid breakout entries during these periods or apply range-trading tactics instead.
Observing transitions out of the low-volatility zone can help anticipate breakouts.
4. Combine with Other Indicators:
DI signals can be enhanced using tools like MACD, Volume Oscillators, or Moving Averages.
For example, a DI breakout beyond ±1.0% supported by a MACD crossover or volume spike can help validate trend initiation.
This indicator is especially powerful when paired with Bollinger Bands:
A simultaneous price breakout from the Bollinger Band and DI moving beyond ±1.0% can help identify early trend inflection points.
This combination supports entering positions early in a developing trend, improving the efficiency of trend-following strategies and enhancing decision-making precision.
It also helps filter false breakouts when DI fails to confirm the move outside the band.
This indicator is designed for educational and analytical purposes and works across all timeframes and asset classes.
It is particularly useful for traders seeking a clear framework to identify momentum strength, filter sideways markets, and improve entry timing within a larger trading system.

Heikinisi Candle (With MA + Smoothing + Buy/Sell with Cooldown)This custom Heikinisi Candle (With MA + Smoothing + Buy/Sell with Cooldown) indicator combines the advantages of Heikin-Ashi candles with the flexibility of multiple moving averages and smoothing options. The built-in buy/sell signals with cooldown functionality help traders avoid overtrading while capturing trend reversals and momentum shifts. Whether you're a day trader, swing trader, or long-term investor, this indicator offers powerful tools for analyzing price action and making informed trading decisions.
Note: Disable the regular candle to get better visualization.
Key Features:
Custom Heikin-Ashi Candles:
The core feature of this script is the Heikin-Ashi candles, which are known for smoothing price action and helping traders identify market trends more clearly.
Unlike traditional Heikin-Ashi, this version adjusts the Heikin-Ashi close based on specific price action patterns, including rejection signals and engulfing patterns.
The custom Heikin-Ashi open also incorporates momentum, adjusting dynamically based on recent price changes.
Price Action Measurements:
The indicator measures key price action components, including:
Body: The absolute difference between the open and close.
Candle Range: The total range from high to low.
Upper Wick: The distance from the highest price to the maximum of open or close.
Lower Wick: The distance from the lowest price to the minimum of open or close.
These measurements help detect bullish and bearish conditions, as well as price rejection signals.
Buy/Sell Signal Logic:
Buy Signal: Triggered when the Heikin-Ashi close is above the chosen moving average (MA1), with a cooldown period to avoid too frequent signals.
Sell Signal: Triggered when the Heikin-Ashi close falls below the MA1 after a buy signal has already been issued.
The cooldown period ensures that buy and sell signals are spaced apart by a specific number of bars, preventing excessive signal generation during periods of price consolidation.
Multiple Moving Averages (MA):
This script supports up to three customizable moving averages (MA1, MA2, MA3), each of which can be set to different types and lengths, including:
Simple Moving Average (SMA)
Exponential Moving Average (EMA)
Weighted Moving Average (WMA)
Volume Weighted Moving Average (VWMA)
Volume Weighted Moving Price (VWMP)
Least Squares Moving Average (LSMA)
Hull Moving Average (HMA)
Double Exponential Moving Average (DEMA)
Triple Exponential Moving Average (TEMA)
Users can adjust the length and type of each MA for tailored analysis.
Smoothing Options for MAs:
Users can smooth the output of MAs using various types of smoothing algorithms (SMA, EMA, LSMA, WMA, Gaussian) and a customizable length. This helps to reduce noise in the moving average lines and provides clearer signals.
Gaussian Filter (Advanced Smoothing):
A Gaussian Filter is available as a smoothing option for MAs. This filter reduces noise and makes the moving averages smoother, which can be particularly helpful in volatile or choppy markets.
Alerts and Visualization:
The script allows users to plot buy and sell signals on the chart with distinctive markers. A Buy Signal is shown below the bar with a lime green marker and text "Buy," while a Sell Signal is shown above the bar with a red marker and text "Sell."
Traders can also set up alerts based on the buy/sell signals to get notified in real time.
Indicator Configuration:
Heikin-Ashi Candle Configuration:
Automatically adjusts Heikin-Ashi candles based on rejection signals, engulfing patterns, and momentum. It uses custom formulas for the Heikin-Ashi open and close, making it more sensitive to price action than standard Heikin-Ashi candles.
Moving Averages (MA) Configuration:
You can select from multiple moving average types and lengths (MA1, MA2, MA3) for trend-following analysis.
Choose between SMA, EMA, WMA, VWMA, VWMP, LSMA, HMA, DEMA, and TEMA.
Smoothing Options:
Enable or disable smoothing for the moving averages.
Select from different smoothing types, including SMA, EMA, RMA, WMA, LSMA, and Gaussian.
Cooldown Period:
Control the number of bars that must pass before a new buy/sell signal is triggered. This cooldown period helps prevent excessive trading signals in quick succession.
How to Use:
Analyze Price Action with Heikin-Ashi Candles:
The custom Heikin-Ashi candles are ideal for spotting market trends, reversals, and price rejection. Use the candle patterns to gauge the market sentiment.
Use MAs for Trend Confirmation:
The moving averages (MA1, MA2, MA3) can help identify the prevailing trend. A price above a rising MA indicates an uptrend, while a price below a falling MA suggests a downtrend.
Trigger Buy and Sell Signals:
When the Heikin-Ashi close crosses above MA1, a buy signal is triggered.
When the Heikin-Ashi close crosses below MA1 after a buy signal, a sell signal is triggered.
The cooldown period ensures that signals are spaced out, preventing overtrading.
Use Smoothing for Clearer Signals:
If you are trading in a volatile market, you can use the smoothing options to make the MAs smoother and reduce noise.

Stablecoin Supply Ratio [Alpha Extract]Stablecoin Supply Ratio Indicator
The Stablecoin Supply Ratio (SSR) indicator compares Bitcoin's market capitalization to the aggregate supply of major stablecoins, offering insights into relative purchasing power and liquidity. This tool helps traders:
✔ Assess Bitcoin's buying power relative to the available stablecoin liquidity.
✔ Detect periods of capital inflow or outflow from stablecoins.
✔ Identify market sentiment shifts based on stablecoin reserves.
🔶 CALCULATION
The indicator aggregates the supply of key stablecoins and compares it to Bitcoin's market cap:
Stablecoin Aggregation
• Inputs:
USDT, USDC, DAI, USDD (daily closing values).
BUSD Market Cap (Glassnode data).
• Total Stablecoin Supply:
Sum of the listed stablecoins' market caps.
Stablecoin Supply Ratio (SSR)
• Formula:
SSR = Bitcoin Market Cap / Total Stablecoin Supply
• Normalized SSR:
Normalized by dividing SSR by its 200-day SMA.
Bollinger Bands
• Bands are applied to the normalized SSR using a configurable moving average type and 2 standard deviations.
Example Calculation:
ssr = btcmc / stablecoin_liq
ratio = ssr / ta.sma(ssr, 200)
basis = ta.sma(ratio, 200)
dev = 2 * ta.stdev(ratio, 200)
upper = basis + dev
lower = basis - dev
🔶 DETAILS
Visual Features:
• Normalized SSR:
Plotted as a light green line.
• Upper Band:
Red line indicating SSR overbought zone.
• Lower Band:
Green line signaling SSR oversold zone.
Interpretation:
• High SSR: Indicates stablecoin reserves are low relative to Bitcoin's market cap, reducing stablecoin buying power.
• Low SSR: Suggests high stablecoin liquidity relative to Bitcoin's market cap, increasing potential buying pressure.
• Band Crosses: Movements beyond the upper or lower bands may signal sentiment extremes.
🔶 EXAMPLES
Market insights include:
• Capital Outflows: SSR rising into the upper band may reflect decreasing stablecoin reserves, potentially signaling a liquidity drain.
• Capital Inflows: SSR dropping near the lower band could indicate growing stablecoin reserves, potentially fueling Bitcoin demand.
🔶 SETTINGS
Customization Options:
• MA Type: Choose between SMA, EMA, WMA, SMMA, and VWMA for band calculation.
• Period: Adjust the 200-day smoothing period.
• Deviation Multiplier: Modify the standard deviation multiplier (default: 2).
The Stablecoin Supply Ratio indicator is a valuable tool for traders monitoring liquidity dynamics and stablecoin trends to anticipate Bitcoin market moves and capital flows.

4H High-Low BoxesThis indicator dynamically plots high-low boxes based on the most recent 4-hour candle, providing visual markers for key price levels and trends. The box is updated in real-time to reflect the highest and lowest points of the current 4-hour candle, and its color changes based on the market's direction.
Key Features:
Dynamic Boxes: The indicator automatically adjusts to the 4-hour candle's high, low, and open price, creating a box that updates with price action.
Color-Coding: The box color changes based on the price direction. A green box indicates bullish market sentiment (price is above the 4H open), while a red box indicates bearish sentiment (price is below the 4H open).
Accurate Timeframe Representation: It works across any intraday timeframe (e.g., 5-minute, 15-minute, 1-hour), providing consistent, visually relevant markers for trading decisions.
Real-Time Updates: The box is adjusted dynamically as price evolves, ensuring it accurately represents the 4-hour price range during live trading.
Customizable Settings: Tailor the visual aspects of the box, including border color, background transparency, and other parameters.
Trading Strategy Ideas:
Rejection at High/Low: Look for price rejection at the 4H high/low for potential reversal signals.
Breakout Strategy: Trade breakouts above the 4H high or below the 4H low for momentum trades.
Mean Reversion: Enter when price moves away from the 4H open, expecting it to return to the open price.
This indicator can be used as a standalone tool or combined with other technical indicators to improve entry and exit points. Perfect for swing traders and those using price action to identify key support and resistance levels.
HAPPY TRADING
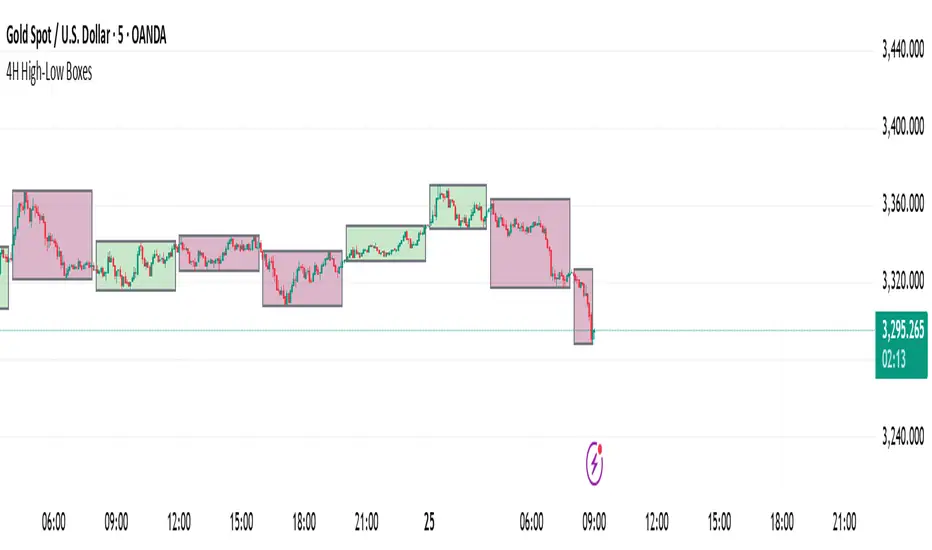
Jinsu RSI 14### 🔍 **Jinsu RSI 14 – EMA 9 & WMA 45**
**Description:**
This custom indicator combines the classic RSI (Relative Strength Index) with two moving averages — EMA (Exponential Moving Average) and WMA (Weighted Moving Average) — applied directly to the RSI value to provide more nuanced momentum signals.
### 📊 **How It Works**
- **RSI 14** measures market momentum and identifies overbought (above 70) or oversold (below 30) conditions.
- **EMA 9 on RSI** responds quickly to short-term changes, signaling momentum shifts.
- **WMA 45 on RSI** captures long-term sentiment, while placing more emphasis on recent data.
### 🧠 **Signal Interpretation**
- **RSI crosses above EMA 9** → Possible bullish momentum shift.
- **RSI falls below EMA 9** → Possible bearish momentum shift.
- **EMA 9 crosses above WMA 45** → Strong bullish momentum.
- **EMA 9 falls below WMA 45** → Strong bearish momentum.
- **RSI is between EMA 9 & WMA 45** → Market may be consolidating or oscillating.
### 🎨 **Visual Enhancement**
- The neutral zone (RSI between 30–70) is lightly shaded purple to reduce visual noise.
- When **RSI > 70**, a green color appears and intensifies with higher RSI values, highlighting strong buying pressure.
- All values are displayed with two decimal precision for clarity.
This tool is ideal for trend-following traders and momentum-based strategies, helping you recognize early shifts in market sentiment with visual cues and cross confirmations.
