In den Scripts nach "scalping" suchen
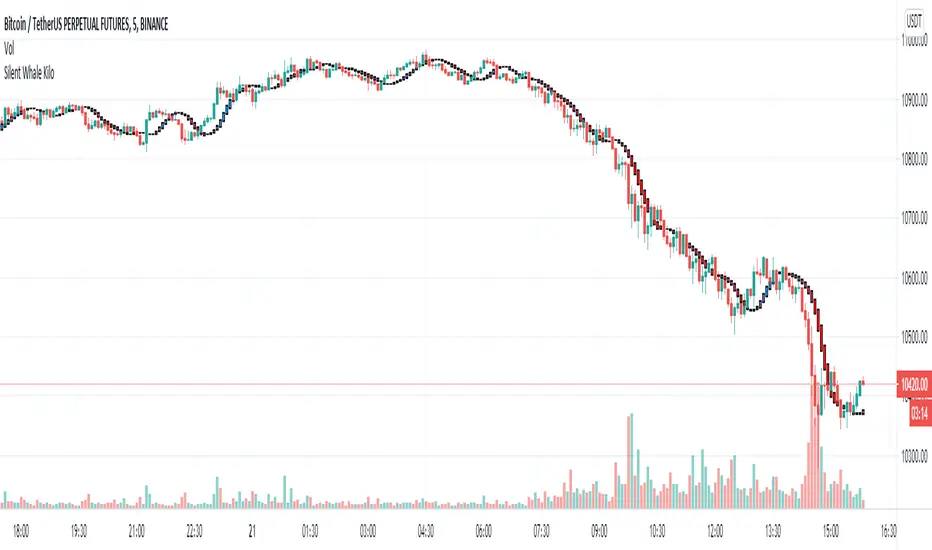
DayTrade - XBTUSD 5m [ALERTSETUP]Plug & Play indicator for BITMEX:XBTUSD in 5 minute timeframe for Manual or Automated Day Trading.
Built upon Cyatophilum Scalping Bot
Backtest below show results over 2 weeks, calculated with a 0.075 % commission fee and using 100% of equity on each trade from 10 000$ inital capital.
> Get access to the Cyatophilum Indicators <
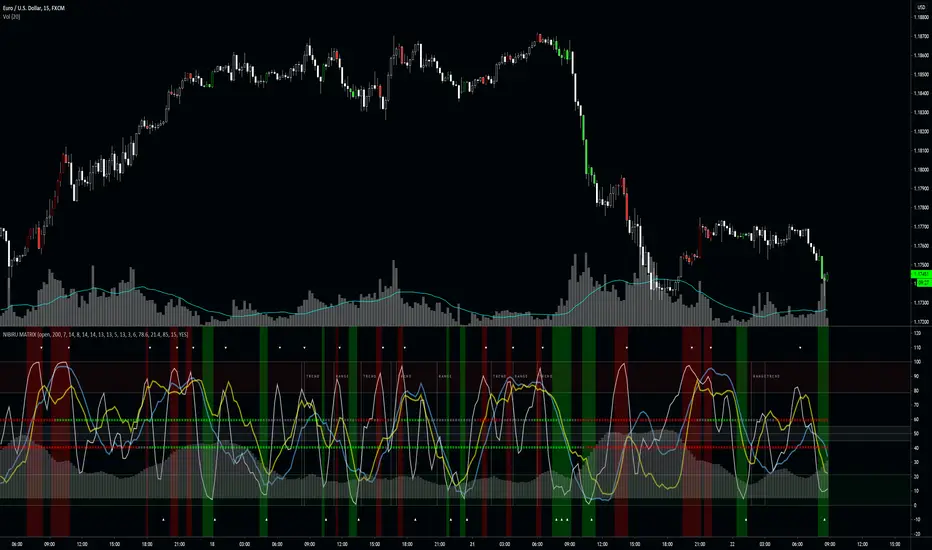
NIBIRU MATRIXThe Nibiru Matrix is an entry timing tool based on oscillators and trends. It's to provide an intuitive way of timing trades when price is at the resistance or on the support.
The Nibiru Matrix provides trade entry hints and information about the current market behavior (trending or ranging). If the market is trending, it also shows the trend strength and direction. It is a secondary indicator meaning it trade should be made on the support or resistance using Nibiru Matrix as a confluence indicator.
What it plots?
Slow, fast and stochastic oscillators
Bar coloring to warn about possible setups
Trending/ranging market indication
Current volatility
2 methods of trend confirmation based on 2 different algorithms
Indicator components:
Trend/range setup - provides information about current possible trade strategy. Following a RANGE indicator, Voodoo Matrix suggests that the safest way to trade will be between the local support and resistance shown by Voodoo Support and Resistance, and following a TREND indicator, it is likely that a trending strategy or taking profit on larger ranges is more profitable.
Fast trend indicator - providing color based information on direction of the short-term trend. This is the most reactive trend indication shown by Voodoo Matrix. This can even be used for counter-main-trend scalping.
Green - uptrend
Red - downtrend
Gray - indecision
Slow trend indicator - providing color based information on direction of the long-term trend. It is based on the behavior of a longer period EMAs.
Green - uptrend
Red - downtrend
Gray - indecision
Volatility histogram - information on current price strength. Best used in confluence with the short term trend indicator.
Fast oscillator - oscillator based on stochastic RSI, modified to provide better information on timing and price movement. It's fast moving which helps time the shorter-term moves.
Slow oscillator - oscillator based on stochastic RSI, modified to provide better information on timing and price movement. It's slow moving and provides useful information about the price direction and strength of the move.
Stochastic oscillator - simple stochastic oscillator. Best used with both Fast and Slow Oscillators to get best timing and price movement strength and direction.
Overbought zone - area of the chart where the modified stochastic oscillator suggests the market is currently overbought.
Oversold zone - area of the chart where the modified stochastic oscillator suggests the market is currently oversold.
Neutral zone - area of the chart where the modified stochastic oscillator suggests the market is currently neutral.
Timing confirmation hints - signaling confirmation of fast oscillator forming a buy/sell setup.
Fast oscillator buy/sell color hint s – bar coloring to bring a focus and attention to possible buy/sell signal forming on the fast oscillator.
Use the link below or PM me to gain access to the indicator.
DOUBLE TRIXTRIX is an oscilator which is calculated from close price by exponentially smoothing it three times.
When it crosses zero and goes up, it tells that the trend is upwards and vise versa.
Some traders use 2 TRIX lines with different periods to enter the deal when they cross each other.
On tradingview there was no such option to use 2 TRIX on chart and niether the option to choose the source of calculation.
DOUBLE TRIX lets you use 2 TRIX lines and choose the source.
By default the configuration is 18-9, source ohlc4.
How to use:
1. You can use it in combination with TRSI (my other script which contains the code of TRIX) to filter the entry point, i.e. to
open the position when both indicators show the same direction. Look at the chart for an example.
2. You can also use 4-14 for small timeframes for scalping.
Use it carefully and in combination wiht other indicators.
Will be glad to see your feedback.

B1 BetaThis indicator study RSI values for many other special indicators.
this indicator is great for scalping.
Green comes overall, that's mean long.
Orange comes overall, that's mean short.

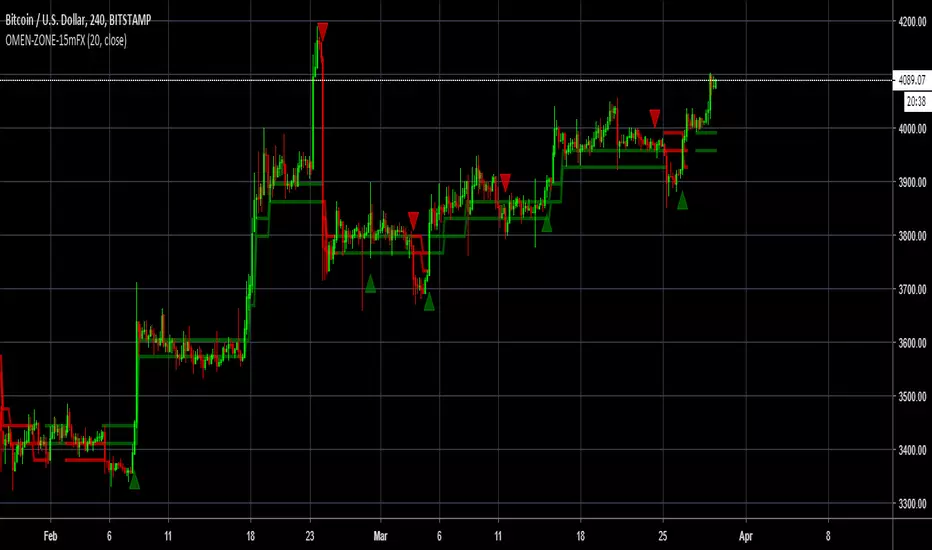
OMEN-ZONE-15mFXOMEN-ZONE created for 15m Charts FOREX. Omen-zone allows users to have a zone of entry for shorting and Longing.
3 Candle Wait will give users larger Zones for catching longer moves and to find great entries
20 Candle Wait will give users smaller Zones for catching Shorter moves for Scalping.
PPSignal BB and EWO BB Strategy ScalpDescription:
This indicator is an implementation of the Bollinger Band and EWO Oscillator Scalping system.
This technique is for those who want the most simple method that is very effective. It is BEST traded during the busiest trading hours, 3am to 12am EST NY time. This method doesn't work in sideways markets, only in volatile trending markets.
-Time Frames: 1, 5, 10, 15 ,30 min.
-Currency pairs: majors, btc, futures and volatile stock.
Other Chart indicators:
Add EWO bb.
Optionally Add Squeeze Indicato or bbsqueeze .
Here's the strategy:
// Going LONG:
Enter a long position when Curve Slope has crossed up through the Bollinger upper band (lime) . At the same time, the EWO BB or BBqueeze should be approaching or crossing it's zeroline, going up. This is indicated by "Buy" alert.
// Going SHORT:
Enter a short position when Curve Slope has crossed down through the low Bollinger red. At the same time, the EWO BB or BBqueeze should be approaching or crossing it's zero line, going down. This is indicated by the "Sell" Alert.
// Take profit:
// 10-20 pips depending on pair or When Awesome Oscillator turns a different color.
// HINTS: Best trades tend to occur when price reversing bounce off outer band and and outside Optional Bollinger Squeeze indication.
// References:
www.forexstrategiesresources.com

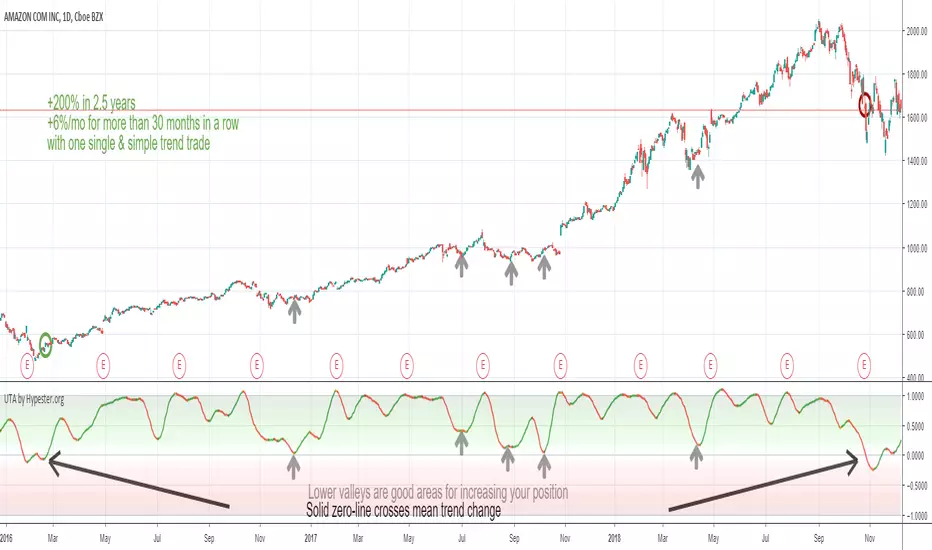
Ultimate Trend Analyzer by HypesterTrading is not all about scalping/day trading. To have a healthy and diversified portfolio, you should always have some trending long term assets to mitigate risks and keep your wallet always on the green side.
That's why Hypester once again innovates with the Ultimate Trend Analyzer. With the UTA you can check the trend's health with one glance.
Do not fool yourself, the Ultimate Trend Analyzer offers different trading profiles, so it doesn't matter what kind of trading you are doing, from long positions to intraday scalping - UTA can quickly adapt with one click. UTA offers Swing/Longterm, Day Trading and Scalping profile.
It also has two correlation methods, volume, and price. So you can decide what you want to prioritize most.
Not only that, there are two smoothing methods, linear regression and symmetrical averaging so you can remove noises from your indicator line.
The UTA offers you insight about the trend's health, just by looking at the background color, the stronger the color, stronger the trend. So higher up it is, stronger the uptrend is. The lower it is, stronger the downtrend.
Nevertheless, the UTA also gives you insight within trend corrections and peaks and bottoms with the indicator line color. So if you have a bullish trend and you see an orange line color, it means that direction is changing and you will observe a line color change, which means the course is now bearish even though the overall trend is going up. This feature is great for swing/scalp trading looking at the big picture.
TB!G-Scalp Strategy [Alert]Scalping Crypto Assets Made Easy
TB!G-Scalp is a TradingView based alert and accompanying strategy PineV3 Script.
Backtest vs Realtime
When designing the algorithms for this strategy our focus was primarily on ease of use.This results in a beautiful yet easy to use scalping strategy. As input it takes a chart period and only one extra parameter for fine tuning. The backtest results are an accurate representation of it’s real-time behaviour.
What makes it tick?
Over the last 2 years we collected a lot of market data regarding Bull and Bear behaviours. This previous market behaviour echo’s into the current market trend.
By recognising these echo’s we are able to anticipate an upcoming micro reversal which eventually end up being a scalping strategy.
Interested
Access is provided to a limited amount of people and for the duration that is determined by it’s Alpha Decay Rate.
This ADR is expected to become problematic after 2.3 year of usage on a lot of 150 users.

Vilarso S1This indicator shows fractals. The main levels of support and resistance. Arrows point to buy and sell zones - great for scalping. And the most important thing is the 5 moving averages SMA by which you can determine the direction of the trend, its support and resistance zones. It is very convenient when different averages for junior and senior periods from 9 to 200 are displayed in one indicator. I installed the standard: 9, 21, 55, 100, 200.
Recommendation: You can reconfigure all 5 mediums on your own. And work out the medium crossings according to your trading strategy.
For example, on my daily timeframe, use my template, and on smaller timeframes you can edit by Fibonacci numbers: 5, 8, 13, 21, 34, 55, 89, 144, 233
Vilarso - recommends you to experiment!
Add to your favorite scripts and trade in profit!

C03 8 MAEasy way to enter up to 8 Moving Average, SMA or EMA
How to use:
Check and choose to use SMA or EMA
-style 1: 5,8,13,21,34,55,89,144
-style 2: 8,13,41,200,243,300,500,700
-style 3: 15,30,50,100,200,300,500,700
i.e:
When MA8 cross MA13 it can be used for scalping.
When MA13 pulls back to MA34 you can buy more or sell more depending on the situation without having to exit your position prematurely before trend direction changes.
This can also be used as position entry points to make sure you are getting the best possible price.
If MA8, MA13 and MA34 cross over MA55: trend confirmed.

Key Levels [@treypeng]Draws horizontal lines for Daily, Hourly (1) and Weekly levels. Really handy to switch on quickly when scalping.
Light blue: Previous hour OHLC
Thick light blue: Previous hour Close / current hour Open
Dark blue: Yesterday OHLC
Thick dark blue: Yesterday Close / today Open
Purple: Weekly Open
It's a bit ugly, I'd prefer horizontal rays instead of lines stretching back across the chart but I couldn't figure out how to do this in PineScript. If I get it sorted, I'll publish an update.

Adjustable Fibonacci LevelsThe Adjustable Fibonacci Levels script allows you to retrieve Fibonacci levels for x days back. This might come in handy when scalping. Shoutout to u/Autemox for the inspiration!

SHERRIFx (variation) IN TRENDI share this script where I made some modifications to the SHERRIF strategy to perform trend scalping.
I use:
- Bollinguer Bands (20)
- CCIs (14 and 40)
- EMAS (20, 57, 100, 200)
- Stochastics (13,3,3) in 70, 30.
I apply in low temporalities, especially M15 and M1, it can also be used to make binaries or in higher temporalities by modifying the constants.
If you improve this program, share it.
Greetings.

Misc OscillatorCombination of Stoch, RSI, Wave Trends, and TTM Squeeze to help identify buy/sell zones for scalping.

Bimex Long Short PRO [PlungerMen]Hello!
This free community edition is very good for all time frame , for all the crypto
This Script recognized overbought area and over-selling area extremely accurate
This Script is very well used as it works by itself and very well used in conjunction with the "Bitmex scalping " script, both compliment for each other. the "Bitmex Scalping" script is Free, you can find it
If you want to be more accurate and more efficient, more comfortable when you do not want to see too many other indicators, you can register for our Professional edition.
- The Professional Edition supports Level 1 and Level 2 commands, which are very effective in allocating funds and optimizing your profits
Besides that,You will be supported by personal preferences, profit maximization
- Register for a Professional version will be used 2 Script,Bimex Scalping Pro and Bitmex Long Short Pro
- We will invite you to the signal channel with the announcement of the bottom and the peak of the BTC ,the big variable variable has exists
We hope you enjoy this script. Your support will help us develop more good quality scripts in the future to serve the community
**Remember, Like this script and posivite feedback if you are satisfied**
if you have any questions Plz post a comment ... below here
******
Thanks


Two Bar Break Line Alerts R1.0 by JustUncleLThis indicator with default settings is designed for BINARY OPTIONS trading. The indicator can also be used for Forex trading with some setting changes. The script shows Two Bar Pullback Break lines and alerts when those Break lines are Touched (broken) creating a short term momentum entry condition.
For a Bullish Break (Green Up Arrow) to occur: first must have two (or three) consecutive bear (red) candles which is followed by a bull (green) candle creating a pivot point. The breakout occurs then the High of the current Bull (green) exceeds the highest point of the previous two (or three) pivotal bear candles. The green channel Line shows where the current Bullish BreakOut occurs.
For a Bearish Break (Red Down Arrow) to occur: first must have two (or three) consecutive bull (green) candles which is followed by a bear (red) candle creating a pivot point. The breakout occurs when the Low of the current Bear (red) drops below the lowest point of the previous two (or three) pivotal Bull candles. The red channel Line shows where the current Bearish BreakOut occurs.
The break Line Arrows can optionally be filtered by the Coloured MA (enabled by default), a longer term directional MA (disabled by default) and/or a MACD condition (enabled by default) as a momentum filter.
You can optionally select three Bar break lines instead of two. The three bar break lines are actually equivalent to Guppy's Three Bar Count Back Line method for trade entries (see Guppy's video reference below).
Included in this indicator is an ability to display some basic Binary Option statistics, when enabled (enabled by default) it shows Successful Bars in Yellow and failed Bars in Black and the last Nine numbers on the script title line represent the Binary option Statistics in order:
%ITM rate
Total orders
Successful Orders
Failed Orders
Total candles tested
Candles per Day
Trades per Day
Max Consecutive Wins
Max Consecutive Losses
You can start the Binary Option statistics from a specific Date, which is handy for checking more recent history.
HINTS:
BINARY OPTIONS trading: use 5min, 15m, 1hr or even Daily charts. Trade after the price touches one of the Breakout lines and the Arrow first appears. Wait for the price to come back from Break Line by 1 or 2 pips, the alert arrow must stay on and candle change to black, then take Binary trade expiry End of Candle. If price pull back and arrow turns off, don't trade this candle, move on you probably don't have momentum, there will be plenty of other trigger events. The backtesting results are good with ITM rates 65% to 72% on many currency pairs, commodities and indices. Realtime trading has confirmed the backtesting results and they could even be bettered, provided you are selective on which signals to trade (strong MACD support etc), that you are patient and disciplined to this trading method.
FOREX trading: the default settings should work with scalping. For longer term trades try with settings change to a more standard MACD filter or slower to catch the longer term momentum swings and the idea would be to trade the first Break Line alert that occurs after a decent Pullback in the direction of the trend. Setting the SL to just above/below the Pivot High/Low and set target to two or three times SL.
References:
"Fundamentals of Price Action Trading for Forex, Stocks, Options and Futures" video:
www.youtube.com
Other videos by "basecamptrading" on Naked Trading.
"Taking Profits in Today's Market by Daryl Guppy" video:
www.youtube.com

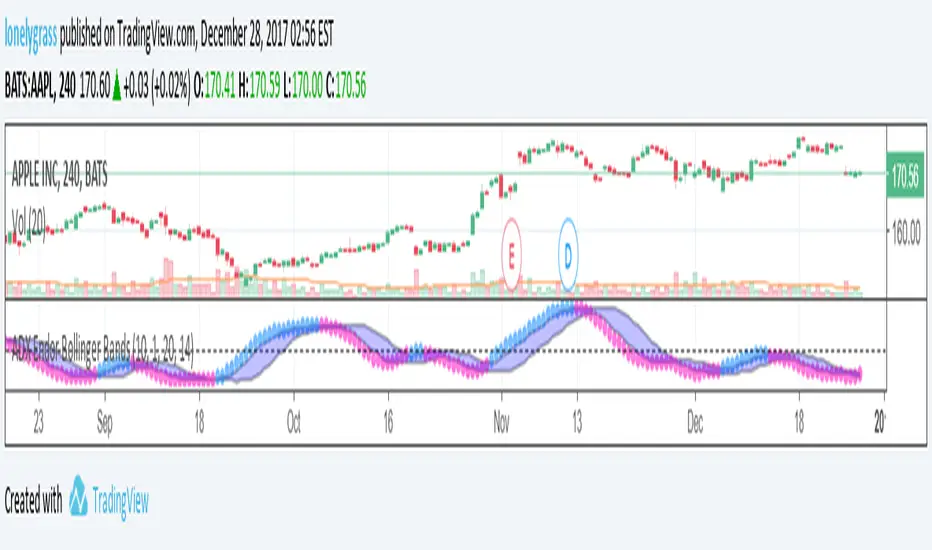
ADX Endor Bollinger BandsThis is a modified version of ADX , and it has a bollinger bands endorsed. An advantage of the indicator is allowing users to capture short term rise or drop of trend strength, particularly useful for scalping.
There are three modes open to users: ADX, DIPlus and DIMinus. Users can simply choose the indicators in their favor. A breach of the upper bollinger band will be in blue, breaching lower band or inside-the-bands signals are painted in pink.
Hope you will enjoy it. Make sure to follow my trading journal and give a thumb up to this post.
Double CCI & RSI AlertHi, I am lonelygrass. It is suggested to use this indicator with my another script, Double CCI & RSI Trigger , . This EA consists of a CCI of 34 periods and RSI of 14 periods.
The alert is created in hopes of distinguishing super short term trend and helping scalping.
In general, triangleup (bullish) and triangledown (bearish) are shown near each bars.
A qualifying bullish bar should (1) have a CCI value equaling 0 or more and (2) have a RSI value equaling 55 or more
Instead, a bearish bar should (1) have a CCI value below 0 and (2) have a RSI value below 45
If you put two systems together, you will get an idea of when to initiate your trade and how to hold onto your trade until a counter signal comes off the graph.

NG [Multi-Stochastics]Multiple stochastic script with trend direction.
* Each base shows 3 lines multiplied by 1.618
* Possible to chose how to calculate MA of stochastics SMA, EMA, DEMA, TEMA.
* Possible to chose how to calculate trend.
* Trend adjustment is to adapt to current situation not for signals
Fast stochastics gives a lot of noise but some times good for scalping.

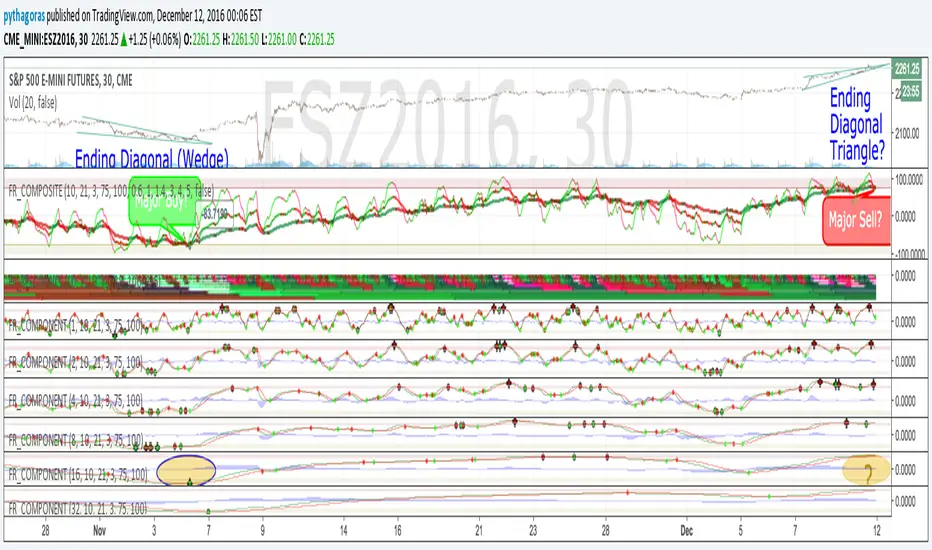
Fractal Resonance CompositeFractal Resonance Composite compresses 8 timescales of stochastic oscillators into just 3 color-coded composite lines: fast, medium and slow. Fast emphasizes the shorter timescale oscillators, medium considers all 8 timescales evenly, and slow emphasizes the longer timeframe oscillators. The composite lines indicate how overbought/sold the market is relative to the size of its recent movements. Major buys occur when all three composites enter the Oversold (green shaded) range and turn up, and major sells when all three reach the Overbought (red shaded) range and turn down. The fast line's quicker reversals and exaggerated alternations on smaller price moves makes it more fit for scalping. Notice the fast and medium lines tend to snap back toward the slow line like stretched rubber bands.
As is particularly apparent in the slow line, the nifty mathematics of the compositing process reconstruct the topology (peaks and valleys) of the underlying price curve in a smoothly distorted "cartoon" form that has a very useful property: the composite lines are confined to +-100% Extreme Overbought/sold oscillatory ranges. (By definition, only extremely rare "parabolic" moves can push all 3 composites beyond +-100%). If we knew that price would always stay confined to a certain range, trading would be much easier, no? Always buy the bottom of the range and sell the top!
How it works
To understand what's behind this nifty property, consider the mathematics of LazyBear's WaveTrend port .
The formula is fairly simple as indicators go yet statistically fundamental in a way that suggests it should have been the grandfather of all market stochastic oscillators. It's just a running average of the ratio:
(price's current deviation from it's mean)
-----------------------------------------------------------
(running average of absolute |price deviation from the mean| )
In formal statistics notation this is written:
E{ (X - E{X}) / E{|X-E{X}|} }
Where X is the price random variable and E{} the averaging or Expectation operator, implemented in this oscillator as exponential moving averages.
Conceptually, the denominator measures and normalizes by the typical size of recent price moves. This normalization process is what stretches or compresses the local price movements such that the whole composite curve can stay within the oscillatory range.
Attributes
The default fast=.6, medium=1, slow=1.4 compositing factors give each line visually distinct behavior, but can be tweaked to emphasize different oscillator "speeds".
Particular lines can be disabled by setting their line width to 0.
Pivot Boss 4 EMA Summary:
Creates one indicator with four exponential moving averages based off the central pivot point
which assists you in trading pure price action using floor pivots.
This also helps you to avoid getting chopped up during price confluence.
How to use:
When T-Line cross Green Short EMA it can be used for scalping.
When Short EMA pulls back to Medium EMA you can buy more or sell more
without having to exit your position prematurely before trend direction changes.
This can also be used as position entry points to make sure you are getting the best possible price.
When T-Line, Short EMA and Medium EMA cross over Long EMA you go long or short.
