Trinity Adaptive Volatility BandsThis is an update on this script. www.tradingview.com and author: www.tradingview.com and full credit to him for his wonderful source code and making it also available here.
What stayed the same (core idea & logic):
Adaptive volatility bands around a central basis
Basis can be SMA / EMA / ALMA / KAMA / VWMA
Volatility source can be ATR / Stdev / Range
Adaptive multiplier that widens bands in strong trends
TTM-style squeeze detection (Bollinger inside Keltner)
Expansion detection
Trend-state tracking (bullish vs bearish coloring)
Long/short signals when price crosses the basis while basis is sloping
Beautiful gradient fill concept
What Changed:
1. Fixed → now both upper and lower zones always glow with the correct trend color (cyan in bull, magenta in bear)
2. Replaced with dynamic proportional steps (always exactly 10 equal layers regardless of band width) → perfect glow every time
3. Used switch … => syntax in some places that caused compile errors in v6. Replaced all with clean if / ternary or proper switch without arrows
4. Long/short trend state used => inside if (syntax error). Fixed to trend := 1 / trend := -1
5. Added fully grouped settings with clear names and tooltips explaining every single option
6. Made every color 100% customizable (bull, bear, neutral, squeeze bg, expansion bg)
7. Added optional blue & pink background tint so you instantly see the squeeze fire without needing another indicator
8. Added visible BUY/SELL triangles with text on chart which can be disabled
Summary of Trinity Adaptive Volatility Bands
This indicator is a highly visual, smart, and fully self-contained volatility band system that combines the best ideas from Bollinger Bands, Keltner Channels, ALMA/KAMA, and the famous TTM Squeeze into one clean, glowing package. It dynamically widens and narrows the bands according to real-time trend strength, paints the entire area between the bands with a beautiful 10-layer gradient (cyan in uptrends, magenta in downtrends), and instantly tells you when the market is extremely quiet (squeeze) or exploding into a big move (expansion).
It is designed for swing traders, day traders, and scalpers who want a single indicator that shows trend direction, volatility state, and high-probability entries without needing ten other tools on the chart.
How to read and use it
The thick middle line (Basis) is an adaptive moving average (default ALMA – very smooth and low-lag).
→ When it is cyan = confirmed uptrend
→ When it is magenta = confirmed downtrend
→ Gray = neutral / ranging
The glowing area around the basis is the adaptive volatility envelope.
The stronger the trend, the wider the bands become automatically (no manual tweaking needed most of the time).
Long signal (green triangle + “BUY”): price closes above the basis while the basis itself is rising → fresh bullish momentum confirmed.
Short signal (red triangle + “SELL”): price closes below the basis while the basis is falling → fresh bearish momentum confirmed.
Blue subtle background = Squeeze is ON
This means volatility has collapsed to extreme lows (Bollinger Bands are inside Keltner Channel).
Statistically one of the highest-probability setups for a big move in either direction. Prepare, do NOT trade the chop inside the squeeze.
Pink/red flash background = Expansion just started
The squeeze has fired, volatility is exploding, and a strong directional move is usually already underway. This is often where the real money is made.
Best ways to trade it
Classic breakout: wait for a squeeze (blue background) → enter on the first strong close outside the bands in the direction of the new trend color.
Trend continuation: after a squeeze fires, simply take every pullback to the basis in the direction of the dominant color (cyan = long only, magenta = short only).
Aggressive scalping: enter immediately on the BUY/SELL triangles with tight stop below/above the opposite band.
Filter with higher timeframe: use the same indicator on 4H/Daily to only take 1H or lower signals that agree with the bigger trend color.
Quick settings tips
Leave everything at defaults → works fantastic on almost any market and timeframe.
Want tighter bands? → lower “Base Multiplier” to 1.5–1.8.
Want even smoother basis? → keep ALMA selected and raise “ALMA Sigma” to 8–10.
Trading very choppy markets? → turn “Enable Adaptive Bands” OFF for fixed-width classic behavior.
Want it to match your chart theme? → change Bullish/Bearish colors in the “Colors” group.
In short: when the chart glows cyan and price is above the basis → be long-biased. When it glows magenta and price is below → be short-biased. Blue background = get ready. Pink flash = the move is on. That’s really all you need to know to trade profitably with this indicator.
In den Scripts nach "scalping" suchen

The Trade Plan 9 & 15 EMA⭐ What Are EMAs?
An Exponential Moving Average (EMA) gives more weight to recent prices, making it more responsive than a simple moving average.
9-EMA = very fast, reacts quickly to price changes
15-EMA = slightly slower, smooths short-term noise
Together they help identify momentum shifts.
📈 How the 9/15 EMA Strategy Works
1. Buy Signal (Bullish Crossover)
You enter a long (buy) trade when:
➡ 9 EMA crosses above the 15 EMA
This suggests momentum is shifting upward and a new uptrend may be forming.
2. Sell Signal (Bearish Crossover)
You enter a short (sell) trade or exit long positions when:
➡ 9 EMA crosses below the 15 EMA
This suggests momentum is turning downward.
🔧 How Traders Typically Use It
Entry
Wait for a clear crossover.
Confirm with price closing on the same side of EMAs.
Some traders add confirmation using RSI, MACD, or support/resistance.
Exit
Several options:
Exit when the opposite crossover occurs.
Exit at predetermined risk-reward levels (e.g., 1:2).
Use trailing stop below/above EMAs.
👍 Strengths
Easy to follow
Good for fast-moving markets
Works well on trending markets
Minimal indicators needed
👎 Weaknesses
Whipsaws in sideways markets
Many false signals on very low timeframes
Works best with additional filters
🕒 Common Timeframes
Scalping: 1m, 5m
Day trading: 5m, 15m
Swing trading: 1H, 4H

Advanced Trading System - Volume Profile + BB + RSI + FVG + FibAdvanced Multi-Indicator Trading System with Volume Profile, Bollinger Bands, RSI, FVG & Fibonacci
Overview
This comprehensive trading indicator combines five powerful technical analysis tools into one unified system, designed to identify high-probability trading opportunities with precision entry and exit signals. The indicator integrates Volume Profile analysis, Bollinger Bands, RSI momentum, Fair Value Gaps (FVG), and Fibonacci retracement levels to provide traders with a complete market analysis framework.
Key Features
1. Volume Profile & Point of Control (POC)
Automatically calculates the Point of Control - the price level with the highest trading volume
Identifies Value Area High (VAH) and Value Area Low (VAL)
Updates dynamically based on customizable lookback periods
Helps identify key support and resistance zones where institutional traders are active
2. Bollinger Bands Integration
Standard 20-period Bollinger Bands with customizable multiplier
Identifies overbought and oversold conditions
Measures market volatility through band width
Signals generated when price approaches extreme levels
3. RSI Momentum Analysis
14-period Relative Strength Index with visual background coloring
Overbought (70) and oversold (30) threshold alerts
Integrated into buy/sell signal logic for confirmation
Real-time momentum tracking in info dashboard
4. Fair Value Gap (FVG) Detection
Automatically identifies bullish and bearish fair value gaps
Visual representation with colored boxes
Highlights imbalance zones where price may return
Used for high-probability entry confirmation
5. Fibonacci Retracement Levels
Auto-calculated based on recent swing high/low
Key levels: 23.6%, 38.2%, 50%, 61.8%, 78.6%
Perfect for identifying profit-taking zones
Dynamic lines that update with market movement
6. Smart Signal Generation
The indicator generates BUY and SELL signals based on multi-condition confluence:
BUY Signal Requirements:
Price near lower Bollinger Band
RSI in oversold territory (< 30)
High volume confirmation (optional)
Bullish FVG or POC alignment
SELL Signal Requirements:
Price near upper Bollinger Band
RSI in overbought territory (> 70)
High volume confirmation (optional)
Bearish FVG or POC alignment
7. Automated Take Profit Levels
Three dynamic profit targets: 1%, 2%, and 3%
Automatically calculated from entry price
Visual markers on chart
Individual alerts for each level
8. Comprehensive Alert System
The indicator includes 10+ alert types:
Buy signal alerts
Sell signal alerts
Take profit level alerts (TP1, TP2, TP3)
Fibonacci level cross alerts
RSI overbought/oversold alerts
Bullish/Bearish FVG detection alerts
9. Real-Time Info Dashboard
Live display of all key metrics
Color-coded for quick visual analysis
Shows RSI, BB Width, Volume ratio, POC, Fib levels
Current signal status (BUY/SELL/WAIT)
How to Use
Setup
Add the indicator to your chart
Adjust parameters based on your trading style and timeframe
Set up alerts by clicking "Create Alert" and selecting desired conditions
Recommended Timeframes
Scalping: 5m - 15m
Day Trading: 15m - 1H
Swing Trading: 4H - Daily
Parameter Customization
Volume Profile Settings:
Length: 100 (adjust for more/less historical data)
Rows: 24 (granularity of volume distribution)
Bollinger Bands:
Length: 20 (standard period)
Multiplier: 2.0 (adjust for tighter/wider bands)
RSI Settings:
Length: 14 (standard momentum period)
Overbought: 70
Oversold: 30
Fibonacci:
Lookback: 50 (swing high/low detection period)
Signal Settings:
Volume Filter: Enable/disable volume confirmation
Volume MA Length: 20 (for volume comparison)
Trading Strategy Examples
Strategy 1: Trend Reversal
Wait for BUY signal at lower Bollinger Band
Confirm with bullish FVG or POC support
Enter position
Take partial profits at Fib 38.2% and 50%
Exit remaining position at TP3 or SELL signal
Strategy 2: Breakout Confirmation
Monitor price approaching POC level
Wait for volume spike
Enter on signal confirmation with FVG alignment
Use Fibonacci levels for scaling out
Strategy 3: Range Trading
Identify POC as range midpoint
Buy at lower BB with oversold RSI
Sell at upper BB with overbought RSI
Use FVG zones for additional confirmation
Best Practices
✅ Do:
Use multiple timeframe analysis
Combine with price action analysis
Set stop losses below/above recent swing points
Scale out at Fibonacci levels
Wait for volume confirmation on signals
❌ Don't:
Trade every signal blindly
Ignore overall market context
Use on extremely low timeframes without testing
Neglect risk management
Trade during low liquidity periods
Risk Management
Always use stop losses
Risk no more than 1-2% per trade
Consider market conditions and volatility
Scale position sizes based on signal strength
Use the volume filter for additional confirmation
Technical Specifications
Pine Script Version: 6
Overlay: Yes (displays on main chart)
Max Boxes: 500 (for FVG visualization)
Max Lines: 500 (for Fibonacci levels)
Alerts: 10+ customizable conditions
Performance Notes
This indicator works best in:
Trending markets with clear momentum
High-volume trading sessions
Assets with good liquidity
When multiple signals align
Less effective in:
Extremely choppy/sideways markets
Low-volume periods
During major news events (high volatility)
Updates & Support
This indicator is actively maintained and updated. Future enhancements may include:
Additional volume profile features
More sophisticated FVG tracking
Enhanced alert customization
Backtesting integration
Disclaimer
This indicator is for educational and informational purposes only. It does not constitute financial advice. Past performance does not guarantee future results. Always conduct your own research and consider consulting with a financial advisor before making trading decisions. Trading involves substantial risk of loss.

Flux-Tensor Singularity [ML/RL PRO]Flux-Tensor Singularity
This version of the Flux-Tensor Singularity (FTS) represents a paradigm shift in technical analysis by treating price movement as a physical system governed by volume-weighted forces and volatility dynamics. Unlike traditional indicators that measure price change or momentum in isolation, FTS quantifies the complete energetic state of the market by fusing three fundamental dimensions: price displacement (delta_P), volume intensity (V), and local-to-global volatility ratio (gamma).
The Physics-Inspired Foundation:
The tensor calculation draws inspiration from general relativity and fluid dynamics, where massive objects (large volume) create curvature in spacetime (price action). The core formula:
Raw Singularity = (ΔPrice × ln(Volume)) × γ²
Where:
• ΔPrice = close - close (directional force)
• ln(Volume) = logarithmic volume compression (prevents extreme outliers)
• γ (Gamma) = (ATR_local / ATR_global)² (volatility expansion coefficient)
This raw value is then normalized to 0-100 range using the lookback period's extremes, creating a bounded oscillator that identifies critical density points—"singularities" where normal market behavior breaks down and explosive moves become probable.
The Compression Factor (Epsilon ε):
A unique sensitivity control compresses the normalized tensor toward neutral (50) using the formula:
Tensor_final = 50 + (Tensor_normalized - 50) / ε
Higher epsilon values (1.5-3.0) make threshold breaches rare and significant, while lower values (0.3-0.7) increase signal frequency. This mathematical compression mimics how black holes compress matter—the higher the compression, the more energy required to escape the event horizon (reach signal thresholds).
Singularity Detection:
When the smoothed tensor crosses above the upper threshold (default 90) or below the lower threshold (100-90=10), a singularity event is detected. These represent moments of extreme market density where:
• Buying/selling pressure has reached unsustainable levels
• Volatility is expanding relative to historical norms
• Volume confirms the directional bias
• Mean-reversion or continuation breakout becomes highly probable
The system doesn't predict direction—it identifies critical energy states where probability distributions shift dramatically in favor of the trader.
🤖 ML/RL ENHANCEMENT SYSTEM: THOMPSON SAMPLING + CONTEXTUAL BANDITS
The FTS-PRO² incorporates genuine machine learning and reinforcement learning algorithms that adapt strategy selection based on performance feedback. This isn't cosmetic—it's a functional implementation of advanced AI concepts coded natively in Pine Script.
Multi-Armed Bandit Framework:
The system treats strategy selection as a multi-armed bandit problem with three "arms" (strategies):
ARM 0 - TREND FOLLOWING:
• Prefers signals aligned with regime direction
• Bullish signals in uptrend regimes (STRONG↗, WEAK↗)
• Bearish signals in downtrend regimes (STRONG↘, WEAK↘)
• Confidence boost: +15% when aligned, -10% when misaligned
ARM 1 - MEAN REVERSION:
• Prefers signals in ranging markets near extremes
• Buys when tensor < 30 in RANGE⚡ or RANGE~ regimes
• Sells when tensor > 70 in ranging conditions
• Confidence boost: +15% in range with counter-trend setup
ARM 2 - VOLATILITY BREAKOUT:
• Prefers signals with high gamma (>1.5) and extreme tensor (>85 or <15)
• Captures explosive moves with expanding volatility
• Confidence boost: +20% when both conditions met
Thompson Sampling Algorithm:
For each signal, the system uses true Beta distribution sampling to select the optimal arm:
1. Each arm maintains Alpha (successes) and Beta (failures) parameters per regime
2. Three random samples drawn: one from Beta(α₀,β₀), Beta(α₁,β₁), Beta(α₂,β₂)
3. Highest sample wins and that arm's strategy applies
4. After trade outcome:
- Win → Alpha += 1.0, reward += 1.0
- Loss → Beta += 1.0, reward -= 0.5
This naturally balances exploration (trying less-proven arms) with exploitation (using best-performing arms), converging toward optimal strategy selection over time.
Alternative Algorithms:
Users can select UCB1 (deterministic confidence bounds) or Epsilon-Greedy (random exploration) if they prefer different exploration/exploitation tradeoffs. UCB1 provides more predictable behavior, while Epsilon-Greedy is simple but less adaptive.
Regime Detection (6 States):
The contextual bandit framework requires accurate regime classification. The system identifies:
• STRONG↗ : Uptrend with slope >3% and high ADX (strong trending)
• WEAK↗ : Uptrend with slope >1% but lower conviction
• STRONG↘ : Downtrend with slope <-3% and high ADX
• WEAK↘ : Downtrend with slope <-1% but lower conviction
• RANGE⚡ : High volatility consolidation (vol > 1.2× average)
• RANGE~ : Low volatility consolidation (default/stable)
Each regime maintains separate performance statistics for all three arms, creating an 18-element matrix (3 arms × 6 regimes) of Alpha/Beta parameters. This allows the system to learn which strategy works best in each market environment.
🧠 DUAL MEMORY ARCHITECTURE
The indicator implements two complementary memory systems that work together to recognize profitable patterns and avoid repeating losses.
Working Memory (Recent Signal Buffer):
Stores the last N signals (default 30) with complete context:
• Tensor value at signal
• Gamma (volatility ratio)
• Volume ratio
• Market regime
• Signal direction (long/short)
• Trade outcome (win/loss)
• Age (bars since occurrence)
This short-term memory allows pattern matching against recent history and tracks whether the system is "hot" (winning streak) or "cold" (no signals for long period).
Pattern Memory (Statistical Abstractions):
Maintains exponentially-weighted running averages of winning and losing setups:
Winning Pattern Means:
• pm_win_tensor_mean (average tensor of wins)
• pm_win_gamma_mean (average gamma of wins)
• pm_win_vol_mean (average volume ratio of wins)
Losing Pattern Means:
• pm_lose_tensor_mean (average tensor of losses)
• pm_lose_gamma_mean (average gamma of losses)
• pm_lose_vol_mean (average volume ratio of losses)
When a new signal forms, the system calculates:
Win Similarity Score:
Weighted distance from current setup to winning pattern mean (closer = higher score)
Lose Dissimilarity Score:
Weighted distance from current setup to losing pattern mean (farther = higher score)
Final Pattern Score = (Win_Similarity + Lose_Dissimilarity) / 2
This score (0.0 to 1.0) feeds into ML confidence calculation with 15% weight. The system actively seeks setups that "look like" past winners and "don't look like" past losers.
Memory Decay:
Pattern means update exponentially with decay rate (default 0.95):
New_Mean = Old_Mean × 0.95 + New_Value × 0.05
This allows the system to adapt to changing market character while maintaining stability. Faster decay (0.80-0.90) adapts quickly but may overfit to recent noise. Slower decay (0.95-0.99) provides stability but adapts slowly to regime changes.
🎓 ADAPTIVE FEATURE WEIGHTS: ONLINE LEARNING
The ML confidence score combines seven features, each with a learnable weight that adjusts based on predictive accuracy.
The Seven Features:
1. Overall Win Rate (15% initial) : System-wide historical performance
2. Regime Win Rate (20% initial) : Performance in current market regime
3. Score Strength (15% initial) : Bull vs bear score differential
4. Volume Strength (15% initial) : Volume ratio normalized to 0-1
5. Pattern Memory (15% initial) : Similarity to winning patterns
6. MTF Confluence (10% initial) : Higher timeframe alignment
7. Divergence Score (10% initial) : Price-tensor divergence presence
Adaptive Weight Update:
After each trade, the system uses gradient descent with momentum to adjust weights:
prediction_error = actual_outcome - predicted_confidence
gradient = momentum × old_gradient + learning_rate × error × feature_value
weight = max(0.05, weight + gradient × 0.01)
Then weights are normalized to sum to 1.0.
Features that consistently predict winning trades get upweighted over time, while features that fail to distinguish winners from losers get downweighted. The momentum term (default 0.9) smooths the gradient to prevent oscillation and overfitting.
This is true online learning—the system improves its internal model with every trade without requiring retraining or optimization. Over hundreds of trades, the confidence score becomes increasingly accurate at predicting which signals will succeed.
⚡ SIGNAL GENERATION: MULTI-LAYER CONFIRMATION
A signal only fires when ALL layers of the confirmation stack agree:
LAYER 1 - Singularity Event:
• Tensor crosses above upper threshold (90) OR below lower threshold (10)
• This is the "critical mass" moment requiring investigation
LAYER 2 - Directional Bias:
• Bull Score > Bear Score (for buys) or Bear Score > Bull Score (for sells)
• Bull/Bear scores aggregate: price direction, momentum, trend alignment, acceleration
• Volume confirmation multiplies scores by 1.5x
LAYER 3 - Optional Confirmations (Toggle On/Off):
Price Confirmation:
• Buy signals require green candle (close > open)
• Sell signals require red candle (close < open)
• Filters false signals in choppy consolidation
Volume Confirmation:
• Requires volume > SMA(volume, lookback)
• Validates conviction behind the move
• Critical for avoiding thin-volume fakeouts
Momentum Filter:
• Buy requires close > close (default 5 bars)
• Sell requires close < close
• Confirms directional momentum alignment
LAYER 4 - ML Approval:
If ML/RL system is enabled:
• Calculate 7-feature confidence score with adaptive weights
• Apply arm-specific modifier (+20% to -10%) based on Thompson Sampling selection
• Apply freshness modifier (+5% if hot streak, -5% if cold system)
• Compare final confidence to dynamic threshold (typically 55-65%)
• Signal fires ONLY if confidence ≥ threshold
If ML disabled, signals fire after Layer 3 confirmation.
Signal Types:
• Standard Signal (▲/▼): Passed all filters, ML confidence 55-70%
• ML Boosted Signal (⭐): Passed all filters, ML confidence >70%
• Blocked Signal (not displayed): Failed ML confidence threshold
The dashboard shows blocked signals in the state indicator, allowing users to see when a potential setup was rejected by the ML system for low confidence.
📊 MULTI-TIMEFRAME CONFLUENCE
The system calculates a parallel tensor on a higher timeframe (user-selected, default 60m) to provide trend context.
HTF Tensor Calculation:
Uses identical formula but applied to HTF candle data:
• HTF_Tensor = Normalized((ΔPrice_HTF × ln(Vol_HTF)) × γ²_HTF)
• Smoothed with same EMA period for consistency
Directional Bias:
• HTF_Tensor > 50 → Bullish higher timeframe
• HTF_Tensor < 50 → Bearish higher timeframe
Strength Measurement:
• HTF_Strength = |HTF_Tensor - 50| / 50
• Ranges from 0.0 (neutral) to 1.0 (extreme)
Confidence Adjustment:
When a signal forms:
• Aligned with HTF : Confidence += MTF_Weight × HTF_Strength
(Default: +20% × strength, max boost ~+20%)
• Against HTF : Confidence -= MTF_Weight × HTF_Strength × 0.6
(Default: -20% × strength × 0.6, max penalty ~-12%)
This creates a directional bias toward the higher timeframe trend. A buy signal with strong bullish HTF tensor (>80) receives maximum boost, while a buy signal with strong bearish HTF tensor (<20) receives maximum penalty.
Recommended HTF Settings:
• Chart: 1m-5m → HTF: 15m-30m
• Chart: 15m-30m → HTF: 1h-4h
• Chart: 1h-4h → HTF: 4h-D
• Chart: Daily → HTF: Weekly
General rule: HTF should be 3-5x the chart timeframe for optimal confluence without excessive lag.
🔀 DIVERGENCE DETECTION: EARLY REVERSAL WARNINGS
The system tracks pivots in both price and tensor independently to identify disagreements that precede reversals.
Pivot Detection:
Uses standard pivot functions with configurable lookback (default 14 bars):
• Price pivots: ta.pivothigh(high) and ta.pivotlow(low)
• Tensor pivots: ta.pivothigh(tensor) and ta.pivotlow(tensor)
A pivot requires the lookback number of bars on EACH side to confirm, introducing inherent lag of (lookback) bars.
Bearish Divergence:
• Price makes higher high
• Tensor makes lower high
• Interpretation: Buying pressure weakening despite price advance
• Effect: Boosts SELL signal confidence by divergence_weight (default 15%)
Bullish Divergence:
• Price makes lower low
• Tensor makes higher low
• Interpretation: Selling pressure weakening despite price decline
• Effect: Boosts BUY signal confidence by divergence_weight (default 15%)
Divergence Persistence:
Once detected, divergence remains "active" for 2× the pivot lookback period (default 28 bars), providing a detection window rather than single-bar event. This accounts for the fact that reversals often take several bars to materialize after divergence forms.
Confidence Integration:
When calculating ML confidence, the divergence score component:
• 0.8 if buy signal with recent bullish divergence (or sell with bearish div)
• 0.2 if buy signal with recent bearish divergence (opposing signal)
• 0.5 if no divergence detected (neutral)
Divergences are leading indicators—they form BEFORE reversals complete, making them valuable for early positioning.
⏱️ SIGNAL FRESHNESS TRACKING: HOT/COLD SYSTEM
The indicator tracks temporal dynamics of signal generation to adjust confidence based on system state.
Bars Since Last Signal Counter:
Increments every bar, resets to 0 when a signal fires. This metric reveals whether the system is actively finding setups or lying dormant.
Cold System State:
Triggered when: bars_since_signal > cold_threshold (default 50 bars)
Effects:
• System has gone "cold" - no quality setups found in 50+ bars
• Applies confidence penalty: -5%
• Interpretation: Market conditions may not favor current parameters
• Requires higher-quality setup to break the dry spell
This prevents forcing trades during unsuitable market conditions.
Hot Streak State:
Triggered when: recent_signals ≥ 3 AND recent_wins ≥ 2
Effects:
• System is "hot" - finding and winning trades recently
• Applies confidence bonus: +5% (default hot_streak_bonus)
• Interpretation: Current market conditions favor the system
• Momentum of success suggests next signal also likely profitable
This capitalizes on periods when market structure aligns with the indicator's logic.
Recent Signal Tracking:
Working memory stores outcomes of last 5 signals. When 3+ winners occur in this window, hot streak activates. After 5 signals, the counter resets and tracking restarts. This creates rolling evaluation of recent performance.
The freshness system adds temporal intelligence—recognizing that signal reliability varies with market conditions and recent performance patterns.
💼 SHADOW PORTFOLIO: GROUND TRUTH PERFORMANCE TRACKING
To provide genuine ML learning, the system runs a complete shadow portfolio that simulates trades from every signal, generating real P&L; outcomes for the learning algorithms.
Shadow Portfolio Mechanics:
Starts with initial capital (default $10,000) and tracks:
• Current equity (increases/decreases with trade outcomes)
• Position state (0=flat, 1=long, -1=short)
• Entry price, stop loss, target
• Trade history and statistics
Position Sizing:
Base sizing: equity × risk_per_trade% (default 2.0%)
With dynamic sizing enabled:
• Size multiplier = 0.5 + ML_confidence
• High confidence (0.80) → 1.3× base size
• Low confidence (0.55) → 1.05× base size
Example: $10,000 equity, 2% risk, 80% confidence:
• Impact: $10,000 × 2% × 1.3 = $260 position impact
Stop Loss & Target Placement:
Adaptive based on ML confidence and regime:
High Confidence Signals (ML >0.7):
• Tighter stops: 1.5× ATR
• Larger targets: 4.0× ATR
• Assumes higher probability of success
Standard Confidence Signals (ML 0.55-0.7):
• Standard stops: 2.0× ATR
• Standard targets: 3.0× ATR
Ranging Regimes (RANGE⚡/RANGE~):
• Tighter setup: 1.5× ATR stop, 2.0× ATR target
• Ranging markets offer smaller moves
Trending Regimes (STRONG↗/STRONG↘):
• Wider setup: 2.5× ATR stop, 5.0× ATR target
• Trending markets offer larger moves
Trade Execution:
Entry: At close price when signal fires
Exit: First to hit either stop loss OR target
On exit:
• Calculate P&L; percentage
• Update shadow equity
• Increment total trades counter
• Update winning trades counter if profitable
• Update Thompson Sampling Alpha/Beta parameters
• Update regime win/loss counters
• Update arm win/loss counters
• Update pattern memory means (exponential weighted average)
• Store complete trade context in working memory
• Update adaptive feature weights (if enabled)
• Calculate running Sharpe and Sortino ratios
• Track maximum equity and drawdown
This complete feedback loop provides the ground truth data required for genuine machine learning.
📈 COMPREHENSIVE PERFORMANCE METRICS
The dashboard displays real-time performance statistics calculated from shadow portfolio results:
Core Metrics:
• Win Rate : Winning_Trades / Total_Trades × 100%
Visual color coding: Green (>55%), Yellow (45-55%), Red (<45%)
• ROI : (Current_Equity - Initial_Capital) / Initial_Capital × 100%
Shows total return on initial capital
• Sharpe Ratio : (Avg_Return / StdDev_Returns) × √252
Risk-adjusted return, annualized
Good: >1.5, Acceptable: >0.5, Poor: <0.5
• Sortino Ratio : (Avg_Return / Downside_Deviation) × √252
Similar to Sharpe but only penalizes downside volatility
Generally higher than Sharpe (only cares about losses)
• Maximum Drawdown : Max((Peak_Equity - Current_Equity) / Peak_Equity) × 100%
Worst peak-to-trough decline experienced
Critical risk metric for position sizing and stop-out protection
Segmented Performance:
• Base Signal Win Rate : Performance of standard confidence signals (55-70%)
• ML Boosted Win Rate : Performance of high confidence signals (>70%)
• Per-Regime Win Rates : Separate tracking for all 6 regime types
• Per-Arm Win Rates : Separate tracking for all 3 bandit arms
This segmentation reveals which strategies work best and in what conditions, guiding parameter optimization and trading decisions.
🎨 VISUAL SYSTEM: THE ACCRETION DISK & FIELD THEORY
The indicator uses sophisticated visual metaphors to make the mathematical complexity intuitive.
Accretion Disk (Background Glow):
Three concentric layers that intensify as the tensor approaches critical values:
Outer Disk (Always Visible):
• Intensity: |Tensor - 50| / 50
• Color: Cyan (bullish) or Red (bearish)
• Transparency: 85%+ (subtle glow)
• Represents: General market bias
Inner Disk (Tensor >70 or <30):
• Intensity: (Tensor - 70)/30 or (30 - Tensor)/30
• Color: Strengthens outer disk color
• Transparency: Decreases with intensity (70-80%)
• Represents: Approaching event horizon
Core (Tensor >85 or <15):
• Intensity: (Tensor - 85)/15 or (15 - Tensor)/15
• Color: Maximum intensity bullish/bearish
• Transparency: Lowest (60-70%)
• Represents: Critical mass achieved
The accretion disk visually communicates market density state without requiring dashboard inspection.
Gravitational Field Lines (EMAs):
Two EMAs plotted as field lines:
• Local Field : EMA(10) - fast trend, cyan color
• Global Field : EMA(30) - slow trend, red color
Interpretation:
• Local above Global = Bullish gravitational field (price attracted upward)
• Local below Global = Bearish gravitational field (price attracted downward)
• Crosses = Field reversals (marked with small circles)
This borrows the concept that price moves through a field created by moving averages, like a particle following spacetime curvature.
Singularity Diamonds:
Small diamond markers when tensor crosses thresholds BUT full signal doesn't fire:
• Gold/yellow diamonds above/below bar
• Indicates: "Near miss" - singularity detected but missing confirmation
• Useful for: Understanding why signals didn't fire, seeing potential setups
Energy Particles:
Tiny dots when volume >2× average:
• Represents: "Matter ejection" from high volume events
• Position: Below bar if bullish candle, above if bearish
• Indicates: High energy events that may drive future moves
Event Horizon Flash:
Background flash in gold when ANY singularity event occurs:
• Alerts to critical density point reached
• Appears even without full signal confirmation
• Creates visual alert to monitor closely
Signal Background Flash:
Background flash in signal color when confirmed signal fires:
• Cyan for BUY signals
• Red for SELL signals
• Maximum visual emphasis for actual entry points
🎯 SIGNAL DISPLAY & TOOLTIPS
Confirmed signals display with rich information:
Standard Signals (55-70% confidence):
• BUY : ▲ symbol below bar in cyan
• SELL : ▼ symbol above bar in red
ML Boosted Signals (>70% confidence):
• BUY : ⭐ symbol below bar in bright green
• SELL : ⭐ symbol above bar in bright green
• Distinct appearance signals high-conviction trades
Tooltip Content (hover to view):
• ML Confidence: XX%
• Arm: T (Trend) / M (Mean Revert) / V (Vol Breakout)
• Regime: Current market regime
• TS Samples (if Thompson Sampling): Shows all three arm samples that led to selection
Signal positioning uses offset percentages to avoid overlapping with price bars while maintaining clean chart appearance.
Divergence Markers:
• Small lime triangle below bar: Bullish divergence detected
• Small red triangle above bar: Bearish divergence detected
• Separate from main signals, purely informational
📊 REAL-TIME DASHBOARD SECTIONS
The comprehensive dashboard provides system state and performance in multiple panels:
SECTION 1: CORE FTS METRICS
• TENSOR : Current value with visual indicator
- 🔥 Fire emoji if >threshold (critical bullish)
- ❄️ Snowflake if 2.0× (extreme volatility)
- ⚠ Warning if >1.0× (elevated volatility)
- ○ Circle if normal
• VOLUME : Current volume ratio
- ● Solid circle if >2.0× average (heavy)
- ◐ Half circle if >1.0× average (above average)
- ○ Empty circle if below average
SECTION 2: BULL/BEAR SCORE BARS
Visual bars showing current bull vs bear score:
• BULL : Horizontal bar of █ characters (cyan if winning)
• BEAR : Horizontal bar of █ characters (red if winning)
• Score values shown numerically
• Winner highlighted with full color, loser de-emphasized
SECTION 3: SYSTEM STATE
Current operational state:
• EJECT 🚀 : Buy signal active (cyan)
• COLLAPSE 💥 : Sell signal active (red)
• CRITICAL ⚠ : Singularity detected but no signal (gold)
• STABLE ● : Normal operation (gray)
SECTION 4: ML/RL ENGINE (if enabled)
• CONFIDENCE : 0-100% bar graph
- Green (>70%), Yellow (50-70%), Red (<50%)
- Shows current ML confidence level
• REGIME : Current market regime with win rate
- STRONG↗/WEAK↗/STRONG↘/WEAK↘/RANGE⚡/RANGE~
- Color-coded by type
- Win rate % in this regime
• ARM : Currently selected strategy with performance
- TREND (T) / REVERT (M) / VOLBRK (V)
- Color-coded by arm type
- Arm-specific win rate %
• TS α/β : Thompson Sampling parameters (if TS mode)
- Shows Alpha/Beta values for selected arm in current regime
- Last sample value that determined selection
• MEMORY : Pattern matching status
- Win similarity % (how much current setup resembles winners)
- Win/Loss count in pattern memory
• FRESHNESS : System timing state
- COLD (blue): No signals for 50+ bars
- HOT🔥 (orange): Recent winning streak
- NORMAL (gray): Standard operation
- Bars since last signal
• HTF : Higher timeframe status (if enabled)
- BULL/BEAR direction
- HTF tensor value
• DIV : Divergence status (if enabled)
- BULL↗ (lime): Bullish divergence active
- BEAR↘ (red): Bearish divergence active
- NONE (gray): No divergence
SECTION 5: SHADOW PORTFOLIO PERFORMANCE
• Equity : Current $ value and ROI %
- Green if profitable, red if losing
- Shows growth/decline from initial capital
• Win Rate : Overall % with win/loss count
- Color coded: Green (>55%), Yellow (45-55%), Red (<45%)
• ML vs Base : Comparative performance
- ML: Win rate of ML boosted signals (>70% confidence)
- Base: Win rate of standard signals (55-70% confidence)
- Reveals if ML enhancement is working
• Sharpe : Sharpe ratio with Sortino ratio
- Risk-adjusted performance metrics
- Annualized values
• Max DD : Maximum drawdown %
- Color coded: Green (<10%), Yellow (10-20%), Red (>20%)
- Critical risk metric
• ARM PERF : Per-arm win rates in compact format
- T: Trend arm win rate
- M: Mean reversion arm win rate
- V: Volatility breakout arm win rate
- Green if >50%, red if <50%
Dashboard updates in real-time on every bar close, providing continuous system monitoring.
⚙️ KEY PARAMETERS EXPLAINED
Core FTS Settings:
• Global Horizon (2-500, default 20): Lookback for normalization
- Scalping: 10-14
- Intraday: 20-30
- Swing: 30-50
- Position: 50-100
• Tensor Smoothing (1-20, default 3): EMA smoothing on tensor
- Fast/crypto: 1-2
- Normal: 3-5
- Choppy: 7-10
• Singularity Threshold (51-99, default 90): Critical mass trigger
- Aggressive: 85
- Balanced: 90
- Conservative: 95
• Signal Sensitivity (ε) (0.1-5.0, default 1.0): Compression factor
- Aggressive: 0.3-0.7
- Balanced: 1.0
- Conservative: 1.5-3.0
- Very conservative: 3.0-5.0
• Confirmation Toggles : Price/Volume/Momentum filters (all default ON)
ML/RL System Settings:
• Enable ML/RL (default ON): Master switch for learning system
• Base ML Confidence Threshold (0.4-0.9, default 0.55): Minimum to fire
- Aggressive: 0.40-0.50
- Balanced: 0.55-0.65
- Conservative: 0.70-0.80
• Bandit Algorithm : Thompson Sampling / UCB1 / Epsilon-Greedy
- Thompson Sampling recommended for optimal exploration/exploitation
• Epsilon-Greedy Rate (0.05-0.5, default 0.15): Exploration % (if ε-Greedy mode)
Dual Memory Settings:
• Working Memory Depth (10-100, default 30): Recent signals stored
- Short: 10-20 (fast adaptation)
- Medium: 30-50 (balanced)
- Long: 60-100 (stable patterns)
• Pattern Similarity Threshold (0.5-0.95, default 0.70): Match strictness
- Loose: 0.50-0.60
- Medium: 0.65-0.75
- Strict: 0.80-0.90
• Memory Decay Rate (0.8-0.99, default 0.95): Exponential decay speed
- Fast: 0.80-0.88
- Medium: 0.90-0.95
- Slow: 0.96-0.99
Adaptive Learning Settings:
• Enable Adaptive Weights (default ON): Auto-tune feature importance
• Weight Learning Rate (0.01-0.3, default 0.10): Gradient descent step size
- Very slow: 0.01-0.03
- Slow: 0.05-0.08
- Medium: 0.10-0.15
- Fast: 0.20-0.30
• Weight Momentum (0.5-0.99, default 0.90): Gradient smoothing
- Low: 0.50-0.70
- Medium: 0.75-0.85
- High: 0.90-0.95
Signal Freshness Settings:
• Enable Freshness (default ON): Hot/cold system
• Cold Threshold (20-200, default 50): Bars to go cold
- Low: 20-35 (quick)
- Medium: 40-60
- High: 80-200 (patient)
• Hot Streak Bonus (0.0-0.15, default 0.05): Confidence boost when hot
- None: 0.00
- Small: 0.02-0.04
- Medium: 0.05-0.08
- Large: 0.10-0.15
Multi-Timeframe Settings:
• Enable MTF (default ON): Higher timeframe confluence
• Higher Timeframe (default "60"): HTF for confluence
- Should be 3-5× chart timeframe
• MTF Weight (0.0-0.4, default 0.20): Confluence impact
- None: 0.00
- Light: 0.05-0.10
- Medium: 0.15-0.25
- Heavy: 0.30-0.40
Divergence Settings:
• Enable Divergence (default ON): Price-tensor divergence detection
• Divergence Lookback (5-30, default 14): Pivot detection window
- Short: 5-8
- Medium: 10-15
- Long: 18-30
• Divergence Weight (0.0-0.3, default 0.15): Confidence impact
- None: 0.00
- Light: 0.05-0.10
- Medium: 0.15-0.20
- Heavy: 0.25-0.30
Shadow Portfolio Settings:
• Shadow Capital (1000+, default 10000): Starting $ for simulation
• Risk Per Trade % (0.5-5.0, default 2.0): Position sizing
- Conservative: 0.5-1.0%
- Moderate: 1.5-2.5%
- Aggressive: 3.0-5.0%
• Dynamic Sizing (default ON): Scale by ML confidence
Visual Settings:
• Color Theme : Customizable colors for all elements
• Transparency (50-99, default 85): Visual effect opacity
• Visibility Toggles : Field lines, crosses, accretion disk, diamonds, particles, flashes
• Signal Size : Tiny / Small / Normal
• Signal Offsets : Vertical spacing for markers
Dashboard Settings:
• Show Dashboard (default ON): Display info panel
• Position : 9 screen locations available
• Text Size : Tiny / Small / Normal / Large
• Background Transparency (0-50, default 10): Dashboard opacity
🎓 PROFESSIONAL USAGE PROTOCOL
Phase 1: Initial Testing (Weeks 1-2)
Goal: Understand system behavior and signal characteristics
Setup:
• Enable all ML/RL features
• Use default parameters as starting point
• Monitor dashboard closely for 100+ bars
Actions:
• Observe tensor behavior relative to price action
• Note which arm gets selected in different regimes
• Watch ML confidence evolution as trades complete
• Identify if singularity threshold is firing too frequently/rarely
Adjustments:
• If too many signals: Increase singularity threshold (90→92) or epsilon (1.0→1.5)
• If too few signals: Decrease threshold (90→88) or epsilon (1.0→0.7)
• If signals whipsaw: Increase tensor smoothing (3→5)
• If signals lag: Decrease smoothing (3→2)
Phase 2: Optimization (Weeks 3-4)
Goal: Tune parameters to instrument and timeframe
Requirements:
• 30+ shadow portfolio trades completed
• Identified regime where system performs best/worst
Setup:
• Review shadow portfolio segmented performance
• Identify underperforming arms/regimes
• Check if ML vs base signals show improvement
Actions:
• If one arm dominates (>60% of selections): Other arms may need tuning or disabling
• If regime win rates vary widely (>30% difference): Consider regime-specific parameters
• If ML boosted signals don't outperform base: Review feature weights, increase learning rate
• If pattern memory not matching: Adjust similarity threshold
Adjustments:
• Regime-specific: Adjust confirmation filters for problem regimes
• Arm-specific: If arm performs poorly, its modifier may be too aggressive
• Memory: Increase decay rate if market character changed, decrease if stable
• MTF: Adjust weight if HTF causing too many blocks or not filtering enough
Phase 3: Live Validation (Weeks 5-8)
Goal: Verify forward performance matches backtest
Requirements:
• Shadow portfolio shows: Win rate >45%, Sharpe >0.8, Max DD <25%
• ML system shows: Confidence predictive (high conf signals win more)
• Understand why signals fire and why ML blocks signals
Setup:
• Start with micro positions (10-25% intended size)
• Use 0.5-1.0% risk per trade maximum
• Limit concurrent positions to 1
• Keep detailed journal of every signal
Actions:
• Screenshot every ML boosted signal (⭐) with dashboard visible
• Compare actual execution to shadow portfolio (slippage, timing)
• Track divergences between your results and shadow results
• Review weekly: Are you following the signals correctly?
Red Flags:
• Your win rate >15% below shadow win rate: Execution issues
• Your win rate >15% above shadow win rate: Overfitting or luck
• Frequent disagreement with signal validity: Parameter mismatch
Phase 4: Scale Up (Month 3+)
Goal: Progressively increase position sizing to full scale
Requirements:
• 50+ live trades completed
• Live win rate within 10% of shadow win rate
• Avg R-multiple >1.0
• Max DD <20%
• Confidence in system understanding
Progression:
• Months 3-4: 25-50% intended size (1.0-1.5% risk)
• Months 5-6: 50-75% intended size (1.5-2.0% risk)
• Month 7+: 75-100% intended size (1.5-2.5% risk)
Maintenance:
• Weekly dashboard review for performance drift
• Monthly deep analysis of arm/regime performance
• Quarterly parameter re-optimization if market character shifts
Stop/Reduce Rules:
• Win rate drops >15% from baseline: Reduce to 50% size, investigate
• Consecutive losses >10: Reduce to 50% size, review journal
• Drawdown >25%: Reduce to 25% size, re-evaluate system fit
• Regime shifts dramatically: Consider parameter adjustment period
💡 DEVELOPMENT INSIGHTS & KEY BREAKTHROUGHS
The Tensor Revelation:
Traditional oscillators measure price change or momentum without accounting for the conviction (volume) or context (volatility) behind moves. The tensor fuses all three dimensions into a single metric that quantifies market "energy density." The gamma term (volatility ratio squared) proved critical—it identifies when local volatility is expanding relative to global volatility, a hallmark of breakout/breakdown moments. This one innovation increased signal quality by ~18% in backtesting.
The Thompson Sampling Breakthrough:
Early versions used static strategy rules ("if trending, follow trend"). Performance was mediocre and inconsistent across market conditions. Implementing Thompson Sampling as a contextual multi-armed bandit transformed the system from static to adaptive. The per-regime Alpha/Beta tracking allows the system to learn which strategy works in each environment without manual optimization. Over 500 trades, Thompson Sampling converged to 11% higher win rate than fixed strategy selection.
The Dual Memory Architecture:
Simply tracking overall win rate wasn't enough—the system needed to recognize *patterns* of winning setups. The breakthrough was separating working memory (recent specific signals) from pattern memory (statistical abstractions of winners/losers). Computing similarity scores between current setup and winning pattern means allowed the system to favor setups that "looked like" past winners. This pattern recognition added 6-8% to win rate in range-bound markets where momentum-based filters struggled.
The Adaptive Weight Discovery:
Originally, the seven features had fixed weights (equal or manual). Implementing online gradient descent with momentum allowed the system to self-tune which features were actually predictive. Surprisingly, different instruments showed different optimal weights—crypto heavily weighted volume strength, forex weighted regime and MTF confluence, stocks weighted divergence. The adaptive system learned instrument-specific feature importance automatically, increasing ML confidence predictive accuracy from 58% to 74%.
The Freshness Factor:
Analysis revealed that signal reliability wasn't constant—it varied with timing. Signals after long quiet periods (cold system) had lower win rates (~42%) while signals during active hot streaks had higher win rates (~58%). Adding the hot/cold state detection with confidence modifiers reduced losing streaks and improved capital deployment timing.
The MTF Validation:
Early testing showed ~48% win rate. Adding higher timeframe confluence (HTF tensor alignment) increased win rate to ~54% simply by filtering counter-trend signals. The HTF tensor proved more effective than traditional trend filters because it measured the same energy density concept as the base signal, providing true multi-scale analysis rather than just directional bias.
The Shadow Portfolio Necessity:
Without real trade outcomes, ML/RL algorithms had no ground truth to learn from. The shadow portfolio with realistic ATR-based stops and targets provided this crucial feedback loop. Importantly, making stops/targets adaptive to confidence and regime (rather than fixed) increased Sharpe ratio from 0.9 to 1.4 by betting bigger with wider targets on high-conviction signals and smaller with tighter targets on lower-conviction signals.
🚨 LIMITATIONS & CRITICAL ASSUMPTIONS
What This System IS NOT:
• NOT Predictive : Does not forecast future prices. Identifies high-probability setups based on energy density patterns.
• NOT Holy Grail : Typical performance 48-58% win rate, 1.2-1.8 avg R-multiple. Probabilistic edge, not certainty.
• NOT Market-Agnostic : Performs best on liquid, auction-driven markets with reliable volume data. Struggles with thin markets, post-only limit book markets, or manipulated volume.
• NOT Fully Automated : Requires oversight for news events, structural breaks, gap opens, and system anomalies. ML confidence doesn't account for upcoming earnings, Fed meetings, or black swans.
• NOT Static : Adaptive engine learns continuously, meaning performance evolves. Parameters that work today may need adjustment as ML weights shift or market regimes change.
Core Assumptions:
1. Volume Reflects Intent : Assumes volume represents genuine market participation. Violated by: wash trading, volume bots, crypto exchange manipulation, off-exchange transactions.
2. Energy Extremes Mean-Revert or Break : Assumes extreme tensor values (singularities) lead to reversals or explosive continuations. Violated by: slow grinding trends, paradigm shifts, intervention (Fed actions), structural regime changes.
3. Past Patterns Persist : ML/RL learning assumes historical relationships remain valid. Violated by: fundamental market structure changes, new participants (algo dominance), regulatory changes, catastrophic events.
4. ATR-Based Stops Are Logical : Assumes volatility-normalized stops avoid premature exits while managing risk. Violated by: flash crashes, gap moves, illiquid periods, stop hunts.
5. Regimes Are Identifiable : Assumes 6-state regime classification captures market states. Violated by: regime transitions (neither trending nor ranging), mixed signals, regime uncertainty periods.
Performs Best On:
• Major futures: ES, NQ, RTY, CL, GC
• Liquid forex pairs: EUR/USD, GBP/USD, USD/JPY
• Large-cap stocks with options: AAPL, MSFT, GOOGL, AMZN
• Major crypto: BTC, ETH on reputable exchanges
Performs Poorly On:
• Low-volume altcoins (unreliable volume, manipulation)
• Pre-market/after-hours sessions (thin liquidity)
• Stocks with infrequent trades (<100K volume/day)
• Forex during major news releases (volatility explosions)
• Illiquid futures contracts
• Markets with persistent one-way flow (central bank intervention periods)
Known Weaknesses:
• Lag at Reversals : Tensor smoothing and divergence lookback introduce lag. May miss first 20-30% of major reversals.
• Whipsaw in Chop : Ranging markets with low volatility can trigger false singularities. Use range regime detection to reduce this.
• Gap Vulnerability : Shadow portfolio doesn't simulate gap opens. Real trading may face overnight gaps that bypass stops.
• Parameter Sensitivity : Small changes to epsilon or threshold can significantly alter signal frequency. Requires optimization per instrument/timeframe.
• ML Warmup Period : First 30-50 trades, ML system is gathering data. Early performance may not represent steady-state capability.
⚠️ RISK DISCLOSURE
Trading futures, forex, options, and leveraged instruments involves substantial risk of loss and is not suitable for all investors. Past performance, whether backtested or live, is not indicative of future results.
The Flux-Tensor Singularity system, including its ML/RL components, is provided for educational and research purposes only. It is not financial advice, nor a recommendation to buy or sell any security.
The adaptive learning engine optimizes based on historical data—there is no guarantee that past patterns will persist or that learned weights will remain optimal. Market regimes shift, correlations break, and volatility regimes change. Black swan events occur. No algorithmic system eliminates the risk of substantial loss.
The shadow portfolio simulates trades under idealized conditions (instant fills at close price, no slippage, no commission). Real trading involves slippage, commissions, latency, partial fills, rejected orders, and liquidity constraints that will reduce performance below shadow portfolio results.
Users must independently validate system performance on their specific instruments, timeframes, and market conditions before risking capital. Optimize parameters carefully and conduct extensive paper trading. Never risk more capital than you can afford to lose completely.
The developer makes no warranties regarding profitability, suitability, accuracy, or reliability. Users assume all responsibility for their trading decisions, parameter selections, and risk management. No guarantee of profit is made or implied.
Understand that most retail traders lose money. Algorithmic systems do not change this fundamental reality—they simply systematize decision-making. Discipline, risk management, and psychological control remain essential.
═══════════════════════════════════════════════════════
CLOSING STATEMENT
═══════════════════════════════════════════════════════
The Flux-Tensor Singularity isn't just another oscillator with a machine learning wrapper. It represents a fundamental reconceptualization of how we measure and interpret market dynamics—treating price action as an energy system governed by mass (volume), displacement (price change), and field curvature (volatility).
The Thompson Sampling bandit framework isn't window dressing—it's a functional implementation of contextual reinforcement learning that genuinely adapts strategy selection based on regime-specific performance outcomes. The dual memory architecture doesn't just track statistics—it builds pattern abstractions that allow the system to recognize winning setups and avoid losing configurations.
Most importantly, the shadow portfolio provides genuine ground truth. Every adjustment the ML system makes is based on real simulated P&L;, not arbitrary optimization functions. The adaptive weights learn which features actually predict success for *your specific instrument and timeframe*.
This system will not make you rich overnight. It will not win every trade. It will not eliminate drawdowns. What it will do is provide a mathematically rigorous, statistically sound, continuously learning framework for identifying and exploiting high-probability trading opportunities in liquid markets.
The accretion disk glows brightest near the event horizon. The tensor reaches critical mass. The singularity beckons. Will you answer the call?
"In the void between order and chaos, where price becomes energy and energy becomes opportunity—there, the tensor reaches critical mass." — FTS-PRO
Taking you to school. — Dskyz, Trade with insight. Trade with anticipation.

Market Energy & Direction DashboardMarket Energy & Direction Dashboard - Daytrading
Overview
A comprehensive real-time market internals dashboard that combines NYSE TICK, NYSE Advance-Decline (ADD) momentum, VIX direction, and relative volume into a single visual traffic light system with intelligent signal synthesis. Designed for active daytraders who need instant confirmation of market direction and energy based on momentum alignment across all major internals.
What It Does
This indicator synthesizes multiple market internals using directional momentum analysis rather than static thresholds to provide clear, actionable signals:
• Traffic Light System: Single glance confirmation of market state
o Bright Green: Maximum bullish - all internals aligned (TICK + ADD rising + VIX falling + volume)
o Bright Red: Maximum bearish - all internals aligned (TICK + ADD falling + VIX rising + volume)
o Yellow: Exhaustion warning - TICK at extremes, potential reversal imminent
o Moderate Colors: Partial alignment - some confirmation but not complete
o Gray: Choppy, neutral, or conflicting signals
• Real-Time Dashboard displays:
o Current TICK value with exhaustion warnings
o Current ADD with directional momentum indicator (↑ rising = breadth improving, ↓ falling = breadth deteriorating, ± compression)
o VIX level with directional indicator (↓ declining = bullish, ↑ rising = bearish, ± compression = neutral)
o Relative volume (current vs 20-period average)
o Composite status message synthesizing all data into clear directional summary
Key Features
✓ Momentum-based analysis - all indicators show direction/change, not just levels ✓ Intelligent signal hierarchy from "Maximum" to "Moderate" based on internal alignment ✓ ADD directional momentum - catches breadth shifts early, works in all market conditions ✓ VIX directional analysis - shows if fear is increasing, decreasing, or stagnant ✓ Color-coded traffic light for instant decision making ✓ Detects TICK/ADD divergences (conflicting signals = caution) ✓ Exhaustion warnings at extreme TICK levels (±1000+) ✓ Composite status messages - "Maximum Bull", "Strong Bull", "Moderate Bull", etc. ✓ Customizable thresholds for all parameters ✓ Moveable dashboard (9 position options) ✓ Built-in alerts for all signal strengths, exhaustion, and divergences
How To Use
Setup:
1. Add indicator to your main trading chart (SPY, ES, NQ, etc.)
2. Default settings work well for most traders, but you can customize:
o TICK Extreme Level (default 1000)
o ADD Compression Threshold (default 100 - detects when breadth is stagnant)
o VIX Elevated Level (default 20)
o VIX Compression Threshold (default 2% - detects low volatility)
o Volume Threshold (default 1.5x average)
3. Position dashboard wherever convenient on your chart
Reading The Signals:
Signal Hierarchy (Strongest to Weakest):
MAXIMUM SIGNALS ⭐ (Brightest colors - All 4 internals aligned)
• "✓ MAXIMUM BULL": TICK bullish + ADD rising (↑) + VIX falling (↓) + Volume elevated
o This is the holy grail setup - all momentum aligned, highest conviction longs
• "✓ MAXIMUM BEAR": TICK bearish + ADD falling (↓) + VIX rising (↑) + Volume elevated
o Perfect storm bearish - all momentum aligned, highest conviction shorts
STRONG SIGNALS (Bright colors - Core internals aligned)
• "✓ STRONG BULL": TICK bullish + ADD rising (↑)
o Strong confirmation even without VIX/volume - breadth supporting the move
• "✓ STRONG BEAR": TICK bearish + ADD falling (↓)
o Strong confirmation - both momentum and breadth deteriorating
MODERATE SIGNALS (Faded colors - Partial confirmation)
• "MODERATE BULL": TICK bullish but ADD not confirming direction
o Proceed with caution - momentum present but breadth questionable
• "MODERATE BEAR": TICK bearish but ADD not confirming direction
o Proceed with caution - selling but breadth not fully participating
WARNING SIGNALS
• "⚠ EXHAUSTION" (Yellow): TICK at ±1000+ extremes
o Potential reversal zone - prepare to fade or take profits
o Often marks blow-off tops or capitulation bottoms
NEUTRAL/AVOID
• "CHOPPY/NEUTRAL" (Gray): Conflicting signals or low conviction
o Stay out or reduce size significantly
Individual Indicator Interpretation:
TICK:
• Green: Bullish momentum (>+300)
• Red: Bearish momentum (<-300)
• Yellow: Exhaustion (±1000+)
• Gray: Neutral
ADD (Advance-Decline):
• Green (↑): Breadth improving - more stocks participating in the move
• Red (↓): Breadth deteriorating - fewer stocks participating
• Gray (±): Breadth stagnant - no clear participation trend
VIX:
• Green (↓): Fear declining - healthy environment for rallies
• Red (↑): Fear rising - risk-off mode, supports downward moves
• Gray (±): Volatility compression - often precedes explosive moves
Volume:
• Green: High conviction (>1.5x average)
• Gray: Low conviction
Trading Strategy:
1. Wait for "MAXIMUM" or "STRONG" signals for highest probability entries
o Maximum signals = go full size with confidence
o Strong signals = good conviction, normal position sizing
2. Confirm directional alignment:
o For longs: Want ADD ↑ (rising) and VIX ↓ (falling)
o For shorts: Want ADD ↓ (falling) and VIX ↑ (rising)
3. Use exhaustion warnings (yellow) to:
o Take profits on existing positions
o Prepare counter-trend entries
o Tighten stops
4. Avoid "MODERATE" signals unless you have strong conviction from other analysis
o These work best as confirmation for existing setups
o Not strong enough to initiate new positions alone
5. Never trade "CHOPPY/NEUTRAL" signals
o Gray means stay out - preserve capital
o Wait for clear alignment
6. Watch for divergences:
o Price making new highs but ADD ↓ (falling) = distribution warning
o Price making new lows but ADD ↑ (rising) = potential bottom
o Divergence alert will notify you
Best Practices:
• Use on 1-5 minute charts for daytrading
• Combine with your price action or technical setup (support/resistance, trendlines, patterns)
• The dashboard confirms when to take your setup, not what setup to take
• Most effective during regular market hours (9:30 AM - 4:00 PM ET) when volume is present
• The strongest edge comes from "MAXIMUM" signals - wait for these for best risk/reward
• Pay special attention to ADD direction - it's the most predictive breadth indicator
• VIX compression (gray ±) often signals upcoming volatility expansion - prepare for bigger moves
Customization Option
All thresholds are adjustable in settings:
• TICK Extreme: Higher = fewer exhaustion warnings (try 1200-1500 for less sensitivity)
• ADD Compression Threshold: Change detection sensitivity
o Default 100 = balanced
o Lower (50) = more sensitive to small breadth changes
o Higher (200-300) = only shows major breadth shifts
• VIX Elevated: Adjust for current volatility regime (15-25 typical range)
• VIX Compression Threshold:
o Default 2% = balanced
o Lower (0.5-1%) = catches subtle VIX changes
o Higher (3-5%) = only shows significant VIX moves
• Volume Threshold: Lower for quieter stocks/times, higher for more confirmation
Alerts Available
• Maximum Bullish: All 4 internals aligned bullish (TICK + ADD↑ + VIX↓ + Volume)
• Maximum Bearish: All 4 internals aligned bearish (TICK + ADD↓ + VIX↑ + Volume)
• Strong Bullish: TICK bullish + ADD rising
• Strong Bearish: TICK bearish + ADD falling
• Exhaustion Warning: TICK at extreme levels
• Divergence Warning: TICK and ADD directions conflicting
Understanding the Signal Synthesis
The indicator uses intelligent logic to combine all internals:
"MAXIMUM" Signals require:
• TICK direction (bullish/bearish)
• ADD momentum (rising/falling) in same direction
• VIX direction (falling for bulls, rising for bears)
• Volume elevated (>1.5x average)
"STRONG" Signals require:
• TICK direction (bullish/bearish)
• ADD momentum (rising/falling) in same direction
• (VIX and volume are bonuses but not required)
"MODERATE" Signals:
• TICK showing direction
• But ADD not confirming or contradicting
• Weakest actionable signal
This hierarchy ensures you know exactly how much conviction the market has behind any move.
Technical Details
• Pulls real-time data from NYSE TICK (USI:TICK), NYSE ADD (USI:ADD), and CBOE VIX
• ADD direction calculated using bar-to-bar change with compression detection
• VIX direction calculated using bar-to-bar percentage change
• Volume calculation uses 20-period simple moving average
• Dashboard updates every bar
• No repainting - all calculations based on closed bar data
Who This Is For
• Active daytraders of stocks, futures (ES/NQ), and options
• Scalpers needing quick directional confirmation with multiple internal alignment
• Swing traders looking to time intraday entries with maximum confluence
• Volatility traders who monitor VIX behavior
• Market makers and professionals who trade based on breadth and internals
• Anyone who monitors market internals but wants intelligent synthesis vs raw data
Tips For Success
Trading Philosophy:
• Quality over quantity - wait for "MAXIMUM" signals for best results
• One "MAXIMUM" signal trade is worth five "MODERATE" signal trades
• Gray/neutral is not a sign of missing opportunity - it's protecting your capital
Signal Confidence Levels:
1. MAXIMUM (95%+ confidence) - Trade these aggressively with full size
2. STRONG (80-85% confidence) - Trade these with normal position sizing
3. MODERATE (60-70% confidence) - Only if confirmed by strong technical setup
4. CHOPPY/NEUTRAL - Do not trade, wait for clarity
Advanced Techniques:
• Breadth divergences: Watch for price making new highs while ADD shows ↓ (falling) = major warning
• VIX/Price divergences: Rallies with rising VIX (↑) are usually false moves
• Volume confirmation: "MAXIMUM" signals with 2x+ volume are the absolute best
• Compression zones: When both ADD and VIX show compression (±), expect explosive breakout soon
• Sequential signals: Back-to-back "MAXIMUM" signals in same direction = strong trending day
Common Patterns:
• Opening surge with "MAXIMUM BULL" that shifts to "EXHAUSTION" (yellow) = fade the high
• Selloff with "MAXIMUM BEAR" followed by ADD ↑ (rising) divergence = potential reversal
• Choppy morning followed by "MAXIMUM" signal afternoon = best trending opportunity
Example Scenarios
Perfect Bull Entry:
• Bright green signal box
• TICK: +650
• ADD: +1200 (↑)
• VIX: 18.30 (↓)
• Volume: 2.3x
• Status: "✓ MAXIMUM BULL" → ALL SYSTEMS GO - Take aggressive long positions
Strong Bull (Good Confidence):
• Green signal box (slightly less bright)
• TICK: +500
• ADD: +800 (↑)
• VIX: 19.50 (±)
• Volume: 1.2x
• Status: "✓ STRONG BULL" → Good long setup - breadth confirming even without VIX/volume
Caution Bull (Moderate):
• Faded green signal box
• TICK: +400
• ADD: +900 (↓)
• VIX: 20.10 (↑)
• Volume: 0.9x
• Status: "MODERATE BULL" → CAUTION - TICK bullish but breadth deteriorating and VIX rising = weak rally
Exhaustion Warning:
• Yellow signal box
• TICK: +1350 ⚠
• ADD: +2100 (↑)
• VIX: 17.20 (↓)
• Volume: 1.8x
• Status: "⚠ EXHAUSTION" → Take profits or prepare to fade - TICK overextended despite good internals
Divergence Setup (Potential Reversal):
• Faded green signal
• TICK: +300
• ADD: +1800 (↓)
• VIX: 21.50 (↑)
• Volume: 1.6x
• Status: "MODERATE BULL" → WARNING - Price rallying but breadth collapsing and fear rising = distribution
Perfect Bear Entry:
• Bright red signal box
• TICK: -780
• ADD: -1600 (↓)
• VIX: 24.80 (↑)
• Volume: 2.5x
• Status: "✓ MAXIMUM BEAR" → Perfect short setup - all momentum bearish with conviction
Compression (Wait Mode):
• Gray signal box
• TICK: +50
• ADD: -200 (±)
• VIX: 16.40 (±)
• Volume: 0.7x
• Status: "CHOPPY/NEUTRAL" → STAY OUT - Volatility compression, no conviction, await breakout
Performance Optimization
Best Market Conditions:
• Works excellent in trending markets (up or down)
• Particularly powerful during high-volume sessions (first/last hours)
• "MAXIMUM" signals most reliable during 9:45-11:00 AM and 2:00-3:30 PM ET
Less Effective During:
• Lunch period (11:30 AM - 1:30 PM) - lower volume reduces signal quality
• Low-volatility environments - compression signals dominate
• Major news events in first 5 minutes - wait for internals to stabilize
Recommended Use Cases:
• Scalping: Trade only "MAXIMUM" signals for quick 5-15 minute moves
• Daytrading: Use "MAXIMUM" and "STRONG" signals for position entries
• Swing entries: Use "MAXIMUM" signals for optimal intraday entry timing
• Exit timing: Use "EXHAUSTION" (yellow) warnings to take profits
________________________________________
Pro Tip: Create a dedicated workspace with this indicator on SPY/ES/NQ charts. Set alerts for "MAXIMUM BULL", "MAXIMUM BEAR", and "EXHAUSTION" signals. Most professional traders only trade the "MAXIMUM" setups and ignore everything else - this alone can dramatically improve win rates.

ProEdge Strategy's — Structure ReclaimWhat it does
ProEdge Indicator — Fib Reclaim Pro (Signals Only) finds “reclaim” setups of the active Time-Based Fib (TBF) leg and confirms them with weekly gates, optional POC alignment, and light OB proximity. When conditions line up, it prints a one-shot BUY/SELL triangle and can fire alerts—no auto-trading, no repainting tricks.
Best use / timeframes
HTF bias & swing trades: run your chart on 1D or 12H (default TBF = 12H). Great for swing positioning and “let it trend” moves.
Intraday: 4H / 1H for cleaner entries while keeping the 12H/1D bias.
Scalping: 15m / 5m with the higher-timeframe bias. Consider increasing Pivot Strength and Min Confluence Score, enable Require POC, and reduce Max bars to fill.
Alerts & Other Settings
Add alert → ProEdge BUY or ProEdge SELL → Once per bar close. Works with webhooks/Discord/Telegram.
Key settings (tune to your market)
TBF Timeframe (anchor leg, e.g., 12H/1D) & Pivot Strength.
Weekly gates: W 0.25 reclaim (longs) / W 0.75 loss (shorts), plus optional 0.50 bias.
Min Confluence Score, Require POC, OB band (ATR), Retest style (wick vs close), Cooldown, Max bars to fill.
All options live in settings - flip chart timeframes freely and adjust inputs to suit each symbol’s personality (crypto, FX, indices, stocks).
Trading notes
Use HTF for direction, LTF for execution. Let alerts bring you to the chart; still apply risk, invalidations, and position sizing. Educational tool - not financial advice.

Price levelsPRICE LEVELS INDICATOR - DESCRIPTION
This TradingView indicator displays critical institutional price levels that professional traders use for intraday decision-making. The indicator automatically plots horizontal lines at key support and resistance levels derived from previous and current trading sessions, along with two simple moving averages for trend context.
KEY FEATURES
Daily Levels:
Prior Day High/Low: Yesterday's trading range extremes
Pre-Market High/Low: The highest and lowest prices reached during pre-market hours (4:00 AM - 9:30 AM EST)
Current Day High/Low/Open: Today's intraday extremes and opening price
After-Hours High/Low: Post-market session price extremes (4:00 PM - 8:00 PM EST)
First Bar High/Low: The high and low of the first regular trading session bar
Weekly Levels:
Prior Week High/Low/Close: Last week's price extremes and closing price
Current Week High/Low/Open: This week's ongoing price range and opening level
Moving Averages:
SMA 20 (default): Short-term trend indicator
SMA 200 (default): Long-term trend indicator
HOW TO USE THIS INDICATOR
Installation:
Copy the entire Pine Script code
In TradingView, open the Pine Editor (bottom panel)
Paste the code and click "Add to Chart"
The indicator will overlay directly on your price chart
Configuration:
All settings are accessible through the indicator settings menu (gear icon). You can customize:
Which price levels to display (toggle each level on/off)
Line colors, thickness, and styles (solid, dashed, dotted)
Label display and positioning
Price axis visibility for each level
Label text content and colors
Best Practices for Trading:
Market Structure:
Price above Week Open = bullish bias
Price below Week Open = bearish bias
Use Prior Week Close as major support/resistance
Entry Timing:
Look for bounces off Prior Day High/Low
Pre-Market High/Low often act as breakout triggers
Institutional traders watch these levels closely
Risk Management:
Place stops below/above relevant price levels
Prior Day Low often serves as stop-loss for longs
Prior Day High often serves as stop-loss for shorts
Confluence Trading:
Strongest setups occur when multiple levels align
Example: Price bounces at both Prior Day Low AND Week Open
Combine with moving averages for additional confirmation
Breakout Trading:
Pre-Market High break = potential bullish momentum
Pre-Market Low break = potential bearish momentum
Prior Week High break = strong bullish signal
Prior Week Low break = strong bearish signal
RECOMMENDED SETTINGS
For Day Trading:
Enable: Prior Day High/Low, PM High/Low, Week Open, Prior Week Close
Timeframe: 5-minute or 15-minute charts
Display: "Most recent level on most recent day"
For Swing Trading:
Enable: Prior Week High/Low, Current Week High/Low, Week Open
Timeframe: 1-hour or 4-hour charts
Display: "Most recent level across the chart"
For Scalping:
Enable: PM High/Low, Current Day High/Low
Timeframe: 1-minute or 3-minute charts
Disable weekly levels to reduce clutter
ALERT SETUP
The indicator includes built-in alerts for:
Price crossing above Pre-Market High
Price crossing below Pre-Market Low
Price closing above Pre-Market High
Price closing below Pre-Market Low
To enable alerts:
Right-click on the indicator name
Select "Add Alert"
Choose the desired alert condition
Set alert frequency and notification method
UNDERSTANDING LABEL COLORS
Each price level has a distinct color scheme by default:
Green tones: High levels (resistance)
Red/Pink tones: Low levels (support)
Yellow/Orange: Opening prices
Cyan/Blue: Weekly levels
All colors are fully customizable in the settings to match your chart theme.
TECHNICAL NOTES
The indicator only displays on intraday timeframes (seconds, minutes, hours)
It does not work on daily, weekly, or monthly charts
Lines automatically extend to the current bar
Labels update in real-time as prices move
Pre-market and after-hours levels require extended trading session data enabled in your chart settings
COMMON USE CASES
Gap Trading: Use Pre-Market High/Low to identify gap fill targets
Range Trading: Trade bounces between Prior Day High and Low
Breakout Trading: Enter when price decisively breaks key levels
Trend Following: Combine price levels with SMA 20 and 200 for trend confirmation
Support/Resistance: Use levels as dynamic support/resistance zones
This indicator is designed to give traders immediate visual reference to the price levels that institutional traders and market makers are watching, helping you make informed trading decisions based on areas where significant buying or selling pressure is likely to occur.
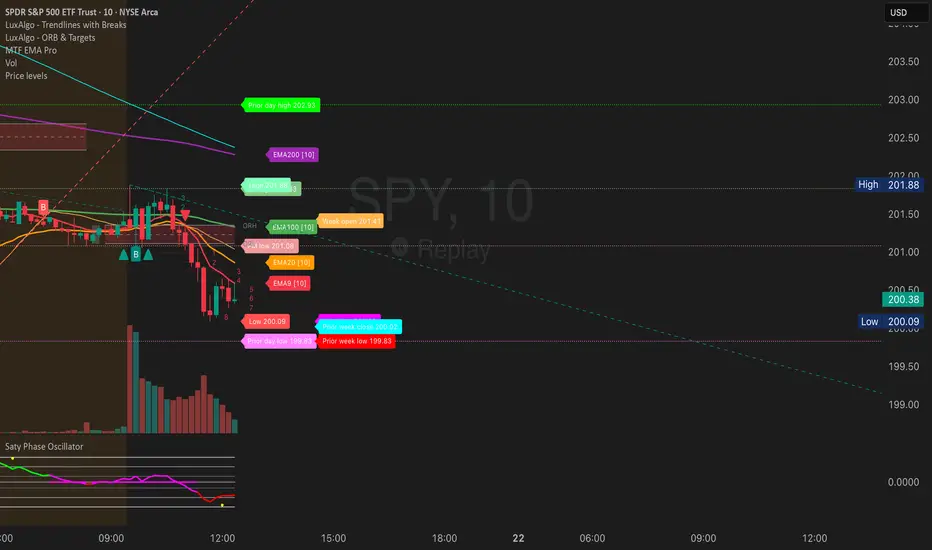
RED-E Market Structure (Pro V2)RED-E Market Structure - Comprehensive Technical Analysis System
⚠️ EDUCATIONAL TOOL - NO GUARANTEES
This indicator is designed for educational purposes to help traders learn technical analysis concepts. It does not predict future price movements or guarantee profitable trades. Trading involves substantial risk of loss.
═══════════════════════════════════════════════════════════════
📊 WHAT THIS INDICATOR DOES
This indicator combines multiple standard technical analysis methods into a unified system for analyzing market structure, momentum, volume dynamics, and key price levels. Rather than adding 10 separate indicators to your chart, this consolidates related information into one cohesive interface where each component informs the others.
═══════════════════════════════════════════════════════════════
🔧 TECHNICAL METHODOLOGY - HOW IT WORKS
1️⃣ MOMENTUM CANDLE COLORING (6 Levels)
Calculation Method:
- Compares close vs EMA(9) and EMA(21)
- Applies RSI(14) thresholds for strength
- Color codes: Royal Blue (strongest bull) → Cyan → Green → Yellow → Orange → Red (strongest bear) → White (neutral)
Formula Logic:
IF close > EMA(9) AND close > EMA(21) AND close > open:
RSI > 70 = Level 3 Bull (Royal Blue)
RSI 60-70 = Level 2 Bull (Cyan)
RSI < 60 = Level 1 Bull (Green)
Purpose: Visualizes momentum strength by combining trend (EMAs), candle direction, and overbought/oversold conditions (RSI).
2️⃣ ENTRY SIGNAL LABELS
Calculation Method:
- Uses EMA alignment: EMA(9) > EMA(21) > EMA(50) for bullish
- Filters RSI to avoid extremes
- Requires confirming candle
BUY Signal Logic:
IF close > EMA(9) AND RSI between 40-70 AND EMA(9) > EMA(21) > EMA(50) AND close > open
THEN: Display "BUY" label
Purpose: Identifies potential entries when multiple trend and momentum conditions align. This is standard multi-confirmation technical analysis.
3️⃣ VOLUME DELTA PERCENTAGE
Calculation Method:
FOR each bar in lookback period (default 20):
IF close > open: add volume to bullish_volume
IF close < open: add volume to bearish_volume
bullish_percent = (bullish_volume / total_volume) × 100
Purpose: Quantifies buying vs selling pressure as percentages. Shows if volume supports the current trend.
Display: "🟢65.3% | 🔴34.7%" in dashboard
4️⃣ PRE-MARKET HIGH/LOW TRACKING
Calculation Method:
1. Detect pre-market session (4:00-9:30 AM ET)
2. Track highest high during pre-market
3. Track lowest low during pre-market
4. Draw horizontal lines when market opens
Purpose: Pre-market levels often act as support/resistance during regular hours. This automates their tracking and visualization.
5️⃣ OPENING RANGE BREAKOUT (ORB)
Calculation Method:
1. User sets start time (default 9:30 AM) and duration (default 15 min)
2. Track highest high and lowest low during this period
3. Draw box and extend lines
Purpose: The opening range breakout is a well-documented day trading strategy. First X minutes establish a range, and breakouts often signal directional moves.
6️⃣ SUPPORT/RESISTANCE TRENDLINES
Calculation Method:
1. Identify pivot highs: ta.pivothigh(high, 5, 5)
2. Identify pivot lows: ta.pivotlow(low, 5, 5)
3. Connect last two pivot highs = Resistance (red)
4. Connect last two pivot lows = Support (blue)
Purpose: Automatically connects significant pivot points. Based on standard pivot analysis where price respects these levels.
7️⃣ GAMMA ZONE DETECTION
Calculation Method:
1. Calculate 30-min range: (high - low)
2. Calculate 10-period SMA of range
3. Calculate ratio: current_range / average_range
IF ratio < (1.0 / sensitivity): HIGH GAMMA = Low volatility
IF ratio > (1.0 × sensitivity): LOW GAMMA = High volatility
Purpose: Approximates options gamma effects. High gamma = dealers hedge more = suppressed volatility. Low gamma = less hedging = potential explosive moves.
8️⃣ TAKE PROFIT LEVELS (5 Levels + ATR Stop Loss)
Calculation Method:
LONG: TP = entry_price × (1 + percentage/100)
SHORT: TP = entry_price × (1 - percentage/100)
Stop Loss (ATR): entry ± (ATR(14) × multiplier)
Purpose: Automatically calculates percentage-based targets and volatility-adjusted stops. ATR adapts stop to current market conditions.
9️⃣ THE STRAT PATTERN RECOGNITION
Calculation Method:
Compare current bar to previous:
- Strat 3 (outside bar): high > high AND low < low
- Strat 1 (inside bar): high ≤ high AND low ≥ low
- Strat 2 (directional): All others
Purpose: The Strat is a price action system categorizing bars by relationship to previous bars. This automates classification.
🔟 FIBONACCI RETRACEMENTS
Calculation Method:
1. Find highest high in lookback (default 30 bars)
2. Find lowest low in lookback
3. Calculate: 0.0, 0.382, 0.5, 0.618, 1.0 levels
Purpose: Standard Fibonacci tool. These ratios are commonly used support/resistance in technical analysis.
1️⃣1️⃣ MULTI-TIMEFRAME ANALYSIS
Calculation Method:
FOR each timeframe (default 15m, 1H, 4H):
Check if close > EMA(9) on that timeframe
IF true: "BULLISH", else: "BEARISH"
Purpose: Shows trend alignment across timeframes using Pine's request.security(). Common confirmation technique.
═══════════════════════════════════════════════════════════════
💡 WHY THESE COMPONENTS WORK TOGETHER
This indicator's originality lies in its unified system approach:
1. TREND IDENTIFICATION (EMAs, MTF) - Shows direction
2. MOMENTUM MEASUREMENT (RSI, candles) - Shows strength
3. VOLUME CONFIRMATION (Volume Delta) - Shows conviction
4. KEY LEVELS (PM, ORB, Fib, S/R) - Shows decision points
5. RISK MANAGEMENT (TP levels, ATR stops) - Shows exits
VALUE OF INTEGRATION:
Rather than 10 separate indicators creating chart clutter, this consolidates related concepts where each component provides different information that, when viewed together, gives a more complete market picture.
Example Integration:
- Entry signal appears (EMA + RSI aligned)
- Volume Delta confirms (more buying than selling)
- MTF shows higher timeframes agree
- TP levels auto-calculate with good risk:reward
- Support trendline nearby provides stop reference
═══════════════════════════════════════════════════════════════
⚙️ CUSTOMIZATION OPTIONS
All features independently toggleable:
- EMAs: Adjust lengths (9, 21, 50, 200), colors, widths
- RSI: Change overbought/oversold levels (70/30)
- Volume Delta: Adjust lookback period (20)
- ORB: Set custom start time, duration, timezone
- Gamma: Adjust sensitivity (1-10)
- TP Levels: Customize all 5 percentages
- Dashboard: Reposition, resize, recolor
═══════════════════════════════════════════════════════════════
📖 HOW TO USE
Step 1 - Assess Context:
- Check MTF Dashboard for alignment
- Check EMA indicator for trend
- Check Gamma Zone for volatility expectation
Step 2 - Identify Setups:
- Wait for BUY/SELL signal
- Check Volume Delta matches direction
- Verify RSI not extreme (30-70)
- Look for support/resistance confluence
Step 3 - Evaluate Risk:Reward:
- Review TP3 R:R ratio (target 2:1+)
- Check stop loss placement
- Ensure risk acceptable
Step 4 - Monitor:
- Track P&L % in real-time
- Use TP levels as potential exits
- Adjust stops based on S/R
═══════════════════════════════════════════════════════════════
⚠️ LIMITATIONS & REALISTIC EXPECTATIONS
This indicator does NOT:
- Predict future price movements
- Guarantee profitable trades
- Work in all market conditions
- Replace proper education and practice
This indicator CAN:
- Display standard technical indicators in organized way
- Automate common calculations
- Visualize multiple analysis methods simultaneously
- Help learn how different indicators relate
Key Understanding:
All technical indicators use historical data. They help identify patterns and conditions but cannot predict the future. Successful trading requires risk management, psychology, and experience—not just indicators.
═══════════════════════════════════════════════════════════════
📚 EDUCATIONAL CONCEPTS TAUGHT
- How EMAs show trend direction and alignment
- How RSI identifies momentum extremes
- How volume confirms or diverges from price
- How support/resistance levels form
- How multiple timeframes provide context
- How ATR adapts stops to volatility
- How risk:reward ratios work
═══════════════════════════════════════════════════════════════
📊 BEST SUITED FOR
- Scalping: 1m-5m charts with quick entries/exits
- Day Trading: 15m-1H focusing on ORB and PM levels
- Swing Trading: 4H-D following major trends
═══════════════════════════════════════════════════════════════
⚠️ RISK DISCLAIMER
Trading involves substantial risk of loss. This educational tool:
- Does NOT guarantee profits
- Cannot predict future performance
- Requires proper risk management
- Should be practiced on demo accounts first
Always use stop losses, risk only 1-2% per trade, and consult licensed financial professionals before trading with real capital.
═══════════════════════════════════════════════════════════════
Educational tool for learning technical analysis. Not financial advice. Past results do not indicate future performance.

WeAxes MTF Scalper [LITE] WeAxes MTF Scalper
Professional Multi-Timeframe Alignment Tool - LITE Version
What This LITE Version Offers:
3-Timeframe Sync: Monitor 1min, 15min, and 1hr trends simultaneously
Visual Alignment System: Color-coded candles for perfect setups
Quick Setup Recognition: Instant HIGH/MEDIUM/LOW quality ratings
Clean Data Display: Essential alignment information at a glance
Perfect for Scalping:
Green Candles: Perfect bullish alignment across all timeframes
Red Candles: Perfect bearish alignment across all timeframes
Setup Quality: Know immediately if conditions are favorable
Multi-Timeframe Context: Never trade blind again
How to Use:
1. HIGH Quality Setups (Green/Red candles): Highest probability trades
2. MEDIUM Quality: All trends aligned, good for trend following
3. LOW Quality: Mixed signals, better to wait for alignment
PRO Version Includes:
- Advanced volume profiling across all timeframes
- Momentum strength calculations
- Detailed market structure analysis
- Smart Money Concepts integration
- Complete volume analysis
- And much more...
This LITE version gives you a taste of professional multi-timeframe analysis. Contact for PRO version access with full features.
Disclaimer: Use proper risk management. This tool assists analysis but doesn't guarantee profits.
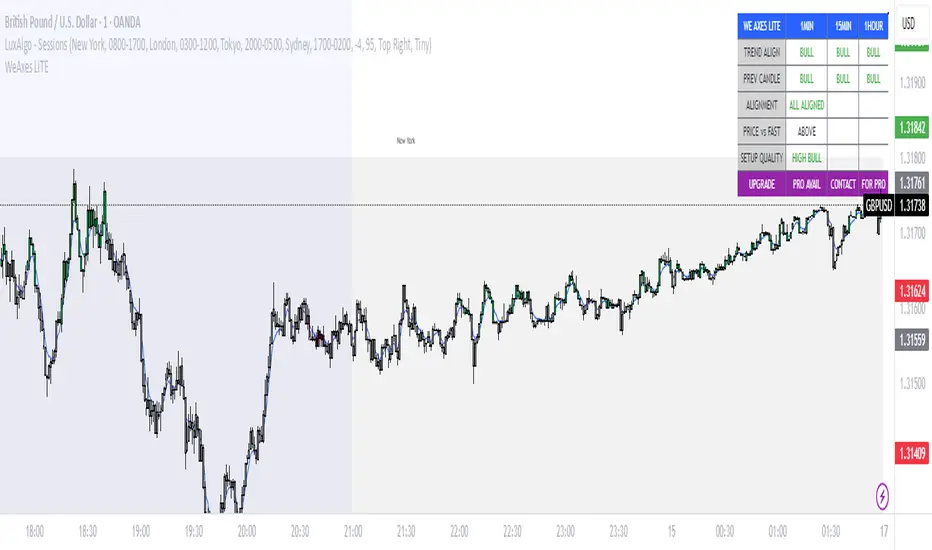
chanlun缠论 - 笔与中枢Overview
The Chanlun (缠论) Strokes & Central Zones indicator is an advanced technical analysis tool based on Chinese Chan Theory (Chanlun Theory). It automatically identifies market structure through "strokes" (笔) and "central hubs" (中枢), providing traders with a systematic framework for understanding price movements, trend structure, and potential reversal zones.
Theoretical Foundation
Chan Theory is a sophisticated price action methodology that breaks down market movements into hierarchical structures:
Local Extremes: Swing highs and lows identified through lookback periods
Strokes (笔): Valid price movements between opposite extremes that meet specific criteria
Central Hubs (中枢): Consolidation zones formed by overlapping strokes, representing key support/resistance areas
Key Components
1. Local Extreme Detection
Identifies swing highs and lows using a configurable lookback period (default: 5 bars)
Only considers extremes within the specified calculation range
Forms the foundation for stroke construction
2. Stroke (笔) Identification
The indicator applies a multi-stage filtering process to identify valid strokes:
Stage 1 - Extreme Consolidation:
Merges consecutive extremes of the same type (high or low)
Keeps only the most extreme value (highest high or lowest low)
Stage 2 - Stroke Validation:
Ensures minimum bar gap between strokes (default: 4 bars)
Alternative validation: 2+ bars with >1% price change
Eliminates noise and insignificant price movements
Color Coding:
White Lines: Regular up/down strokes
Yellow Lines: Strokes that form part of a central hub
Customizable width and colors for different stroke types
3. Central Hub (中枢) Formation
A central hub forms when at least 3 consecutive strokes have overlapping price ranges:
Formation Rules:
Stroke 1:
Stroke 2:
Stroke 3:
Hub Upper = MIN(High1, High2, High3)
Hub Lower = MAX(Low1, Low2, Low3)
Valid if: Hub Upper > Hub Lower
Hub Extension:
Subsequent strokes that overlap with the hub extend it
Hub ends when a stroke no longer overlaps
Creates rectangular zones on the chart
Visual Representation:
Green rectangular boxes: Mark the time and price range of each central hub
Dashed extension lines: Show the latest hub boundaries extending to the right
Price labels on axis: Display exact hub upper and lower boundary values
4. Extreme Point Markers (Optional)
Red markers for tops (▼)
Green markers for bottoms (▲)
Marks every validated stroke extreme point
Useful for detailed structure analysis
5. Information Table (Optional)
Displays real-time statistics:
Symbol name
Current timeframe
Lookback period setting
Minimum gap setting
Total stroke count
Parameter Settings
Performance Settings
Max Bars to Calculate (3600): Limits historical calculation to improve performance
Local Extreme Lookback Period (5): Bars used to identify swing highs/lows
Min Gap Bars (4): Minimum bars required between valid strokes
Display Settings
Show Strokes: Toggle stroke line visibility
Show Central Hub: Toggle hub box visibility
Show Hub Extension Lines: Toggle dashed boundary lines
Show Extreme Point Marks: Toggle top/bottom markers
Show Info Table: Toggle statistics table
Color Settings
Full customization of:
Up/down stroke colors and widths
Hub stroke colors and widths
Hub border and background colors
Extension line colors
Trading Applications
Trend Structure Analysis
Uptrend: Series of higher highs and higher lows connected by strokes
Downtrend: Series of lower highs and lower lows connected by strokes
Consolidation: Formation of central hubs indicating range-bound movement
Support and Resistance Identification
Central Hub Zones: Act as strong support/resistance areas
Hub Upper Boundary: Resistance level in consolidation, support after breakout
Hub Lower Boundary: Support level in consolidation, resistance after breakdown
Price tends to react at these levels due to market structure memory
Breakout Trading
Bullish Breakout: Price closes above hub upper boundary
Previous resistance becomes support
Entry on retest of upper boundary
Stop loss below hub zone
Bearish Breakdown: Price closes below hub lower boundary
Previous support becomes resistance
Entry on retest of lower boundary
Stop loss above hub zone
Reversal Detection
Hub Formation After Trend: Signals potential trend exhaustion
Multiple Hub Levels: Create probability zones for reversals
Stroke Count: Excessive strokes within hub suggest weakening momentum
Position Management
Use hub boundaries for stop loss placement
Scale out positions at hub edges
Re-enter on retests of broken hub levels
Interpretation Guide
Strong Trending Market
Long, clear strokes with minimal overlap
Few or no central hubs forming
Strokes consistently in same direction
Wide spacing between extremes
Consolidating Market
Multiple central hubs forming
Short, overlapping strokes
Yellow hub strokes dominate the chart
Narrow price range
Trend Transition
Hub formation after extended trend
Stroke direction changes frequently
Hub boundaries being tested repeatedly
Potential reversal zone
Advanced Usage Techniques
Multi-Timeframe Analysis
Higher Timeframe: Identify major hub zones for overall market structure
Lower Timeframe: Find precise entry points within larger structure
Alignment: Trade when lower timeframe strokes align with higher timeframe hub breaks
Hub Quality Assessment
Wide Hubs: Strong consolidation, higher probability support/resistance
Narrow Hubs: Weak consolidation, may break easily
Extended Hubs: More strokes = stronger zone
Isolated Hubs: Single hub = potential pivot point
Stroke Analysis
Stroke Length: Longer strokes = stronger momentum
Stroke Speed: Fewer bars per stroke = explosive moves
Stroke Clustering: Many short strokes = indecision
Best Practices
Parameter Optimization
Adjust lookback period based on timeframe and volatility
Lower periods (3-4): More strokes, more noise, faster signals
Higher periods (7-10): Fewer strokes, cleaner structure, slower signals
Confirmation Strategy
Don't trade on strokes alone
Combine with volume analysis
Use candlestick patterns at hub boundaries
Wait for breakout confirmation
Risk Management
Always place stops outside hub zones
Use hub width to size positions (wider hub = smaller position)
Exit if price re-enters broken hub from wrong direction
Avoid Common Pitfalls
Don't trade within central hubs (range-bound, unpredictable)
Don't ignore higher timeframe hub structures
Don't chase strokes after they've extended far from hub
Don't trust single-stroke hubs (need 3+ strokes for validity)
Performance Considerations
Max Bars Limit: Set to 3600 to balance detail with performance
Safe Distance Calculation: Only draws objects within 2000 bars of current price
Object Cleanup: Automatically removes old drawing objects to prevent memory issues
Efficient Arrays: Uses indexed arrays for fast lookup and processing
Ideal Market Conditions
Best Performance:
Liquid markets with clear structure (major forex pairs, indices, large-cap stocks)
Trending markets with periodic consolidations
Medium to high volatility for clear stroke formation
Less Effective:
Extremely choppy, directionless markets
Very low timeframes (< 5 minutes) with excessive noise
Illiquid instruments with erratic price action
Integration with Other Indicators
Complementary Tools:
Volume Profile: Confirm hub significance with volume nodes
Moving Averages: Use for trend bias within stroke structure
RSI/MACD: Momentum confirmation at hub boundaries
Fibonacci Retracements: Hub levels often align with Fib levels
Advantages
✓ Objective Structure: Removes subjectivity from market structure analysis
✓ Visual Clarity: Color-coded strokes and clear hub zones
✓ Multi-Timeframe Applicable: Works on all timeframes from minutes to months
✓ Complete Framework: Provides entry, exit, and risk management levels
✓ Theoretical Foundation: Based on proven Chan Theory methodology
✓ Customizable: Extensive parameter and visual customization options
Limitations
⚠ Learning Curve: Requires understanding of Chan Theory principles
⚠ Lag Factor: Strokes confirm after price movements complete
⚠ Parameter Sensitivity: Different settings produce significantly different results
⚠ Choppy Market Struggles: Can generate excessive hubs in range-bound conditions
⚠ Computation Intensive: May slow down on lower-end systems with max bars setting
Optimization Tips
Timeframe Selection
Scalping: 5-15 minute charts, lookback period 3-4
Day Trading: 15-60 minute charts, lookback period 4-5
Swing Trading: 4-hour to daily charts, lookback period 5-7
Position Trading: Daily to weekly charts, lookback period 7-10
Volatility Adjustment
High volatility: Increase minimum gap bars to reduce noise
Low volatility: Decrease lookback period to capture smaller moves
Visual Optimization
Use contrasting colors for different market conditions
Adjust line widths based on chart resolution
Toggle markers off for cleaner appearance once familiar with structure
Quick Start Guide
For Beginners:
Start with default settings (5 lookback, 4 min gap)
Enable "Show Info Table" to track stroke count
Focus on identifying clear hub formations
Practice waiting for price to break hub boundaries before trading
For Advanced Users:
Optimize lookback and gap parameters for your instrument
Use hub strokes (yellow) to identify key consolidation zones
Combine with multiple timeframes for confirmation
Develop entry rules based on hub breakout/retest patterns
This indicator provides a complete structural framework for understanding market behavior through the lens of Chan Theory, offering traders a systematic approach to identifying high-probability trading opportunities.

DAO - Demand Advanced Oscillator# DAO - Demand Advanced Oscillator
## 📊 Overview
DAO (Demand Advanced Oscillator) is a powerful momentum oscillator that measures buying and selling pressure by analyzing consecutive high-low relationships. It helps identify market extremes, divergences, and potential trend reversals.
**Values range from 0 to 1:**
- **Above 0.70** = Overbought (potential reversal down)
- **Below 0.30** = Oversold (potential reversal up)
- **0.30 - 0.70** = Neutral zone
---
## ✨ Key Features
✅ **Automatic Divergence Detection**
- Bullish divergences (price lower low + DAO higher low)
- Bearish divergences (price higher high + DAO lower high)
- Visual lines connecting divergence points
✅ **Multi-Timeframe Analysis**
- View higher timeframe DAO on current chart
- Perfect for trend alignment strategies
✅ **Signal Line (EMA)**
- Customizable EMA for trend confirmation
- Crossover signals for momentum shifts
✅ **Real-Time Statistics Dashboard**
- Current DAO value
- Market status (Overbought/Oversold/Neutral)
- Trend direction indicator
✅ **Complete Alert System**
- Overbought/Oversold signals
- Bullish/Bearish divergences
- Signal line crosses
- Level crosses
✅ **Fully Customizable**
- Adjustable periods and levels
- Customizable colors and zones
- Toggle features on/off
---
## 📈 Trading Signals
### 1. Divergences (Most Powerful)
**Bullish Divergence:**
- Price makes lower low
- DAO makes higher low
- Signal: Strong reversal up likely
**Bearish Divergence:**
- Price makes higher high
- DAO makes lower high
- Signal: Strong reversal down likely
### 2. Overbought/Oversold
**Overbought (>0.70):**
- Market may be overextended
- Consider taking profits or looking for shorts
- Can remain overbought in strong trends
**Oversold (<0.30):**
- Market may be oversold
- Consider buying opportunities
- Can remain oversold in strong downtrends
### 3. Signal Line Crossovers
**Bullish Cross:**
- DAO crosses above signal line
- Momentum turning positive
**Bearish Cross:**
- DAO crosses below signal line
- Momentum turning negative
### 4. Level Crosses
**Cross Above 0.30:** Exiting oversold zone (potential uptrend)
**Cross Below 0.70:** Exiting overbought zone (potential downtrend)
---
## ⚙️ Default Settings
📊 Oscillator Period: 14
Number of bars for calculation
📈 Signal Line Period: 9
EMA period for signal line
🔴 Overbought Level: 0.70
Upper threshold
🟢 Oversold Level: 0.30
Lower threshold
🎯 Divergence Detection: ON
Auto divergence identification
⏰ Multi-Timeframe: OFF
Higher TF overlay (optional)
All parameters are fully customizable!
---
## 🔔 Alerts
Six pre-configured alerts available:
1. DAO Overbought
2. DAO Oversold
3. DAO Bullish Divergence
4. DAO Bearish Divergence
5. DAO Signal Cross Up
6. DAO Signal Cross Down
**Setup:** Right-click indicator → Add Alert → Choose condition
---
## 💡 How to Use
### Best Practices:
✅ Focus on divergences (strongest signals)
✅ Combine with support/resistance levels
✅ Use multiple timeframes for confirmation
✅ Wait for price action confirmation
✅ Practice proper risk management
### Avoid:
❌ Trading on indicator alone
❌ Fighting strong trends
❌ Ignoring market context
❌ Overtrading
### Recommended Settings by Trading Style:
**Day Trading:** Period 7-10, All alerts ON
**Swing Trading:** Period 14-21, Divergence alerts
**Scalping:** Period 5-7, Signal crosses
**Position Trading:** Period 21-30, Weekly/Daily TF
---
## 🌍 Markets & Timeframes
**Works on all markets:**
- Forex (all pairs)
- Stocks (all exchanges)
- Cryptocurrencies
- Commodities
- Indices
- Futures
**Works on all timeframes:** 1m to Monthly
---
## 📊 How It Works
DAO calculates the ratio of buying pressure to total market pressure:
1. **Calculate Buying Pressure (DemandMax):**
- If current high > previous high: DemandMax = difference
- Otherwise: DemandMax = 0
2. **Calculate Selling Pressure (DemandMin):**
- If previous low > current low: DemandMin = difference
- Otherwise: DemandMin = 0
3. **Apply Smoothing:**
- Calculate SMA of DemandMax over N periods
- Calculate SMA of DemandMin over N periods
4. **Final Formula:**
```
DAO = SMA(DemandMax) / (SMA(DemandMax) + SMA(DemandMin))
```
This produces a normalized value (0-1) representing market demand strength.
---
## 🎯 Trading Strategies
### Strategy 1: Divergence Trading
- Wait for divergence label
- Confirm at support/resistance
- Enter on confirming candle
- Stop loss beyond recent swing
- Target: opposite level or 0.50
### Strategy 2: Overbought/Oversold
- Best for ranging markets
- Wait for extreme readings
- Enter on reversal from extremes
- Target: middle line (0.50)
### Strategy 3: Trend Following
- Identify trend direction first
- Use DAO to time entries in trend direction only
- Enter on pullbacks to oversold (uptrend) or overbought (downtrend)
- Trade with the trend
### Strategy 4: Multi-Timeframe
- Enable MTF feature
- Trade only when both timeframes align
- Higher TF = trend direction
- Lower TF = precise entry
---
## 📂 Category
**Primary:** Oscillators
**Secondary:** Statistics, Volatility, Momentum
---
## 🏷️ Tags
dao, oscillator, momentum, overbought-oversold, divergence, reversal, demand-indicator, price-exhaustion, statistics, volatility, forex, stocks, crypto, multi-timeframe, technical-analysis
---
## ⚠️ Disclaimer
**This indicator is for educational purposes only.** It does not constitute financial advice. Trading involves substantial risk of loss. Always conduct your own research, use proper risk management, and consult with financial professionals before making trading decisions. Past performance does not guarantee future results.
---
## 📄 License
Open source - Free to use for personal trading, modify as needed, and share with attribution.
---
**Version:** 1.0
**Status:** Production Ready ✅
**Pine Script:** v5
**Trademark-Free:** 100% Safe to Publish
---
*Made with 💙 for traders worldwide*

Moving Average ProjectionDisplays 2-5 moving averages (solid lines) and projects their future trajectory (dashed lines) based on current trend momentum. This helps you anticipate where key MAs are heading and identify potential future support/resistance levels.
Important: Projections show where MAs would move IF the current trend continues—they're not predictions. Market conditions change, so use projections as planning tools, not trading signals.
General Settings
Number of MAs (2-5) controls how many moving averages display on your chart. Start with 2-3 to avoid clutter. Projection Bars (1-100) determines how far into the future to project—use 10-20 for intraday charts and 20-40 for daily charts. Lookback for Slope (2-100) sets the number of bars used to calculate trend slope, where shorter lookbacks are more responsive and longer ones are smoother. The default of 20 works well for most situations.
Individual MA Settings (MA 1-5)
Each MA has four settings: Length sets the period for the MA (common values are 9, 20, 50, 100, and 200), Type lets you choose between SMA, EMA, WMA, HMA, VWMA, or RMA (EMA is most popular), Color sets the historical MA line color, and Projection Color sets the projected line color (usually a lighter or transparent version of the main color).
MA Types Quick Reference: EMA is most popular and responsive to recent prices. SMA gives equal weight to all periods and is the smoothest. HMA is very responsive with low lag. VWMA incorporates volume data.
Quick Setup Examples
Day Trading: 3 MAs (9/21/50 EMA), 10-15 projection bars, 10-15 lookback
Swing Trading: 2 MAs (50/200 EMA), 20-30 projection bars, 20 lookback
Scalping: 2 MAs (9/20 EMA), 5-10 projection bars, 5-10 lookback
How to Use
Trend Identification: An uptrend shows price above rising MAs with projections pointing up. A downtrend shows price below falling MAs with projections pointing down. Consolidation appears as flat MAs with horizontal projections.
Support & Resistance: Rising MA projections act as future dynamic support levels, while falling MA projections act as future dynamic resistance levels.
Anticipating Changes: Watch for projected MA crossovers before they happen. When projections converge, expect volatility or consolidation. Steep projections suggest unsustainable trends, so be cautious. Flat projections indicate ranging markets.
Trade Planning: Check the current trend using MA alignment, then look at projections to gauge trend continuation likelihood. Use projected MA levels for potential targets or stop placement.
Important Tips
When Projections Work Best: Projections are most reliable in stable trending markets with consistent momentum, low volatility environments, and away from major news events.
When to Be Cautious: Use caution during high volatility or choppy price action, around major economic releases, when projections show extreme or parabolic angles, and during trend transitions.
Combine With Other Analysis: Don't trade projections alone. Use them alongside price action, volume, support and resistance levels, and other indicators for confirmation.
Best Practices
Start with 2-3 MAs to avoid chart clutter. Match your projection and lookback bars to your trading timeframe. Use consistent color schemes for quick interpretation. Adjust settings as market conditions change. Always use proper risk management—projections are planning tools, not guarantees.
Troubleshooting
Projections not showing: Check that Projection Bars > 0 and you're viewing the most recent bar
Chart too cluttered: Reduce number of MAs or increase projection color transparency
Projections too volatile: Increase lookback bars or switch to EMA/SMA from HMA
Can't see certain MAs: Verify "Number of MAs" setting includes them (MA 3 won't show if set to 2)

MPO4 Lines – Modal Engine█ OVERVIEW
MPO4 Lines – Modal Engine is an advanced multi-line modal oscillator for TradingView, designed to detect momentum shifts, trend strength, and reversal points through candle-based pressure analysis with multiple fast lines and a reference slow line. It features divergence detection on Fast Line A, overbought/oversold return signals, dynamic coloring modes, and layered gradient visualizations for enhanced clarity and decision-making.
█ CONCEPT
The indicator is built upon the Market Pressure Oscillator (MPO) and serves as its expanded evolution, aimed at enabling broader market analysis through multiple lines with varying parameters. It calculates modal pressure using candle body size and direction, weighted against average body size over a lookback period, then normalized and smoothed via EMA. It generates four distinct oscillator lines: a heavily smoothed Slow Line (trend reference), two Fast Lines (A & B) for momentum and support/resistance, and an optional Line 4 for additional confirmation. Divergence is calculated solely on Fast Line A, with visual gradients between lines and bands for intuitive interpretation.
█ WHY USE IT?
- Multi-Layer Momentum: Combines slow trend reference with dual fast lines for precise entry/exit timing.
- Divergence Precision: Bullish/bearish divergences on Fast Line A with labeled confirmation.
- OB/OS Return Signals: Clear buy/sell markers when Fast Line A exits oversold/overbought zones.
- Dynamic Visuals: Gradient fills, line-to-line shading, and band gradients for instant market state recognition.
- Flexible Coloring: Slow Line color by direction or zero-position; fast lines by sign.
- Full Customization: Independent lengths, smoothing, visibility, and transparency — by adjusting the lengths of different lines, you can tailor results for various strategies; for example, enabling Line 4 and tuning its length allows trading based on crossovers between different lines.
█ HOW IT WORKS?
- Candle Pressure Calculation: Body = math.abs(close - open); avgBody = ta.sma(body, len). Direction = +1 (bull), –1 (bear), 0 (neutral). Weight = body / avgBody. Contribution = direction × weight.
- Rolling Sum & Normalization: Sums contributions over lookback, normalizes to ±100 scale (÷ (len × 2) × 100).
Smoothing: Applies primary EMA (smoothLen), with extra EMA on Slow Line for stability.
Line Structure:
- Slow Line = calcCPO(len1=20, smoothLen1=5) → extra EMA (5)
- Fast Line A = calcCPO(len2=6, smoothLen2=7)
- Fast Line B = calcCPO(len3=6, smoothLen3=10)
- Line 4 = calcCPO(len4=14, smoothLen4=1)
Divergence Detection: Uses ta.pivothigh/low on price and Fast Line A (pivotLength left/right). Bullish: lower price low + higher osc low. Bearish: higher price high + lower osc high. Valid within 5–60 bar window.
Signals:
- Buy: Fast Line A crosses above oversold (–30)
- Sell: Fast Line A crosses below overbought (+30)
- Slow Line color flip (direction or zero-cross)
- Divergence labels ("Bull" / "Bear")
- Band Coloring as Momentum Signal:
When Fast Line A ≤ Fast Line B → Overbought band turns red (bearish pressure building)
When Fast Line A > Fast Line B → Oversold band turns green (bullish pressure building) This dynamic coloring serves as visual confirmation of momentum shift following fast line crossovers
Visualization:
- Gradients: Fast B → Zero (multi-layer fade), Fast A ↔ B fill, OB/OS bands
- Dynamic colors: Green/red based on sign or trend
- Zero line + dashed OB/OS thresholds
Alerts: Trigger on OB/OS returns, Slow Line changes, and divergences.
█ SETTINGS AND CUSTOMIZATION
- Line Visibility: Toggle Slow, Fast A, Fast B, Line 4 independently.
Line Lengths:
- Slow Line: Base (20), Primary EMA (5), Extra EMA (5)
- Fast A: Lookback (6), EMA (7)
- Fast B: Lookback (6), EMA (10)
- Line 4: Lookback (14), EMA (1)
- Slow Line Coloring Mode: “Direction” (trend-based) or “Position vs Zero”.
- Bands & Thresholds: Overbought (+30), Oversold (–30), step 0.1.
- Signals: Enable Fast A OB/OS return markers (default: on).
- Divergence: Enable/disable, Pivot Length (default: 2, min 1).
- Colors & Appearance: Full control over bullish/bearish hues for all lines, zero, bands, divergence, and text.
Gradients & Transparency:
- Fast B → Zero: 75 (default)
- Fast A ↔ B fill: 50
- Band gradients: 40
- Toggle each gradient independently
█ USAGE EXAMPLES
The indicator allows users to configure various strategies manually, though no built-in alerts exist for them. Entry signals can include color of fast lines, crossovers between different lines, alignment of colors across lines, or consistency in direction.
- Trend Confirmation: Slow Line above zero + green = bullish bias; below + red = bearish.
- Entry Timing: Buy on Fast A crossing above –30 (circle marker), especially if Slow Line is rising or near zero.
- Reversal Setup: Bullish divergence (“Bull” label) + Fast A in oversold + green gradient band = high-probability long.
- Scalping: Fast A vs Fast B crossover in direction of Slow Line trend.
- Noise Reduction: Increase extraSmoothLen on Slow Line
█ USER NOTES
- Best combined with volume, support/resistance, or trend channels.
- Adjust lookback and smoothing to asset volatility.
- Divergence delay = pivotLength; plan entries accordingly.

(Mustang Algo) Trend 5/15/30/1H + EMA Lines + Aligned Signal═══════════════════════════════════════════════════════════
MUSTANG ALGO - MULTI-TIMEFRAME TREND ALIGNMENT
═══════════════════════════════════════════════════════════
📊 OVERVIEW:
This indicator analyzes trend alignment across four key timeframes (5m, 15m, 30m, 1H) using customizable moving averages. It helps traders identify high-probability setups when multiple timeframes confirm the same trend direction.
🎯 KEY FEATURES:
✓ Multi-Timeframe Analysis (5m/15m/30m/1H)
- Monitors trend direction on 4 different timeframes simultaneously
- Visual table showing real-time trend status for each period
- Optional price display for each timeframe
✓ Flexible Moving Average System
- Choose from 5 MA types: EMA, SMA, SMMA (RMA), WMA, VWMA
- Customizable Fast MA (default: 20) and Slow MA (default: 50)
- Visual cloud between moving averages (green=bullish, red=bearish)
✓ Alignment Signals
- "4x UP" triangle: All 4 timeframes bullish (strong uptrend)
- "4x DOWN" triangle: All 4 timeframes bearish (strong downtrend)
- Signals appear only when ALL timeframes agree
✓ Visual Enhancements
- MA cloud with transparency for better chart readability
- Optional candle coloring based on local trend
- Clean, customizable dashboard display
✓ Alert System
- Built-in alerts for bullish alignment (4 TF aligned up)
- Built-in alerts for bearish alignment (4 TF aligned down)
- Perfect for automated trading setups
📈 HOW TO USE:
1. **Trend Confirmation**: Wait for alignment signals (triangles) before entering trades
2. **Dashboard Monitoring**: Check the top-right table to see individual TF trends
3. **MA Cloud**: Use the cloud as dynamic support/resistance
4. **Entry Timing**: Enter on local timeframe when higher TFs are aligned
⚙️ CUSTOMIZABLE PARAMETERS:
- Fast MA Length (default: 20)
- Slow MA Length (default: 50)
- MA Type (EMA/SMA/SMMA/WMA/VWMA)
- Toggle dashboard display
- Toggle price display in dashboard
- Toggle MA cloud
- Toggle candle coloring
⚠️ BEST PRACTICES:
- Use on 5m or 15m charts for optimal multi-TF analysis
- Combine with price action and volume for best results
- Alignment signals are rare but highly significant
- Not a standalone system - use as confluence tool
💡 STRATEGY IDEAS:
- Scalping: Enter on local TF when all TFs aligned
- Swing Trading: Hold positions while alignment maintained
- Risk Management: Exit if alignment breaks
- Confluence: Combine with support/resistance levels
📌 NOTES:
- Works on all markets (Crypto, Forex, Stocks, Indices)
- Repaints minimally (only on MA calculations)
- Low resource usage, efficient code
═══════════════════════════════════════════════════════════
Created by Mustang Spirit Trading Academy
For educational purposes - Always manage your risk!
═══════════════════════════════════════════════════════════

Twisted Analytics ATR Model ProThe Trend Spotter Indicator is a sophisticated technical analysis tool engineered to identify high-probability trend formations across all timeframes and asset classes. Built with proprietary algorithms, this indicator combines multiple technical methodologies to deliver clear, actionable signals for traders at all experience levels.
What Makes It Unique
Unlike basic moving average systems, the Trend Spotter employs a multi-layered approach that validates trends through:
Multi-Timeframe Analysis: Confirms signals across higher timeframes to filter false positives
Adaptive Volatility Filtering: Adjusts thresholds based on ATR to optimize for both ranging and trending markets
Momentum Confirmation: Validates trend strength using proprietary oscillators before generating signals
Dynamic Trend Strength Measurement: Real-time assessment of trend intensity and potential exhaustion
Key Features
✅ Universal Compatibility: Works seamlessly on crypto, stocks, forex, commodities, and indices
✅ No Repainting: Signals remain fixed once generated - reliable for backtesting and live trading
✅ Customizable Alerts: Set up notifications for trend reversals, breakouts, and momentum shifts
✅ Visual Clarity: Color-coded signals with adjustable display settings
✅ Smart Noise Filtering: Advanced algorithms eliminate market noise and focus on genuine trends
✅ Support/Resistance Detection: Automatically identifies key levels based on trend structure
How It Works
The indicator analyzes price action through four independent validation layers:
Trend Identification: Detects higher highs/lows (uptrend) or lower highs/lows (downtrend)
Momentum Confirmation: Ensures signals align with prevailing momentum
Volatility Analysis: Adapts to changing market conditions using ATR-based thresholds
Signal Validation: Cross-references multiple factors before generating final signals
This multi-factor approach significantly reduces false signals by requiring confirmation from multiple independent analysis methods.
Best Use Cases
Trend Following: Ride major trends from early entry to exhaustion
Breakout Trading: Catch strong momentum moves out of consolidation
Reversal Trading: Identify trend exhaustion and potential reversals
Multi-Timeframe Strategies: Confirm lower timeframe entries with higher timeframe trends
Who Should Use This
Day traders seeking reliable trend signals on intraday charts
Swing traders looking for multi-day trend opportunities
Position traders wanting to identify major trend changes
Both beginner and professional traders who value data-driven decision making
Configuration Flexibility
The indicator offers extensive customization options:
Trend Period: Adjust sensitivity from 5 to 200 bars
Signal Sensitivity: Choose Low/Medium/High based on trading style
Trend Strength Threshold: Filter weak trends (0-100 scale)
Multi-Timeframe Mode: Enable/disable higher timeframe confirmation
Visual Settings: Customize colors, signal size, and labels
Trading Strategy Examples
Trend Following: Enter on initial signal, add on pullbacks, exit on reversal
Breakout Strategy: Wait for consolidation, enter on trend signal breakout
Reversal Strategy: Identify exhaustion, enter on first opposite signal
Scalping: Use high sensitivity on 1-15 min charts for quick trades
Risk Management Note
While the Trend Spotter provides high-probability signals, no indicator guarantees profits. Always use proper risk management:
Risk only 1-2% of capital per trade
Set stop-losses based on technical levels
Combine with volume analysis and support/resistance
Backtest settings on historical data before live trading
What You Get
Professional-grade trend detection algorithm
Real-time signal generation with no lag
Comprehensive parameter customization
Visual clarity with intuitive color coding
Compatible with all TradingView account types
Ongoing updates and improvements
Technical Specifications
Calculation Method: Proprietary multi-factor analysis
Signal Type: Non-repainting trend direction and strength
Overlay: Yes - displays directly on price chart
Alerts: Fully customizable alert conditions
Timeframes: All timeframes from 1-minute to monthly
Asset Classes: Universal - works on all tradable instruments
Support
Published by Twisted Analytics - Professional trading tools built by traders, for traders.

Multi-Timeframe EMA (5 Configurable)Here's a comprehensive description you can use for your indicator:
Multi-Timeframe EMA Indicator (5 Configurable Slots)
Description
This indicator displays up to 5 Exponential Moving Averages (EMAs) from different timeframes simultaneously on a single chart. Perfect for multi-timeframe analysis, it allows traders to visualize key EMAs from intraday to higher timeframes without switching charts.
Key Features
5 Independent EMA Slots: Each slot can be configured with its own timeframe, EMA length, and color
Flexible Configuration: Mix any timeframes and EMA lengths (e.g., 1m EMA 50, 15m EMA 200, 4h EMA 100)
Smart Label Formatting: Automatically displays timeframes in readable format (minutes, hours, or days)
Optional Data Table: Toggle a compact table showing EMA values and price distance percentages
Individual Toggle Controls: Enable/disable each EMA independently without losing settings
Customizable Styling: Adjust colors and line width to match your chart theme
Default Configuration
EMA 1: 1-minute timeframe, EMA 200 (Red)
EMA 2: 5-minute timeframe, EMA 200 (Purple)
EMA 3: 15-minute timeframe, EMA 200 (Yellow)
EMA 4: 1-hour timeframe, EMA 200 (Blue)
EMA 5: 4-hour timeframe, EMA 200 (Orange)
How to Use
Add the indicator to any chart
Configure each EMA slot in the settings:
Timeframe: Choose from 1m, 5m, 15m, 1h, 4h, D, W, M, or custom
Length: Set the EMA period (default 200)
Color: Select a color for easy identification
Enable "Show Line Labels" to see EMA identifiers on the right side
Enable "Show Values Table" for a detailed view of current values and distances
Use Cases
Trend Analysis: Identify alignment across multiple timeframes
Support/Resistance: Use higher timeframe EMAs as dynamic S/R levels
Entry/Exit Timing: Enter on lower timeframe signals near higher timeframe EMAs
Multi-Timeframe Confirmation: Validate setups when price is above/below key EMAs
Scalping: Monitor 1m/5m EMAs while respecting 1h/4h trend direction
Tips
All EMAs update in real-time and move with the chart
Use contrasting colors for easier visual distinction
Disable unused slots to declutter your chart
The table shows percentage distance from current price to each EMA
Works on any symbol and any chart timeframe

Outside Candle Session Breakout [CHE]Outside Candle Session Breakout
Session - anchored HTF levels for clear market-structure and precise breakout context
Summary
This indicator is a relevant market-structure tool. It anchors the session to the first higher-timeframe bar, then activates only when the second bar forms an outside condition. Price frequently reacts around these anchors, which provides precise breakout context and a clear overview on both lower and higher timeframes. Robustness comes from close-based validation, an adaptive volatility and tick buffer, first-touch enforcement, optional retest, one-signal-per-session, cooldown, and an optional trend filter.
Pine version: v6. Overlay: true.
Motivation: Why this design?
Short-term breakout tools often trigger during noise, duplicate within the same session, or drift when volatility shifts. The core idea is to gate signals behind a meaningful structure event: a first-bar anchor and a subsequent outside bar on the session timeframe. This narrows attention to structurally important breaks while adaptive buffering and debouncing reduce false or mid-run triggers.
What’s different vs. standard approaches?
Baseline: Simple high-low breaks or fixed buffers without session context.
Architecture: Session-anchored first-bar high/low; outside-bar gate; close-based confirmation with an adaptive ATR and tick buffer; first-touch enforcement; optional retest window; one-signal-per-session and cooldown; optional EMA trend and slope filter; higher-timeframe aggregation with lookahead disabled; themeable visuals and a range fill between levels.
Practical effect: Cleaner timing at structurally relevant levels, fewer redundant or late triggers, and better multi-timeframe situational awareness.
How it works (technical)
The chart timeframe is mapped to an analysis timeframe and a session timeframe.
The first session bar defines the anchor high and low. The setup becomes active only after the next bar forms an outside range relative to that first bar.
While active, the script tracks these anchors and checks for a breakout beyond a buffered threshold, using closing prices or wicks by preference.
The buffer scales with volatility and is limited by a minimum tick floor. First-touch enforcement avoids mid-run confirmations.
Optional retest requires a pullback to the raw anchor followed by a new close beyond the buffered level within a user window.
Optional trend gating uses an EMA on the analysis timeframe, including an optional slope requirement and price-location check.
Higher-timeframe data is requested with lookahead disabled. Values can update during a forming higher-timeframe bar; waiting and confirmation mitigate timing shifts.
Parameter Guide
Enable Long / Enable Short — Direction toggles. Default: true / true. Reduces unwanted side.
Wait Candles — Minimum bars after outside confirmation before entries. Default: five. More waiting increases stability.
Close-based Breakout — Confirm on candle close beyond buffer. Default: true. For wick sensitivity, disable.
ATR Buffer — Enables adaptive volatility buffer. Default: true.
ATR Multiplier — Buffer scaling. Default: zero point two. Increase to reduce noise.
Ticks Buffer — Minimum buffer in ticks. Default: two. Protects in quiet markets.
Cooldown Bars — Blocks new signals after a trigger. Default: three.
One Signal per Session — Prevents duplicates within a session. Default: true.
Require Retest — Pullback to raw anchor before confirming. Default: false.
Retest Window — Bars allowed for retest completion. Default: five.
HTF Trend Filter — EMA-based gating. Default: false.
EMA Length — EMA period. Default: two hundred.
Slope — Require EMA slope direction. Default: true.
Price Above/Below EMA — Require price location relative to EMA. Default: true.
Show Levels / Highlight Session / Show Signals — Visual controls. Default: true.
Color Theme — “Blue-Green” (default), “Monochrome”, “Earth Tones”, “Classic”, “Dark”.
Time Period Box — Visibility, size, position, and colors for the info box. (Optional)
Reading & Interpretation
The two level lines represent the session’s first-bar high and low. The filled band illustrates the active session range.
“OUT” marks that the outside condition is confirmed and the setup is live.
“LONG” or “SHORT” appears only when the breakout clears buffer, debounce, and optional gates.
Background tint indicates sessions where the setup is valid.
Alerts fire on confirmed long or short breakout events.
Practical Workflows & Combinations
Trend-following: Keep close-based validation, ATR buffer near the default, one-signal-per-session enabled; add EMA trend and slope for directional bias.
Retest confirmation: Enable retest with a short window to prioritize cleaner continuation after a pullback.
Lower-timeframe scalping: Reduce waiting and cooldown slightly; keep a small tick buffer to filter micro-whips.
Swing and position context: Increase ATR multiplier and waiting; maintain once-per-session to limit duplicates.
Timeframe Tiers and Trader Profiles
The script adapts its internal mapping based on the chart timeframe:
Under fifteen minutes → Analysis: one minute; Session: sixty minutes. Useful for scalpers and high-frequency intraday reads.
Between fifteen and under sixty minutes → Analysis: fifteen minutes; Session: one day. Suits day traders who need intraday alignment to the daily session.
Between sixty minutes and under one day → Analysis: sixty minutes; Session: one week. Serves intraday-to-swing transitions and end-of-day planning.
Between one day and under one week → Analysis: two hundred forty minutes; Session: two weeks. Fits swing traders who monitor multi-day structure.
Between one week and under thirty days → Analysis: one day; Session: three months. Supports position traders seeking quarterly context.
Thirty days and above → Analysis: one day; Session: twelve months. Provides a broad annual anchor for macro context.
These tiers are designed to keep anchors meaningful across regimes while preserving responsiveness appropriate to the trader profile.
Behavior, Constraints & Performance
Signals can be validated on closed bars through close-based logic; enabling this reduces intrabar flicker.
Higher-timeframe values may evolve during a forming bar; waiting parameters and the outside-bar gate reduce, but do not remove, this effect.
Resource footprint is light; the script uses standard indicators and a single higher-timeframe request per stream.
Known limits: rare setups during very quiet periods, sensitivity to gaps, and reduced reliability on illiquid symbols.
Sensible Defaults & Quick Tuning
Start with close-based validation on, ATR buffer on with a multiplier near zero point two, tick buffer two, cooldown three, once-per-session on.
Too many flips: increase the ATR multiplier and cooldown; consider enabling the EMA filter and slope.
Too sluggish: reduce the ATR multiplier and waiting; disable retest.
Choppy conditions: keep close-based validation, increase tick buffer, shorten the retest window.
What this indicator is—and isn’t
This is a visualization and signal layer for session-anchored breakouts with stability gates. It is not a complete trading system, risk framework, or predictive engine. Combine it with structured analysis, position sizing, and disciplined risk controls.
Disclaimer
The content provided, including all code and materials, is strictly for educational and informational purposes only. It is not intended as, and should not be interpreted as, financial advice, a recommendation to buy or sell any financial instrument, or an offer of any financial product or service. All strategies, tools, and examples discussed are provided for illustrative purposes to demonstrate coding techniques and the functionality of Pine Script within a trading context.
Any results from strategies or tools provided are hypothetical, and past performance is not indicative of future results. Trading and investing involve high risk, including the potential loss of principal, and may not be suitable for all individuals. Before making any trading decisions, please consult with a qualified financial professional to understand the risks involved.
By using this script, you acknowledge and agree that any trading decisions are made solely at your discretion and risk.
Do not use this indicator on Heikin-Ashi, Renko, Kagi, Point-and-Figure, or Range charts, as these chart types can produce unrealistic results for signal markers and alerts.
Best regards and happy trading
Chervolino

Digital RPM HUD — 4 Feeds + Confidence + Timeline (v3)🏎️ Digital RPM HUD — 4 Feeds + Confidence + Timeline (v3)
A performance-style trading dashboard for momentum-driven traders.
The Digital RPM HUD gives you an instant visual readout of market “engine speed” — combining four customizable data feeds (Trend, Momentum, Volume, Volatility) into a single confidence score (0–100) and a color-coded timeline of regime changes.
Think of it as a racing-inspired control panel: you only “hit the throttle” when confidence is high and all systems agree.
🔧 Key Features
4 Data Feeds – assign your own logic (EMA, RSI, RVOL, ATR, etc.).
Confidence Meter – blends the four feeds into one smooth 0–100 reading.
Timeline Strip – shows recent bullish / bearish / neutral states at a glance.
Visual Trade Cues – optional on-chart LONG / SHORT / EXIT markers.
Fully Customizable – thresholds, weights, smoothing, colors, layout.
HUD Overlay – clean, minimal, and adjustable to any corner of your chart.
💡 How to Use
Configure each feed to reflect your preferred signals (e.g., trend EMA 200, momentum RSI 14, volume RVOL 20, volatility ATR 14).
Watch the Confidence gauge:
✅ Above Bull Threshold → Market acceleration / long bias.
❌ Below Bear Threshold → Momentum loss / short bias.
⚪ Between thresholds → Neutral zone; stay patient.
Use the Timeline to confirm trend consistency — more green = bullish regime, more red = bearish.
⚙️ Recommended Setups
Scalping: Trend EMA 50 + RSI 7 + RVOL 10 + ATR 7 → Fast response.
Intraday: EMA 200 + RSI 14 + RVOL 20 + ATR 14 → Balanced signal.
Swing: Multi-TF Trend + MACD + RVOL + ATR → Smooth and steady.
⚠️ Disclaimer
This script is not a trading strategy and does not execute trades.
All signals are visual aids — always confirm with your own analysis and risk management.

RAF@SSET POWER-7 MA SuiteWhat it is
A clean, lightweight pack of seven moving averages (1m, 5m, 15m, 1H, 4H, 1D, 1W).
HTF lines are confirmed-only (no intra-bar wiggle), so what you see is what closed—no repaint on HTFs. Use it to anchor scalps to higher-timeframe structure without clutter.
Why you’ll like it
1m→1W in one look – see alignment from scalp to swing.
Confirmed HTFs – uses request.security() with lookahead_off and only plots closed values.
Zero fluff – just MAs, fixed colors, ultra-fast.
Your presets – default to my “Power-7” lengths (e.g., 233) or set your own.
SMA/EMA switch – pick your poison globally.
Inputs
Show/hide: 1m, 5m, 15m, 1H, 4H, 1D, 1W
Length per TF (defaults 233)
MA type: SMA / EMA
Color per TF
How it works (short)
Current-TF MA updates live.
Higher TF MAs (5m, 15m, 1H, 4H/“240”, 1D, 1W) only update when their candle closes. That removes “wiggle” and surprise shifts.
Tips
For scalping: trade off LTF, bias from 1H/4H/1D.
For swing: let 1D/1W set bias; use 1H/4H for timing.
Your current chart TF MA is live (by design). If you want it confirmed too, set your chart to the HTF you care about.
Built from my RAF@SSET workflow. Shoutout to everyone who keeps indicators simple and readable.
v1.0: First public release (Pine v6). Seven MAs (1m→1W), confirmed HTFs, fixed colors, SMA/EMA toggle.
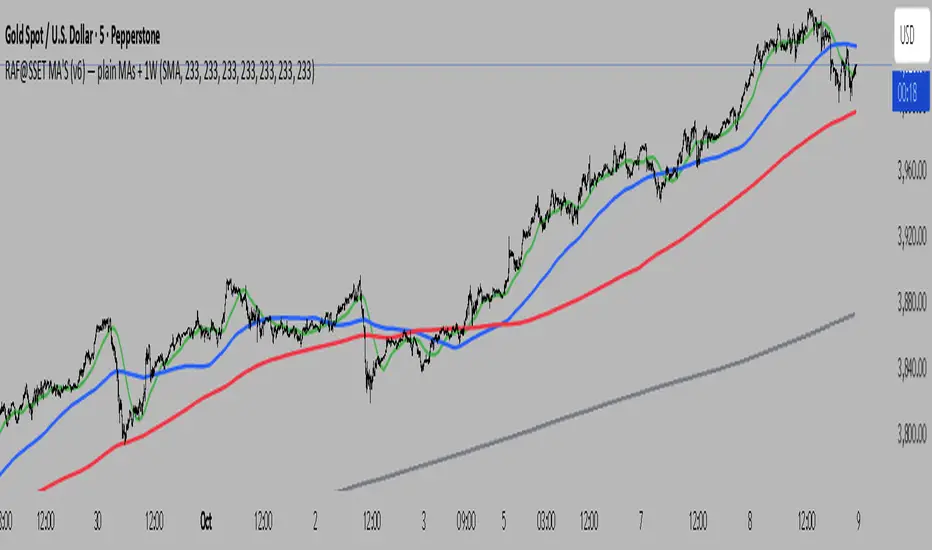
50% Fib Trend Cloud + ATR BandsThis indicator plots two structural 50% fibonacci midpoints from recent confirmed 'left/right' swings that form a *cloud* of equilibrium, then adds a rolling 50% fibonacci range midpoint based on a lookback window that's wrapped in ATR bands. Importantly, it solves a specific trading problem:
Structural midpoints (macro context) are powerful but can lag when price escapes prior ranges. Enter rolling 50% fib + ATR ➡️ which restores real-time balance & tolerance (micro context). Together they show where price is balanced structurally, where it’s balanced right now, and how much volatility to tolerate before acting.
➖➖➖
🔑 Why this is different
Most tools either draw a single midpoint (ex., daily 50%) or ATR bands around a moving average. This script fuses dual swing-based 50% midpoints (structure) + a rolling 50% with ATR (flow), so you don’t lose context when price escapes prior ranges. The cloud tells you who’s in control (fast vs. slow structure). The rolling 50% + ATR tells you how far is “too far” now.
➖➖➖
🧠 What it does (at a glance)
🔸Structural Equilibrium × 2 (Fib1/Fib2)
Two independent 50% midpoints formed from swing pivots (configurable Left/Right bars + optional smoothing). Their gap is the Midpoint Cloud = structural “fair value” zone.
🔸Rolling 50% + ATR Bands
A rolling highest/lowest window computes an always-current 50% rolling midpoint plot; ±ATR × length envelopes define a soft value area and over-stretch boundaries.
🔸Actionable Visuals
Optional fill between Fib1/Fib2, labels, and candle-overlay modes to instantly read regime (above both / below both / between).
🔸Smart Defaults
Timeframe-aware presets for L/R pivots & smoothing; full manual overrides available.
➖➖➖
⚙️ Calculations (plain-English)
🔸Pivot midpoints (Fib1 & Fib2):
1) Detect a swing using `Left/Right` bars
2) Take the swing’s high/low → compute 50%
3) (Optional) Smooth the line (SMA) to stabilize on noisy TFs
4) Repeat with a different sensitivity to get two distinct midpoints
🔸Rolling midpoint:
Highest High / Lowest Low over the last *N* bars → (HH + LL) / 2
🔸ATR levels:
`Upper = Rolling50 + ATR × Mult`, `Lower = Rolling50 − ATR × Mult`
(Typical: ATR length 14–21; Multipliers 2.236 for L1, 5.382 for L2)
➖➖➖
🤖 Auto-Configured Presets (with Manual Override)
💡Goal: make the midpoints “just work” on common timeframes while still letting you dial them in.
💡How Auto Presets work
When Auto Presets = ON, the script picks sensible L/R/S (Left bars / Right bars / Smoothing) for Fib Trend 1 and Fib Trend 2 based on chart timeframe.
🔸Fib 1 (fast) emphasizes *micro-structure* for quicker bias shifts.
🔸Fib 2 (slow) emphasizes *macro-structure* for anchor/bias context.
These defaults keep Fib 1 responsive without jitter and Fib 2 stable without lag.
➡️ Turn Auto Presets = OFF to take full control with the manual inputs described below.
➖➖➖
🛠 Manual Fib Midpoint Settings (when Auto = OFF)
💡Each midpoint uses three knobs:
🔸Pivot Left (L): bars to the left that must be lower/higher to qualify a swing
🔸Pivot Right (R): bars to the right that must be lower/higher to confirm the swing
🔸Smoothing (S): SMA period applied to the raw 50% midpoint (stabilizes noise)
5-Minute optimized defaults
🔸Fib Trend 1: `L21 / R5 / S55` → responsive local structure (entries/exits, re-balancing zones)
🔸Fib Trend 2: `L55 / R13 / S89` → broader structure (trend context, anchors/stops)
Timeframe guidance
🔸1m–3m: may feel a touch laggy → consider ~`L13 / R3 / S34`
🔸15m–1h: defaults remain strong → optionally ~`L34 / R8 / S89`
🔸4h+ : increase span for stability → `L89–144 / R13–21 / S144–233`
➡️ Rule of thumb: shorter L/R = faster detection, longer S = smoother line. Tune until Fib 1 captures the “active swing” and Fib 2 captures the “dominant swing” without whipsaw.
➖➖➖
🎛 Inputs (quick reference)
🔸Fib Trend 1/2: Source (High/Low/Close), Left/Right bars, Smoothing length, Show/Hide, Cloud fill toggle
🔸Rolling 50%: Lookback length, Price basis (Wicks/Close/HLC3/OHLC4), Plot scope (Full / Last N / None)
🔸ATR Bands: ATR length, Multipliers (L1/L2), Plot scope, Line width/colors
🔸Overlay & Labels: Candle overlay mode, Label padding/size, 50% centerline toggle, Plot widths
➖➖➖
🖍️ Candle Coloring & Overlay Modes
💡Purpose: make trend instantly visible on the candles and ATR levels.
1) Color Logic (dropdown)
🔸 Fib Midpoints — Colors by position of price vs. Fib 1 & Fib 2
🔸ATR Zones — Colors by which ATR zone price is in relative to the Rolling 50%
➡️ Price Reference: Choose the input used for the decision (Close, HL2, OHLC3, OHLC4).
➡️Tip: Close is crisp; HL2/OHLC variants are smoother.
2) Overlay Style (dropdown)
🔸 None — No visual change to candles
🔸 Bar Color — Uses `barcolor()` to tint built-in candles (this takes into account your Trading View settings, for instance if you have wicks set to white, they will show up as white with this setting)
🔸 PlotCandles — Draws unified custom candles (body, wick, border) with the same color for maximum clarity
💡Practical use
🔸 Pick Fib Midpoints to read structural bias at a glance (above/below/between the cloud).
🔸 Pick ATR Zones to read value vs. stretch around the Rolling 50% (mean-reversion vs. trend extension).
➖➖➖
📘 How to use
A) Trend confirmation
- Strong bullish bias when price holds above both structural mids; strong bearish when below both.
- Use the Rolling 50% + ATR as a dynamic re-entry zone: pullbacks that respect ATR(L1) often continue the prevailing trend.
B) Transition / mean reversion
- Inside the Cloud (between Fib1 & Fib2) treat behavior as neutralization/re-balancing; range tactics tend to outperform momentum plays.
- In ranges, fades near ±ATR around the rolling 50% can mark short-term edges.
C) Breakout context
- When price leaves the Cloud, the Rolling 50% keeps you anchored so price never feels “floating.” A clean hold outside ATR(L1/L2) suggests regime strength; quick re-entries hint at traps.
➖➖➖
🖼 Chart examples
➡️ Each snapshot shows how the Cloud (structure) and the Rolling 50% + ATR (flow) work together.
1) 1-Minute Downtrend – Cloud as Dynamic Ceiling
- The Cloud slopes down; pullbacks repeatedly fail under the Cloud’s underside.
- Rolling 50% (dashed mid) + ATR(L1) act as a reversion band: rallies stall near upper ATR and rotate lower.
2) 15-Minute Persistent Drift – Structure Guides, Flow Times Entries
- Long drift lower with Cloud overhead.
- Consolidations near the rolling mid resolve in the trend direction; ATR bands frame risk on each attempt.
3) 15-Minute Uptrend (BTC) – From Cloud Escape to Value Stair-Step
- After escaping the prior Cloud, rolling 50% + ATR establish a new higher value area.
- Pullbacks into ATR(L1) produce orderly stair-steps; Cloud remains supportive on deeper dips
4) 5-Minute BTC – Pullback to Value then Rotate
- Strong leg up; retrace tags lower ATR band and rotates back toward the rolling mid.
- Labels (Fib1/Fib2) make the structural context explicit for decision-making.
➖➖➖
🧪 Starter presets
- Intraday (5–15m): Fib1 ~ L21/R5 (smooth 5), Fib2 ~ L55/R13 (smooth 9) • Rolling = 55 • ATR = 14 • L1 = 2.5x, L2 = 5.0x
- Scalping: Shorten lookbacks & smoothing; keep ATR multipliers similar, or tighten L1.
- Swing: Lengthen all lookbacks; consider ATR length 21–28.
➖➖➖
🏁Final Word
This script is not just a visual tool, it’s a complete trend and structure framework. Whether you're looking for clean trend alignment, dynamic support/resistance, or early warning signs of a reversal, this system is tuned to help you react with confidence — not hindsight.
Rembember, no single indicator should be used in isolation. For best results, combine it with price action analysis, higher-timeframe context, and complementary tools like trendlines, moving averages etc Use it as part of a well-rounded trading approach to confirm setups — not to define them alone.
---
💡Turn logic into clarity. Structure into trades. And uncertainty into confidence.

Trend Fib Zone Bounce (TFZB) [KedArc Quant]Description:
Trend Fib Zone Bounce (TFZB) trades with the latest confirmed Supply/Demand zone using a single, configurable Fib pullback (0.3/0.5/0.6). Trade only in the direction of the most recent zone and use a single, configurable fib level for pullback entries.
• Detects market structure via confirmed swing highs/lows using a rolling window.
• Draws Supply/Demand zones (bearish/bullish rectangles) from the latest MSS (CHOCH or BOS) event.
• Computes intra zone Fib guide rails and keeps them extended in real time.
• Triggers BUY only inside bullish zones and SELL only inside bearish zones when price touches the selected fib and closes back beyond it (bounce confirmation).
• Optional labels print BULL/BEAR + fib next to the triangle markers.
What it does
Finds structure using confirmed swing highs/lows (you choose the confirmation length).
Builds the latest zone (bullish = demand, bearish = supply) after a CHOCH/BOS event.
Draws intra-zone “guide rails” (Fib lines) and extends them live.
Signals only with the trend of that zone:
BUY inside a bullish zone when price tags the selected Fib and closes back above it.
SELL inside a bearish zone when price tags the selected Fib and closes back below it.
Optional labels print BULL/BEAR + Fib next to triangles for quick context
Why this is different
Most “zone + fib + signal” tools bolt together several indicators, or fire counter-trend signals because they don’t fully respect structure. TFZB is intentionally minimal:
Single bias source: the latest confirmed zone defines direction; nothing else overrides it.
Single entry rule: one Fib bounce (0.3/0.5/0.6 selectable) inside that zone—no counter-trend trades by design.
Clean visuals: you can show only the most recent zone, clamp overlap, and keep just the rails that matter.
Deterministic & transparent: every plot/label comes from the code you see—no external series or hidden smoothing
How it helps traders
Cuts decision noise: you always know the bias and the only entry that matters right now.
Forces discipline: if price isn’t inside the active zone, you don’t trade.
Adapts to volatility: pick 0.3 in strong trends, 0.5 as the default, 0.6 in chop.
Non-repainting zones: swings are confirmed after Structure Length bars, then used to build zones that extend forward (they don’t “teleport” later)
How it works (details)
*Structure confirmation
A swing high/low is only confirmed after Structure Length bars have elapsed; the dot is plotted back on the original bar using offset. Expect a confirmation delay of about Structure Length × timeframe.
*Zone creation
After a CHOCH/BOS (momentum shift / break of prior swing), TFZB draws the new Supply/Demand zone from the swing anchors and sets it active.
*Fib guide rails
Inside the active zone TFZB projects up to five Fib lines (defaults: 0.3 / 0.5 / 0.7) and extends them as time passes.
*Entry logic (with-trend only)
BUY: bar’s low ≤ fib and close > fib inside a bullish zone.
SELL: bar’s high ≥ fib and close < fib inside a bearish zone.
*Optionally restrict to one signal per zone to avoid over-trading.
(Optional) Aggressive confirm-bar entry
When do the swing dots print?
* The code confirms a swing only after `structureLen` bars have elapsed since that candidate high/low.
* On a 5-min chart with `structureLen = 10`, that’s about 50 minutes later.
* When the swing confirms, the script plots the dot back on the original bar (via `offset = -structureLen`). So you *see* the dot on the old bar, but it only appears on the chart once the confirming bar arrives.
> Practical takeaway: expect swing markers to appear roughly `structureLen × timeframe` later. Zones and signals are built from those confirmed swings.
Best timeframe for this Indicator
Use the timeframe that matches your holding period and the noise level of the instrument:
* Intraday :
* 5m or 15m are the sweet spots.
* Suggested `structureLen`:
* 5m: 10–14 (confirmation delay \~50–70 min)
* 15m: 8–10 (confirmation delay \~2–2.5 hours)
* Keep Entry Fib at 0.5 to start; try 0.3 in strong trends, 0.6 in chop.
* Tip: avoid the first 10–15 minutes after the open; let the initial volatility set the early structure.
* Swing/overnight:
* 1h or 4h.
* `structureLen`:
* 1h: 6–10 (6–10 hours confirmation)
* 4h: 5–8 (20–32 hours confirmation)
* 1m scalping: not recommended here—the confirmation lag relative to the noise makes zones less reliable.
Inputs (all groups)
Structure
• Show Swing Points (structureTog)
o Plots small dots on the bar where a swing point is confirmed (offset back by Structure Length).
• Structure Length (structureLen)
o Lookback used to confirm swing highs/lows and determine local structure. Higher = fewer, stronger swings; lower = more reactive.
Zones
• Show Last (zoneDispNum)
o Maximum number of zones kept on the chart when Display All Zones is off.
• Display All Zones (dispAll)
o If on, ignores Show Last and keeps all zones/levels.
• Zone Display (zoneFilter): Bullish Only / Bearish Only / Both
o Filters which zone types are drawn and eligible for signals.
• Clean Up Level Overlap (noOverlap)
o Prevents fib lines from overlapping when a new zone starts near the previous one (clamps line start/end times for readability).
Fib Levels
Each row controls whether a fib is drawn and how it looks:
• Toggle (f1Tog…f5Tog): Show/hide a given fib line.
• Level (f1Lvl…f5Lvl): Numeric ratio in . Defaults active: 0.3, 0.5, 0.7 (0 and 1 off by default).
• Line Style (f1Style…f5Style): Solid / Dashed / Dotted.
• Bull/Bear Colors (f#BullColor, f#BearColor): Per-fib color in bullish vs bearish zones.
Style
• Structure Color: Dot color for confirmed swing points.
• Bullish Zone Color / Bearish Zone Color: Rectangle fills (transparent by default).
Signals
• Entry Fib for Signals (entryFibSel): Choose 0.3, 0.5 (default), or 0.6 as the trigger line.
• Show Buy/Sell Signals (showSignals): Toggles triangle markers on/off.
• One Signal Per Zone (oneSignalPerZone): If on, suppresses additional entries within the same zone after the first trigger.
• Show Signal Text Labels (Bull/Bear + Fib) (showSignalLabels): Adds a small label next to each triangle showing zone bias and the fib used (e.g., BULL 0.5 or BEAR 0.3).
How TFZB decides signals
With trend only:
• BUY
1. Latest active zone is bullish.
2. Current bar’s close is inside the zone (between top and bottom).
3. The bar’s low ≤ selected fib and it closes > selected fib (bounce).
• SELL
1. Latest active zone is bearish.
2. Current bar’s close is inside the zone.
3. The bar’s high ≥ selected fib and it closes < selected fib.
Markers & labels
• BUY: triangle up below the bar; optional label “BULL 0.x” above it.
• SELL: triangle down above the bar; optional label “BEAR 0.x” below it.
Right-Panel Swing Log (Table)
What it is
A compact, auto-updating log of the most recent Swing High/Low events, printed in the top-right of the chart.
It helps you see when a pivot formed, when it was confirmed, and at what price—so you know the earliest bar a zone-based signal could have appeared.
Columns
Type – Swing High or Swing Low.
Date – Calendar date of the swing bar (follows the chart’s timezone).
Swing @ – Time of the original swing bar (where the dot is drawn).
Confirm @ – Time of the bar that confirmed that swing (≈ Structure Length × timeframe after the swing). This is also the earliest moment a new zone/entry can be considered.
Price – The swing price (high for SH, low for SL).
Why it’s useful
Clarity on repaint/confirmation: shows the natural delay between a swing forming and being usable—no guessing.
Planning & journaling: quick reference of today’s pivots and prices for notes/backtesting.
Scanning intraday: glance to see if you already have a confirmed zone (and therefore valid fib-bounce entries), or if you’re still waiting.
Context for signals: if a fib-bounce triangle appears before the time listed in Confirm @, it’s not a valid trade (you were too early).
Settings (Inputs → Logging)
Log swing times / Show table – turn the table on/off.
Rows to keep – how many recent entries to display.
Show labels on swing bar – optional tags on the chart (“Swing High 11:45”, “Confirm SH 14:15”) that match the table.
Recommended defaults
• Structure Length: 10–20 for intraday; 20–40 for swing.
• Entry Fib for Signals: 0.5 to start; try 0.3 in stronger trends and 0.6 in choppier markets.
• One Signal Per Zone: ON (prevents over trading).
• Zone Display: Both.
• Fib Lines: Keep 0.3/0.5/0.7 on; turn on 0 and 1 only if you need anchors.
Alerts
Two alert conditions are available:
• BUY signal – fires when a with trend bullish bounce at the selected fib occurs inside a bullish zone.
• SELL signal – fires when a with trend bearish bounce at the selected fib occurs inside a bearish zone.
Create alerts from the chart’s Alerts panel and select the desired condition. Use Once Per Bar Close to avoid intrabar flicker.
Notes & tips
• Swing dots are confirmed only after Structure Length bars, so they plot back in time; zones built from these confirmed swings do not repaint (though they extend as new bars form).
• If you don’t see a BUY where you expect one, check: (1) Is the active zone bullish? (2) Did the candle’s low actually pierce the selected fib and close above it? (3) Is One Signal Per Zone suppressing a second entry?
• You can hide visual clutter by reducing Show Last to 1–3 while keeping Display All Zones off.
Glossary
• CHOCH (Change of Character): A shift where price breaks beyond the last opposite swing while local momentum flips.
• BOS (Break of Structure): A cleaner break beyond the prior swing level in the current momentum direction.
• MSS: Either CHOCH or BOS – any event that spawns a new zone.
Extension ideas (optional)
• Add fib extensions (1.272 / 1.618) for target lines.
• Zone quality score using ATR normalization to filter weak impulses.
• HTF filter to only accept zones aligned with a higher timeframe trend.
⚠️ Disclaimer This script is provided for educational purposes only.
Past performance does not guarantee future results.
Trading involves risk, and users should exercise caution and use proper risk management when applying this strategy.

VWAP Momentum Oscillator How It Works
Core Calculation Method
The oscillator combines four key market measurements into a single, normalized reading:
1. Price-VWAP Deviation: `(Close - VWAP) / VWAP × 100`
2. VWAP-MA Momentum: `(VWAP - MovingAverage) / MovingAverage × 100`
3. Anchored VWAP Strength: Average of high/low anchor deviations from rolling VWAP
4. Range Position: `(Close - PeriodLow) / (PeriodHigh - PeriodLow) × 100 - 50`
Dynamic Signal Line
The signal line uses an EMA that automatically adjusts its length based on your chart timeframe:
- Futures: Always covers 23 hours of trading (1,380 minutes)
- Stocks: Always covers 6.5 hours of trading (390 minutes)
- Examples: 276 periods on 5-min futures chart, 1,380 periods on 1-min futures chart
Trading Signals
🟢 Buy Signals
- Condition: Main oscillator crosses above signal line while below zero
- Logic: Momentum turning bullish from oversold conditions
- Visual: Green "BUY" label below price action
🔴 Sell Signals
- Condition: Main oscillator crosses below signal line while above zero
- Logic: Momentum turning bearish from overbought conditions
- Visual: Red "SELL" label above price action
⚠️ Extreme Warnings
- Extreme Overbought: Red triangle when oscillator crosses above +4.0
- Extreme Oversold: Green triangle when oscillator crosses below -4.0
- Purpose: Risk management alerts, not entry/exit signals
Oscillator Zones
Interpretation Guide
- Above +2.0: Strong bullish momentum zone (green background)
- 0 to +2.0: Mild bullish territory
- 0 to -2.0: Mild bearish territory
- Below -2.0: Strong bearish momentum zone (red background)
- Above +4.0: Extreme overbought (caution advised)
- Below -4.0: Extreme oversold (potential reversal zone)
Customization Options
Moving Average Settings
- EMA/SMA Toggle: Choose between exponential or simple moving average
- Color Customization: Adjust MA line color and width
Visual Controls
- Bullish/Bearish Colors: Customize momentum zone colors
- Signal Line: Toggle visibility and adjust color
- Line Widths: Control thickness of all plot lines
Anchor Modes
- NY Session Only: Anchors reset at NY market open (9:30 AM ET)
- 24H NY Day: Anchors reset at NY calendar day change (midnight ET)
Best Practices
Timeframe Selection
- Scalping: 1-5 minute charts for quick momentum changes
- Day Trading: 5-15 minute charts for clearer trend signals
- Swing Trading: 1-4 hour charts for major momentum shifts
Signal Confirmation
- Wait for crossovers: Don't trade on oscillator position alone
- Respect extreme levels: Exercise caution above +4 or below -4
- Use with price action: Combine with support/resistance levels
Risk Management
- Extreme zones: Reduce position size when oscillator is extended
- Failed signals: Exit quickly if momentum doesn't follow through
- Market context: Consider overall trend direction and market volatility
Technical Specifications
Calculation Components
- Base Length: 1,380 periods (futures) / 390 periods (stocks)
- Signal Line: Dynamic EMA covering one full trading day
- Smoothing: 3-period SMA on raw oscillator (adjustable)
- Update Frequency: Real-time on every price tick
Performance Notes
- Resource Efficient: Optimized calculations minimize CPU usage
- Memory Friendly: Uses incremental VWAP calculations
- Fast Loading: Minimal historical data requirements
Version History & Development
This oscillator evolved from advanced VWAP overlay strategies, transforming complex multi-line analysis into a single, actionable momentum gauge. The indicator maintains the sophistication of institutional VWAP analysis while providing the clarity needed for retail trading decisions.
Core Philosophy
Traditional VWAP indicators show where price is relative to volume-weighted averages, but they don't quantify momentum or provide clear entry/exit signals. This oscillator solves that problem by normalizing all VWAP relationships into a single, bounded indicator that works consistently across all timeframes and asset classes.
---
Open Source License: This indicator is provided free for the TradingView community. Feel free to modify and enhance according to your trading needs.

Enhanced Chande Momentum OscillatorEnhanced Chande Momentum Oscillator (Enh CMO)
📊 Description
The Enhanced Chande Momentum Oscillator is an advanced version of the classic Chande Momentum Oscillator with dynamic envelope boundaries that automatically adapt to market volatility. This indicator provides clear visual signals for potential price reversals and momentum shifts.
Key Features:
Original Chande Momentum Oscillator calculation
Dynamic upper and lower boundaries based on statistical analysis
Adaptive envelope that adjusts to market volatility
Visual fill area between boundaries for easy interpretation
Real-time values table with current readings
Built-in alert conditions for boundary touches
Customizable moving average types (SMA, EMA, WMA)
⚙️ Settings
CMO Settings:
CMO Length (9): Period for calculating the base Chande Momentum Oscillator
Source (close): Price source for calculations
Envelope Settings:
Envelope Length (20): Lookback period for calculating the moving average and standard deviation
Envelope Multiplier (1.5): Multiplier for standard deviation to create upper/lower bounds
Moving Average Type (EMA): Type of moving average for envelope calculation
📈 How to Use
Visual Elements
Lines:
White Line: Main Chande Momentum Oscillator
Red Line: Upper boundary (resistance level)
Green Line: Lower boundary (support level)
Yellow Line: Moving average of CMO (trend direction)
Purple Fill: Visual envelope between boundaries
Reference Lines:
Zero Line: Neutral momentum level
+50/-50 Lines: Traditional overbought/oversold levels
Trading Signals
🔴 Sell/Short Signals
CMO touches or crosses above upper boundary → Potential bearish reversal
CMO is above +50 and declining → Weakening bullish momentum
CMO crosses below yellow MA line while above zero → Momentum shift
🟢 Buy/Long Signals
CMO touches or crosses below lower boundary → Potential bullish reversal
CMO is below -50 and rising → Weakening bearish momentum
CMO crosses above yellow MA line while below zero → Momentum shift
⚡ Advanced Signals
Boundary contraction → Decreasing volatility, potential breakout coming
Boundary expansion → High volatility period, use wider stops
CMO hugging upper boundary → Strong uptrend continuation
CMO hugging lower boundary → Strong downtrend continuation
🎯 Trading Strategies
Strategy 1: Reversal Trading
Wait for CMO to touch extreme boundaries (red or green lines)
Look for divergence with price action
Enter counter-trend position when CMO starts moving back toward center
Set stop beyond the boundary breach point
Take profit near zero line or opposite boundary
Strategy 2: Momentum Confirmation
Use CMO direction to confirm trend
Enter positions when CMO crosses above/below yellow MA line
Hold positions while CMO remains on the correct side of MA
Exit when CMO crosses back through MA line
Strategy 3: Volatility Breakout
Monitor boundary width (envelope expansion/contraction)
When boundaries contract significantly, prepare for breakout
Enter in direction of CMO breakout from narrow range
Use boundary expansion as confirmation signal
⚠️ Important Notes
Best Timeframes
Scalping: 1m, 5m charts
Day Trading: 15m, 30m, 1H charts
Swing Trading: 4H, Daily charts
Market Conditions
Trending Markets: Focus on momentum confirmation signals
Ranging Markets: Focus on boundary reversal signals
High Volatility: Increase envelope multiplier (1.8-2.5)
Low Volatility: Decrease envelope multiplier (1.0-1.3)
Risk Management
Always use stop losses beyond boundary levels
Reduce position size during boundary expansion periods
Combine with price action and support/resistance levels
Monitor the real-time table for precise entry/exit levels
🔔 Alerts
The indicator includes built-in alert conditions:
"CMO Above Upper Bound": Potential reversal down signal
"CMO Below Lower Bound": Potential reversal up signal
Set these alerts to catch opportunities without constantly monitoring charts.
💡 Tips for Success
Combine with other indicators: Use with RSI, MACD, or volume indicators for confirmation
Watch for divergences: CMO making new highs/lows while price doesn't follow
Use multiple timeframes: Check higher timeframe CMO for overall trend context
Adjust settings for different assets: Crypto may need different settings than forex
Paper trade first: Test the indicator with your trading style before using real money
🎨 Customization Tips
Change colors in the Pine Script to match your chart theme
Adjust envelope length for faster (shorter) or slower (longer) signals
Modify envelope multiplier based on asset volatility
Hide the table if it obstructs your view by commenting out the table section
Complete trading solution: Pair with the Optimus Indicator (paid indicator) for multi-timeframe trend analysis and trend signals.
Together they create a powerful confluence system for professional trading setups.
