Futures SignalThis is a Futures Signal Indictor works using support & resistance and market trend, it is designed for all type of markets (crypto, forex, stock etc.) and works on all commonly used timeframes (preferably on 5 Min, 15 Min Candles).
How it works Futures Signal Indictor :
Core logic behind this indicator is to finding the Support and Resistance , we find the Lower High (LH) and Higher Low (HL) to find the from where the price reversed (bounced back) and also we use a custom logic for figuring out the peak price in the last few candles. Based on the multiple previous Support and Resistance (HH, HL, LL LH) we calculate a price level, this price level is used a major a factor for entering the trade. Once we have the price level we check if the current price crosses that price level, if it crossed then we consider that as a long/short entry (based on whether it crosses resistance or support line that we calculated). Once we have pre long/short signals we further filter it based on the market trend to prevent too early/late signals. Along with this if we don't see a clear trend we do the filtering by checking how many support or resistance level the price has bounced off.
Stop Loss and Take Profit: We have also added printing SL and TP levels on the chart to make the it easier for everyone to find the SL/TP values. Script calculates the SL value by checking the previous support level for LONG trade and previous resistance level for SHORT trades. Take profit are calculated in 0.5 ratio as of now.
In den Scripts nach "scalping" suchen

Bollinger Bands Scalper + VWAPGet more consistent scalps by trading in-between Bollinger Band Deviations.
FEATURES:
1) 3 Bollinger Bands with default settings to 1, 2, and 3 deviations for more consistent scalps
2) Trendicator: a dynamic color changing moving average that helps you see trend quickly
3) Robust VWAP tool with up to 3 different deviations as well as different anchor points to help you see strong support and resistances
4) Calming "purple cloud" color palette helps you focus on price action
5) Discover new trading strategies with a wide range of customizability

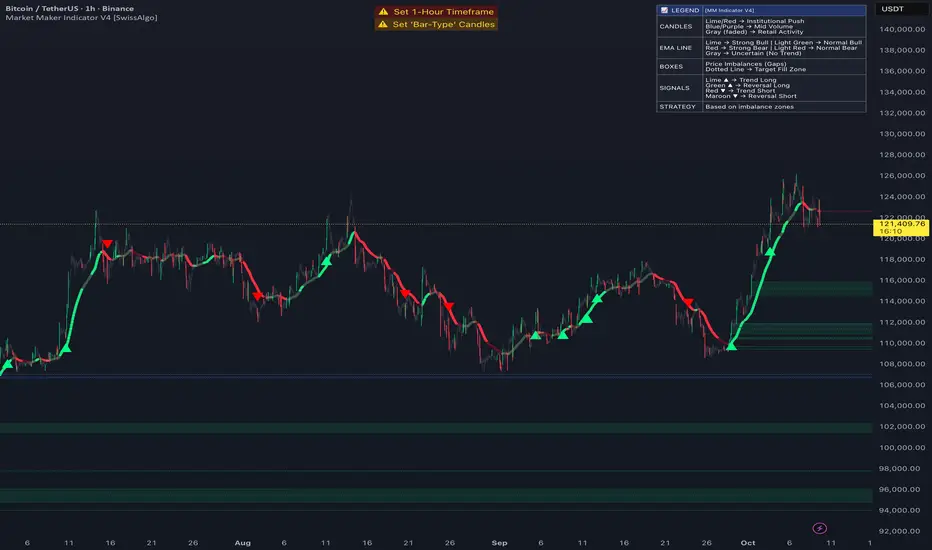
Market Maker Indicator V2 [tecnocrypto]This indicator is based on the idea that prices are generated by the interaction between a Market Maker on one side (sometimes also called the "Composite Man") and Retail Traders on the other side (Retail Traders include simple retail, professional traders, whales, institutions...as a single entity). These two opposite entities "play" the trading game on trading platforms/exchanges (crypto), which are neutral to the game.
Market makers are liquidity providers, and make profits either by charging a spread between buy and sell prices, and (also) by trapping retail traders into specific positions.
Trading is a "zero sum" game in the sense that it generates a transfer of resources between these two specific players, which are indeed the Market Maker and Retail Traders. If Retail Traders are in profit, Market Maker is (temporarily) in loss, and viceversa. Market Maker goal is to squeeze profits out of Retail Traders, by inducing them to take wrong positions.
The Market Maker Method Indicator executes the following:
1) Identifies and plots candles that are generated by the Market Maker's moves (called "Shift Candles"); shift candles are "artificial" price/volumes moves, generated to induce retail traders into specific zones which are, essentially, traps. They are called Shift Candles as they generate abnormal (and mostly unexpected) price movements in either direction. They move the price from one zone to the next to execute the Market Maker strategy. Observe how often sudden (apparent) prices increases are followed by price crashes (stop hunt rise, drop); and observe how often sudden (apparent) price collapses are followed by price uptrends (stop hunt low, rise); sometimes these movements are made in progressive steps (generally, 3).
2) Plots open long/open short alerts based on the assumption that when Market Maker plots upwards shift candles, vivid green color, they are preparing for an upcoming price reversal (down); same, but opposite sign, for downwards shift candles. This is a counterintuitive logic for Retail Traders, that generally open long when price is rising, and open shorts when price is falling - jumping into Market Makers traps.
3) Plots the areas where price is expected to return (upwards or downwards) based on previous shift candles (called "Recovery Zones")
You can use this indicator on any timeframe and for any asset.
The Market Maker indicator V2 provides long / short entry signals based upon the market maker manipulative moves described above.
Long alerts are triggered by manipulative price push-downs by the marker maker, which will be followed by price increases (while price was decreasing, market maker was purchasing from retail). Additional factors are taken into consideration to plot long entry signals, , mainly volume build up and mean reversion, around this basic concept.
Short alerts are triggered by manipulative price push-ups by the marker maker, which will be followed by price drops (while price was increasing, market maker was selling to retail). Additional factors are taken into consideration to plot short entry signals, mainly volume build up and mean reversion, around this basic concept.
The indicator is based on the Traders Reality indicator, but improved with alerts, that can be used with trading bots, and additional possibilities to customize the behavior of the indicator.
A strategy associated with this indicator is also available.
Best results on the 1H timeframe.
Contact me for further info.

[BT] - ScalpMaster [ALERTS] v1Go easy on this script as it's my first, hopefully more to come!
ScalpMaster - V1
It's main feature is catch a bull run for volatile markets. Two main selling triggers (CCI and TSSL) with an option to only sell after fees are met (for profit).
Built in Statistics and Back-testing
I've introduced my own version of backtesting built into the main script. You can disable it if it's too much, just makes it easier to dial the settings in and compare with alert triggering. I've included this on all of my scripts.
***You will get a warning that this script repaints, however you can easily compare alerts against the labels. I'm not entirely sure, but I believe the repainting is due to the Global Stats Label at the end gets repainted to keep in the front. ***
Directions
Buy: When dialing in the script, watch the purple line above the source, when the current price crosses above this purple line then the buying trigger sets.
Sell: TSSL - Trailing Stop / Stop Limit, use available settings to manipulate behavior. It's meant to trail the bull run and sell once the price crosses the bottom tssl bar
Sell: CCI - Modify the FastMA and SlowMA settings
Sell: P+ - Above won't trigger until you are in the positive after the fees x2 are met. Great to keep your losses minimal. Combine this with a high Stop Loss for great results but might be waiting awhile for a profit.

Scalp Master V 1.0The Scalp Master is designed for new and experienced trainers to get a better understanding of sudden direction changes in the cryptocurrencies markets, by displaying just 2 basic signals: "Up" or "Down".
It combines the T.A of a group of indicators to give you the most sensitive tool to catch a Pump or Dump before it happens. It also includes one of the most basic and powerful tools to understand how the market is going to behave: Bollinger Bands, if we get an "Up" signal near the lower Bollinger band, we might be close to a good pump and if we get a "Down" signal near the top Bollinger band a dump in the price will most likely happen.
Enjoy!!!

TraderTroys 5MMSRTraderTroys 5 Minute Major Support / Resistance Indicator
This is to only be used on the 5 minute time frame. It's sole purpose is to reveal up coming major support and resistance.
Green = Less reliable
Yellow = More reliable
Red = Very reliable
However, I would recommend back testing this *by applying it to your chart and watching how price action plays with the lines.*
I would not recommend only trading based off this indicator, but use it as a form of confluence with others.
It's built around multiplications of the average price.
Here is a great example of it working:

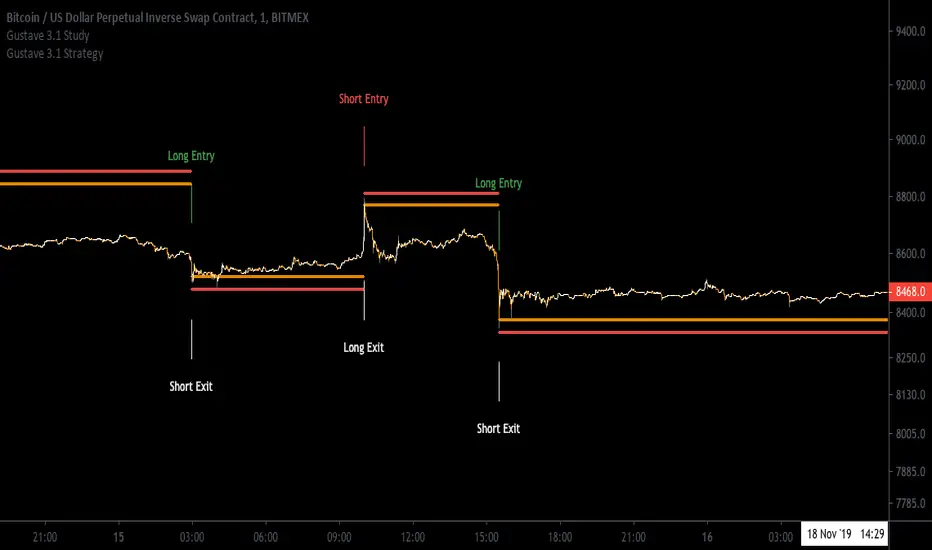
[Aill3urs V.1.0.P] Study GustaveIt's the Study of the this Strategy-Gustave you can find below.
For any info DM me.
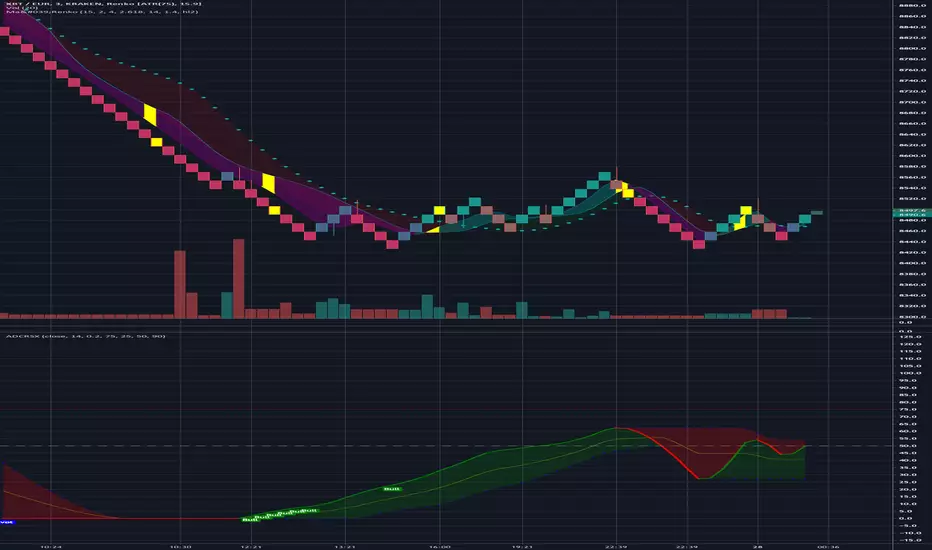
Ma'RenkoMa'Renko is simple, yet powerful trading system designed to help scalpers who use Renko charts (including ATR-based, but it should work with any type of candles as well). The thickness of color bands represents different trend characteristics (mostly volume and speed of price changing) which allow a trader to filter out false pivot points, enter and exit more wisely. The chart speaks for itself.
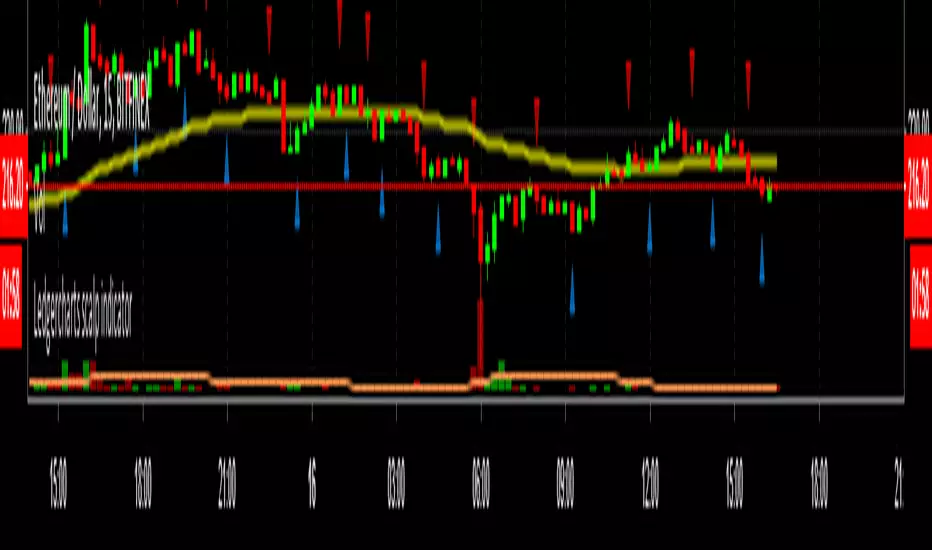
Ledgercharts scalp indicatorI'm using this indicator for finding scalp opportunities with high volume crypto coins. To be used in combination with support & resistance levels and/or other indicators.
Works best on a 15-minute timeframe.
DISCLAIMER:
This script is not intended as financial advice and is for educational purposes only. Do your own research by verifying the accuracy of the information and know that your decisions are your own.
Institutional Dominance/Trapped Trader Profile @MaxMaserati 3.0📊 Institutional Dominance & Trapped Trader Delta Profile
@MaxMaserati 3.0
═════════════════════════════════════════════════════════════
🎯 OVERVIEW
The IDT Auction Profile is a professional-grade volume order flow analysis tool that reveals where institutional traders hold Positional Advantage and where retail participants are Trapped. Unlike traditional Volume Profile indicators, the IDT Profile integrates Volume Point Delta (VPD) analysis with advanced pattern recognition to identify the exact price levels where profitable institutional positions create support/resistance, and where losing positions are forced to exit.
This indicator answers the critical questions: Who is in profit? Who is trapped? And where will they defend or exit their positions?
═════════════════════════════════════════════════════════════
✨ FEATURES
═════════════════════════════════════════════════════════════
⚡ Quick Presets - One-click configuration for:
• Scalper (1m-5m): 75 bars, 50 rows, ★3 confluence
• Day Trader (15m-1h): 150 bars, 60 rows, ★3 confluence
• Swing Trader (4h-D): 300 bars, 80 rows, ★4 confluence
🔔 Price Alerts - Get notified when price touches:
• VAH (Value Area High) - Resistance zone
• VAL (Value Area Low) - Support zone
• Adjustable sensitivity (0.05% - 1.0%)
📏 POC Line Extensions - Historical context lines extending left from key institutional levels
👻 Previous Session POCs - Dotted reference lines showing prior period levels (carry-over zones)
📊 Real-Time Statistics Panel:
• Total Volume
• Net Delta
• Buy/Sell Pressure %
🎨 Visual Enhancements:
• Column dividers for clarity
• Transparency controls
• Profile auto-hide when price moves away
• Cached color schemes for 30% performance boost
═════════════════════════════════════════════════════════════
🧠 CORE CONCEPT: DOMINANCE VS TRAPPED POSITIONING
═════════════════════════════════════════════════════════════
The indicator categorizes all market participants into two strategic positions based on their entry price relative to current market price:
📍 ABOVE CURRENT PRICE (Resistance Zones)
🔴 Aggressive Sellers in Profit - Sold higher, currently winning. Will defend positions or add to winners.
🟥 Trapped Buyers at Loss - Bought higher, currently losing. Must exit at breakeven, creating resistance.
📍 BELOW CURRENT PRICE (Support Zones)
🟢 Aggressive Buyers in Profit - Bought lower, currently winning. Will defend positions or add to winners.
🟩 Trapped Sellers at Loss - Sold lower, currently losing. Must cover at breakeven, creating support.
⚡ MAXIMUM CONFLUENCE ZONES
When Dominant (Profitable) and Trapped (Loss) positions align at the same level, you get the strongest support/resistance zones:
🟧 Orange Boxes (Above Price) = Aggressive Sellers + Trapped Buyers = STRONGEST RESISTANCE
🟨 Yellow Boxes (Below Price) = Aggressive Buyers + Trapped Sellers = STRONGEST SUPPORT
═════════════════════════════════════════════════════════════
📊 VOLUME ANALYSIS COLUMNS
═════════════════════════════════════════════════════════════
1️⃣ VPD Column (Volume Point Delta)
Net aggressive pressure at each price level (Buying Volume - Selling Volume)
- Bullish Delta (Green): Buyers dominated the auction at this level
- Bearish Delta (Red): Sellers dominated the auction at this level
- Smart Coloring: Automatically highlights institutional patterns
2️⃣ VPS Column (Volume Point of Sell - ASK Volume)
Aggressive buying volume that "lifted the offer" by hitting ask prices
- Represents participants who paid the ask price to enter long
- When price is below this level = These buyers are in profit
- When price is above this level = These sellers who got hit are in profit
- Shows institutional bid volume absorption
3️⃣ VPB Column (Volume Point of Buy - BID Volume)
Aggressive selling volume that "hit the bid" by taking bid prices
- Represents participants who sold at bid price to enter short
- When price is above this level = These sellers are in profit
- When price is below this level = These buyers who got hit are in profit
- Shows institutional ask volume absorption
4️⃣ SVP Column (Optional - Session Volume Profile)
Traditional combined volume profile without bid/ask separation
═════════════════════════════════════════════════════════════
🔍 ADVANCED INSTITUTIONAL PATTERNS DETECTION
═════════════════════════════════════════════════════════════
The indicator uses statistical analysis (standard deviation, moving averages, hit counting) to identify institutional footprints:
⚡ Failed Auctions - "BUYERS TRAPPED" or "SELLERS TRAPPED" labels
• High volume entered, but price immediately reversed
• Creates extreme concentrations of losing positions
• Trading Implication: High-probability reversal zones where trapped participants must exit
📈 Volume Spikes - Bright green/red bars in VPD column
• Volume exceeds average by 2+ standard deviations
• Represents aggressive institutional entry
• Trading Implication: Potential trend continuation or setup for failed auction
🛡️ Absorption Zones - Yellow/Orange colored bars
• Large passive orders absorbing aggressive volume without price movement
• Indicates accumulation (bullish) or distribution (bearish)
• Trading Implication: Institutional positioning before major moves
🧊 Iceberg Orders - Cyan colored bars with high hit counts
• Same price level shows repeated volume without clearing
• Reveals hidden institutional limit orders split into small pieces
• Trading Implication: Strong liquidity magnets, price often returns here
💜 Volume Exhaustion - Purple colored bars
• Sharp volume drop (50%+) after spike
• Momentum exhausted, participants depleted
• Trading Implication: Potential reversal or consolidation ahead
═════════════════════════════════════════════════════════════
🎨 SMART INSTITUTIONAL COLORING
═════════════════════════════════════════════════════════════
Colors bars based on detected patterns vs simple red/green:
🟨 Yellow = Bullish battles won (buyers + trapped sellers)
🟧 Orange = Bearish battles won (sellers + trapped buyers)
🔵 Cyan = Iceberg orders (hidden liquidity)
🟣 Purple = Large passive orders
🟢 Bright Green = Buying spikes (institutional aggression)
🔴 Bright Red = Selling spikes (institutional aggression)
═════════════════════════════════════════════════════════════
⭐ CONFLUENCE SCORING SYSTEM
═════════════════════════════════════════════════════════════
Each price level receives 1-5 stars based on:
★★ Volume spike presence (+2 stars)
★ Absorption pattern (+1 star)
★ Large passive orders (+1 star)
★ Proximity to Value Area (+1 star)
★★ Iceberg detection (+2 stars)
★★ Failed auction (+2 stars)
Minimum Signal Strength filter lets you show only levels with ★3+ confluence for highest-quality signals.
═════════════════════════════════════════════════════════════
🎯 VALUE AREA ANALYSIS
═════════════════════════════════════════════════════════════
VAH (Value Area High) - Blue Line
- Top of the 70% volume acceptance zone
- Price at VAH often rejects downward (resistance)
- Alert triggers when price approaches
VAL (Value Area Low) - Red Line
- Bottom of the 70% volume acceptance zone
- Price at VAL often bounces upward (support)
- Alert triggers when price approaches
Trading Applications:
- Price outside Value Area → Mean reversion opportunity
- Price breaks VA with volume → Trend continuation
- Price oscillates within VA → Range-bound, fade extremes
- Previous session VA lines show carryover levels
═════════════════════════════════════════════════════════════
📋 EXPECTED PRICE BEHAVIOR AT KEY LEVELS
═════════════════════════════════════════════════════════════
⚠️ IMPORTANT: These are observed behavioral patterns for educational purposes and backtesting research. Always validate with 250-500+ backtest trades before risking capital.
1️⃣ POC BOX ZONES (Highest Statistical Relevance)
🟨 Yellow Boxes (Below Current Price - SUPPORT)
Expected Behavior:
- Price approaching from above typically encounters buying pressure
- Both profitable institutional buyers and trapped short sellers create demand
- Common reaction: Price slows, consolidates, or bounces
- Failed bounces often lead to rapid breakdown (trapped buyers capitulate)
What Often Happens:
- Initial dip into zone → Weak bounce attempt
- Second test → Stronger bounce (trapped sellers covering + buyers defending)
- Break below → Quick acceleration as both groups exit
🟧 Orange Boxes (Above Current Price - RESISTANCE)
Expected Behavior:
- Price rallying into zone typically encounters selling pressure
- Both profitable institutional sellers and trapped long buyers create supply
- Common reaction: Price stalls, consolidates, or rejects
What Often Happens:
- Initial push into zone → Weak rejection
- Second test → Stronger rejection (trapped buyers exiting + sellers defending)
- Break above → Quick acceleration as resistance becomes support
2️⃣ FAILED AUCTION ZONES
"SELLERS TRAPPED" Labels (Below Price):
- High-volume selling that immediately reversed = maximum trapped shorts
- When price returns, trapped sellers face pressure to cover
- Typical pattern: Price approaches → Initial hesitation → Sharp bounce
"BUYERS TRAPPED" Labels (Above Price):
- High-volume buying that immediately failed = maximum trapped longs
- Price returning forces trapped buyers to exit at breakeven
- Typical pattern: Price approaches → Distribution → Rejection
3️⃣ VALUE AREA DYNAMICS
Price Outside Value Area (VAH/VAL):
- Price beyond 70% volume zone = statistical outlier
- Two outcomes: Mean reversion OR trend continuation
- Key differentiator: Presence of confluence zones
Mean Reversion Pattern (No Strong Confluence):
- Price extends 1-2% beyond VA → Typically reverts toward POC
- Weak volume on extension → Higher probability of reversal
Breakout Pattern (With ★4+ Confluence):
- Price breaks VA with institutional patterns → Often continues
- Strong volume + confluence = New value area forming
4️⃣ ICEBERG ORDER BEHAVIOR
Cyan Bars with High Hit Counts:
- Repeated volume at same level = Large hidden order absorbing
- Price typically "tests" iceberg multiple times before resolution
- Two outcomes: Absorption complete (break) OR rejection (bounce)
5️⃣ VOLUME SPIKE PATTERNS
Bright Green/Red Bars (Institutional Aggression):
- Extreme delta spikes indicate institutional entry
- Trend Continuation Spikes: Spike aligned with trend = Often continues
- Exhaustion Spikes: Spike against trend = Failed auction forming
═════════════════════════════════════════════════════════════
⚙️ CONFIGURATION GUIDE
═════════════════════════════════════════════════════════════
🎯 QUICK START
1. Select your trading style preset (Scalper/Day/Swing)
2. Enable VAH/VAL alerts in settings
3. Adjust alert sensitivity (0.1% recommended)
4. Add alert condition to TradingView alert system
📊 CORE SETTINGS
- Lookback Period: How many bars to analyze
- Scalping: 50-100 bars
- Day Trading: 100-200 bars
- Swing Trading: 200-500 bars
- Price Row Granularity: How finely to divide price
- 40-50 rows = Fast markets
- 60-80 rows = Balanced (RECOMMENDED)
- 100+ rows = Maximum precision
- Minimum Signal Strength: Filter weak signals
- ★3 = Balanced quality/quantity (RECOMMENDED)
- ★4-5 = Highest quality, fewer opportunities
🎨 VISUAL SETTINGS
- Color Theme: Classic/Institutional/Monochrome/Bold/Minimal/Custom
- Smart Coloring: ON (recommended) - Shows institutional patterns
- Transparency: Adjust profile opacity
- Column Dividers: Visual separators between columns
- POC Extensions: Show historical level significance
📈 ADVANCED FEATURES
- Auto-Hide Distance: Hide profile when price moves X% away
- Statistics Panel: Real-time metrics display
- Previous POCs: Show prior session levels
- Alert Sensitivity: How close price must be to trigger alerts
═════════════════════════════════════════════════════════════
💡 BEST PRACTICES
═════════════════════════════════════════════════════════════
✅ Start with defaults (200 lookback, 60 rows, ★3 confluence, Smart Coloring ON)
✅ Focus on POC boxes first - These are your highest-probability zones
✅ Combine with price action - Use the profile to explain WHY support/resistance exists
✅ Watch for alignment - Yellow/Orange boxes = strongest levels
✅ Respect failed auctions - "TRAPPED" labels are extreme reversal setups
✅ Use Value Area for context - Price outside VA = mean reversion opportunity
✅ Trust confluence scores - ★4-5 signals are institutional-grade setups
✅ Set up alerts for VAH/VAL touches - Don't miss key levels
✅ Check previous session POCs - Institutions defend same zones across sessions
✅ Monitor statistics panel - Understand market conviction in real-time
═════════════════════════════════════════════════════════════
🔧 TECHNICAL SPECIFICATIONS
═════════════════════════════════════════════════════════════
Calculation Method: Enhanced delta using OHLC and volume with wick ratio analysis
Update Frequency: Real-time on every bar close
Performance: Optimized with color caching and pre-calculated values (~30% faster)
Max Capacity: Supports up to 1500 bars lookback and 250 price rows
Compatibility: Works on all symbols and timeframes
Memory Usage: Efficient array management with proper initialization
Alert System: Built-in VAH/VAL touch detection with visual markers
═════════════════════════════════════════════════════════════
🎯 UNIQUE VALUE PROPOSITION
═════════════════════════════════════════════════════════════
Unlike standard Volume Profile indicators that only show where volume occurred, the IDT Auction Profile:
✅ Separates bid vs ask volume to reveal true order flow
✅ Identifies who is profitable vs who is trapped at each level
✅ Detects institutional patterns (icebergs, absorption, failed auctions)
✅ Calculates confluence scores combining multiple factors
✅ Provides clear POC boxes showing exact institutional positioning
✅ Maps positional advantage rather than just volume density
✅ Alerts you to key level touches in real-time
✅ Shows historical context with POC extensions
✅ Displays live statistics for market conviction
This transforms Volume Profile from a historical volume chart into a strategic positioning map showing institutional dominance and trapped participants.
═════════════════════════════════════════════════════════════
📖 HOW TO INTEGRATE WITH YOUR STRATEGY
═════════════════════════════════════════════════════════════
✅ PROPER USES:
- Entry refinement within your existing setups
- Intelligent stop placement beyond institutional levels
- Objective profit targets at next confluence zones
- Trade filtering (only take setups at ★4+ zones)
- Understanding market positioning before entry
- Alert-based monitoring of key support/resistance levels
❌ WHAT IT CANNOT DO:
- Predict direction with certainty
- Replace risk management
- Account for news/external events
- Guarantee profitability
- Work in all market conditions
═════════════════════════════════════════════════════════════
📚 DEVELOPMENT PATH (12-16 Weeks)
═════════════════════════════════════════════════════════════
Weeks 1-2: Observation Only
- Watch price behavior at key levels
- Document patterns without trading
- Set up alerts and observe responses
Weeks 3-8: Paper Trading
- Simulate trades, track all metrics
- Minimum 100 paper trades
- Test different confluence thresholds
Weeks 9-16: Small Size Testing
- Minimal capital, real market conditions
- Continue tracking, refine rules
- Adjust alert sensitivity based on results
After Proven Edge you could potentially include it in your set-up
═════════════════════════════════════════════════════════════
⚠️ CRITICAL DISCLAIMERS
═════════════════════════════════════════════════════════════
⚠️ Past volume ≠ Future price action
⚠️ Institutional positions change rapidly - these are static snapshots
⚠️ No indicator works 100% - risk management is mandatory
⚠️ Market conditions change - adapt your approach
⚠️ Backtest with YOUR style, YOUR timeframe, YOUR risk tolerance
⚠️ Alerts are notifications, not trade signals - you decide the action
The indicator reveals WHERE institutions are positioned and HOW they might behave. YOU decide IF, WHEN, and HOW to trade that information.
═════════════════════════════════════════════════════════════
📞 SUPPORT & UPDATES
═════════════════════════════════════════════════════════════
For questions, suggestions, or bug reports:
- Comment below the indicator
- Follow for updates and new features
- Check documentation for detailed examples
═════════════════════════════════════════════════════════════
Not financial advice. For educational and research purposes only.

Momentum by Trading BiZonesSqueeze Momentum Indicator with EMA
Overview
The Squeeze Momentum Indicator with EMA is a powerful technical analysis tool that combines the original Squeeze Momentum concept with an Exponential Moving Average (EMA) overlay. This enhanced version helps traders identify market momentum, volatility contractions (squeezes), and potential trend reversals with greater precision.
Core Concept
The indicator operates on the principle of volatility contraction and expansion:
Squeeze Phase: When Bollinger Bands move inside the Keltner Channel, indicating low volatility and potential energy buildup
Expansion Phase: When momentum breaks out of the squeeze, signaling potential directional moves
Key Components
1. Squeeze Momentum Calculation
Formula: Momentum = Linear Regression(Close - Average Price)
Where Average Price = (Highest High + Lowest Low + SMA(Close)) / 3
Visualization: Histogram bars showing positive (green) and negative (red) momentum
Zero Line: Represents equilibrium point between buyers and sellers
2. EMA Overlay
Purpose: Smooths momentum values to identify underlying trends
Customization:
Adjustable period (default: 20)
Toggle on/off display
Customizable color and line thickness
Cross Signals: Buy/sell signals when momentum crosses above/below EMA
3. Volatility Bands
Bollinger Bands (20-period, 2 standard deviations)
Keltner Channels (20-period, 1.5 ATR multiplier)
Squeeze Detection: Visual background shading when BB are inside KC
Trading Signals
Buy Signals (Green Upward Triangle)
Momentum histogram crosses ABOVE EMA line
Occurs during or after squeeze release
Confirmed by expanding histogram bars
Sell Signals (Red Downward Triangle)
Momentum histogram crosses BELOW EMA line
Often precedes market downturns
Watch for increasing negative momentum
Squeeze Warnings (Gray Background)
Market in low volatility state
Prepare for potential breakout
Direction indicated by momentum bias
Indicator Settings
Main Parameters
Length: Period for calculations (default: 20)
Show EMA: Toggle EMA visibility
EMA Period: Smoothing period for EMA
Visual Settings
Histogram color-coding based on momentum direction
EMA line color and thickness
Signal marker size and visibility
Squeeze zone background display
Practical Applications
Trend Identification
Uptrend: Consistently positive momentum with EMA support
Downtrend: Consistently negative momentum with EMA resistance
Range-bound: Oscillating around zero line
Entry/Exit Points
Conservative Entry: Wait for squeeze release + EMA crossover
Aggressive Entry: Anticipate breakout during squeeze
Exit: Opposite crossover or momentum divergence
Risk Management
Use squeeze zones as warning periods
EMA crossovers as confirmation signals
Combine with support/resistance levels
Advanced Interpretation
Momentum Strength
Strong Bullish: Tall green bars above EMA
Weak Bullish: Short green bars near EMA
Strong Bearish: Tall red bars below EMA
Weak Bearish: Short red bars near EMA
Divergence Detection
Price makes higher high, momentum makes lower high → Bearish divergence
Price makes lower low, momentum makes higher low → Bullish divergence
Squeeze Characteristics
Long squeezes: More potential energy
Frequent squeezes: Choppy market conditions
No squeezes: High volatility, trending markets
Recommended Timeframes
Scalping: 1-15 minute charts
Day Trading: 15-minute to 4-hour charts
Swing Trading: 4-hour to daily charts
Position Trading: Daily to weekly charts
Best Practices
Confirmation
Use with volume indicators
Check higher timeframe direction
Wait for candle close confirmation
Filtering Signals
Ignore signals during extreme volatility
Require minimum bar size for crossovers
Consider market context (news, sessions)
Combination Suggestions
With RSI: Confirm overbought/oversold conditions
With Volume Profile: Identify high-volume nodes
With Support/Resistance: Key level reactions
With Trend Lines: Breakout confirmations
Limitations
Lagging indicator (based on past data)
Works best in trending markets
May give false signals in ranging markets
Requires proper risk management
Conclusion
The Squeeze Momentum Indicator with EMA provides a comprehensive view of market dynamics by combining volatility analysis, momentum measurement, and trend smoothing. Its visual clarity and customizable parameters make it suitable for traders of all experience levels seeking to identify high-probability trading opportunities during volatility contractions and expansions.

HTF Candle Overlay
This custom indicator is designed to help traders see *Higher Timeframe (HTF)* price action without leaving their current (lower timeframe) chart. It overlays the body and wicks of a larger candle (e.g., 4-hour or Daily) directly onto your 5-minute or 15-minute chart.
Key Functions
1. *Multi-Timeframe Visualization:* It draws the Open, High, Low, and Close of a higher timeframe candle (like the 4-hour) on top of your current chart.
2. *Live Projection:* As the live market moves, the indicator projects the expected width of the current HTF candle, allowing you to see it forming in real-time.
3. *Custom Styling:* You can toggle the background fill on/off and customize colors for bullish/bearish borders and backgrounds separately.
Practical Trading Uses
* Trend Alignment: Traders often use this to ensure they are trading in the direction of the higher timeframe trend. For example, if the 4-hour candle is green (Bullish), you might only look for buy setups on the 5-minute chart.
* Support & Resistance: The High and Low of the previous HTF candle often act as strong support or resistance levels. This indicator makes those levels immediately visible.
* Engulfing Patterns: You can easily spot if the current price action is "engulfing" the previous HTF candle, which can be a powerful reversal signal.
* Context for Scalping: Scalpers use this to avoid shorting into a strong bullish HTF candle or buying into a bearish one. It keeps you aware of the "bigger picture."."

SMC + OB + FVG + Reversal + UT Bot + Hull Suite – by Fatich.id🎯 7 INTEGRATED SYSTEMS:
✓ Mxwll Suite (SMC + Auto Fibs + CHoCH/BOS)
✓ UT Bot (Trend Signals + Label Management)
✓ Hull Suite (Momentum Analysis)
✓ LuxAlgo FVG (Fair Value Gaps)
✓ LuxAlgo Order Blocks (Volume Pivots) ⭐ NEW
✓ Three Bar Reversal (Pattern Recognition)
✓ Reversal Signals (Momentum Count Style)
⚡ KEY FEATURES:
• Smart Money Structure (CHoCH/BOS/I-CHoCH/I-BoS)
• Auto Fibonacci (10 customizable levels)
• Order Block Detection (Auto mitigation)
• Fair Value Gap Tracking
• Session Highlights (NY/London/Asia)
• Volume Activity Dashboard
• Multi-Timeframe Support
• Clean Label Management
🎨 PERFECT FOR:
• Smart Money Concept Traders
• Order Flow & Liquidity Analysis
• Support/Resistance Trading
• Trend Following & Reversals
• Multi-Timeframe Analysis
💡 RECOMMENDED SETTINGS:
Clean Charts: OB Count 3, UT Signals 3, FVG 5
Detailed Analysis: OB Count 5-10, All Signals
Scalping: Low sensitivity, Hull 20-30
Swing Trading: High sensitivity, Hull 55-100

TraderDemircan - Ultimate Fibonacci Suite v2.0Ultimate Fibonacci Suite v2.0 - Advanced Harmonic Pattern Detection & XABCD Analysis
-Overview
The Ultimate Fibonacci Suite v2.0 is a comprehensive technical analysis tool that combines advanced Fibonacci retracement/extension levels with automatic harmonic pattern detection and XABCD formation analysis. This indicator is designed for traders who want to identify high-probability reversal zones using multiple confluence techniques.
-What Makes This Script Original?
This indicator goes beyond simple Fibonacci retracements by:
Automatic XABCD Formation Detection: Identifies complete X-A-B-C-D patterns in real-time, marking each critical point with precise Fibonacci relationships
Multi-Pattern Harmonic Recognition: Detects 5 major harmonic patterns (Gartley, Butterfly, Bat, Crab, Shark) with customizable tolerance levels
Confluence Zone Analysis: Automatically identifies areas where multiple Fibonacci levels converge, highlighting the strongest support/resistance zones
Integrated Risk Management: Calculates position sizing, stop-loss placement, and multiple take-profit targets based on pattern completion
Adaptive Mode Selection: Offers preset configurations for different trading styles (Scalper, Day Trader, Swing Trader)
-Key Features
Fibonacci Levels (15 levels available)
Standard retracement levels: 0.236, 0.382, 0.5, 0.618, 0.786
Extension levels: 1.272, 1.414, 1.618, 2.0, 2.618, 3.618, 4.236
All levels individually customizable with color and visibility options
Harmonic Pattern Detection
The indicator automatically identifies these harmonic patterns with their specific Fibonacci ratios:
Gartley Pattern (B: 0.618, D: 0.786) - 75% historical success rate
Butterfly Pattern (B: 0.786, D: 1.272-1.618) - 70% success rate
Bat Pattern (B: 0.382-0.5, D: 0.886) - 80% success rate
Crab Pattern (B: 0.382-0.618, D: 1.618) - 85% success rate
Shark Pattern (B: 0.382-0.618, D: 1.13-1.618) - 72% success rate
Each pattern displays its probability percentage and clearly marks the Potential Reversal Zone (PRZ).
XABCD Formation System
X Point: Initial swing low (0.0 level)
A Point: Peak of the move (1.0 level)
B Point: Retracement level (typically 0.382, 0.5, or 0.618)
C Point: Projected target for the corrective move
D Point (PRZ): The optimal entry zone for reversal trades
The system validates formations to ensure B point hasn't been violated and minimum swing size requirements are met.
Risk Management Tools
Automatic Stop-Loss Calculation: Placed below X point with buffer
Three Take-Profit Levels: TP1 (1.272), TP2 (1.618), TP3 (2.0) - all customizable
Position Size Calculator: Based on account size and risk percentage
Risk/Reward Ratio Display: Real-time R:R calculation for each setup
Confluence Zone Detection
Identifies areas where 2+ Fibonacci levels intersect within 0.5% price range
Highlights these zones with colored boxes
Customizable threshold for confluence detection (2-5 levels)
Trend Filter
Optional moving average filter (customizable period)
Can restrict pattern display to trend-aligned setups only
Visual trend indication on chart
-How It Works?
The indicator uses a sophisticated algorithm that:
Scans for Swing Points: Analyzes the last N bars (customizable 10-200) to identify significant swing lows and highs
Validates Swing Size: Filters out minor movements using a minimum swing size percentage threshold
Calculates Fibonacci Levels: Projects all retracement and extension levels from the identified X and A points
Monitors Price Action: Tracks current price to determine B point formation
Projects Targets: Calculates C and D targets based on the pattern's Fibonacci relationships
Pattern Recognition: Compares B retracement ratio against known harmonic pattern specifications
Risk Parameters: Automatically sets stop-loss and take-profit levels with position sizing
-Customization Options
Four Trading Modes:
Complete: All features enabled
Scalper: Optimized for short-term trades with tighter parameters
Day Trader: Balanced settings for intraday trading
Swing Trader: Longer-term focus with extended lookback periods
Display Settings:
Individual level visibility toggles
Custom colors for each Fibonacci level
Line style options (Solid, Dashed, Dotted)
Line thickness adjustment
Label display options (price/percentage/both)
Line extension controls (left/right/both)
Alert System:
Pattern completion alerts
C target achievement notifications
Key Fibonacci level breakout alerts
All alerts customizable on/off
-How to Use?
Apply the Indicator: Add to your chart and select your trading mode
Wait for Formation: The indicator will automatically detect valid XABCD formations
Identify Pattern Type: Check the pattern label to see which harmonic pattern is forming
Monitor Price Action: Watch for price to reach the D point (PRZ) - your potential entry zone
Execute Trade: Enter when price reaches D with:
Stop loss at the displayed SL level
Take profits at TP1, TP2, and TP3 levels
Use Confluence: Pay extra attention to setups where D point aligns with confluence zones
-Recommended Settings
For Scalping: Lookback 20-30 bars, Min Swing 0.5%, Tight TP levels
For Day Trading: Lookback 50 bars (default), Min Swing 1%, Standard TP levels
For Swing Trading: Lookback 100-150 bars, Min Swing 2%, Extended TP levels
Pattern Tolerance: 5% (default) - increase for more patterns, decrease for stricter detection
-Statistics Panel
Optional real-time statistics display showing:
Current pattern type and probability
Risk/reward ratio
Recommended position size
Distance to key levels
-Important Notes
This indicator does not repaint: All calculations are based on closed bars
Past performance is not indicative of future results: Use proper risk management
Best used with additional confirmation: Consider volume, trend context, and other indicators
Pattern completion does not guarantee reversal: Always use stop-losses
Optimized for trending markets: Works best when clear swings are present
-Technical Details
Pine Script Version: v6 (latest)
Overlay: Yes - plots directly on price chart
Max Lines/Labels/Boxes: 500 each
Calculation Method: Based on classical Fibonacci ratios and harmonic trading principles
No Repainting: All signals generated on bar close
-Educational Value
This indicator helps traders understand:
Fibonacci retracement/extension relationships
Harmonic pattern geometry and ratios
XABCD pattern structure
Confluence trading concepts
Risk management principles
-Who Is This For?
Traders familiar with Fibonacci analysis
Harmonic pattern traders
Price action traders looking for objective entry zones
Risk-conscious traders who want built-in money management
Anyone seeking to identify high-probability reversal zones

EBC 310 Pullback EngineEBC 310 Pullback Engine
A proprietary momentum oscillator designed specifically for identifying high-probability pullback entries in trending markets.
📊 What It Does:
The EBC 310 Pullback Engine calculates the difference between 3-period and 10-period simple moving averages, then smooths this differential with a 16-period moving average to identify momentum shifts and trend exhaustion points.
🎯 How To Use:
For LONG Entries (Pullback in Uptrend):
Wait for fast line (histogram) to dip below zero line
Enter when fast line turns GREEN (momentum returning)
Best when slow line is above zero (confirming uptrend)
For SHORT Entries (Pullback in Downtrend):
Wait for fast line to spike above zero line
Enter when fast line turns RED (momentum failing)
Best when slow line is below zero (confirming downtrend)
🔧 Features:
✅ Color-Coded Momentum:
Green bars = Rising momentum (bullish)
Red bars = Falling momentum (bearish)
Blue bars = No change (consolidation)
✅ Trend Confirmation:
Blue slow line = Rising trend strength
Purple slow line = Weakening trend
Orange slow line = Trend pause
✅ Zero Line Reference:
Gray line marks equilibrium
Above = bullish bias
Below = bearish bias
⚙️ Settings:
3-10 Diff Moving Average Window: Default 16
Lower values (10-12) = More sensitive, faster signals
Higher values (20-25) = Smoother, fewer false signals
💡 Trading Strategy:
Identify overall trend direction on higher timeframe
Wait for pullback (fast line crosses zero against trend)
Enter when momentum returns (color change with trend)
Exit when fast line crosses zero in opposite direction
📈 Best Timeframes:
Scalping: 1-5 min charts
Day Trading: 15-30 min charts
Swing Trading: 1H-4H charts
⚠️ Risk Disclaimer:
This indicator is a momentum tool and should be used in conjunction with proper risk management, support/resistance levels, and additional confirmation signals. No indicator guarantees profitable trades.

AI Chakra for Global Markets by Pooja🌐 AI Chakra for Global Markets by Pooja
⚡ Advanced Multi-Signal Trading Framework for Forex & Crypto
AI Chakra is a complete institutional-grade market analysis system, combining
Trend + Structure + Momentum + Volatility + Breakouts + Multi-TF Context + Smart Levels
into a single clean and powerful charting tool.
Designed especially for Forex and Crypto, where speed, precision and clarity matter most.
✨ Key Features
1️⃣ 🎯 Smart Auto Buy/Sell Signal System
Signals appear only when multiple conditions align:
✔️ Buy Sell Signals include:
🟢 Supertrend in bullish zone
💪 RSI momentum in upper strength zone
🔄 CHoCH or BOS supporting upward shift
🚀 Breakout above key levels (Prev-Day High)
⚙️ Optional filters: ADX-Volatility + RSI-MA Protection
✔️ Sell Signals include:
🔴 Supertrend bearish
📉 RSI in weakness zone
🔄 CHoCH/BOS supporting downward structure
🕳️ Breakout below previous-day low
⚙️ Optional filters for momentum validation
📌 Signals are printed as clean labels — visually distinct and easy to interpret.
2️⃣ 🧠 Smart Money Concepts (SMC Suite)
Built-in structural analysis for professional traders:
🔶 CHoCH (Change of Character)
🔷 BOS (Break of Structure)
Every CHoCH/BOS is plotted with:
Horizontal structural level
Precision labels
ATR-adjusted spacing to avoid overlap
Perfect for identifying:
✔️ Trend reversals
✔️ Continuation breaks
✔️ Manipulation zones
✔️ Smart entry areas
3️⃣ 📊 Multi-Timeframe Trend Dashboard (Top-Down View)
A clean institutional-level dashboard across:
1m ▸ 5m ▸ 15m ▸ 30m ▸ 1H ▸ 4H ▸ 1D ▸ 1W ▸ 1M
Each timeframe evaluates:
EMA alignment
VWAP alignment
Supertrend direction
Shows 🔵 Bullish, 🔴 Bearish, ⚪ Neutral
in a visually intuitive format.
4️⃣ 📐 Auto Trendline System + Breakout Detection (Optional Module)
When enabled:
Detects swing highs/lows automatically
Draws dynamic support/resistance trendlines
Uses ATR / Stdev / Linear Regression slopes
Extends lines into future
Marks Breakout events with labels
Ideal for:
✔️ Crypto volatility
✔️ Forex swings
✔️ Breakout traders
✔️ Channel/wedge detection
5️⃣ 🏛️ Institutional Levels – Traditional Pivot Points
Includes complete dynamic Support/Resistance map:
Daily / Weekly / Monthly
Quarterly / Yearly
Multi-Year levels
Adjustable:
Line width
Line color
Price labels (Left/Right)
Works perfectly for:
XAUUSD
GBPJPY
EURUSD
BTCUSDT
NAS100
US30
📌 6. Volatility & Momentum Safety Filters (Optional)
ADX Filter
Allows signals only when volatility/trend strength is acceptable
Avoids signals in low-volatility sideways markets
RSI-MA Filter
Detects fake breakouts
Evaluates RSI displacement & momentum slope
Keeps only reliable directional conditions
These filters help refine signals for Forex (high-flow sessions) and Crypto (high-volatility assets).
📌 7. Previous-Day High/Low Break Detection
A pure price-action breakout feature tuned for global markets:
Detects clean breaks of yesterday’s high (bullish strength)
Detects breaks of yesterday’s low (bearish weakness)
Auto-avoids duplicate prints
Works extremely well in:
XAUUSD
GBPJPY
BTCUSDT
ETHUSDT
Indices like NAS100 or US30
6️⃣ 📡 JSON-Ready Alerts (Webhook Compatible)
Send signals directly to:
Telegram bots
Discord servers
Custom trading bots
Automation platforms
Every Buy/Sell alert includes JSON payload support.
🌍 Optimized for Global Markets
Forex
EURUSD • GBPJPY • XAUUSD • USDJPY • GBPUSD • AUDUSD
Majors, minors, exotics supported.
Crypto
BTC • ETH • SOL • BNB • XRP • Futures & Spot.
Timeframes Supported
Scalping: 1m–15m
Intraday: 30m–4H
Swing: 1D–1W–1M
⚠️ Policy-Safe Disclaimer
This script is a technical analysis tool, not financial advice.
It does not guarantee profits or automate trading decisions.
Always verify signals with your own strategy and risk management.
🌟 Final Summary
AI Chakra unifies:
📈 Trend
🧠 Structure
🎯 Signals
💹 Momentum
🔥 Breakouts
🏛️ Institutional Levels
🧩 Multi-TF Logic
🔐 ACCESS
This version is an Invite-Only Script.
Access is granted manually.
🛡 Support
This is an invite-only indicator.
Approved users may contact the author via the “Author’s Instructions” section on TradingView for help or usage guidance.

ES 30 Second Opening RangeOverview
Tracks opening ranges across three global futures sessions (RTH, Globex, Europe) using 30-second precision sampling. Provides high/low/mid levels, 15-point projection intervals, and breakout detection for range-based trading.
What Makes This Unique
30-Second Precision: Uses request.security_lower_tf() to sample the first 30 seconds of each session, capturing exact opening range high/low rather than relying on larger timeframe bars.
Multi-Session Tracking: Simultaneously monitors RTH (8:30 AM CT), Globex (5:00 PM CT), and Europe (2:00 AM CT) opening ranges with independent calculations for 24-hour futures coverage.
15-Point Projections: RTH-specific feature plots 5 extension levels above/below opening range at 15-point intervals (+15, +30, +45, +60, +75). Calibrated for ES futures point movement.
Adjustable Scalp Levels: Customizable +/- point lines from RTH range (default 4 points) for precise entry/exit management.
How It Works
Opening Range Calculation:
Session detection: hour(time, "America/Chicago") + minute(time) * 0.01
30s data request: request.security_lower_tf(syminfo.tickerid, "30S", high/low)
Range capture: ta.valuewhen(session_time == start_time AND second == 0, array.get(data, 0), 0)
Midpoint: (high + low) / 2
At each session start, the indicator captures the first 30-second bar's high and low, then plots these as persistent levels throughout the session.
15-Point Intervals (RTH only):
Level_up = RTH_high + (15 × n) where n = 1,2,3,4,5
Level_down = RTH_low - (15 × n)
Breakout Detection:
Break_up = ta.crossover(close, session_high)
Break_down = ta.crossunder(close, session_low)
Statistics:
Range width = session_high - session_low (displayed in table)
How to Use
Session-Based Levels: Each session's opening range represents institutional price discovery. Use as dynamic support/resistance throughout the day.
Breakout Trading: Visual signals mark opening range breakouts. Narrow ranges (<10 points ES) often precede larger moves.
15-Point Targets: After RTH breakout, use 15-point intervals as profit targets. Example: after +15 hit, next target is +30.
Gap Analysis: Compare overnight sessions to RTH. Gaps often fill toward RTH opening range.
Scalping: Adjustable point offset provides tight profit targets from range boundaries.
Key Settings
Session Toggles: Enable/disable RTH, Globex, Europe individually
15-Point Lines: RTH-only, off by default. Shows 5 levels above/below OR at 15-point intervals
Point Offset (4.0): Adjustable for tighter (2-3) or wider (6-8) scalp levels
Range Boxes: Optional visual highlighting with adjustable transparency
Statistics Table: Shows session high, low, range width
Why Protected Source
The 30-second data aggregation using request.security_lower_tf() with time-based session detection, 15-point interval projection system calibrated for ES futures, and multi-session concurrent tracking represent proprietary implementation methods.
Important Disclaimers
Not Financial Advice. Educational tool only.
Instrument Specific. 15-point intervals optimized for ES futures. Other instruments may need different sizes.
Session Accuracy. Captures first 30 seconds only. Data gaps or late opens may affect accuracy.
Historical Limitations. Opening range effectiveness varies by market regime and volatility.
Always use proper risk management. This provides reference levels, not trade signals.

VPT Osc - Call/Put Mirror# 📊 VPT Oscillator with Call/Put Mirror & Trading Signals Dashboard
## Overview
Advanced **Volume Price Trend (VPT) Oscillator** specifically designed for **options traders** who want to analyze both CALL and PUT options simultaneously. This indicator provides real-time divergence detection, signal strength scoring, and mirror analysis to identify high-probability reversal and continuation setups.
## 🎯 What Makes This Unique?
### **Call/Put Mirror Technology**
- Automatically detects if you're viewing a CALL or PUT option
- Simultaneously plots the VPT of the opposite option (mirror)
- Identifies contrarian opportunities when current and mirror options show conflicting signals
- Perfect for options spreads and hedging strategies
### **Comprehensive Trading Signals Dashboard**
A real-time dashboard displays:
- **Active Signal** - Current divergence type (Regular/Hidden Bullish/Bearish)
- **Signal Score** - 0-100 probability rating based on multiple confirmation filters
- **Trade Action** - Clear BUY CALLS/PUTS recommendations
- **Position Size** - Risk-adjusted sizing based on signal strength
- **Mirror Analysis** - Opposite option's signal for contrarian plays
- **Volume & Change%** - Live price action data for both options
- **Risk Management** - Automatic stop-loss and target calculations
## 🔍 Key Features
### 1. **Four Divergence Types**
**Primary Entry Signals:**
- ✅ **Regular Bullish Divergence** - Price makes lower low, VPT makes higher low → BUY CALLS
- ✅ **Regular Bearish Divergence** - Price makes higher high, VPT makes lower high → BUY PUTS
**Advanced Continuation Signals:**
- 🔄 **Hidden Bullish Divergence** - Price makes higher low, VPT makes lower low → ADD TO CALLS
- 🔄 **Hidden Bearish Divergence** - Price makes lower high, VPT makes higher high → ADD TO PUTS
### 2. **Multi-Factor Signal Scoring System**
Each signal receives a score (0-100) based on:
- **Divergence Strength** (30 points) - Magnitude of price/volume divergence
- **Volume Confirmation** (20 points) - Above-average volume present
- **ADX Trend Filter** (20 points) - Strong trend confirmation
- **Multi-Timeframe Alignment** (20 points) - Higher timeframe agreement
- **RSI Extremes** (10 points) - Oversold/overbought confirmation
**Score Interpretation:**
- 90-100: Extremely Strong → Full position size (3-5% capital)
- 70-89: Strong → Standard position (2-3% capital)
- 50-69: Moderate → Half position (1% capital)
- <50: Weak → AVOID or paper trade only
### 3. **Zero Line Cross Strategy**
- 🚀 **Bullish Cross** - VPT crosses above zero → Mass buying pressure entering
- ⚠️ **Bearish Cross** - VPT crosses below zero → Distribution phase starting
- Best when combined with divergence signals (Score 70+)
### 4. **ATR Dynamic Bands**
Identifies extreme overbought/oversold conditions:
- **Upper Band Touch + Bearish Divergence (75+)** = 🔴 AGGRESSIVE PUT buying
- **Lower Band Touch + Bullish Divergence (75+)** = 🟢 AGGRESSIVE CALL buying
- Auto-adjusts to market volatility
### 5. **Contrarian Mirror Analysis**
🔥 **High Probability Reversals** detected when:
- Current option shows bearish divergence (Score 70+)
- Mirror option shows bullish divergence (Score 70+)
- Suggests sharp market reversal imminent
## 📈 Trading Strategies
### Strategy 1: Primary Divergence Entry
1. Wait for Regular Bullish/Bearish divergence
2. Confirm Score ≥ 70
3. Check volume confirmation (✓ Confirmed)
4. Enter with standard position size
5. Stop loss: Below recent swing low (for calls) / Above swing high (for puts)
6. Target: 2:1 to 3:1 risk-reward ratio
### Strategy 2: Hidden Divergence - Add to Winners
1. Already holding CALL/PUT position
2. Hidden divergence appears in same direction
3. Add to position during pullback/bounce
4. Lower risk (trend already established)
### Strategy 3: Mirror Contrarian Play
1. Current option shows bearish divergence
2. Mirror option shows strong bullish signal
3. Both scores ≥ 70
4. **EXIT current position → SWITCH to mirror option**
5. Captures sharp reversals
### Strategy 4: Zero Line Momentum
1. VPT crosses above/below zero line
2. Combine with Score 65+ divergence
3. Use ATM or slightly OTM options
4. Best for 1-3 day expiries (quick moves)
### Strategy 5: ATR Band Extremes
1. Wait for VPT to touch upper/lower band
2. Confirm with opposing divergence (Score 75+)
3. Enter aggressive position
4. Target: Return to zero line
## ⚙️ Customizable Settings
### Signal Filters
- **ADX Trend Filter** - Minimum ADX threshold for trend strength
- **Volume Confirmation** - Volume multiplier (1.2x default)
- **MTF Confirmation** - Higher timeframe alignment
- **Signal Cooldown** - Minimum bars between signals (prevents spam)
- **Minimum Score** - Filter signals below threshold
### Visual Options
- **ATR Dynamic Bands** - Show/hide volatility bands
- **Mirror Display** - Toggle mirror option VPT
- **Table Position** - 9 positions (top/middle/bottom × left/center/right)
- **Table Size** - Auto, Tiny, Small, Normal, Large, Huge
- **Risk Management Display** - Show/hide stop-loss and targets
### Divergence Detection
- **Pivot Lookback** - Sensitivity for divergence detection
- **Lookback Range** - Min/max bars for divergence confirmation
- **Individual Toggle** - Enable/disable each divergence type
## 📱 Dashboard Layout
**Top Rows (Critical Info):**
1. Mirror Signal & Score
2. Active Signal
3. Signal Score (0-100)
4. Zero Line Status
5. Volume Confirmation
6. Trade Action
**Middle Rows (Confirmations):**
7. Position Sizing
8. ADX Trend Strength
9. Higher Timeframe Alignment
10. ATR Band Status
**Bottom Rows (Risk Management):**
11. Contrarian Alert (if applicable)
12. Stop Loss Level
13. Target (R:R Ratio)
14. Expected Win Rate
## 🎨 Visual Elements
- **Color-coded VPT areas** - Aqua (bullish) / Orange (bearish)
- **Mirror VPT overlay** - Fuchsia (bull) / Yellow (bear) with transparency
- **Divergence lines** - Connect pivot points automatically
- **Score labels** - Show signal strength directly on chart
- **ATR bands** - Dynamic support/resistance zones
- **Background colors** - MTF trend confirmation (subtle)
## 💡 Best Practices
1. **Wait for Score ≥ 70** on primary signals for best win rate
2. **Always check volume confirmation** before entering
3. **Use mirror analysis** for additional edge
4. **Respect stop losses** - Options decay fast
5. **Consider expiry dates** - Minimum 5-7 days recommended
6. **Scale positions** based on score (90+ = full size)
7. **Watch zero line** for momentum shifts
## ⚠️ Risk Disclaimer
- This indicator is designed for **educational purposes** and analysis
- Options trading carries substantial risk of loss
- Past divergences do not guarantee future performance
- Always use proper position sizing (1-5% per trade recommended)
- Expected win rate ranges from 55-80% depending on score threshold
- Combine with fundamental analysis and broader market context
## 📊 Recommended Timeframes
- **Intraday Scalping:** 5min, 15min charts
- **Swing Trading:** 1H, 4H charts
- **Position Trading:** Daily charts
Works best on **liquid option contracts** with tight bid-ask spreads.
## 🔧 Technical Details
- Built on **Volume Price Trend (PVT)** oscillator
- Dual EMA crossover (Short: 3, Long: 20 default)
- Multi-factor scoring algorithm with weighted components
- Real-time mirror symbol parsing for NSE/exchange formats
- Dynamic ATR-based volatility bands
- Automatic pivot detection for divergences
## 📚 What You Get
✅ Professional-grade divergence detection
✅ Real-time signal scoring (0-100)
✅ Automatic mirror option analysis
✅ Trading signals dashboard
✅ Risk management calculator
✅ Volume and price change tracking
✅ Multiple confirmation filters
✅ Fully customizable settings
✅ Works on all option exchanges
***
**Perfect for:** Options traders, day traders, swing traders, divergence traders, volume analysis enthusiasts
**Works with:** CALL options, PUT options, Index options, Stock options, Futures options
**Supports:** NSE, NYSE, NASDAQ, and other major exchanges (auto-detects option format)
***
*If you find this indicator useful, please leave a comment or boost! Your feedback helps improve future versions.*
*For questions or feature requests, feel free to comment below.*
***
## 📝 Version History
**v1.0** - Initial Release
- Call/Put mirror functionality
- Four divergence types with scoring
- Trading signals dashboard
- ATR dynamic bands
- Zero line cross detection
- Volume and change% tracking
- Risk management module
***
**Tags:** #options #VPT #divergence #volumeanalysis #callput #tradingsignals #optionstrading #technicalanalysis #volumepricetrend

(QUANTLABS) Fractal God Mode: 25-Timeframe Scanner The indicator aggregates data into three distinct metric columns:
1. STRUCT (Market Structure) This analyzes price action relative to Fractal Pivots (Highs and Lows) to determine market direction.
HH (Breakout): Price has closed above the previous Pivot High. (Bullish Structure)
LL (Breakdown): Price has closed below the previous Pivot Low. (Bearish Structure)
TRAPPED: Price is trading between the last Pivot High and Low. This indicates a ranging market where trend trades should be avoided.
2. VELOCITY (Thrust) This measures the specific strength of the current candle on that timeframe.
The Math: It calculates the ratio of the body (Close - Open) relative to the total candle range (High - Low).
The Signal: High positive numbers (Green) indicate buyers are closing near highs. High negative numbers (Red) indicate sellers are dominating the range.
3. QUALITY (Efficiency Ratio) This acts as a "Noise Filter." It determines if the trend is moving in a straight line or whipping back and forth.
The Math: It divides the Net Price Movement (Distance from 5 bars ago) by the Total Path Traveled (Sum of the ranges of the last 5 bars).
PRISTINE (Values > 0.6): The market is moving efficiently in one direction.
CHOPPY (Values < 0.4): The market is volatile and non-directional (High Noise).
1. The Matrix (Dashboard) Located in the bottom right, this table gives you an instant read on Short-Term (3m-9m), Medium-Term (10m-45m), and Long-Term (1H-Daily) trends.
2. Coherence Flow At the bottom of the table, the script sums up the structural score of all 25 timeframes.
COHERENT BULL: When the Short, Medium, and Long terms align green.
COHERENT BEAR: When the Short, Medium, and Long terms align red.
3. God Mode (Global S/R) The indicator can plot Support and Resistance levels from higher timeframes onto your current chart. For example, while trading the 5m chart, you can see the 4H and Daily pivot levels plotted automatically as dotted lines, ensuring you never trade blindly into a higher-timeframe wall.
Trend Following: Wait for the "Coherent Bull/Bear" signal at the bottom of the dashboard. This confirms that momentum is aligned from the 3m chart up to the Daily.
Scalping: Focus on the Quality column. Only take trades when the Quality is "CLEAN" or "PRISTINE." Avoid entries when the dashboard warns of "High Noise" (Choppy).
Risk Management: If the dashboard shows "TRAPPED" on the Long Term (1H+), reduce position size or wait for a breakout.
Pivot Lookback: Adjusts the sensitivity of the Fractal Structure (Default: 5).
Show Fractal DNA Matrix: Toggles the dashboard table.
Show ALL Timeframe S/R: Enables "God Mode" to see supports/resistances from all 25 timeframes (Heavy visual processing, use carefully).

IU Momentum OscillatorDESCRIPTION:
The IU Momentum Oscillator is a specialized trend-following tool designed to visualize the raw "energy" of price action. Unlike traditional oscillators that rely solely on closing prices relative to a range (like RSI), this indicator calculates momentum based on the ratio of bullish candles over a specific lookback period.
This "Neon Edition" has been engineered with a focus on visual clarity and aesthetic depth. It utilizes "Shadow Plotting" to create a glowing effect and dynamic "Trend Clouds" to highlight the strength of the move. The result is a clean, modern interface that allows traders to instantly gauge market sentiment—whether the bulls or bears are in control—without cluttering the chart with complex lines.
USER INPUTS:
- Momentum Length (Default: 20): The number of past candles analyzed to count bullish occurrences.
- Momentum Smoothing (Default: 20): An SMA filter applied to the raw data to reduce noise and provide a cleaner wave.
- Signal Line Length (Default: 5): The length of the EMA signal line used to generate crossover signals and the "Trend Cloud."
- Overbought / Oversold Levels (Default: 60 / 40): Thresholds that define extreme market conditions.
- Colors: Fully customizable Neon Cyan (Bullish) and Neon Magenta (Bearish) inputs to match your chart theme.
LONG CONDITION:
- Signal: A Buy signal is indicated by a small Cyan Circle.
- Logic: Occurs when the Main Momentum Line (Glowing) crosses ABOVE the Grey Signal Line.
- Visual Confirmation: The "Trend Cloud" turns Cyan and expands, indicating that bullish momentum is accelerating relative to the recent average.
SHORT CONDITIONS:
- Signal: A Sell signal is indicated by a small Magenta Circle.
- Logic: Occurs when the Main Momentum Line (Glowing) crosses BELOW the Grey Signal Line.
- Visual Confirmation: The "Trend Cloud" turns Magenta, indicating that bearish pressure is increasing.
WHY IT IS UNIQUE:
1. Candle-Count Logic: Most oscillators calculate price distance. This indicator calculates price participation (how many candles were actually green vs red). This offers a different perspective on trend sustainability.
2. Optimized Performance: The script uses math.sum functions rather than heavy for loops, ensuring it loads instantly and runs smoothly on all timeframes.
3. Visual Hierarchy: It uses dynamic gradients and transparency (Alpha channels) to create a "Glow" and "Cloud" effect. This makes the chart easier to read at a glance compared to flat, single-line oscillators.
HOW USER CAN BENEFIT FROM IT:
- Trend Confirmation: Traders can use the "Trend Cloud" to stay in trades longer. As long as the cloud is thick and colored, the trend is strong.
- Divergence Spotting: Because this calculates momentum differently than RSI, it can often show divergences (price goes up, but the count of bullish candles goes down) earlier than standard tools.
- Scalping: The crisp crossover signals (Circles) provide excellent entry triggers for scalpers on lower timeframes when combined with key support/resistance levels.
DISCLAIMER:
This source code and the information presented here are for educational and informational purposes only. It does not constitute financial, investment, or trading advice.
Trading in financial markets involves a high degree of risk and may not be suitable for all investors. You should not rely solely on this indicator to make trading decisions. Always perform your own due diligence, manage your risk appropriately, and consult with a qualified financial advisor before executing any trades.

YM Ultimate SNIPER# YM Ultimate SNIPER - Documentation & Trading Guide
## 🎯 Unified GRA + DeepFlow | YM-Optimized for Low Volatility
**TARGET: 3-7 High-Confluence Trades per Day**
> **Philosophy:** *YM's lower volatility is not a weakness—it's our edge. Predictability + precision = consistent profits.*
---
## ⚡ QUICK REFERENCE CARD
```
┌─────────────────────────────────────────────────────────────────────────────┐
│ YM ULTIMATE SNIPER - QUICK REFERENCE │
├─────────────────────────────────────────────────────────────────────────────┤
│ │
│ 💰 YM BASICS: │
│ ═════════════ │
│ • 1 tick = 1 point = $5/contract │
│ • Typical daily range: 150-400 points │
│ • 30-40% less volatile than NQ │
│ • More institutional, less retail noise │
│ │
├─────────────────────────────────────────────────────────────────────────────┤
│ │
│ 🎯 TIER THRESHOLDS (YM-OPTIMIZED): │
│ ══════════════════════════════════ │
│ S-TIER: 50+ pts = $250+/contract → HOLD (Institutional sweep) │
│ A-TIER: 25-49 pts = $125-245/contract → SWING (Strong momentum) │
│ B-TIER: 12-24 pts = $60-120/contract → SCALP (Quick grab) │
│ │
├─────────────────────────────────────────────────────────────────────────────┤
│ │
│ ⏰ SESSION WINDOWS: │
│ ═══════════════════ │
│ LDN → 3:00-5:00 AM ET (European flow) │
│ NY → 9:30-11:30 AM ET (US opening drive) │
│ PWR → 3:00-4:00 PM ET (End-of-day rebalancing) │
│ │
│ Expected Trades: 1-2 LDN | 2-3 NY | 1-2 PWR = 4-7 total │
│ │
├─────────────────────────────────────────────────────────────────────────────┤
│ │
│ 📊 CONFLUENCE SCORING (MAX 10 POINTS): │
│ ═══════════════════════════════════════ │
│ Tier Signal: S=3, A=2, B=1 points │
│ In Active Zone: +2 points │
│ POC Aligned: +1 point (POC at body extreme) │
│ Imbalance Support:+1 point (supporting IMB nearby) │
│ Strong Volume: +1 point (2x+ average) │
│ Strong Delta: +1 point (70%+ dominance) │
│ CVD Momentum: +1 point (CVD trending with signal) │
│ │
│ MINIMUM SCORE: 5/10 to show signal (adjustable) │
│ IDEAL SCORE: 7+/10 for highest probability │
│ │
├─────────────────────────────────────────────────────────────────────────────┤
│ │
│ 🚨 SIGNAL TYPES: │
│ ═════════════════ │
│ S🎯 / A🎯 / B🎯 → GRA Tier Signals (Full confluence) │
│ Z🎯 → Zone Entry (At DFZ zone + delta + volume) │
│ SP → Single Print (Institutional impulse) │
│ │
├─────────────────────────────────────────────────────────────────────────────┤
│ │
│ ✓ ENTRY CHECKLIST: │
│ ═══════════════════ │
│ □ Signal appears (check Score ≥5) │
│ □ Session active (LDN!/NY!/PWR!) │
│ □ Table: Vol GREEN, Delta colored, Body GREEN │
│ □ CVD arrow (▲/▼) matches direction │
│ □ Note stop/target lines on chart │
│ □ Check Zone status (bonus if IN ZONE) │
│ □ Execute at signal candle close │
│ │
├─────────────────────────────────────────────────────────────────────────────┤
│ │
│ 🎯 POSITION SIZING BY TIER: │
│ ═══════════════════════════ │
│ S-TIER (50+ pts): Full size, hold 2-5 min, target 2.5:1 R:R │
│ A-TIER (25-49): 75% size, hold 1-3 min, target 2.0:1 R:R │
│ B-TIER (12-24): 50% size, hold 30-90 sec, target 1.5:1 R:R │
│ │
├─────────────────────────────────────────────────────────────────────────────┤
│ │
│ ⛔ DO NOT TRADE WHEN: │
│ ════════════════════ │
│ ✗ Session shows "---" │
│ ✗ Score < 5/10 │
│ ✗ Vol shows RED (<1.8x) │
│ ✗ Delta < 62% │
│ ✗ Multiple conflicting signals │
│ ✗ Just before major news (FOMC, NFP, etc.) │
│ │
└─────────────────────────────────────────────────────────────────────────────┘
```
---
## 📋 WHY YM? LEVERAGING LOW VOLATILITY
### The YM Advantage
Most traders avoid YM because "it doesn't move enough." This is precisely why it's perfect for precision scalping:
| Factor | NQ | YM | Advantage |
|--------|----|----|-----------|
| **Daily Range** | 300-600 pts | 150-400 pts | More predictable moves |
| **Tick Value** | $5/tick (4 ticks/pt) | $5/tick (1 tick/pt) | Simpler math |
| **Retail Noise** | High | Low | Cleaner signals |
| **Whipsaws** | Frequent | Rare | Fewer fakeouts |
| **Trend Persistence** | Short | Long | Easier holds |
| **Fill Quality** | Variable | Consistent | Better execution |
### Why 3-7 Trades is the Sweet Spot
```
YM SESSION BREAKDOWN:
════════════════════
LONDON (3-5 AM ET): 1-2 trades
├── Why: European institutions positioning for US open
├── Character: Slow build-up, clean trends
└── Best signals: Zone entries + A/B tier
NY OPEN (9:30-11:30 AM ET): 2-3 trades
├── Why: Highest volume, most institutional activity
├── Character: Initial balance formation, breakouts
└── Best signals: S/A tier, zone confluence
POWER HOUR (3-4 PM ET): 1-2 trades
├── Why: End-of-day rebalancing, MOC orders
├── Character: Mean reversion or trend acceleration
└── Best signals: Zone entries, B tier quick scalps
TOTAL: 4-7 high-quality setups per day
```
---
## 🔧 YM-SPECIFIC OPTIMIZATIONS
This unified indicator has been specifically tuned for YM's characteristics:
### Tier Thresholds
| Tier | NQ (Original) | YM (Optimized) | Rationale |
|------|---------------|----------------|-----------|
| S-Tier | 100 pts | **50 pts** | YM's daily range is ~50% of NQ |
| A-Tier | 50 pts | **25 pts** | Proportional scaling |
| B-Tier | 20 pts | **12 pts** | Still 5%+ of typical daily range |
### Filter Adjustments
| Filter | NQ Value | YM Value | Why |
|--------|----------|----------|-----|
| Volume Ratio | 1.5x | **1.8x** | Higher bar = less retail noise |
| Delta Threshold | 60% | **62%** | Tighter for cleaner signals |
| Body Ratio | 70% | **72%** | More conviction required |
| Range Multiplier | 1.3x | **1.4x** | Bigger move = real signal |
| Gap ATR% | 30% | **25%** | Smaller gaps still significant |
| Zone Age | 50 bars | **75 bars** | Zones last longer in slow market |
### Why These Changes Work
1. **Higher Volume Bar**: YM has more institutional flow. Requiring 1.8x volume ensures we're catching real moves, not retail chop.
2. **Tighter Delta**: With less noise, we can demand clearer buyer/seller dominance before entering.
3. **Longer Zone Life**: YM trends persist longer. A zone that would be stale in NQ is still viable in YM.
4. **Smaller Gap Threshold**: YM gaps are naturally smaller. 25% of ATR in YM is significant institutional activity.
---
## 📊 CONFLUENCE SCORING SYSTEM
The unified indicator uses a 10-point confluence scoring system to filter for only the highest-probability setups:
### Score Breakdown
```
CONFLUENCE SCORE CALCULATION:
═════════════════════════════
BASE POINTS (Tier):
├── S-Tier signal: +3 points
├── A-Tier signal: +2 points
└── B-Tier signal: +1 point
BONUS POINTS:
├── Inside Active Zone (DFZ): +2 points
│ └── Price within bull/bear zone = institutional level
│
├── POC Alignment: +1 point
│ └── POC at body extreme = strong conviction
│
├── Imbalance Support: +1 point
│ └── Supporting imbalance within 1 ATR
│
├── Strong Volume (2x+): +1 point
│ └── Exceptional institutional participation
│
├── Strong Delta (70%+): +1 point
│ └── Clear one-sided aggression
│
└── CVD Momentum: +1 point
└── CVD trending with signal direction
MAXIMUM POSSIBLE: 10 points
```
### Score Interpretation
| Score | Quality | Action | Expected Win Rate |
|-------|---------|--------|-------------------|
| 8-10 | 🥇 Elite | Full size, hold for target | 75-80% |
| 6-7 | 🥈 Strong | Standard size, manage actively | 65-70% |
| 5 | 🥉 Valid | Reduced size, quick scalp | 55-60% |
| <5 | ⚫ Filtered | No signal shown | N/A |
### Adjusting Minimum Score
- **Conservative (Score ≥6)**: Fewer trades, higher win rate
- **Standard (Score ≥5)**: Balanced approach, 3-7 trades/day
- **Aggressive (Score ≥4)**: More trades, requires active management
---
## 📐 SIGNAL TYPES EXPLAINED
### 1. GRA Tier Signals (S🎯, A🎯, B🎯)
These are the primary signals from the merged GRA system:
```
TIER SIGNAL REQUIREMENTS:
═══════════════════════════
ALL must be TRUE:
├── ✓ Point movement meets tier threshold
├── ✓ Volume ≥ 1.8x average
├── ✓ Delta ≥ 62% (buy or sell dominance)
├── ✓ Body ≥ 72% of candle range
├── ✓ Range ≥ 1.4x average
├── ✓ Small opposite wick (<50% of body)
├── ✓ CVD confirms direction (if enabled)
├── ✓ Active session (LDN/NY/PWR)
└── ✓ Confluence Score ≥ minimum (default 5)
```
### 2. Zone Entry Signals (Z🎯)
When price enters a DeepFlow zone with confirmation:
```
ZONE ENTRY REQUIREMENTS:
═══════════════════════════
ALL must be TRUE:
├── ✓ Price inside fresh/tested zone (not broken)
├── ✓ Delta ≥ 62% in zone direction
├── ✓ Volume ≥ 1.5x average
└── ✓ Active session
NOTE: Z🎯 only appears when NOT already showing tier signal
(prevents duplicate signals on same candle)
```
### 3. Single Print Markers (SP)
Mark institutional impulse candles for future S/R:
```
SINGLE PRINT REQUIREMENTS:
═══════════════════════════
ALL must be TRUE:
├── ✓ Range ≥ 1.6x average
├── ✓ Body ≥ 72% of range
├── ✓ Volume ≥ 1.8x average
├── ✓ Delta ≥ 62% confirms direction
└── ✓ Active session
USE: Horizontal lines at high/low act as future S/R
```
---
## 🎯 TRADING STRATEGIES
### Strategy 1: Zone + Tier Confluence (Highest Probability)
```
THE ULTIMATE YM SETUP:
═══════════════════════
Setup:
1. Active DeepFlow zone exists (green box below for long)
2. Price pulls back INTO the zone
3. Tier signal fires INSIDE the zone (S🎯/A🎯)
4. Score shows 7+/10
Entry: Signal candle close
Stop: Below zone bottom (for longs)
Target: Based on tier (1.5-2.5:1 R:R)
Why It Works:
• Zone = institutional limit orders
• Tier signal = momentum confirmation
• Double confirmation = high probability
Expected Win Rate: 70-75%
```
### Strategy 2: Pure Tier Signal with POC Stop
```
SNIPER TIER TRADE:
══════════════════
Setup:
1. Tier signal appears (preferably A or S)
2. Score ≥ 5/10
3. Note POC level on signal candle
4. Red/green stop/target lines appear
Entry: Signal candle close
Stop: Beyond POC (shown on chart)
Target: Auto-calculated based on tier
Key: POC placement matters
• POC near candle bottom (longs) = STRONG
• POC in middle = weaker signal
• POC at extreme = possible exhaustion
Expected Win Rate: 60-65%
```
### Strategy 3: Zone Bounce (Continuation)
```
ZONE BOUNCE TRADE:
══════════════════
Setup:
1. Fresh zone created during session
2. Price leaves zone, moves in zone direction
3. Price returns to test zone (within 15 bars)
4. Z🎯 signal appears or rejection candle forms
Entry: At CE line (middle of zone)
Stop: Beyond zone edge
Target: Previous swing high/low
Why It Works:
• Zones represent unfilled orders
• First retest often finds support/resistance
• Lower volatility = cleaner bounces
Expected Win Rate: 55-60%
```
### Strategy 4: Single Print Scalp
```
SINGLE PRINT SCALP:
═══════════════════
Setup:
1. Single Print (SP) marker appears
2. Note the gold/purple lines at high/low
3. Wait for price to return to SP level
4. Look for rejection or tier signal at level
Entry: At SP line with confirmation
Stop: Beyond the SP line
Target: Quick 1:1 or to next structure
Why It Works:
• SP = price moved too fast, orders unfilled
• Price often returns to "fill" these levels
• YM's slower pace makes retests likely
Expected Win Rate: 55-60%
```
---
## 📊 TABLE LEGEND
| Field | Reading | Color Meaning |
|-------|---------|---------------|
| **Pts** | Current candle points | Gold/Green/Yellow = Tiered |
| **Tier** | S/A/B/X | Tier color or white |
| **Vol** | Volume ratio | 🟢 ≥1.8x, 🔴 <1.8x |
| **Delta** | Buy/Sell % | 🟢 Buy dom, 🔴 Sell dom |
| **Body** | Body % of range | 🟢 ≥72%, 🔴 <72% |
| **CVD** | Trend direction | ▲ Bullish, ▼ Bearish |
| **Sess** | Active session | 🟡 LDN!/NY!/PWR!, ⚫ --- |
| **POC** | Point of Control | 🟡 Gold price level |
| **Zone** | Zone position | 🟢 BUY⬚, 🔴 SELL⬚, ⚫ --- |
| **Zones** | Active zone count | #B/#S format |
| **Score** | Confluence score | 🟢 7+, 🟡 5-6, ⚫ <5 |
| **IMB** | Recent imbalances | Count in last 10 bars |
| **R:R** | Risk/Reward | 🟢 On signal, ⚫ No signal |
---
## ⏰ SESSION-SPECIFIC PLAYBOOKS
### London Session (3:00-5:00 AM ET)
```
CHARACTER: Slow, methodical, trend-building
VOLUME: Medium (50-70% of NY)
BEST SETUPS: Zone entries, A/B tier with zones
PLAYBOOK:
• Enter on zone retests
• Expect 15-25 pt moves
• Don't fight early direction
• Watch for pre-NY positioning
TYPICAL TRADES: 1-2
```
### NY Open (9:30-11:30 AM ET)
```
CHARACTER: Fast, volatile, high-conviction
VOLUME: Highest of day
BEST SETUPS: S/A tier, zone confluence
PLAYBOOK:
• First 15 min: Observe Initial Balance
• 9:45-10:15: Best setups form
• S-tier signals = ride the wave
• Be aggressive on high scores
TYPICAL TRADES: 2-3
```
### Power Hour (3:00-4:00 PM ET)
```
CHARACTER: Rebalancing, MOC orders
VOLUME: Medium-high (70-80% of NY)
BEST SETUPS: B tier scalps, zone entries
PLAYBOOK:
• Watch for mean reversion setups
• Quick scalps around POC levels
• Don't hold through close
• Take profits at 1:1 R:R
TYPICAL TRADES: 1-2
```
---
## 🔧 RECOMMENDED SETTINGS
### Conservative (Fewer, Better Trades)
| Setting | Value | Notes |
|---------|-------|-------|
| Min Confluence Score | 6 | Only strong setups |
| Min Volume Ratio | 2.0 | Higher bar |
| Delta Threshold | 65% | Stricter dominance |
| Max Zones | 8 | Less clutter |
### Standard (Balanced)
| Setting | Value | Notes |
|---------|-------|-------|
| Min Confluence Score | 5 | Default |
| Min Volume Ratio | 1.8 | Default |
| Delta Threshold | 62% | Default |
| Max Zones | 12 | Default |
### Aggressive (More Opportunities)
| Setting | Value | Notes |
|---------|-------|-------|
| Min Confluence Score | 4 | More signals |
| Min Volume Ratio | 1.5 | Lower bar |
| Delta Threshold | 60% | Looser |
| Max Zones | 15 | More context |
---
## 🚨 ALERT SETUP
Configure these alerts in TradingView:
| Alert | Priority | Action |
|-------|----------|--------|
| 🎯 YM S-TIER LONG/SHORT | 🔴 CRITICAL | Drop everything, check immediately |
| 🎯 YM A-TIER LONG/SHORT | 🟠 HIGH | Evaluate within 15 seconds |
| 🎯 YM B-TIER LONG/SHORT | 🟡 MEDIUM | Check if available |
| 🎯 YM ZONE BUY/SELL | 🟢 STANDARD | Good context entry |
| 📦 NEW ZONE | 🔵 INFO | Mark on mental map |
| ⭐ SINGLE PRINT | 🔵 INFO | Note for future S/R |
| SESSION OPEN | ⚪ INFO | Prepare to trade |
### Alert Message Format
```
🎯 YM A-LONG | YM1! @ 42,150 | 68%B | Score: 7/10 | IN ZONE | POC: 42,125 | Stop: 42,098 | SWING
```
---
## ⚠️ COMMON MISTAKES TO AVOID
| Mistake | Why It's Bad | Solution |
|---------|-------------|----------|
| Trading outside sessions | Low volume = noise | Wait for LDN/NY/PWR |
| Ignoring score | Low scores = low probability | Require ≥5/10 |
| Fighting the zone | Zones are institutional | Trade WITH zones |
| Oversizing B-tier | Quick scalps, not holds | 50% size max |
| Holding through news | Volatility spike | Exit before FOMC, NFP |
| Chasing after signal | Entry on close only | Miss it = wait for next |
| Ignoring POC position | Middle POC = indecision | Strong = extreme POC |
---
## 📈 DAILY TRADE JOURNAL TEMPLATE
```
DATE: ___________
SESSION: □ LDN □ NY □ PWR
TRADE 1:
├── Time: _______
├── Signal: S🎯 / A🎯 / B🎯 / Z🎯
├── Score: ___/10
├── Entry: _______
├── Stop: _______
├── Target: _______
├── In Zone: □ Yes □ No
├── Result: +/- ___ pts ($_____)
└── Notes: _______________________
TRADE 2:
DAILY SUMMARY:
├── Total Trades: ___
├── Win Rate: ___%
├── Net P/L: $_____
├── Best Setup: _______
└── Improvement: _______________________
```
---
## 🏆 GOLDEN RULES FOR YM
> **"YM rewards patience. Wait for the confluence—it's worth it."**
> **"Low volatility means you can size up. One good trade beats five forced trades."**
> **"Score 7+ is your edge. Anything less is gambling."**
> **"The zone + tier combo is your bread and butter. Master it."**
> **"Leave every trade with money. YM gives you time to manage."**
---
## 📊 VISUAL GUIDE
```
PERFECT YM SNIPER SETUP:
═══════════════════════════════════════════════════════════════════
│ Current Price
│
┌─────────────────────────┴────────────────────────────┐
│ BEARISH ZONE (Red) │
│- - - - - - - CE Line (Entry for shorts) - - - - - - │
│ │
└──────────────────────────────────────────────────────┘
│
══════════════════╪══════════════════ SP High (Purple)
│
┌─────────────────────┤
│█████████████████████│ ← A🎯 LONG Signal
│█████████████████████│ Score: 8/10
│ ●──────────────────│ ← POC (Gold) near bottom = STRONG
│█████████████████████│
│█████████████████████│
└─────────────────────┤
│
══════════════════╪══════════════════ SP Low (Purple)
│
┌─────────────────────────┴────────────────────────────┐
│ BULLISH ZONE (Green) │
│- - - - - - - CE Line (Entry for longs) - - - - - - -│
│██████████████████████████████████████████████████████│
└──────────────────────────────────────────────────────┘
│
Stop Loss
CONFLUENCE CHECK:
✓ A-Tier signal (+2)
✓ At edge of bullish zone (+2)
✓ POC at bottom of candle (+1)
✓ Strong volume 2.3x (+1)
✓ Delta 72% buyers (+1)
✓ CVD bullish (+1)
TOTAL: 8/10 = ELITE SETUP
ACTION: Full size LONG at signal candle close
STOP: Below zone bottom
TARGET: 2:1 R:R (auto-calculated)
```
---
## 🔧 TROUBLESHOOTING
| Issue | Cause | Fix |
|-------|-------|-----|
| No signals appearing | Score too high | Lower min score to 4-5 |
| Too many signals | Score too low | Raise min score to 6+ |
| Zones cluttering chart | Max zones high | Reduce to 8-10 |
| POC not showing | Tiered filter on | Check "POC Only Tiered" |
| Session not highlighting | Wrong timezone | Verify timezone setting |
| Alerts not firing | Not configured | Set up in TradingView alerts |
---
## 📝 PINE SCRIPT V6 TECHNICAL NOTES
This indicator uses advanced features:
- **User Defined Types (UDT)**: Clean state management for zones/imbalances
- **`request.security_lower_tf()`**: Intrabar volume analysis
- **Dynamic Array Management**: Efficient memory for drawings
- **Confluence Scoring Engine**: Multi-factor signal qualification
- **Auto Stop/Target**: Dynamic risk management calculation
**Minimum TradingView Plan:** Pro (for intrabar data access)
---
*© Alexandro Disla - YM Ultimate SNIPER*
*Pine Script v6 | TradingView*
*Unified GRA v5 + DeepFlow Zones | YM-Optimized*

Volume Intelligence Pro [Abusuhil]═══════════════════════════════════════════════════════════════════════════════
📊 VOLUME INTELLIGENCE TABLE - PROFESSIONAL VOLUME ANALYSIS INDICATOR
═══════════════════════════════════════════════════════════════════════════════
🌐 BILINGUAL SUPPORT: Full support for English and Arabic languages - switch instantly from settings!
🎯 COMPREHENSIVE VOLUME ANALYSIS DASHBOARD
This advanced indicator provides institutional-grade volume analysis through an elegant, customizable table that displays critical volume metrics in real-time. Designed for professional traders who need deep insights into market volume dynamics, order flow, and smart money movements.
═══════════════════════════════════════════════════════════════════════════════
✨ KEY FEATURES
═══════════════════════════════════════════════════════════════════════════════
🔷 BILINGUAL INTERFACE
• Seamless switching between English and Arabic
• All metrics, labels, and signals fully translated
• Perfect for international traders
🔷 VOLUME FUNDAMENTALS
• Current Volume: Real-time volume tracking
• Volume SMA: Moving average for volume comparison
• Volume Ratio: Current volume vs average (identifies abnormal activity)
• Volume % Change: Percentage change from previous bar
• Volume Delta: Difference between buying and selling pressure
🔷 VOLUME SPIKE DETECTION (4 LEVELS)
• Weak Spike: 1.5x average volume
• Medium Spike: 2.0x average volume
• Strong Spike: 2.5x average volume
• Extreme Spike: 3.0x+ average volume
• Visual alerts with color-coded indicators
🔷 ADVANCED BUY/SELL PRESSURE ANALYSIS
• Buy Volume: Bullish candle volume accumulation
• Sell Volume: Bearish candle volume accumulation
• Buy Pressure %: Percentage of buying pressure
• Sell Pressure %: Percentage of selling pressure
• Pressure Dominance: Who controls the market (Buyers/Sellers/Neutral)
• Candle Body Strength: Measures conviction in price movement
• Imbalance Volume: Detects wick imbalances
• Volume Delta (HLC3): Advanced delta calculation
• Weighted Delta: Volume-weighted price movement
• Pressure Lookback: Multi-candle pressure analysis (optimized for performance)
🔷 TECHNICAL INDICATORS INTEGRATION
• VWMA (Volume Weighted Moving Average): Price vs VWMA positioning
• OBV (On Balance Volume): Trend detection with EMA smoothing
• OBV Divergence: Bullish/Bearish divergence detection
• MFI (Money Flow Index): Overbought/oversold conditions
• A/D Line (Accumulation/Distribution): Smart money tracking
🔷 AI-POWERED VOLUME INTELLIGENCE SCORING
• Entry Power: Measures volume strength combined with price movement
• Effort vs Result: Identifies climax situations (buying/selling exhaustion)
• Reversal Volume Analysis: Tracks volume at reversal candles
• Trend Integration: Combines trend direction with volume confirmation
• Bullish/Bearish Points: 11-point scoring system
• Volume Score: -100 to +100 scale (positive = bullish, negative = bearish)
• Confidence Level: Reliability percentage of the signal
• Final Signal: Clear BULLISH/BEARISH/NEUTRAL verdict
🔷 TRIPLE SIGNAL SYSTEM (Optional)
• Signal 1: Volume Score Based (customizable thresholds)
• Signal 2: Volume Spike + Candle Color (spike level selection)
• Signal 3: OBV Divergence Detection
• Independent on/off toggles for each signal
• Visual signals plotted on chart with triangles
• Combined signal alerts
🔷 COMPREHENSIVE ALERT SYSTEM
• Volume spike alerts (configurable levels)
• Signal 1, 2, 3 individual alerts
• Combined buy/sell signal alerts
• OBV trend change alerts
• Strong buying/selling pressure alerts
• Customizable alert frequency
═══════════════════════════════════════════════════════════════════════════════
📊 TABLE STRUCTURE & DISPLAY
═══════════════════════════════════════════════════════════════════════════════
The indicator features a professional 3-column table with the following sections:
📌 COLUMN HEADERS:
• INDICATOR: Metric name
• VALUE: Current reading
• STATUS: Visual status indicator (color-coded dots/icons)
📌 SECTION 1: VOLUME BASICS
Displays fundamental volume metrics with ratio indicators and percentage changes. Essential for understanding current market activity levels.
📌 SECTION 2: VOLUME SPIKE DETECTION
Real-time spike detection with 4 severity levels. Color-coded for instant recognition of abnormal volume.
📌 SECTION 3: BUY/SELL PRESSURE (ADVANCED)
Comprehensive order flow analysis with 10+ metrics. Includes advanced calculations like weighted delta, imbalance volume, and multi-candle pressure lookback.
📌 SECTION 4: VWMA ANALYSIS
Shows price position relative to volume-weighted moving average. Critical for identifying volume-supported moves.
📌 SECTION 5: OBV ANALYSIS
On Balance Volume trend and divergence detection. Helps identify smart money accumulation/distribution.
📌 SECTION 6: MFI ANALYSIS
Money Flow Index readings with overbought/oversold signals. Combines price and volume for comprehensive analysis.
📌 SECTION 7: A/D LINE
Accumulation/Distribution line trend analysis. Tracks institutional buying and selling.
📌 SECTION 8: VOLUME INTELLIGENCE
AI-powered scoring system with 11 evaluation points:
1. Volume strength assessment
2. Current buy/sell pressure
3. Multi-candle pressure lookback
4. Entry power calculation
5. Reversal volume tracking
6. VWMA position
7. OBV trend
8. OBV divergence
9. MFI signal
10. A/D trend
11. Trend-volume integration
Final output: Volume Score, Confidence Level, and highlighted FINAL SIGNAL.
═══════════════════════════════════════════════════════════════════════════════
⚙️ CUSTOMIZATION OPTIONS
═══════════════════════════════════════════════════════════════════════════════
🎨 TABLE DISPLAY
• Position: 9 locations (top-left, top-center, top-right, middle-left, etc.)
• Size: 5 sizes (tiny, small, normal, large, huge)
• Colors: Fully customizable background and text colors
• Sections: Show/hide any section independently
🎯 VOLUME SETTINGS
• Volume Average Length (default: 20)
• Spike Thresholds: Adjustable multipliers for each level
• Advanced Metrics: Lookback periods (optimized: 10 candles)
• Reversal Analysis: Candle count (optimized: 5 candles)
📊 INDICATOR LENGTHS
• OBV Smoothing: Default 14
• MFI Period: Default 14
• VWMA Length: Default 20
• A/D Length: Default 14
🎯 SIGNAL SYSTEM
• Enable/disable each signal independently
• Customizable thresholds for Signal 1 (score & confidence)
• Spike level selection for Signal 2
• Show/hide signals on chart
• Alert configuration for each signal type
═══════════════════════════════════════════════════════════════════════════════
🚀 PERFORMANCE & OPTIMIZATION
═══════════════════════════════════════════════════════════════════════════════
✅ REPLAY MODE OPTIMIZED
• Works flawlessly in TradingView Replay mode
• Optimized calculations for fast historical analysis
• No lag or freezing issues
✅ REAL-TIME EFFICIENCY
• Lightweight code structure (50 labels/lines limit)
• Smart caching of repeated calculations
• Limited loop iterations for optimal performance
• Updates only on last bar (table rendering)
✅ NON-REPAINTING
• All signals are confirmed on bar close
• No retrospective changes to historical signals
• Reliable for backtesting and strategy development
═══════════════════════════════════════════════════════════════════════════════
💡 USAGE RECOMMENDATIONS
═══════════════════════════════════════════════════════════════════════════════
📈 FOR DAY TRADING:
• Use 15m-1H timeframes
• Enable all sections for comprehensive analysis
• Focus on Volume Spike and Buy/Sell Pressure sections
• Set alerts for Strong and Extreme spikes
📈 FOR SWING TRADING:
• Use 4H-1D timeframes
• Focus on Volume Intelligence and OBV sections
• Enable Signal 1 and Signal 3 for swing entries
• Monitor divergences for trend reversals
📈 FOR SCALPING:
• Use 1m-5m timeframes
• Focus on Buy/Sell Pressure and Volume Basics
• Enable Signal 2 for quick spike-based entries
• Hide less relevant sections to reduce visual clutter
═══════════════════════════════════════════════════════════════════════════════
🎓 INDICATOR METHODOLOGY
═══════════════════════════════════════════════════════════════════════════════
This indicator combines classical volume analysis with modern algorithmic intelligence:
1. Volume Profiling: Identifies abnormal volume relative to historical averages
2. Order Flow Analysis: Separates buying and selling pressure using candle structure
3. Divergence Detection: Compares price action with volume indicators
4. Multi-Timeframe Approach: Uses smoothing and lookback for context
5. Scoring Algorithm: 11-point evaluation system for objective signal generation
6. Confluence Integration: Combines multiple indicators for higher probability setups
═══════════════════════════════════════════════════════════════════════════════
⚠️ DISCLAIMER
═══════════════════════════════════════════════════════════════════════════════
This indicator is a tool for analysis and should not be used as the sole basis for trading decisions. Always combine with your own analysis, risk management, and trading plan. Past performance does not guarantee future results.
═══════════════════════════════════════════════════════════════════════════════
📞 SUPPORT & UPDATES
═══════════════════════════════════════════════════════════════════════════════
• Regular updates and improvements
• Bug fixes and optimization
• Feature requests considered
• Community feedback welcomed
═══════════════════════════════════════════════════════════════════════════════
🌟 Happy Trading! May your volume analysis lead to profitable decisions! 🚀
═══════════════════════════════════════════════════════════════════════════════
═══════════════════════════════════════════════════════════════════════════════
═══════════════════════════════════════════════════════════════════════════════
📊 جدول معلومات الفوليوم - مؤشر احترافي لتحليل حجم التداول
═══════════════════════════════════════════════════════════════════════════════
🌐 دعم ثنائي اللغة: دعم كامل للغتين الإنجليزية والعربية - التبديل الفوري من الإعدادات!
🎯 لوحة معلومات شاملة لتحليل الفوليوم
مؤشر متقدم يوفر تحليلاً احترافياً للفوليوم من خلال جدول أنيق وقابل للتخصيص يعرض مقاييس الفوليوم الحيوية في الوقت الفعلي. مصمم للمتداولين المحترفين الذين يحتاجون إلى رؤى عميقة حول ديناميكيات حجم السوق، تدفق الأوامر، وحركة الأموال الذكية.
═══════════════════════════════════════════════════════════════════════════════
✨ الميزات الرئيسية
═══════════════════════════════════════════════════════════════════════════════
🔷 واجهة ثنائية اللغة
• التبديل السلس بين الإنجليزية والعربية
• جميع المقاييس والتسميات والإشارات مترجمة بالكامل
• مثالي للمتداولين العرب والدوليين
🔷 أساسيات الفوليوم
• الفوليوم الحالي: تتبع حجم التداول في الوقت الفعلي
• متوسط الفوليوم: المتوسط المتحرك للمقارنة
• نسبة الفوليوم: الحجم الحالي مقابل المتوسط (يحدد النشاط غير الطبيعي)
• تغير الفوليوم %: نسبة التغيير من الشمعة السابقة
• دلتا الفوليوم: الفرق بين ضغط الشراء والبيع
🔷 اكتشاف انفجارات الفوليوم (4 مستويات)
• انفجار ضعيف: 1.5 ضعف المتوسط
• انفجار متوسط: 2.0 ضعف المتوسط
• انفجار قوي: 2.5 ضعف المتوسط
• انفجار شديد: 3.0+ ضعف المتوسط
• تنبيهات بصرية مع مؤشرات ملونة
🔷 تحليل متقدم لضغط الشراء/البيع
• حجم الشراء: تراكم حجم الشموع الصاعدة
• حجم البيع: تراكم حجم الشموع الهابطة
• ضغط الشراء %: نسبة ضغط الشراء
• ضغط البيع %: نسبة ضغط البيع
• سيطرة الضغط: من يتحكم في السوق (المشترين/البائعين/محايد)
• قوة جسم الشمعة: يقيس قوة حركة السعر
• عدم التوازن: يكتشف اختلال توازن الفتائل
• دلتا الفوليوم (HLC3): حساب متقدم للدلتا
• الدلتا المرجح: حركة السعر المرجحة بالحجم
• تحليل الضغط متعدد الشموع: تحليل عدة شموع (محسّن للأداء)
🔷 تكامل المؤشرات الفنية
• VWMA (المتوسط المرجح بالحجم): موقع السعر مقابل VWMA
• OBV (الحجم التراكمي): اكتشاف الاتجاه مع تمهيد EMA
• تباعد OBV: كشف التباعدات الصعودية/الهبوطية
• MFI (مؤشر تدفق الأموال): حالات التشبع الشرائي/البيعي
• خط A/D (التراكم/التوزيع): تتبع الأموال الذكية
🔷 نظام تقييم ذكي مدعوم بالذكاء الاصطناعي
• قوة الدخول: يقيس قوة الفوليوم مع حركة السعر
• الجهد مقابل النتيجة: يحدد حالات الذروة (استنزاف الشراء/البيع)
• تحليل حجم الانعكاس: يتتبع الحجم عند شموع الانعكاس
• تكامل الاتجاه: يجمع اتجاه الترند مع تأكيد الفوليوم
• النقاط الصعودية/الهبوطية: نظام تقييم من 11 نقطة
• تقييم الفوليوم: مقياس من -100 إلى +100 (موجب = صعودي، سالب = هبوطي)
• مستوى الثقة: نسبة موثوقية الإشارة
• الإشارة النهائية: حكم واضح (صعودي/هبوطي/محايد)
🔷 نظام الإشارات الثلاثي (اختياري)
• الإشارة 1: بناءً على تقييم الفوليوم (عتبات قابلة للتخصيص)
• الإشارة 2: انفجار الفوليوم + لون الشمعة (اختيار مستوى الانفجار)
• الإشارة 3: كشف تباعد OBV
• تفعيل/إلغاء مستقل لكل إشارة
• إشارات بصرية على الشارت بمثلثات
• تنبيهات إشارات مجمعة
🔷 نظام تنبيهات شامل
• تنبيهات انفجار الفوليوم (مستويات قابلة للتهيئة)
• تنبيهات فردية للإشارات 1، 2، 3
• تنبيهات إشارات الشراء/البيع المجمعة
• تنبيهات تغيير اتجاه OBV
• تنبيهات ضغط الشراء/البيع القوي
• تردد التنبيهات قابل للتخصيص
═══════════════════════════════════════════════════════════════════════════════
📊 بنية الجدول والعرض
═══════════════════════════════════════════════════════════════════════════════
يتميز المؤشر بجدول احترافي من 3 أعمدة مع الأقسام التالية:
📌 عناوين الأعمدة:
• المؤشر: اسم المقياس
• القيمة: القراءة الحالية
• الحالة: مؤشر الحالة البصري (نقاط/رموز ملونة)
📌 القسم 1: أساسيات الفوليوم
يعرض مقاييس الفوليوم الأساسية مع مؤشرات النسب والتغيرات المئوية. ضروري لفهم مستويات نشاط السوق الحالي.
📌 القسم 2: كشف انفجارات الفوليوم
كشف فوري للانفجارات مع 4 مستويات من الشدة. ملون للتعرف الفوري على الحجم غير الطبيعي.
📌 القسم 3: ضغط الشراء/البيع (متقدم)
تحليل شامل لتدفق الأوامر مع أكثر من 10 مقاييس. يتضمن حسابات متقدمة مثل الدلتا المرجح، حجم عدم التوازن، وتحليل الضغط متعدد الشموع.
📌 القسم 4: تحليل VWMA
يعرض موقع السعر بالنسبة للمتوسط المرجح بالحجم. حاسم لتحديد الحركات المدعومة بالحجم.
📌 القسم 5: تحليل OBV
اتجاه الحجم التراكمي وكشف التباعدات. يساعد في تحديد تراكم/توزيع الأموال الذكية.
📌 القسم 6: تحليل MFI
قراءات مؤشر تدفق الأموال مع إشارات التشبع. يجمع بين السعر والحجم للتحليل الشامل.
📌 القسم 7: خط A/D
تحليل اتجاه خط التراكم/التوزيع. يتتبع الشراء والبيع المؤسسي.
📌 القسم 8: الذكاء الاصطناعي للفوليوم
نظام تقييم ذكي مع 11 نقطة تقييم:
1. تقييم قوة الفوليوم
2. ضغط الشراء/البيع الحالي
3. تحليل الضغط متعدد الشموع
4. حساب قوة الدخول
5. تتبع حجم الانعكاس
6. موقع VWMA
7. اتجاه OBV
8. تباعد OBV
9. إشارة MFI
10. اتجاه A/D
11. تكامل الاتجاه مع الفوليوم
الناتج النهائي: تقييم الفوليوم، مستوى الثقة، والإشارة النهائية المميزة.
═══════════════════════════════════════════════════════════════════════════════
⚙️ خيارات التخصيص
═══════════════════════════════════════════════════════════════════════════════
🎨 عرض الجدول
• الموقع: 9 مواقع (أعلى-يسار، أعلى-وسط، أعلى-يمين، وسط-يسار، إلخ)
• الحجم: 5 أحجام (صغير جداً، صغير، عادي، كبير، ضخم)
• الألوان: خلفية ونص قابل للتخصيص بالكامل
• الأقسام: إظهار/إخفاء أي قسم بشكل مستقل
🎯 إعدادات الفوليوم
• طول متوسط الفوليوم (افتراضي: 20)
• عتبات الانفجار: مضاعفات قابلة للتعديل لكل مستوى
• مقاييس متقدمة: فترات التحليل (محسّن: 10 شموع)
• تحليل الانعكاس: عدد الشموع (محسّن: 5 شموع)
📊 أطوال المؤشرات
• تمهيد OBV: افتراضي 14
• فترة MFI: افتراضي 14
• طول VWMA: افتراضي 20
• طول A/D: افتراضي 14
🎯 نظام الإشارات
• تفعيل/إلغاء كل إشارة بشكل مستقل
• عتبات قابلة للتخصيص للإشارة 1 (التقييم والثقة)
• اختيار مستوى الانفجار للإشارة 2
• إظهار/إخفاء الإشارات على الشارت
• تهيئة التنبيهات لكل نوع إشارة
═══════════════════════════════════════════════════════════════════════════════
🚀 الأداء والتحسين
═══════════════════════════════════════════════════════════════════════════════
✅ محسّن لوضع الريبلاي
• يعمل بسلاسة في وضع Replay في TradingView
• حسابات محسّنة للتحليل التاريخي السريع
• لا توجد مشاكل تأخير أو تجميد
✅ كفاءة الوقت الفعلي
• بنية كود خفيفة (حد 50 علامة/خط)
• تخزين ذكي للحسابات المتكررة
• تكرارات محدودة للحلقات للأداء الأمثل
• تحديثات فقط على آخر شمعة (عرض الجدول)
✅ غير قابل لإعادة الرسم
• جميع الإشارات مؤكدة عند إغلاق الشمعة
• لا توجد تغييرات بأثر رجعي على الإشارات التاريخية
• موثوق للاختبار الخلفي وتطوير الاستراتيجيات
═══════════════════════════════════════════════════════════════════════════════
💡 توصيات الاستخدام
═══════════════════════════════════════════════════════════════════════════════
📈 للتداول اليومي:
• استخدم فريمات 15د-1س
• فعّل جميع الأقسام للتحليل الشامل
• ركز على أقسام انفجار الفوليوم وضغط الشراء/البيع
• ضع تنبيهات للانفجارات القوية والشديدة
📈 للتداول المتأرجح:
• استخدم فريمات 4س-1ي
• ركز على أقسام الذكاء الاصطناعي و OBV
• فعّل الإشارة 1 والإشارة 3 لدخولات التأرجح
• راقب التباعدات لانعكاسات الاتجاه
📈 للمضاربة:
• استخدم فريمات 1د-5د
• ركز على ضغط الشراء/البيع وأساسيات الفوليوم
• فعّل الإشارة 2 لدخولات سريعة بناءً على الانفجارات
• أخفِ الأقسام الأقل صلة لتقليل الفوضى البصرية
═══════════════════════════════════════════════════════════════════════════════
🎓 منهجية المؤشر
═══════════════════════════════════════════════════════════════════════════════
يجمع هذا المؤشر بين تحليل الفوليوم الكلاسيكي والذكاء الخوارزمي الحديث:
1. تحديد الفوليوم: يحدد الحجم غير الطبيعي نسبة للمتوسطات التاريخية
2. تحليل تدفق الأوامر: يفصل ضغط الشراء والبيع باستخدام بنية الشمعة
3. كشف التباعد: يقارن حركة السعر مع مؤشرات الفوليوم
4. نهج متعدد الفريمات: يستخدم التمهيد والتحليل الرجعي للسياق
5. خوارزمية التقييم: نظام تقييم من 11 نقطة لتوليد إشارات موضوعية
6. تكامل التقاء: يجمع عدة مؤشرات لإعدادات ذات احتمالية أعلى
═══════════════════════════════════════════════════════════════════════════════
⚠️ إخلاء المسؤولية
═══════════════════════════════════════════════════════════════════════════════
هذا المؤشر هو أداة للتحليل ولا ينبغي استخدامه كأساس وحيد لقرارات التداول. اجمع دائماً مع تحليلك الخاص وإدارة المخاطر وخطة التداول. الأداء السابق لا يضمن النتائج المستقبلية.
═══════════════════════════════════════════════════════════════════════════════
📞 الدعم والتحديثات
═══════════════════════════════════════════════════════════════════════════════
• تحديثات وتحسينات منتظمة
• إصلاحات الأخطاء والتحسين
• طلبات الميزات قيد الاعتبار
• ملاحظات المجتمع مرحب بها
═══════════════════════════════════════════════════════════════════════════════
🌟 تداول سعيد! نتمنى أن يقودك تحليل الفوليوم إلى قرارات مربحة! 🚀
═══════════════════════════════════════════════════════════════════════════════
═══════════════════════════════════════════════════════════════════════════════
