Phantom Trigger Phantom Trigger – Precision Trend Execution with TP1/TP2 and Weak Trend Exits
Phantom Trigger is a professional-grade trend-following strategy designed for crypto and high-volatility assets. It combines advanced trend detection with precise risk-managed exits using a multi-level take-profit system.
🔍 What It Does
Identifies strong directional moves using a multi-stage smoothed trend model
Confirms entries using structure-based logic and volume pressure
Filters trades using bias zones, confirmation levels, and trend acceleration
Automatically manages trades with two-stage take-profits (TP1 and TP2)
Exits early on trend weakness before reversal
Includes a styled real-time dashboard and bar coloring for visual guidance
Sends bot-compatible alerts for multi-exchange automation
⚙️ Core Components
Trend Engine: A smoothed dynamic filter detects real-time trend direction and momentum shifts
Bias Structure: Mid-high/low range-based logic determines if price is favoring bullish or bearish structure
Confirmation Levels: Short- and long-term zone crossovers confirm directional alignment
Volume Filter: Detects volume expansion spikes to validate strong breakout potential
TP1/TP2 Logic: Dynamically sets two profit targets and executes partial and full exits automatically
Weak Trend Exit: Closes positions one bar before reversal using directional filters
🧠 How to Use
Works best on crypto (1H, 4H) and high-volume instruments
Use dashboard stats to monitor position status, PnL, and TP1/TP2 progression
Alerts are pre-labeled and compatible with bots like 3Commas, Wunderbit, etc.
Can be adapted for both scalping and swing trading
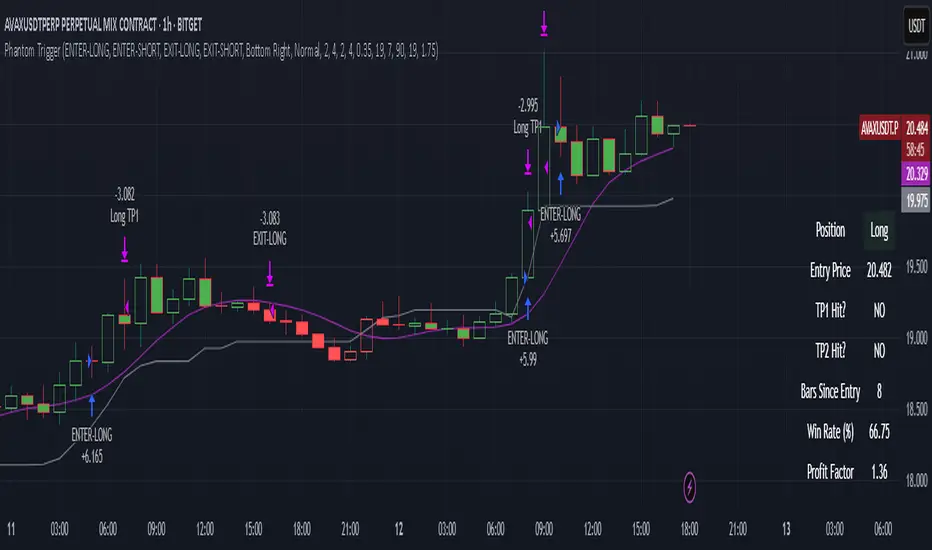
📊 Dashboard
The built-in real-time dashboard displays current trade status, entry price, TP1/TP2 progress, win rate, profit factor, and bars since entry. It updates live with every candle and provides a quick-glance overview to support your decision-making during active trades.
🧠 How to Use
Works best on crypto (1H, 4H) and high-volume instruments
Use dashboard stats to monitor position status, PnL, and TP1/TP2 progression
Alerts are pre-labeled and compatible with bots like 3Commas, Wunderbit, etc.
Can be adapted for both scalping and swing trading
⚠️ Disclaimer
This script is for educational purposes only and does not constitute financial advice. Always test strategies thoroughly using demo or backtesting environments before applying to live markets. Past performance is not indicative of future results.
In den Scripts nach "scalping" suchen
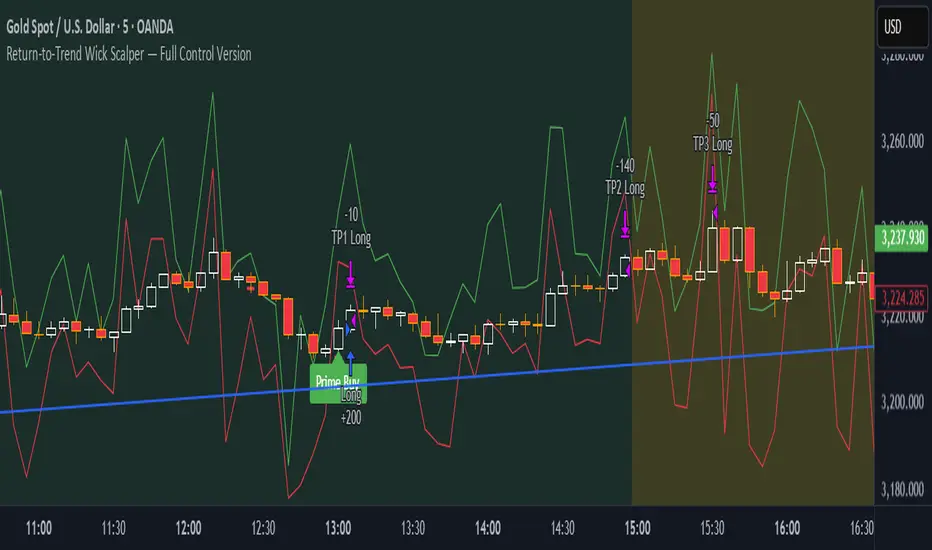
Return-to-Trend Wick Scalper — Full Control VersionReturn-to-Trend Wick Scalper — Modular Scalping Strategy for Gold (XAUUSD) & Indices
This is a precision-engineered scalping strategy designed primarily for high-volatility instruments such as Gold (XAUUSD), NASDAQ, and indices.
The system focuses on counter-trend pullbacks within the dominant daily trend, utilizing wick-based liquidity grabs (commonly referred to as “John Wick” candles) to identify high-probability return-to-trend opportunities.
Key Features:
✅ Dynamic Wick Reversal Detection: Detects reversal setups based on wick dominance and body ratio.
✅ Multiple Take Profit Levels: TP1, TP2, TP3 with individual enable/disable toggles and adjustable exit percentages.
✅ Time-Based Stop-Loss: Optional failsafe to close trades after exceeding a defined number of bars.
✅ VWAP Proximity Filter: Ensures entries happen near volume-weighted average price for precision.
✅ Pullback Depth Control: Filter for significant pullbacks using percentage of daily ATR.
✅ Dynamic Support & Resistance Validation: Confirms setups at key reactive levels.
✅ Volatility Filter: Avoids entries in overly volatile or dead market conditions.
✅ Aggressive Entry Mode: Optional early entry at pullback zones for faster fills.
✅ Paper Trading & Backtest Ready: Fully compatible with TradingView’s Paper Trading simulator.
Usage Notes:
Optimized for 5-minute chart entries.
Use in conjunction with Paper Trading for forward testing before live execution.
Can be connected to live brokers via alert webhooks and external bridges like PineConnector.
Instrument Focus:
Gold (XAUUSD) ✅
NASDAQ ✅
Dow Jones (US30) ✅
Other liquid indices ✅
Risk Note:
Always test thoroughly in Paper Trading before going live.
Optimize TP levels and filters according to market volatility conditions.
Designed for traders who want precision entries, flexibility in scaling out positions, and professional-grade risk control.
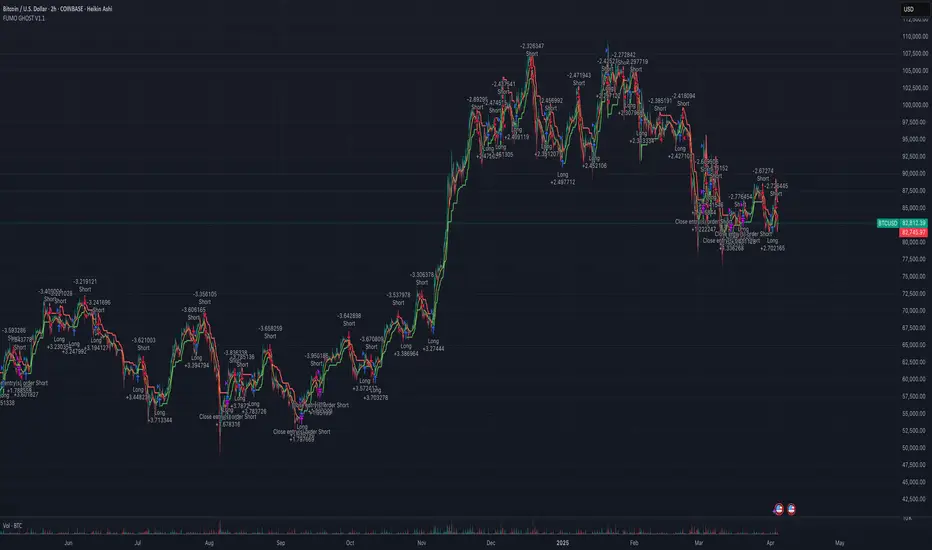
FUMO GHOST V1.1FUMO GHOST V1.0 is a high-precision trend-following strategy that identifies explosive price continuations using EMA + Supertrend logic, filtered through Heikin Ashi confirmation candles.
This strategy is designed to operate across timeframes — from scalping (1M) to swing trading (1H+) — using adaptive auto-settings for sensitivity.
It’s built to be minimal, efficient, and bold — just like the #FUMO mindset.
🔍 Core Logic:
Supertrend (ATR-based) defines trend direction
EMA is used as a momentum baseline
Heikin Ashi logic filters entries:
Long: price above EMA, trend up, HA candle strong (open == low)
Short: price below EMA, trend down, HA candle weak (open == high)
Exit: triggered automatically on Supertrend reversal
This system is designed to stay in the trend as long as it’s valid — no scalping in/out or rapid re-entries.
⚙ Strategy Settings:
Auto-adjusts EMA & ATR parameters by timeframe (1M to 1D)
Manual override available (use_custom = true)
“Silent Mode” hides all visuals for minimal charting
Uses internal Heikin Ashi logic, regardless of visible candles
🧪 Backtest Notes:
Backtest is powered by TradingView’s built-in strategy() engine
Default risk: 10% equity per trade
For accurate simulation, enable “Use standard OHLC” in strategy settings — this ensures reliable backtest when internal Heikin Ashi logic is used
🔒 Why is the code protected?
This script uses:
A unique combination of Supertrend + EMA + Heikin Ashi filters
Internal timeframe-aware parameter scaling
Logic tuned specifically for explosive trend continuations
While freely available for public use, the source code is closed to protect the inner mechanism and prevent reverse engineering.
FUMO GHOST V1.0 is built for clarity, conviction, and confidence.
Make your next trade bold.
Make Fuck U Money — 24/7.
Sunil WMA 5Sunil WMA 5 – Precision Trend Following Strategy
Overview
The Sunil WMA 5 is a trend-following trading strategy designed to identify optimal entry and exit points based on price action and momentum confirmation. The strategy is fully non-repainting and works effectively across various markets, including stocks, forex, commodities, indices, and cryptocurrencies.
This strategy employs a Weighted Moving Average (WMA) filter to enhance trend identification. It is particularly useful for scalping, day trading, and swing trading in volatile markets.
Key Features
🔹 Adaptive Trading Window – Allows users to define a specific time range for trade execution, preventing unnecessary entries outside active hours.
🔹 Flexible Trade Direction – Users can configure the strategy to trade Long Only, Short Only, or Long/Short mode.
🔹 Automated Alerts for Trade Execution – Webhook-compatible alerts allow seamless integration with brokers and automated trading platforms.
🔹 Strict Entry & Exit Rules – Ensures a disciplined approach to trading with clear logic for opening and closing positions.
🔹 Optimized for Various Timeframes – Can be used on lower timeframes (e.g., 1s, 5s, 15s) for high-frequency trading or on higher timeframes for swing trading.
Default Input Parameters & Settings
1. Trading Session (Time Window)
📌 Parameter: Trading Window
Default Value: "0000-0000" (Trades 24/7 unless a specific window is set)
Description: Allows traders to define a specific time range for trade execution. If a trade is open when the window closes, the position is automatically exited.
2. Trade Direction
📌 Parameter: Strategy Direction
Default Value: "Long/Short"
Options: "Long Only", "Short Only", "Long/Short"
Description: Determines whether the strategy will take only long trades, only short trades, or both.
3. Automated Trading Alerts (Webhook-Compatible)
📌 Parameters:
Long_Entry_Jason – (Default: "") Webhook JSON for long entries.
Long_Exit_Jason – (Default: "") Webhook JSON for long exits.
Short_Entry_Jason – (Default: "") Webhook JSON for short entries.
Short_Exit_Jason – (Default: "") Webhook JSON for short exits.
💡 Purpose: These parameters allow the strategy to send automated alerts, which can be connected to external trading platforms for trade execution.
4. Moving Average Settings
📌 Indicator Used: Weighted Moving Average (WMA)
Period: 5 (Fixed)
Description: The strategy calculates a short-term 5-period WMA as a trend filter. Trade signals are generated based on price interaction with this WMA.
How the Strategy Works
📌 1. Trade Entry Logic
The strategy identifies potential buy or sell opportunities when price action meets certain trend-confirmation criteria.
Long trades are triggered when price crosses above the 5-period WMA.
Short trades are triggered when price crosses below the 5-period WMA.
Only one position (long or short) is held at a time, ensuring clear and structured trade management.
📌 2. Trade Exit Logic
A position is closed when an opposite trade condition occurs.
If a long position is open and a short signal is triggered, the long trade is closed.
If a short position is open and a long signal is triggered, the short trade is closed.
If the trading session ends while a trade is open, the position is closed automatically.
📌 3. Automated Trading & Alerts
Users can integrate this strategy with TradingView Alerts to receive notifications or execute trades automatically.
The webhook-compatible alerts allow seamless execution with third-party trading platforms.
Best Use Cases
✅ Scalping & High-Frequency Trading – Works well on lower timeframes such as 1s, 5s, and 15s.
✅ Day Trading & Swing Trading – Can also be applied to longer timeframes for structured trend-following setups.
✅ Crypto, Forex, Stocks, and Indices – Best suited for assets with strong volatility and liquidity.

The Most Powerful TQQQ EMA Crossover Trend Trading StrategyTQQQ EMA Crossover Strategy Indicator
Meta Title: TQQQ EMA Crossover Strategy - Enhance Your Trading with Effective Signals
Meta Description: Discover the TQQQ EMA Crossover Strategy, designed to optimize trading decisions with fast and slow EMA crossovers. Learn how to effectively use this powerful indicator for better trading results.
Key Features
The TQQQ EMA Crossover Strategy is a powerful trading tool that utilizes Exponential Moving Averages (EMAs) to identify potential entry and exit points in the market. Key features of this indicator include:
**Fast and Slow EMAs:** The strategy incorporates two EMAs, allowing traders to capture short-term trends while filtering out market noise.
**Entry and Exit Signals:** Automated signals for entering and exiting trades based on EMA crossovers, enhancing decision-making efficiency.
**Customizable Parameters:** Users can adjust the lengths of the EMAs, as well as take profit and stop loss multipliers, tailoring the strategy to their trading style.
**Visual Indicators:** Clear visual plots of the EMAs and exit points on the chart for easy interpretation.
How It Works
The TQQQ EMA Crossover Strategy operates by calculating two EMAs: a fast EMA (default length of 20) and a slow EMA (default length of 50). The core concept is based on the crossover of these two moving averages:
- When the fast EMA crosses above the slow EMA, it generates a *buy signal*, indicating a potential upward trend.
- Conversely, when the fast EMA crosses below the slow EMA, it produces a *sell signal*, suggesting a potential downward trend.
This method allows traders to capitalize on momentum shifts in the market, providing timely signals for trade execution.
Trading Ideas and Insights
Traders can leverage the TQQQ EMA Crossover Strategy in various market conditions. Here are some insights:
**Scalping Opportunities:** The strategy is particularly effective for scalping in volatile markets, allowing traders to make quick profits on small price movements.
**Swing Trading:** Longer-term traders can use this strategy to identify significant trend reversals and capitalize on larger price swings.
**Risk Management:** By incorporating customizable stop loss and take profit levels, traders can manage their risk effectively while maximizing potential returns.
How Multiple Indicators Work Together
While this strategy primarily relies on EMAs, it can be enhanced by integrating additional indicators such as:
- **Relative Strength Index (RSI):** To confirm overbought or oversold conditions before entering trades.
- **Volume Indicators:** To validate breakout signals, ensuring that price movements are supported by sufficient trading volume.
Combining these indicators provides a more comprehensive view of market dynamics, increasing the reliability of trade signals generated by the EMA crossover.
Unique Aspects
What sets this indicator apart is its simplicity combined with effectiveness. The reliance on EMAs allows for smoother signals compared to traditional moving averages, reducing false signals often associated with choppy price action. Additionally, the ability to customize parameters ensures that traders can adapt the strategy to fit their unique trading styles and risk tolerance.
How to Use
To effectively utilize the TQQQ EMA Crossover Strategy:
1. **Add the Indicator:** Load the script onto your TradingView chart.
2. **Set Parameters:** Adjust the fast and slow EMA lengths according to your trading preferences.
3. **Monitor Signals:** Watch for crossover points; enter trades based on buy/sell signals generated by the indicator.
4. **Implement Risk Management:** Set your stop loss and take profit levels using the provided multipliers.
Regularly review your trading performance and adjust parameters as necessary to optimize results.
Customization
The TQQQ EMA Crossover Strategy allows for extensive customization:
- **EMA Lengths:** Change the default lengths of both fast and slow EMAs to suit different time frames or market conditions.
- **Take Profit/Stop Loss Multipliers:** Adjust these values to align with your risk management strategy. For instance, increasing the take profit multiplier may yield larger gains but could also increase exposure to market fluctuations.
This flexibility makes it suitable for various trading styles, from aggressive scalpers to conservative swing traders.
Conclusion
The TQQQ EMA Crossover Strategy is an effective tool for traders seeking an edge in their trading endeavors. By utilizing fast and slow EMAs, this indicator provides clear entry and exit signals while allowing for customization to fit individual trading strategies. Whether you are a scalper looking for quick profits or a swing trader aiming for larger moves, this indicator offers valuable insights into market trends.
Incorporate it into your TradingView toolkit today and elevate your trading performance!

[Opening Range Breakout] S&R Strategy with Backtest (TSO) S&R Strategy with Backtest (TSO)
===========================================================================
===========================================================================
This indicator serves as a comprehensive full-cycle trading system, providing alerts at each stage of the trade, from opening to closure. The algorithm initiates by calculating the Opening/Pre-Market Price Range, waiting for a breakout to generate signals, and establishing TP (Take Profit and SL (Stop Loss) levels. The Opening/Pre-Market range, known for its robust support and resistance levels, is a key element. To filter out false breakouts and capture valid ones, the indicator incorporates a Smart Breakout feature, requiring confirmation through an initial breakout, a confirmation bounce, and a subsequent confirmation breakout. The indicator offers a variety of automated approaches for TP (Take-Profit) and SL (Stop-Loss) settings. These include leveraging opening range levels, both the most recent and historical S&R (Support and Resistance) levels, and an ATR (Average True Range) trailing stop-loss. This diverse set of tools ensure flexibility in tailoring TP (Take-Profit) and SL (Stop-Loss) parameters to different market conditions, contributing to a more adaptive and robust trading system. Additionally, a series of signal analysis tools, including candle bar analysis, divergence, and volume, enhance the precision of trading signals.
* Works with popular timeframes: 1M, 3M, 5M, 15M, 30M, 45M, 1H.
* Works best with Indices, Stocks, and Commodities, since there is pre-market price movement, which is used to obtain support and resistance price range.
* Every action of the trade is calculated on a confirmed closed candle bar state (barstate.isconfirmed), so the indicator will never repaint.
==============================================================
Indicator visual examples with various instruments:
---------------------------------------------------------------------------
Strategy Config: ORB_AAPL(NASDAQ)_15M
Example of Signal Cleanup confirmations via SMA and ATR. Take-Profit is calculated per optimal S&R (resistance) most recent levels.
---------------------------------------------------------------------------
Strategy Config: ORB_AMD(NASDAQ)_5M
Example of optimal S&R (resistance) level from previous day for Take-Profit 1 target, which gets hit.
---------------------------------------------------------------------------
Strategy Config: ORB_META(NASDAQ)_5M
Example of dynamic SL (Stop-Loss), which reduces the risk by moving to the new support level, which is at the same time is below the current price. Also Signal Cleanup confirmations via SMA, ATR and VWAP
---------------------------------------------------------------------------
Strategy Config: ORB_MSFT(NASDAQ)_15M
Example of automated ATR Trail Stop-Loss activation at no optimal S&R (support) feature.
---------------------------------------------------------------------------
Strategy Config: ORB_NFLX(NASDAQ)_3M
Example of a skipped LONG trade due to no optimal S&R (support) for Stop-Loss (can be seen per chart that it would be a loss trade). On another side, a SHORT SMA Confirmed trade hits all 3 profit targets.
---------------------------------------------------------------------------
Strategy Config: ORB_NVDA(NASDAQ)_15M
Example of no optimal support for SHORT Take-Profit targets, with ATR Trail Stop-Loss.
---------------------------------------------------------------------------
Strategy Config: ORB_SPY(AMEX)_15M
Example of several signal confirmations at the same time (SMA, VWAP, EWO) and S&R-TP-Entry-SL SL (Stop-Loss) system, which at trade open sets SL (Stop-Loss) per optimal S&R (since this is a LONG trade - support) and then moves to Entry at first take-profit.
===========================================================================
Trading open/close/TP/SL labels, plots and colors explanations:
---------------------------------------------------------------------------
>>> Opening/Pre-Market range: White dashed lines show opening range/pre-market levels with dotted white line extend along the Trading Schedule (if Trading Schedule is turned off - it will extend until next day).
>>> Smart Breakout: 1) Initial Breakout: "init_Brekout" | 2) Confirmation Bounce: "conf_Bounce" | 3) Confirmation Breakout: "conf_Breakout" (additional lables on chart can be hidden with only Confirmation Breakout shown).
>>> Additional S&R (Support and Resistance) lines: yellow - support, blue - resistance (can be hidden).
>>>>> LONG open: green "house" looking arrow below candle bar.
>>>>> SHORT open: red "house" looking arrow above candle bar.
>>>>> LONG/SHORT take-profit target: green/red circles (multi-profit > TP2/3/4/5 smaller circles).
>>>>> LONG/SHORT stop-loss target: green/red + crosses.
>>>>> LONG/SHORT take-profit hits: green/red diamonds.
>>>>> LONG/SHORT stop-loss hits: green/red X-crosses.
>>>>> LONG/SHORT EOD (End of Day | Intraday style) close (profitable trade): green/red squares.
>>>>> LONG/SHORT EOD (End of Day | Intraday style) close (loss trade): green/red PLUS(+)-crosses.
===========================================================================
STATS TABLE ///////////////////////////////////////////////////////////////
---------------------------------------------------------------------------
>>> Trading STATS table on the chart showing current trade direction, Last TP (Take-Profit) Taken, Current Trade PL (profit/loss in price difference from trade open to the very current state).
---------------------------------------------------------------------------
CUSTOM TRADING DATE RANGE /////////////////////////////////////////////////
---------------------------------------------------------------------------
>>>>> This feature can be used to manually set indicator trading range from and to a specific date and time. NOTE: This is not intended for a very long date range backtesting, utilize TradingView Strategy Tester for that.
* Use TradingView “Strategy Tester” to see Backtesting results
NOTE: If Strategy Tester does not show any results with Date Ranged fully unchecked, there may be an issue where a script opens a trade, but there is not enough TradingView power to set the Take-Profit and Stop-Loss and somehow an open trade gets stuck and never closes, so there are “no trades present”. In such case - manually check “Start”/“End” dates or use “Deep Backtesting” feature!
---------------------------------------------------------------------------
INTRADAY/TRADING SCHEDULE | ET (EASTERN TIMEZONE) ////////////////////////
---------------------------------------------------------------------------
>>> Trading Schedule - On/Off: This is where an Intraday Session or any custom session can be turned on and then scheduled.
>>>>> Trading Schedule - Time: Trade open Signals/Alerts time zone Hours. | NOTE: US Market Active Hours: 09:30 - 16:00 ET / Power Hour: 15:00 - 16:00 ET)
>>> Trading Schedule - EOD(End of Day) Close - On/Off: Close trade if still open by certain hour (set below).
>>>>> Trading Schedule - EOD(End of Day) Close - Hour (ET): US trading session closes at 4PM ET > 16:00.
Here is when the trade will close with EOD(End of Day) Close/Trading Cut Off Hour set to 16, which is end of US trading session:
1/3/5min > will close at 15:55pm ET
15min > will close at 15:45pm ET
30min > will close at 15:30pm ET
45min > will close at 15:45pm ET
60min > will close at 16:00pm ET
Here is when the trade will close with EOD(End of Day) Close/Trading Cut Off Hour set to 15, which is 1 hour before the end of US trading session (right before power hour starts):
1/3/5min > will close at 14:55pm ET
15min > will close at 14:45pm ET
30min > will close at 14:30pm ET
45min > will close at 14:45pm ET
60min > will close at 15:00pm ET
---------------------------------------------------------------------------
TRADE SIGNAL CONFIGURATION ////////////////////////////////////////////////
---------------------------------------------------------------------------
>>> Opening Range - Time Period (ET): Opening/Pre-Market Range time, which by default is set to US Session Pre-Market Range, can be customized to any time range as there are different market hours around the world and this setting can be customized to any time. Pre-Market Time/Price Range Hours(ET) | Pre-Market EU/Asia Hours: 4:00-9:30 ET | Pre-Market US (NY) Hours: 7:00-9:30 ET | Post-Market US Hours: 16:00-19:00 ET | First US Market Hour: 9:30-10:30 ET | Power Hour: 15:00-16:00)
>>> Opening Range - Levels Structure: determines how the price range is calculated, based on the highest/lowest price zones or based on the candle body bar.
>>> Opening Range - Breakout System: "Simple": bar close price has to simply break the opening range level | "Smart": After initial breakout (which is basically 'Simple' Breakout), a price come back is expected to the opening range level, a bounce, then a confirmation breakout with price closing ahead of the initial breakout.
>>>>> Opening Range - Smart Breakout: # of bars until Initial Breakout becomes invalid
>>>>> Opening Range - Smart Breakout: Bounce Settings, "Cross-Return" - LONG: Price has to cross down the initial breakout S&R, but never close below it; SHORT: Price has to cross up the initial breakout S&R, but then close above it; ||| "Cross-Close-Return" - LONG: At least 1 candle has to close below initial breakout S&R; SHORT: At least 1 candle has to close above initial breakout S&R.
>>>>> Alerts - Opening Range - Smart Breakout: Confirmation Bounce Alert. Trigger an alert at confirmation bounce. This is for live trading (especially scalping) Smart Breakout approach - to get ready to open the trade in the correct direction.
---------------------------------------------------------------------------
TAKE-PROFIT/STOP-LOSS CONFIGURATION ///////////////////////////////////////
---------------------------------------------------------------------------
>>> TP (Take-Profit) and SL (Stop-Loss): S&R Search - Left Bars: This setting is for calculating optimal S&R (Support and Resistance) levels (in combination with below - Right Bars) for S&R (Support and Resistance) TP (Take-Profit) levels calculations. NOTE: if at any point - there will be no available S&R (Support & Resistance) found for SL (Stop-Loss, 'S&R-Dynamic-SL' or 'S&R-Static-SL' setting, since both settings search for optimal SL (Stop-Loss) at trade open) or TP (Take-Profit, at any setting, since at trade open, an optimal TP (Take-Profit) level is searched) > SL (Stop-Loss) will automatically switch to trailing ATR-Trailing-SL and the trade will continue to run until it either hits ATR-Trailing-SL (Stop-Loss) or closes at EOD (End of Day).
>>> TP (Take-Profit) and SL (Stop-Loss): S&R Search - Right Bars: This setting is for calculating optimal S&R (Support and Resistance) levels (in combination with above - Left Bars) for S&R (Support and Resistance) TP (Take-Profit) levels calculations. NOTE: if at any point - there will be no available S&R (Support & Resistance) found for SL (Stop-Loss, 'S&R-Dynamic-SL' or 'S&R-Static-SL' setting, since both settings search for optimal SL (Stop-Loss) at trade open) or TP (Take-Profit, at any setting, since at trade open, an optimal TP (Take-Profit) level is searched) > SL (Stop-Loss) will automatically switch to trailing ATR-Trailing-SL and the trade will continue to run until it either hits ATR-Trailing-SL (Stop-Loss) or closes at EOD (End of Day).
>>> TP (Take-Profit) and SL (Stop-Loss): S&R Search - Custom Resolution: This is a custom timeframe setting specifically for S&R Search, it disregards current chart timeframe. This is great to use for scalping, for example: with main chart set to 1min and the custom timeframe set to 3min or 5min - there will be stronger support/resistance levels with more detailed price action.
>>> TP (Take-Profit) and SL (Stop-Loss): # of Bars (5000 max) to search back for optimal Support and Resistance levels: This is how many candles will be searched backwards for previous S&Rs (Support and Resistance) to find the optimal levels for TP (Take-Profit) and SL (Stop-Loss). NOTE: If SL (Stop-Loss) System is set to 'ATR-Trailing-SL' - this setting is only relevant for searching TP (Take-Profit) levels.
>>> TP (Take-Profit) and SL (Stop-Loss): At Trade Open - No S&R (Support and Resistance) found behavior: 'Skip Trade': If at trade open there are no S&R (Support and Resistance) levels for TP1 (Take-Profit 1) or SL (Stop-Loss) - trade is skipped. 'Open/ATR-Trailing-SL': If at trade open there are no S&R (Support and Resistance) levels for TP1 (Take-Profit 1) or SL (Stop-Loss), the trade will still be open with SL (Stop-Loss) set to 'ATR-Trailing-SL'.
>>> TP (Take-Profit) System: Pre-Market-Range-TP: All TP (Take-Profit) targets are calculated at trade open using the distance between Support and Resistance per Opening Pre-market Range and then divided by TP (Take-Profit) Divider, which can be set below; S&R-Current-Optimal-TP1: TP1 (Take-Profit) level is set per currently available S&R (Support & Resistance), if none available - historical S&R (Support & Resistance) levels will be searched, remaining TP (Take-Profit) targets (if selected, up to 5 # of TPs) are searched through most recent closest historical S&R (Support & Resistance) levels; S&R-Historic-Optimal-TP1: TP1 (Take-Profit) level is set per historically most recent closest available S&R (Support & Resistance) to the Entry price, remaining TP (Take-Profit) targets (if selected, up to 5 # of TPs) are searched through historical S&R (Support & Resistance) levels as well.
>>> TP (Take-Profit, Pre-Market-Range-TP) Divider #: This is for 'Pre-Market-Range-TP' setting only, where TP (Take-Profit) level is the distance between top/bottom levels of the opening range. It can be reduced by the divider #. (1 - full distance; 2 - 1/2 distance; 3 - 1/3 distance; etc.
>>> TP (Take-Profit) # of targets: It is wise to divide the trade into several profit targets. With this setting - up to 5 TP (Take-Profit) targets can be approached. The trade will be equally divided up by the selected # of TP (Take-Profit) targets.
>>> TP (Take-Profit) target(s) Consumed: Signal Bar consuming Take-Profits - trade signal bar is big enough to 'consume'/close ahead of the first TP setting > the signal can either be skipped, or all Take-Profit targets pushed ahead by average bar size).
>>> TP (Take-Profit) Offset - On/Off: This is a feature where TP (Take-Profit) target will be considered taken even if the price never crosses the target(s), but comes close enough (based on the offset amount). Set the offset amount below.
>>>>> TP (Take-Profit) Offset - Amount: Some Examples: (for SPY 0.1 would be $0.10 offset - if TP1 is $400 and price hits $399.90 > TP1 considered taken/signal shown/alert) | NOTE: For EURUSD, it is very different and if wrong will show TP1 immediately at trade open, typical good offset for EURUSD is: 0.0005 | Similar for BTCUSD, for example: 10 - $10 offset, if TP is $15,000 > $14,990.
>>> SL (Stop-Loss) System: 'Pre-Market-Range-SL': SL (Stop-Loss) is set to the opposite market range level from trade direction; 'S&R-Static-SL': SL (Stop-Loss) is set at trade open per optimal most recent S&R level and remains there until trade closes; 'S&R-Dynamic-SL': SL (Stop-Loss) is set at a trade open per optimal S&R (Support and Resistance) level from the most recent AND historical S&Rs (Support and Resistance), with every bar closed it will check if there are new S&Rs (Support and Resistance) levels, if these levels appear closer to the current price then current level - it will move SL (Stop-Loss) to that level, therefore reducing the risk; 'ATR-Trailing-SL': SL (Stop-Loss) is trail-following the ATR (Average True Range) line, NOTE: If at signal trigger, ATR will be against the trade direction - trade open signal will be skipped; 'S&R-TP-Entry-SL': SL (Stop-Loss) initially is set per S&R, then moves to Entry price at the very first TP (Take-Profit) hit and remains there until trade closes; 'S&R-TP-Trail-SL': SL (Stop-Loss) initially is set per S&R, then moves to Entry at TP1 (Take-Profit 1) hit, then keeps trailing per previously taken profit targets (TP2 taken, SL moves to TP1 | TP3 taken, SL moves to TP2 | TP4 taken, SL moves to TP3). NOTE: 'ATR-Trailing-SL' will not switch automatically if 'S&R-Dynamic-SL', S&R-TP-Entry-SL', 'S&R-TP-Trail-SL' system is selected, as already the most optimal SL (Stop-Loss) level is calculated - it will switch automatically only with 'S&R-Static-SL' system.
>>> SL (Stop-Loss) - On/Off: Without SL (Stop-Loss), unless EOD (End of Day) Close is turned on - there will be no SL (Stop-Loss) at all!
---------------------------------------------------------------------------
SIGNAL ANALYSIS AND CLEANUP ///////////////////////////////////////////////
---------------------------------------------------------------------------
>>> Signal Cleanup - Bar Color: Include Bar Color (bullish/bearish) confirmation, LONG signal will only be opened if signal bar is green/bullish, SHORT if red/bearish.
>>> Signal Cleanup - Bar Directional Structure: Skip opposite bar structure types signals (For example: bearish green hammer).
>>> Signal Cleanup - Bar Doji Skip: Skip doji (indecisive) candles signals.
>>> Signal Cleanup - EWO (Elliott Wave Oscillator): Include EWO (Elliott Wave Oscillator), LONG will only be opened if EWO is bullish / SHORT if EWO is bearish.
>>> Signal Cleanup - VWAP (Volume-Weighted Average Price): Include VWAP (Volume-Weighted Average Price), LONG will only be opened if price is above VWAP / SHORT if price is below VWAP.
>>> Signal Cleanup - MA (Moving Average) Confirmation: Include MA (Moving Average), LONG will only be opened if MA is bullish / SHORT if MA is bearish.
>>> Signal Cleanup - ATR (Average True Range): Include ATR (Average True Range) confirmation, LONG will only be opened if ATR is bullish / SHORT if ATR is bearish.
>>> Signal Cleanup - Divergence(RSI + MACD): Include Divergence (RSI + MACD ) confirmation, LONG will only be opened if Divergence is bullish / SHORT if Divergence is bearish.
>>> Signal Cleanup - Volume % Strength: Include Volume strength/percentage confirmation, LONG/SHORT will only be opened with strong Volume matching the signal direction | By default, strong Volume percentage is set to 150% and weak to 50%.
>>> Signal Cleanup - Volume Above Average: Include Volume Above Moving Average (Volume closing bar closes above volume moving average) confirmation, LONG/SHORT will only be opened with Volume above average - Volume closed bar color must match the closed price color (bullish/bearish direction) + Volume bar must be closed above volume MA line).
---------------------------------------------------------------------------
===========================================================================
||||||||||||||||||||||||||||||||||| *** ||||||||||||||||||||||||||||||||||| *** |||||||||||||||||||||||||||||||||||
||||||||||||||||||||||||||||||||||| *** ||||||||||||||||||||||||||||||||||| *** |||||||||||||||||||||||||||||||||||
TP System - VERY IMPORTANT INFO!
-------------------------------------------------------------------------------------------------------------------
"TP PERCENTAGE" - amount by which current trade/position needs to be reduced/partially closed/sold.
-------------------------------------------------------------------------------------------------------------------
TP System: Dynamic
"TP PERCENTAGE" - will always be the same amount (trade/position size divided by the # of take-profit(TP) targets) and percentage to be closed will always be of the ORIGINAL trade/position.
-------------------------------------------------------------------------------------------------------------------
TP System: Static
"TP PERCENTAGE" - will always be the same amount IF take-profit(TP) targets are hit 1-by-1 (TP1 > TP2 > TP3 > TP4 > TP5), otherwise it will vary and unless it is a 1st take-profit(TP1), the REMAINING trade/position size will always be smaller than original and therefore the percentage to be closed will always be of the REMAINING trade/position and NOT the original one!
-------------------------------------------------------------------------------------------------------------------
"TP PERCENTAGE" CheatSheet (these are the only percentages you may see)
-----------------------------------------------------------------------
TP PERCENTAGE---Close/Sell Amount-------------Example (trade size: 50 stocks)
20%-------------trade size * 0.2--------------50 * 0.2 = 10 stocks
25%-------------trade size * 0.25-------------50 * 0.25 = 12.5(~13) stocks
34%-------------trade size * 0.34-------------50 * 0.34 = 17 stocks
40%-------------trade size * 0.4--------------50 * 0.4 = 20 stocks
50%-------------trade size * 0.5--------------50 * 0.5 = 25 stocks
60%-------------trade size * 0.6--------------50 * 0.6 = 30 stocks
66%-------------trade size * 0.66-------------50 * 0.66 = 33 stocks
75%-------------trade size * 0.75-------------50 * 0.75 = 37.5(~38) stocks
80%-------------trade size * 0.8--------------50 * 0.8 = 40 stocks
100%------------trade size--------------------50 = 50 stocks
-----------------------------------------------------------------------
If for any reason a portion of the current/remaining trade closed at such occurrence was slightly wrong, it is not an issue. Such occurrences are rare and with slight difference in partial TP closed is not significant to overall performance of our algorithms.
||||||||||||||||||||||||||||||||||| *** ||||||||||||||||||||||||||||||||||| *** |||||||||||||||||||||||||||||||||||
||||||||||||||||||||||||||||||||||| *** ||||||||||||||||||||||||||||||||||| *** |||||||||||||||||||||||||||||||||||
===========================================================================
Alert Settings (you don’t have to touch this section unless you will be using TradingView alerts through a Webhook to use with trading bot)
---------------------------------------------------------------------------
Here is how a LONG OPEN alert looks like.
NOTE: Each label , , etc. is customizable, you can change the text of it within indicator Input settings.
ALERT >>>>>>>>>>>>>>>>>>>>>>>>>>>>>>>>>>>>>>>>>>>>>>>
COIN: BTCUSD
TIMEFRAME: 15M
LONG: OPEN
ENTRY: 20000
TP1: 20500
TP2: 21000
TP3: 21500
TP4: 22500
TP5: 23500
SL: 19000
Leverage: 0
---------------------------------------------------------------------------
Here is how a TP1 alert will look with 5 TPs breakdown of the trade.
NOTE1: Next to TP1 taken it will show at which price it was triggered.
NOTE2: Next to "TP Percentage" it shows how much of the CURRENT/ACTIVE/REMAINING trade needs to be closed.
NOTE2: If TP2/3/4/5 comes before TP1 - the alert will tell you exactly how many percent of the trade needs to be closed!
ALERT >>>>>>>>>>>>>>>>>>>>>>>>>>>>>>>>>>>>>>>>>>>>>>>
COIN: BTCUSD
TIMEFRAME: 15M
LONG: TP1
TP1: 20500
TP Percentage: 20%
---------------------------------------------------------------------------
Here is how an alert will look for LONG - STOP-LOSS.
ALERT >>>>>>>>>>>>>>>>>>>>>>>>>>>>>>>>>>>>>>>>>>>>>>>
COIN: BTCUSD
TIMEFRAME: 15M
ENTRY: 20000
LONG: SL
SL: 19000
---------------------------------------------------------------------------
Here is how an alert will look for LONG - EOD (End of Day) In Profit close.
ALERT >>>>>>>>>>>>>>>>>>>>>>>>>>>>>>>>>>>>>>>>>>>>>>>
COIN: BTCUSD
TIMEFRAME: 15M
LONG: EOD-Close (profit)
ENTRY: 20000
EOD-Close: 21900
===========================================================================
Adding Alerts in TradngView
---------------------------------------------------------------------------
-Add indicator to chart and make sure the correct strategy is configured (check Backtesting results)
-Right-click anywhere on the TradingView chart
-Click on Add alert
-Condition: Select this indicator by it’s name
-Immediately below, change it to "alert() function calls only", as other wise there will be 2 alerts for every alert!
-Expiration: Open-ended (that may require higher tier TradingView account, otherwise the alert will need to be occasionally re-triggered)
-Alert name: Whatever you desire
-Hit “Create”
-Note: If you change ANY Settings within the indicator – you must DELETE the current alert and create a new one per steps above, otherwise it will continue triggering alerts per old Settings!
===========================================================================
If you have any questions or issues with the indicator, please message me directly via TradingView.
---------------------------------------------------------------------------
Good Luck! (NOTE: Trading is very risky, past performance is not necessarily indicative of future results, so please trade responsibly!)
---------------------------------------------------------------------------
NOTE: There seems to be a strange glitch when strategy is running live, it will show "double-take" take-profits labels on the chart. This is not affecting the script logic and backtesting results, if you simply change the timeframe real quick to something else then back - it will no longer show the duplicate orders... this must be some sort of a glitch as every alert was thoroughly tested to make sure everything is working!

SPY 1 Minute Day TraderWhen scalping options, users are looking for where breakouts are going to occur instead of sitting thru areas choppy price action that drain delta and cause them to lose value even if price is up trending. This script tries to identify when a trend reversal is expected based on one minute price action on the SPY. It alerts users to prepare for potential breakout when 5 out of the 6 key optimized parameters are discovered by showing a white L or S. Once all six trigger, it informs the user at the close of that candle with a golden triangle with Pivot Up or Pivot Down. As scalping options is something that is expected to be short in duration, a take profit and stop loss of 30 cents of price actions is established. If five or more parameters occur after the pivot is initiated, then stop losses and take profits are adhered to; however, if there are less, then it waits to take profit or stop the trade, as likely it is just noise and it will finish trend with an additional breakout.
This script has been created to take into account how the following variables impact trend for SPY 1 Minute:
ema vs 13 ema : A cross establishes start of trend
MACD (Line, Signal & Slope) : If you have momentum
ADX : if you are trending
RSI : If the trend has strength
The above has been optimized to determine pivot points in the trend using key values for these 6 indicators
bounce up = ema5 > ema13 and macdLine < .5 and adx > 20 and macdSlope > 0 and signalLine > -.1 and rsiSignal > 40
bounce down = ema5 < ema13 and macdLine > -.5 and adx > 20 and signalLine < 0 and macdSlope < 0 and rsiSignal < 60
White L's indicate that 5 of 6 conditions are met due to impending uptrend w/ missing one in green below it
Yellow L's indicate that 6 of 6 conditions still are met
White S's indicate that 5 of 6 conditions are met due to impending downtrend w/ missing condition in red above it
Yellow S's indicate that 6 of 6 conditions still are met
After a downtrend or uptrend is established, once it closes it can't repeat for 10 minutes
Won't open any trades on last two minutes of any hours to avoid volatility
Will close any open trades going into last minute of hour to avoid large overnight random swings.

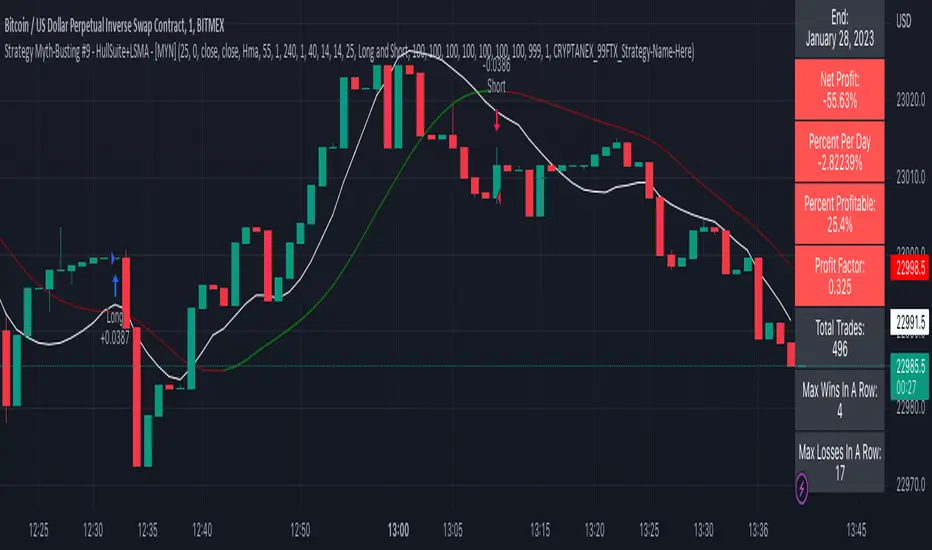
Strategy Myth-Busting #9 - HullSuite+LSMA - [MYN]This is part of a new series we are calling "Strategy Myth-Busting" where we take open public manual trading strategies and automate them. The goal is to not only validate the authenticity of the claims but to provide an automated version for traders who wish to trade autonomously.
Our 9th one is an automated version of the "I Tested The Best 1 Minute Scalping Strategy That Will Blow Your Mind 100 Times" strategy from "Profit Now" who claims to have achieved 36.7% profit scalping XRPUSDT on the 1 minute timeframe in only 15 days. As you can see from the backtest results below, I was unable to substantiate anything remotely close to that that claim on any timeframe or symbol. Myth 10000% busted.
This strategy uses a combination of 2 open-source public indicators: Hull Suite by InSilico and Least Squares Moving Average (LSMA)
The Hull Moving Average (HMA) is a faster version of the traditional moving average and is designed to reduce lag and improve the responsiveness of the average to price changes. In this strategy the HMA is used as a trend-following indicator, When the HMA is rising it is indicative of an upwards trend and when its falling its indicative of a downtrend.
The Least Squares Moving Average (LSMA) used in this strategy is similar to the HMA in that it is designed to reduce lag and improve the responsiveness of the average to price changes. In this strategy the LSMA is used to also not only identify trends but also confirm signals, it also is used to identify possible changes in the trend and market conditions.
When we use these together, the Hull Suite and LSMA indicators provide a complimentary confirmation of trend direction and trend swings. The Hull Suite helps to identify and confirm trends, while the LSMA aids to confirm signals and identify potential changes in market conditions.
The way this strategy is designed is when the Hull Suite HMA is trending up and the LSMA crosses above the HMA, we enter a long condition. When the Hull Suite is trending down and the LSMA crosses below the HMA we take a short position. Because of the low latency of these two indicators this strategy can be used on lower time frames down to 1 minute. On high volatility crypto on the lowest time frames, a 1:4 Risk Ratio should be used. A lower less risk ratio should be used on less volatile archetypes of securities.
If you know of or have a strategy you want to see myth-busted or just have an idea for one, please feel free to message me
Strategy Myth-Busting #8 - TrendSurfers+TrendOsc - [MYN]This is part of a new series we are calling "Strategy Myth-Busting" where we take open public manual trading strategies and automate them. The goal is to not only validate the authenticity of the claims but to provide an automated version for traders who wish to trade autonomously.
Our 8th one is an automated version of the " 653% Gain Magical 1 Minute Scalping Strategy Tested 100 Times | Become Consistently Huge Profit " strategy from " Fxaccurate US " who claims to have achieved 653% profit scalping GOLD on the 5 minute timeframe. As you can see from the backtest results below, I was unable to substantiate anything close to that that claim on any timeframe or symbol. Myth 10000% busted.
If you know of or have a strategy you want to see myth-busted or just have an idea for one, please feel free to message me.
This strategy uses a combination of 2 open-source public indicators:
Trend Surfers - Premium Breakout + Alerts by TrendSurfersSignals
Mawreez' Trend Oscillator Indicator by Mawreez
Trading Rules:
1 min - 15 min candles
Stop loss middle between high and low Risk 1:2
Long Condition
Trend Surfers Trailing stop line goes below (Crosses) lowest low
Bullish Candle (red)
Mawreeze Trend Oscilator Indicator is green
Short Condition
Trend Surfers Trailing stop line goes above (Crosses) highest high
Bearish Candle (red)
Mawreeze Trend Oscilator Indicator is red

RSI Improved strategySet a Horizontal Ray at the price that relates highest / lowest RSI .
It 's more clear to decide when to open long / short position manually.
It's a scalping strategy that works in 15min chart(basically works in most of timeframe , if you don't look it as a scalping strategy), when RSI hits Highest / Lowest value , the strategy will open a Long / Short position.
The Default Risk Reward Ratio was 1 (1600 points : 1600 points) you can adjust it in settings
You guys can look it as a RSI alert indicator
Think before you do , use it wisely. Thanks a lot!
There is a lot of useless words in Pine if you wanna look it please ignore it.

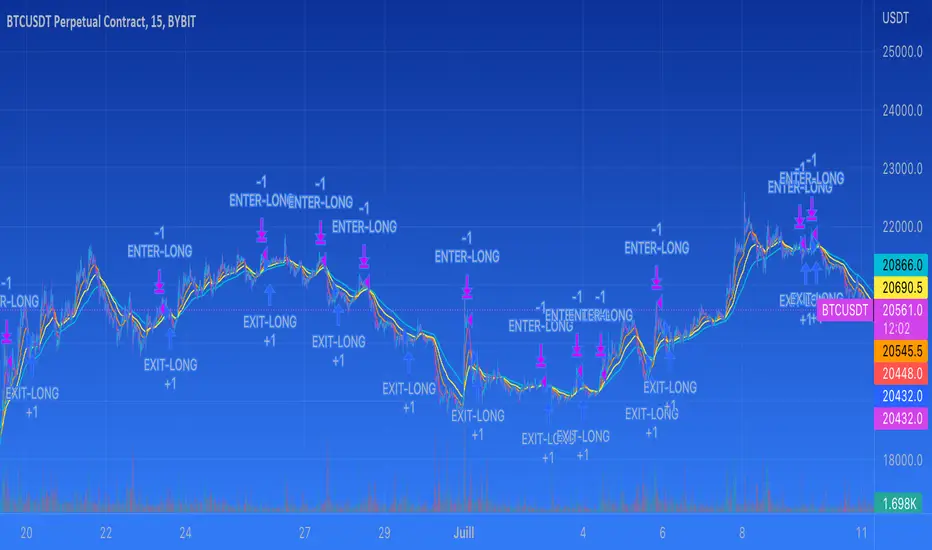
EMA SCALPEUR LONG V2THIS IS A TRY TO FIND THE BEST EMAS FOR SCALPING
YOU HAVE 4 EMAS, YOU CAN CHOOSE 2 FOR THE ENTER
This a try to find the best EMAs for scalping
you have 4 EMAs, 2 to find the best enter possible and 2 others to find the best way out possible
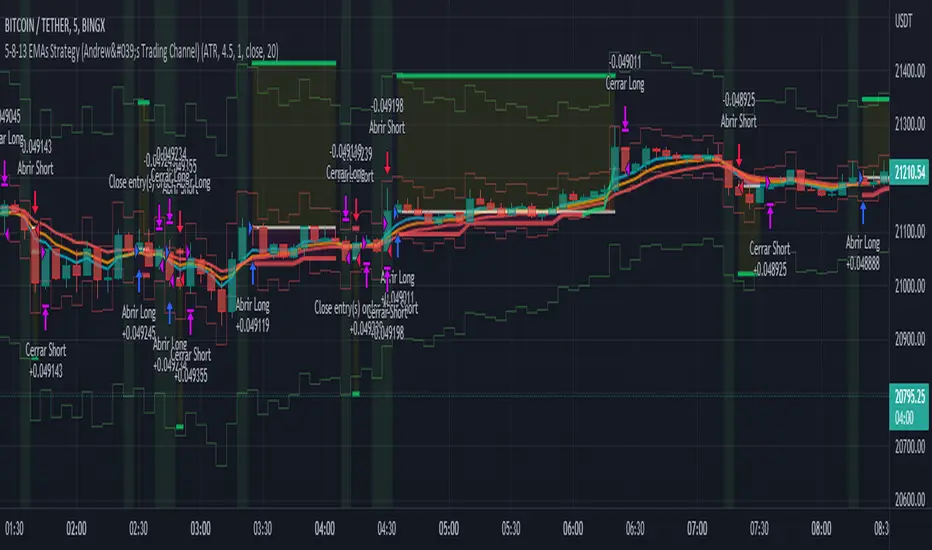
5-8-13 EMAs Strategy (Andrew's Trading Channel)============
ENGLISH
============
- Description:
This strategy was designed by "Andrew's Trading Channel" (credits to him for the base strategy).
A lot of improvements have been added to the strategy, more conditions, trailing stop, custom stop loss and take profit, everything explained below.
- CONDITIONS FOR ENTERING A LONG:
EMA 5 crossovers EMA 8.
- EXIT LONG:
EMA 8 crossovers EMA 8 and closing price goes below EMA 13.
- CONDITIONS FOR ENTERING SHORT:
EMA 8 crossovers EMA 5.
- EXIT SHORT:
EMA 5 crossovers EMA 8 and closing price goes above EMA 13.
- Visual:
All EMAs are visible (5, 8 and 13 periods) with different and customizable colors/width.
Position start price, take profit, stop loss and trailing stop (if present) are shown automatically.
Background color shows green when LONG conditions are met (and of course, position is opened on the next candle), same for SHORT but red.
- Usage and recommendations:
As this is a coded strategy, you don't even have to check for indicators, just open and close trades as the strategy shows.
There're various customizable settings like optional take profit/stop loss, trailing stop (both based on ATR or any of the EMAs), open only LONGs/SHORTs or both, date range...
Take profit and stop loss ATR default values have been tested for scalping on 5 min charts, however feel free to check strategy results and increase the winning rate/profit for your favorite asset.
- Customization:
As usual I like to make as many aspects of my indicators/strategies customizable, indicators, colors etc., feel free to ask if you feel that something that should be configurable is missing or if you have any ideas to optimize the strategy.
============
ESPAÑOL
============
- Descripción:
Esta estrategia fue diseñada por "Andrew's Trading Channel" (créditos a él por la estrategia base).
Se han añadido muchas mejoras a la estrategia, más condiciones, trailing stop, stop loss y take profit personalizados, todo explicado a continuación.
- CONDICIONES PARA ENTRAR EN LONG:
Cruce de EMA 5 con EMA 8 ascendente.
- SALIR DE LONG:
Cruce de EMA 8 con EMA 5 ascendente y el precio de cierre se sitúa por debajo de la EMA 13.
- CONDICIONES PARA ENTRAR EN SHORT:
Cruce de EMA 8 con EMA 5 ascendente.
- SALIR DE SHORT:
Cruce de EMA 5 con EMA 8 ascendente y el precio de cierre se sitúa por encima de la EMA 13.
- Visual:
Todas las EMAs son visibles (5, 8 y 13 períodos) con colores/anchos y personalizables.
El precio de inicio de la posición, el take profit, el stop loss y el trailing stop (si están presentes) se muestran automáticamente.
El color de fondo es verde cuando se cumplen las condiciones de LONG (y por supuesto, la posición se abre en la siguiente vela), lo mismo para SHORT pero en rojo.
- Uso y recomendaciones:
Como esta es una estrategia programada, ni siquiera tienes que comprobar los indicadores, sólo abrir y cerrar las operaciones como te muestra la estrategia.
Hay varios ajustes personalizables como el take profit/stop loss opcional, el trailing stop (ambos basados en el ATR o en cualquiera de las EMAs), abrir sólo LONGs/SHORTs o ambos, rango de fechas...
Los valores por defecto del take profit y el stop loss ATR han sido probados para scalping en gráficos de 5 minutos, sin embargo, siéntase libre de comprobar los resultados de la estrategia y aumentar la tasa de ganancia / beneficio para su activo favorito.
- Personalización:
Como siempre me gusta hacer personalizables todos los aspectos de mis indicadores/estrategias, indicadores, colores, etc., siéntase libre de preguntar si cree que falta algo que debería ser configurable o si tiene alguna idea para optimizar la estrategia.
MZ HTF HFT ROCit Bot - Non Repainting Scalper v1.2 ADX RSI MOM This is a new iteration based on my Momentum trading bot.
This is an original script meant to be a high frequency trader that works on higher time frame calculations.
I came up with the idea that using calculus I can figure out the actual rate of change and momentum with different calculations than the momentum indicator that is provided by trading view. Once momentum is shifted on a small time frame, it will provide an entry signal. The script is meant to be used on an algorithmic trading system for scalping purposes. It should be run on a one minute time frame. Unfortunately due to various plotting constraints in Pinescript, you cannot plot the rate of change and momentum and price in the same pane. To counter this, I have a showdata toggle to give you values of the indicators at each entry.
This version has two main entry settings toggled with a checkbox. There is the ROC (rate of change) version and the MOM (momentum) entry signals.
The rate of change version is meant to take a look at your moving average and try to trigger when it hits a certain rate of change point. This can be helpful if you rather play it safer. I have noticed that you can get slightly better entry points but also does not give you as many entries. The momentum algorithm will give you faster entry points and might work best with a slight offset (use your back test to help you figure it out).
I have started to add tooltips to help you along. If you have suggestions please let me know.
How does it work?
Let's just assume that you are looking at a one minute chart. I recommend using the one minute for bots because it will give you the fastest execution for entries. Pinescript has an issue where the signal is not usually sent until the end of the bar/beginning of next bar. If the signal was triggered at the beginning of a 15 minute bar, it might not actually send the signal until the following 15 minute bar. If you are trading on small time frames, this can make all the difference. If you are using an algo platform that trailing stops, stop losse, take profits, etc. I would recommend you use that platform to close your trade. The close trade message will work, but pinescript does not know the exact entry price you received, so if you are trying to collect small profits, it is best that intermediary platform does that calculation for you. If you are dealing with larger moves, instead of small 1-3% scalps, you are probably fine to use the close message setting from pinescript.
Ok, so to take an example. I like to use the 3L and 3S tokens on Kucoin. This gives you a lot of volatility to work with compared to other tokens and coins. However, it can also meas that you are likely taking a higher risk. However, there are some things that can help with that (more on that later).
So we have a token we want to run, and have it on the 1m chart.
First, be sure that all of your filters are OFF when you start playing with the back test. This allows you to see how to best optimize the bot.
Use the show data to show you additional data when you are backtesting. This can allow you to try to filter out results or market conditions that do not work. I typically work with the RSI and use the 30 minute and 15 minute RSIs. I make sure that it is trading within a certain band - about 40-75. You can try the inverse and only buy during really low RSI's as well.
www.dropbox.com
Find the source of your data with the variant drop down. You can use any time frame, open, close. high, low, olc4. Open is pretty much guaranteed to not have any repainting issues - although all the other calcs use a custom isbarconfirmed security repaint calculation. I have been finding that Open and SMA work well, but feel free to explore. If you use a source like open, close, high, low, etc - the interval will not change anything further. If you use a variant such as an sma, you should try to find an interval that works well for that token. For instance, try an sma of 8-11 minutes and see which gives you the best backtest result without changing anything else. Offset ALMA/LSMA parameters are only used for those specific variants. These specific parameters will also affect the ALMA and LSMA if you use that variant in the trend filter. In other words, you can skip these if you are not using those types of moving averages.
www.dropbox.com
Configure the ROC and MOM intervals. If you are using a source such as open, close, etc- this is where you set the interval for your change. So consider using OHLC4 or a interval of 5 thru 15 and see what works best. The Momentum inverval usually works best in the 2-5 bars. There is a custom calculation I added in to try to filter out false entries as momentum is waning. This calculation works best in 2-5 bar interval.
Configure the trigger point and offset. If you are using rate of change, the best settings will likely be between -1 to 0.5. If you are using momentum, you will likely want -20 to 10. This is where you will notice the entries will shift a bit. Try to find a balance between your backtest settings and actually finding what you thin will be the best entries based on a slight delay from trading view, to algo, to your trading platform. This can likely be a minute (maybe even) or so- so be sure to not get too caught up between the backtest results and be sure to finesse the entries to actually fit nicely - maybe a bar earlier than you would likely think. If your entries are coming in too early, you can use the offset to delay your entry by a few bars. This is both science and an art form- don't get too caught up on the back test results as that is based on having all the data tha already transpired, it's not based on how it will actually perform during deployment.
Take profit and stop loss. This should be self explanatory. This script can toggle between static take profit and a trailing profit. For scalping, you will likely want to limit it below 2% to get a good win ratio. Stop loss should be at least 5-6% for these types of 3L/3S tokens to give the strategy some room to move (if the token goes down 2% before it shoots back up, the price will go down 6%). This does not yield the best R/R ratio from a traditional trader perspective, but the statistical probabilities are in your favor for these events will happen. If you have better ideas for how to set this all up, feel free to contribute your ideas in the comments as we can all learn from each other. You can definitely set a much tighter stop loss with a larger take profit to get a lower win rate but in turn might get much better returns. It's all up to you.
FILTERS www.dropbox.com
These filters require you to know a bit about each indicator and how you want to use them. I will only go over the general idea.
Variant Filter - this is especially useful if you want to trade above a moving average. Say for instance you only want to take trades when we are over the 100 Day moving average. Or above a 30 minute, 30 bar EMA, etc. Although originally ported over from my other scripts, this is not a filter that I use often in conjunction with this script.
RSI - perhaps you want to buy when we are below the 30 line on the 30 minute RSI, or we want only want to have the strategy work when we are above the 50 RSI, this can all be configured here. I typically like to try a few different rationales here.
Now with brand NEW ADX filter - this is a brand new idea that seems to work rather well. Based on your ADX settings you can also turn on the "only uptrend" which will try to calculate if you are in an uptrend based on your ADX config. Please keep in mind that uptrend is based relatively on the ADX settings.
- There is a sprinkle of RSI magic in the entry signal to make sure that rsi is not declining in the calculation, so this can affect how many entries you get.
Some other tips:
Forward test.
Set up your algo bot on a one minute interval.
Set up take profit and stop loss on your algo trading platform.
Don't use the exact settings as your backtest, maybe try a slightly more conservative approach from the algo trading platform to make sure you are within range of triggering your events with a slight delay from signal to execution. If you have a 1.6% take profit, perhaps try 1.5% on your platform first.
By using these scripts you agree that you are trading at your own risk. I make no guarantees of returns or results. I just provide tools to help you trade better. However, I hope this ROCit will take you to the moon. And if it does, be sure to give me a shout as well as some tips of your own.
Send me a message with any questions or suggestions.

Customizable Non-Repainting HTF MACD MFI Scalper Bot Strategy v2Customizable Non-Repainting HTF MACD MFI Scalper Bot Strategy v2
This script was originally shared by Wunderbit as a free open source script for the community to work with. This is my second published iteration of this idea.
WHAT THIS SCRIPT DOES:
It is intended for use on an algorithmic bot trading platform but can be used for scalping and manual trading.
This strategy is based on the trend-following momentum indicator . It includes the Money Flow index as an additional point for entry.
This is a new and improved version geared for lower timeframes (15-5 minutes), but can be run on larger ones as well. I am testing it live as my high frequency trader.
HOW IT DOES IT:
It uses a combination of MACD and MFI indicators to create entry signals. Parameters for each indicator have been surfaced for user configurability.
Take profits are now trailing profits, and the stop loss is now fixed. Why? I found that the trailing stop loss with ATR in the previous version yields very good results for back tests but becomes very difficult to deploy live due to transaction fees. As you can see the average trade is a higher profit percentage than the previous version.
HOW IS MY VERSION ORIGINAL:
Now instead of using ATR stop loss, we have a fixed stop loss - counter intuitively to what some may believe this performs better in live trading scenarios since it gives the strategy room to move. I noticed that the ATR trailing stop was stopping out too fast and was eating away balance due to transaction fees.
The take profit on the other hand is now a trailing profit with a customizable deviation. This ensures that you can have a minimum profit you want to take in order to exit.
I have depracated the old ATR trailing stop as it became too confusing to have those as different options. I kept the old version for others that want to experiment with it. The source code still requires some cleanup, but its fully functional.
I added in a way to show RSI values and ATR values with a checkbox so that you can use the new an improved ATR Filter (and grab the right RSI values for the RSI filter). This will help to filter out times of very low volatility where we are unlikely to find a profitable trade. Use the "Show Data" checkbox to see what the values are on the indicator pane, then use those values to gauge what you want to filter out.
Both versions
Delayed Signals : The script has been refactored to use a time frame drop down. The higher time frame can be run on a faster chart (recommended on one minute chart for fastest signal confirmation and relay to algotrading platform.)
Repainting Issues : All indicators have been recoded to use the security function that checks to see if the current calculation is in realtime, if it is, then it uses the previous bar for calculation. If you are still experiencing repainting issues based on intended (or non intended use), please provide a report with screenshot and explanation so I can try to address.
Filtering : I have added to additional filters an ABOVE EMA Filter and a BELOW RSI Filter (both can be turned on and off)
Customizable Long and Close Messages : This allows someone to use the script for algorithmic trading without having to alter code. It also means you can use one indicator for all of your different alterts required for your bots.
HOW TO USE IT:
It is intended to be used in the 5-30 minute time frames, but you might be able to get a good configuration for higher time frames. I welcome feedback from other users on what they have found.
Find a pair with high volatility (example KUCOIN:ETH3LUSDT ) - I have found it works particularly well with 3L and 3S tokens for crypto. although it the limitation is that confrigurations I have found to work typically have low R/R ratio, but very high win rate and profit factor.
Ideally set one minute chart for bots, but you can use other charts for manual trading. The signal will be delayed by one bar but I have found configurations that still test well.
Select a time frame in configuration for your indicator calculations.
Select the strategy config for time frame (resolution). I like to use 5 and 15 minutes for scalping scenarios, but I am interested in hearing back from other community memebers.
Optimize your indicator without filters : customize your settings for MACD and MFI that are profitable with your chart and selected time frame calculation. Try different Take Profits (try about 2-5%) and stop loss (try about 5-8%). See if your back test is profitable and continue to optimize.
Use the Trend, RSI, ATR Filter to further refine your signals for entry. You will get less entries but you can increase your win ratio.
You can use the open and close messages for a platform integration, but I choose to set mine up on the destination platform and let the platform close it. With certain platforms you cannot be sure what your entry point actually was compared to Trading View due to slippage and timing, so I let the platform decide when it is actually profitable.
Limitations: this works rather well for short term, and does some good forward testing but back testing large data sets is a problem when switching from very small time frame to large time frame. For instance, finding a configuration that works on a one minute chart but then changing to a 1 hour chart means you lose some of your intra bar calclulations. There are some new features in pine script which might be able to address, this, but I have not had a chance to work on that issue.

StocasticRSI EMAs ATR StrategyA scalping based strategy thats works well with EUR/USD 30 minute time frame.
This strategy uses stochasticRSI for trade entry. Uses two exponential moving averages for trend detection. The strategy uses Average True Range for stop loss and for two profit targets.
We only trade with the trend if the 50 period exponential moving averages is above the 200 period exponential moving averages. StocasticRSI must cross below 30 level by default for a long entry if the rend is up. Likewise with a short entry the stochasticRSI must crossover above 70 level and if the trend is down.
This script does not trail your stop loss as I have noticed it does not give me good results. Stop loss is a fix stoploss based on Average True Range and so are the profit targets.
This script has risk management, it risk a certain percent of the inputed capital amount in the setting. See settings for more details.
Green line is 50 period exponential moving averages and red line is the the 200 period exponential moving average. Blue line is stoploss for short trade and black line stop loss for buy trade.
Since this is a scalping strategy be caution with the commission and slippage. I have inputed 1 for commission and 1 for sllipage.
Many Thanks,
Honest Trader

Crypto EMA Trend Reversal StrategyThis is an EMA crossover strategy which involves 5 EMAs to trigger trades. The strategy has two take profit settings and uses a stop loss.
TP1 and SL are based on ATR and TP2 is an EMA crossover.
The strategy goes both long and short and the default settings work particularly well as a scalping strategy for ETHUSDT on the 5M time frame.
I have also created another version with tweaked settings for scalping LINKUSDT on the 5M with very similar results.
There is an option to add a volume condition parameter within the script on lines 26-28 which can be added to the end of lines 34-35 in the following format: and vol_cond
I personally don't currently use the volume condition parameter.

Bitcoin (BTC) Scalp / Short-term Short IndicatorThe purpose of this scalping Indicator is to help identifying Sell signals for short term trades on Bitcoin (Spot, Features, etc.) .
This script is working with more indicators and everything is balanced by hard work on (back)testing.
Result for users is a simple signal to SELL.
You can use it as easy indicator in your graph or create alerts.
I have the best results on 1min graph, with leverage and stop-loss feature.
This is my own version of scalping Sell Script / Indicator, which is a combination of few indicators, for example RSI , BB and price levels (actual and average) and works on standard candles.
SELL signal paints above the candle and you can set your target / trailing / stop-loss in the settings and check how it works in Strategy Tester.
Settings of this Indicator:
Take Profit
Stop Loss
Trailing Stop Loss
Trailing Stop Loss Offset
Initial Capital
Base Currency
Order size
Pyramiding
Commissions
Slippage
Average price lines (colors and visibility)
Plot background
These signals can be often observed at the beginning of a strong move, but there is a significant probability that these price levels will be revisited at a later point in time again.
Therefore these are interesting levels to place limit orders.
A Sell signal is defined as the last up candle before a sequence of down candles.
In my trading settings I have more but small positions, one safety limit order (for price averaging = better entry - easier close in profit) and stop-loss.
Sometimes trailing-profit feature have very nice profits.
Settings depends on your own money-management and free capital.
Don't ignore UP / DOWN trend. For UP trend I have an Indicator too (check my profile).
In addition to the upper/lower limits of each line, also average value is marked as this is an interesting area for price interaction and better view.
PM me to obtain access, more informations or support.
NOTICE: By requesting access to this script you acknowledge that you have read and understood that this is for research purposes only and I am not responsible for any financial losses you may incur by using this script.

Bitcoin (BTC) Scalp / Short-term Long IndicatorThe purpose of this scalping Indicator is to help identifying Buy signals for short term trades on Bitcoin (Spot, Features, etc.) .
This script is working with more indicators and everything is balanced by hard work on (back)testing.
Result for users is a simple signal to BUY .
You can use it as easy indicator in your graph or create alerts.
I have the best results on 1min graph, with leverage and stop-loss feature.
This is my own version of scalping Buy Script / Indicator, which is a combination of few indicators, for example RSI, BB and price levels (actual and average) and works on standard candles .
LONG signal paints below the candle and you can set your target / trailing / stop-loss in the settings and check how it works in Strategy Tester .
Settings of this Indicator:
Take Profit
Stop Loss
Trailing Stop Loss
Trailing Stop Loss Offset
Initial Capital
Base Currency
Order size
Pyramiding
Commissions
Slippage
Average price lines (colors and visibility)
Plot background
These signals can be often observed at the beginning of a strong move, but there is a significant probability that these price levels will be revisited at a later point in time again.
Therefore these are interesting levels to place limit orders.
A Buy signal is defined as the last down candle before a sequence of up candles.
In my trading settings I have more but small positions, one safety limit order (for price averaging = better entry - easier close in profit) and stop-loss.
Sometimes trailing-profit feature have very nice profits.
Settings depends on your own money-management and free capital.
In addition to the upper/lower limits of each line, also average value is marked as this is an interesting area for price interaction and better view.
PM me to obtain access, more informations or support.
NOTICE: By requesting access to this script you acknowledge that you have read and understood that this is for research purposes only and I am not responsible for any financial losses you may incur by using this script.

RSPRO StrategyStrategy for RSPRO indicator
Based on resistance/support and bollinger band fluctuations this indicator also has filter with x bars after RSI overbought/oversell zones from settings.
There are two types of entries and signals: early (usually before trend changes) and main (when trend started to reverse)
Fits for BTC and any altcoins. And any assets. Good for both scalping and position trading (depends on timeframe that you use)
Best use it with big timeframes: 45 and 90min, 2 and 4 hours for position trading.
For scalping 5-30min timeframes are good too.
In Script settings you can specify:
1) RSI period, 14 by default.
2) Show early entries (squares), enabled by defaults.
3) Show main entries (triangles), enabled by defaults.
4) Enable/Disable filter to show main entries only after RSI overbought/oversell regions
Disabled by defaults and RSI is 67 for upper zone and 33 for lower zone.
You can also specify how many bars back before current bar this filter must do. It's 10 by default, you can vary it up to 90.
+With customisable start/end date, take profit and stop-loss.
This is invite only script. PM me if you want to test it.
ck - CryptoSniper Longs Only (Strategy) v1Hey all,
This is a new script I have been working on and is in Beta testing stage.
It is best used for scalping 1/3/5/10/15 minutes.
Default settings are great for scalping, changing the “Period” will allow you to tweak for swing trades.
To use manually, you will get a Green triangle to alert you to be prepared to place an order.
This will happen 1 candle before the strategy paints an “open long” label on the chart.

BB+AO STRATto be used with AO indicator, based on forex strat --
www.forexstrategiesresources.com
works on 1/3/5/15/30 candles, buy signals are best when the black 3 fast ema crosses up through the red mid band

BB+AO STRATto be used with AO, based on forex strat --
www.forexstrategiesresources.com
works on 1/3/5/15/30 candles

MonkHey all!
I am back again with another script to scalp the ES! "Monk" is my newest scalping script that is the result of several weeks of R&D. This script was designed specifically for trading on 1-minute charts on a specific instrument.
As some of you will remember, I published several scalping scripts months ago that had very favorable profit factors. Of these scripts, the only one to truly stand the test of time was my "Little Scalper" script. In the creation of "Monk" I believe I have come up with another script that has the workings of a strategy that can remain profitable forever.
In this script I have employed the use of VWAP but in a very non-conventional way. I have also employed several other filters that will remain under wraps. Unlike my other scripts, "Monk" has a defined profit target AND a defined stop loss (Little Scalper has no stop loss). As always, this script DOES NOT repaint. If you would like access, please leave a comment. I will open up access to this script for the next 1-2 weeks for parties who are interested.
On another note, many users have messaged me about access to "Little Scalper". I am considering selling access to "Little Scalper" on a monthly basis for those who are interested.
Best,
-Ian
