God of Scalping BTCUnleash divine precision in the chaotic realm of BTC scalping with the God of Scalping BTC—a bespoke, price-action powerhouse crafted for lightning-fast entries and exits on 1-5 minute charts. Forged from raw momentum velocity (no recycled RSI or MACD here), this indicator detects micro-trend accelerations to pinpoint surge moments where BTC's volatility bends to your will.Core Mechanics:Velocity Engine: Calculates fast (default: 3-bar) and slow (default: 8-bar) price speeds, then derives normalized acceleration using ATR (14-bar) to filter noise in BTC's wild swings.
Surge Detection: Smoothed signal line confirms crossovers—bullish when acceleration surges above signal with positive bias; bearish on the downside.
Volume Guardian: Triggers only on 20%+ volume spikes above its EMA (10-bar), ensuring conviction behind the chaos.
Visual Oracle:Blue/Red Lines: Fast (EMA close, 3-bar) and slow (EMA close, 8-bar) velocity trends for trend context.
Background Glow: Subtle green/red tint for real-time momentum bias.
Divine Arrows: Green triangles below bars for BUY surges; red above for SELL—your scalp signals from the heavens.
Scalping Ritual:Optimal Altar: Load on BTCUSD/USDT (1m-5m). Tune lengths for your broker's feed.
Invocation: Enter long on green arrow (target 0.1-0.3% gains), short on red. Tight stops at recent swings; exit on opposite signal or threshold breach (1.5x mult).
Alerts: Built-in notifications—"God Surge Buy: BTC Scalp Entry!"—to summon you mid-prayer (er, trade).
Backtested for BTC's fury, this isn't a holy grail, but a scalper's Excalibur: pure, adaptive, and unyielding. Trade wisely—markets are mortal, your edge is eternal.
In den Scripts nach "scalping" suchen

UMA Scalping Level 2025UMA Scalping Level 2025は、「直近で市場が意識している高値・安値ライン」と
「短期トレンドの勢い(EMAクロス)」を同時に捉えるスキャルピング特化型インジケーターです。
"UMA Scalping Level 2025" is a scalping-focused indicator that simultaneously captures the recent key swing highs and lows that the market is reacting to, and the short-term momentum identified by EMA crossovers.

HF Crypto Scalping BotHigh-Frequency Crypto Scalping Bot for ETHUSDT
This bot is designed for scalping ETHUSDT on a 1-minute chart using a blend of technical indicators and market structure logic.
🔍 Strategy Highlights:
Range Mode: Uses RSI and MFI to identify overbought/oversold zones near support/resistance.
Trend Mode: Detects MACD momentum combined with confirmed S/R breakouts.
Smart Risk Management: Dynamic stop loss and take profit based on risk:reward ratio.
Adaptive Market Logic: Automatically switches between trend and range conditions.
Real-Time Table: Displays RSI, MFI, MACD trend, market mode, entry/exit prices, and stop/target levels.
Visual Cues: Buy/Sell/Exit signals plotted directly on the chart with color-coded levels.
Alerts: Integrated long/short entry and exit alerts with live price and indicator values.
Customize the input parameters to fit your risk profile and asset volatility. Ideal for fast-paced scalping with dynamic conditions.

Backside Bubble ScalpingFrom LIHKG
Pine from Perplexity AI
以下是Backside Bubble Scalping策略的使用說明,旨在幫助交易者理解如何在美股交易中應用這一策略。
使用說明:Backside Bubble Scalping 策略
1. 前提條件
交易時間:此策略適用於香港時間晚上9:30 PM至12:00 AM。
圖表類型:使用1分鐘圖表進行交易。
2. 策略概述
Backside Bubble Scalping策略包含兩種主要的設置:尖backside和鈍backside。這些設置通常在10:00 PM至12:00 AM之間出現。
3. 指標設定
VWAP(粉紅色):成交量加權平均價格,用於識別市場趨勢。
9 EMA(綠色):9期指數移動平均線,用於捕捉短期價格變化。
4. 識別 Backside 設置
尖backside
特徵:
當市場趨勢為純紅色下跌,並形成尖尖的V形底部。
入場條件:
當價格突破9 EMA並經過小幅盤整後,進場做多。
鈍backside
特徵:
在混合顏色的趨勢中,形成鈍鈍的V形底部。
入場條件:
在盤整期間進場做多。
5. 止損和止盈設置
止損位置:
尖backside:設置在9 EMA上方的盤整範圍底部加上0.2。
鈍backside:設置在V底部的最低點加上0.2。
止盈位置:
尖backside:當價格跌破VWAP或出現一根K線沒有跟隨時出場。
鈍backside:當一根K線的三分之二身體向下突破9 EMA時出場。
6. 操作步驟
監控市場動態:在指定的交易時間內,觀察VWAP和9 EMA的變化。
識別入場信號:根據尖backside或鈍backside的條件進行判斷,確定何時進場。
設置止損和止盈:根據上述條件設置止損和止盈位,以管理風險。
執行交易:根據信號執行交易,並持續監控市場情況以調整策略。
7. 注意事項
避免在VWAP附近進行交易,以減少失敗風險。
如果出現影線(wick bar),建議不要進行交易,因為這可能表示該設置失敗。
BINANCE-BYBIT Cross Chart: Spot-Perpetual CorrelationName: "Binance-Bybit Cross Chart: Spot-Perpetual Correlation"
Category: Scalping, Trend Analysis
Timeframe: 1M, 5M, 30M, 1D (depending on the specific technique)
Technical analysis: This indicator facilitates a comparison between the price movements shown on the Binance spot chart and the Bybit perpetual chart, with the aim of discerning the correlation between the two charts and identifying the dominant market trends. It automatically generates the corresponding chart based on the ticker selected in the primary chart. When a Binance pair is selected in the main chart, the indicator replicates the Bybit perpetual chart for the same pair and timeframe, and vice versa, selecting the Bybit perpetual chart as the primary chart generates the Binance spot chart.
Suggested use: You can utilize this tool to conduct altcoin trading on Binance or Bybit, facilitating the comparison of price actions and real-time monitoring of trigger point sensitivity across both exchanges. We recommend prioritizing the Binance Spot chart in the main panel due to its typically longer historical data availability compared to Bybit.
The primary objective is to efficiently and automatically manage the following three aspects:
- Data history analysis for higher timeframes, leveraging the extensive historical data of the Binance spot market. Variations in indicators such as slow moving averages may arise due to differences in historical data between exchanges.
- Assessment of coin liquidity on both exchanges by observing candlestick consistency on smaller timeframes or the absence of gaps. In the crypto market, clean charts devoid of gaps indicate dominance and offer enhanced reliability.
- Identification of precise trigger point levels, including daily, previous day, or previous week highs and lows, which serve as sensitive areas for breakout or reversal operations.
All-Time High (ATH) and All-Time Low (ATL) levels may vary significantly across exchanges due to disparities in historical data series.
This tool empowers traders to make informed decisions by leveraging historical data, liquidity insights, and precise trigger point identification across Binance Spot and Bybit Perpetual market.
Configuration:
EMA length:
- EMA 1: Default 5, user configurable
- EMA 2: Default 10, user configurable
- EMA 3: Default 60, user configurable
- EMA 4: Default 223, user configurable
- Additional Average: Optional display of an additional average, such as a 20-period average.
Chart Elements:
- Session separator: Indicates the beginning of the current session (in blue)
- Background: Indicates an uptrend (60 > 223) with a green background and a downtrend (60 < 223) with a red background.
Instruments:
- EMA Daily: Shows daily averages on an intraday timeframe.
- EMA levels 1h - 30m: Shows the levels of the 1g-30m EMAs.
- EMA Levels Highest TF: Provides the option to select additional EMA levels from the major timeframes, customizable via the drop-down menu.
- "Hammer Detector: Marks hammers with a green triangle and inverted hammers with a red triangle on the chart
- "Azzeramento" signal on TF > 30m: Indicates a small candlestick on the EMA after a dump.
- "No Fomo" signal on TF < 30m: Indicates a hyperextended movement.
Trigger Points:
- Today's highs and lows: Shows the opening price of the day's candlestick, along with the day's highs and lows (high in purple, low in red, open in green).
- Yesterday's highs and lows: Displays the opening price of the daily candlestick, along with the previous day's highs and lows (high in yellow, low in red).
You can customize the colors in "Settings" > "Style".
It is best used with the Scalping The Bull indicator on the main panel.
Credits:
@tumiza999: for tests and suggestions.
Thanks for your attention, happy to support the TradingView community.

GOLD MonitorI'm using this platform from sometime and I carry out trading on Gold, using a kind of scalping strategy.
Scalping is not an easy task to do. Personally I found a lot of problems while detecting the trend direction.
So I decided to develop an indicator that is capable, in a discrete way, to give an instant-view on the market that is interesting.
This indicator can summarize in a small table all interesting figures related to gold scalping trading and is useful while joined with technical and fundamental analysis.
In this way it is possible to easy take under control all important aspects related to gold trading that I summarize here and you can find inside the table:
1) Gold / USD current direction
2) USD dollar strength (instant DXY) indicator take under consideration the DXY value every each tick and measures the increase or decrease in percentage. If there is a decrease the indicator displays a red low arrow, if there is an increase the indicator displays a green high arrow
also Gold friends are important so it is possible to find also:
3) NZDUSD (that is a Gold friend) variation percentage. If there is a decrease the indicator displays a red low arrow, if there is an increase the indicator displays a green high arrow
4) AUDUSD (that is a Gold friend) variation percentage. If there is a decrease the indicator displays a red low arrow, if there is an increase the indicator displays a green high arrow
then it is possible to find DXY USD dollar strength calculated between previous period (e.g. in timeframe M5 last 5 minutes) and current period (current 5 minutes). This indication is represented by an high arrow if there has been an increase, or by an low arrow if there has been a decrease.
Last but not least the information about the Gold trend itself with the possible forecast for the current period. This information must be carefully interpreted together with other instruments for technical analysis like Fibonacci lines.

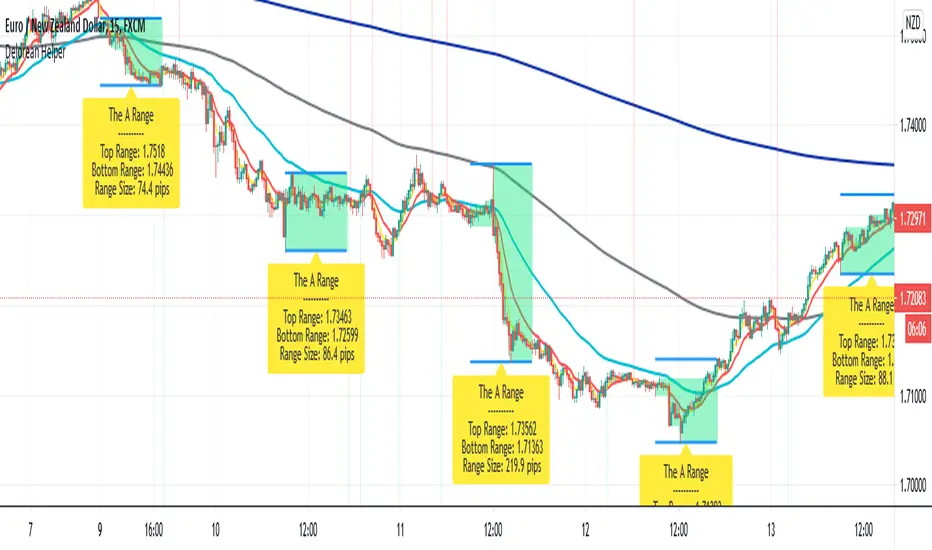
Delorean Helper by MrTuanDoanThis is a helper indicator for Delorean strategy by Tyrone Foster a.k.a Vector King.
Delorean is a scalping strategy based on EMAs.
EMA 5/13/50/200/800 followed by yellow/red/aqua/gray and blue color
Delorean use 5/13/50 EMAs for short term trend (Scalping).
And 200/800 EMAs for long term trend.
We aim for the EMA 5/13 cross over/under (a.k.a Shift) for scalping in London Session.
We will decide the quality of the shift based on the much the market moves in Sydney & Tokyo sessions (a.k.a The A Range).
The A Range is calculated from 9AM-5PM AEDT (Sydney time).
v0.1 features
Draw Delorean's EMAs template
Show SHIFTS signals (green/red arrows)
Show "The A Range" info
Fully custom color and style
How to use The A Range
Only look for SHIFT signals when Range Size less than 50 pips
Only look for SHIFT signals when market creates false break out on the A Range
How to use SHIFT signals
Green arrow for BUY
Red arrow for SELL
Please always follow your risk management.
Cyatophilum Scalper [ALERTSETUP]This indicator comes with a backtest and alert version. This is the alert version. Its purpose is to create low timeframe and scalping strategies, by choosing from a list of built-in entry points which are described in detail below, and by configuring a risk management system to your liking.
Before diving into the entry points, I will explain the strategy and risk management settings.
These 3 settings allow to choose your strategy direction, and main behavior.
- Go Long ↗: activate or deactivate long entry points.
- Go Short ↘: activate or deactivate short entry points.
- Reversal strategy ↗↘↗↘: Activate this option will allow trades to reverse position from an opposite entry point. Keep it deactivated and trades will either wait a TakeProfit(TP) or StopLoss(SL) to be closed. When neither SL nor TP or set, this option is automatically activated.
StopLoss settings:
Both Long and Short SL can be activated and configured.
The base % price is the starting point of the stoploss, in a percentage of current price.
Trailing stop, when activated, works with 2 settings:
- % Price to Trigger: a percentage of current price the price should move in a bar to trigger a trailing movement.
- % Price Movement: the stoploss variation in a percentage of current price that moves on each bar.
TakeProfit settings:
Both Long and Short TP can be activated and configured.
The base % price is the value of the TP, in a percentage of current price.
Trailing Profit Deviation %: Percent deviation for the trailing take profit.
DCA:
DCA stands for Dollar Cost Average. The idea is to open additional orders from the base order so as to improve risk management.
These additional orders are also called Safety Orders. The indicator can handle up to 9 safety orders.
The strategy will exit either from a take profit based on percentage from base order or from a total volume percentage (Configurable in the parameters).
The steps spacing (space between each step) and safety orders volume (order size) can both scale by adding a scale multiplier.
By choosing from the base strategy dropdown menu, the indicator will generate entry points.
1. BUY SELL:
-> Low timeframes spot trading, with simple buy and sell orders.
How it works:
The indicator used is a combination of QQE (Atr based trend following indicator) and RMA 100 trendline.
I think the QQE does a great job in low timeframes because it is not impacted by the noise.
The RMA which is the moving average used in the RSI, will help giving confirmation to the entry points.
How to use:
It is meant to be used as a reversal strategy, but you can add a TP or SL if you want.
When comparing to Buy & Hold, make sure to deactivate the "Short results in the backtest" setting.
2. TREND SCALPING
-> A strategy for low timeframes trading.
How it works:
The strategy creates high volatility entries filtered by a duo convergence of adaptive trendlines (Adaptive HULL MA using the chart's resolution, Adaptive Tilson T3 using 1H resolution) and a higher timeframe (1H) RSI filter (long threshold: 70, short threshold: 40, RSI length: 10).
How to use:
Must be used on charts with a resolution smaller than 1H. Recommended: from 1m to 30m.
Must NOT be used as reversal strategy. Use it with a take profit and stop loss, and DCA if you can.
Sample risk management settings:
3. Support/Resistance BREAKOUTS
-> Trade low timeframes pivot points breakouts.
How it works:
The indicator calculates the 100 previous bars swing high and low. Any break above high or below low will trigger an entry point.
The entry is however filtered by an Adaptive Tilson T3 Trendline, an ADX 30 minimum threshold and a minimum average volume threshold.
How to use:
I recommend to click "Reversal" Strategy and set a Takeprofit target.
Find the best timeframe between 1m and 30m using the backtest version.
Example here with BTCUSDTPERP on 15m:
4. AGGRESSIVE SCALPING
-> Lots of trades in low timeframes.
How it works:
Created using Cyato AI, Higher/Lower Highs and Lows and 2 HULLMA crosses as entries, and 2 Adaptive Tilson T3 as trendfilter, a 25 ADX threshold filter and a volume filter.
How to use:
Recommended Risk Management settings: Takeprofit, Stoploss and DCA (Safety orders).
Find which timeframe work the best from 30 min and below. Should not be used above 30 min since this is the resolution for the MTF Tilson.
How to create Alerts:
Click Add alert, then select the indicator, and choose the alert for your order.
Most used alerts are "LONG ENTRY", "SHORT ENTRY" and "ALL EXITS".
You will find a description of each alert in the default alert message.
To gain access to this paid indicator, please use the link below.

Crypto Scalper Pro Study / Alerts===========
Crypto Scalper Pro Study Script with Alerts
===========
Our Crypto Scalper Pro Study with Alerts Script is a carbon copy of our tried and tested Crypto Scalper Pro Strategy , but now with the option of setting TradingView Alerts for your chosen trading plan. Making missing trades a thing of the past, and helping you to automate your own trading strategy using AutoView, 3Commas or similar 3rd party Auto Trading Software.
-----------
Crypto Scalper Pro is a scalping strategy developed to work alongside our Crypto Tipster Strategy, now you can trade the D markets with our Tipster, and Intra-Day markets with our Scalper!
This strategy works very well on shorter time frames across multiple crypto pairs, everything from 4H all the way down to a 5m chart, our Crypto Scalper will find the best Entry and Exit points for consistent and reliable returns.
We've added a few variables for you to play with to fine tune this scalper to suit your chosen trading plan - however, these will only adjust the strategy to a certain degree, as there are many algorithms and indicators doing their thing hidden in the background that take precedence.
-----------
What's Included?
Crypto Scalper Pro comes with a host of features and is being continually updated, these features include (but are not limited to):
- Date Range Settings
Setting custom Start/End dates can help hone your strategy to suit the current times, or get a general overview of the market over the years.
- Heikin Ashi Confirmation
We added HA confirmation for both Entry & Exit of trades. This started as a form of "Safe Mode", we have since adapted our safe mode far beyond Heikin Ashi; but kept this confirmation as an added extra.
- Variable Indicator Settings
As well as our Fixed Indicators and Price Action analysis going on in the background of the strategy, we've also included some Variable Indicators that you have access to edit.
Lookback Period will help establish how far back you'd want to be confirming price indications on the strategy - the higher the number the further back it will look, making the Scalping Strategy appear smoother with less trades during choppy times, the downside with a higher lookback is you might miss the start of a potentially epic trade, and only be shown an Entry after the event has already happened.
We find Lookback Lengths of between 5 and 100 could work depending on various other settings, the market being traded, and the timeframe being used.
MA Length (Length of Moving Average) - We use a few MA's to best determine various factors involved with successfully scalping a market, overall trend direction, current price movements and fake-out detection to name just a few. You've got the option of determining a good average length for a few of these variables.
Again, a short MA Length will catch every big move right at the start, but you're almost guaranteed a Negative Expected Value with that method, due to the vast quantity of losing trades in times of chop/ranging markets. A Higher MA Length will remove a lot of chop, reduce the quantity of trades, and therefore (should) result in a higher Percent of Trades Profitable; it will however add a certain lag to the strategy, meaning those highly profitable trades we're looking for may turn out to be not so highly profitable!
- Safe Mode
Enabling Safe Mode will add a couple more confirmation indicators to the strategy - the aim of Safe Mode is, in essence, to remove any trading signals that would end of being false/bad moves. Usually resulting in less Overall Trades, a higher Net Profit, higher % Profitable, higher Profit Factor AND a lower Drawdown. Use Safe Mode to help eliminate orders that would otherwise be placed in choppy markets.
- Stop Loss/Take Profit Settings
This is where Crypto Scalper Pro really proves itself, Money Management. We have an editable Fixed SL/TP, as well as Trailing Stops for Long or Short orders, all of which you can use on their own, or combined with each other. Playing with these settings can turn an un-profitable system into a very-profitable trading plan!
-----------
What's Included within Crypto Scalper Study / Alerts Script?
Our Study script will find Entry and Exit points exactly as our Pro Strategy would find them. The same indicators, methods and chart reading techniques are used, there are 2 big differences however...
The first difference is that our Pro Strategy has the ability to manage your money, Fixed Stops, Take Profit and Trailing Stops to name just a few. Our Study does not (yet) have these functions added due to the way TradingView's charting platform operates.
That's the bad news, the good news for our Crypto Scalper Study Script is that you can add Alerts to your trading plan! This is super handy if you decide to implement our methods into different time frames across various markets and are looking for Intra-day Alerts, or if you're looking to Automate your trading strategy using external software.
Help and Advice for setting up Alerts or to Automate your Strategy can be found on our website.
----------
For more information on the Crypto Scalper Pro Strategy visit the link in our signature.
Good Luck and Happy Trading!

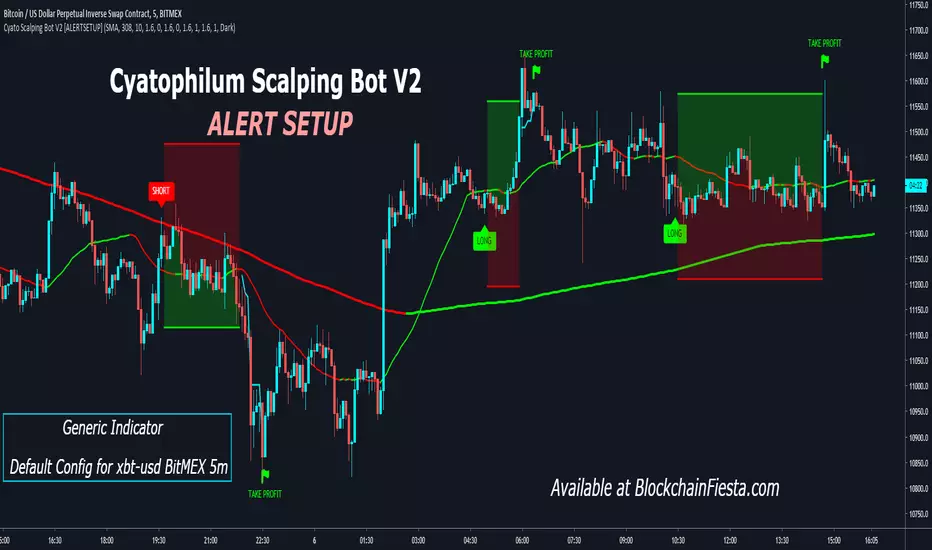
Cyatophilum Scalping Bot V2 [ALERTSETUP]Alert Setup version of Cyatophilum Scalping Bot V2.
Improved version of Cyatophilum Scalping Bot
Default settings for BITMEX:XBTUSD 5m
2% stop loss
2% trailing take profit
Release Notes: Added SMA, EMA and TEMA to the Trend Detector options.
Contrarian Scalping Entry Support v2.3Update - You can Switch DFMA_Arrow (Different type Resolution and SMA Length)
// @version=2
// Copyright @ ALEX SHORT
// Indicator Name : Contralian Scalping Entry Support
// alpha tester : Norakichi senpai (Santa Prop Norakichi senpai)
// Special Thanks WBZ Trading Group
// This indicator support "Contralian Scalping Entry" and "Find ideal Take-Profit point that just like Buying or Selling CLIMAX".
// Attension!!! I strongly reccomend to Verify effectiveness before "REAL TRADE".
// Note1. Downtrend often continue compared to uptrend. So, you might have to change DFMA setting for it. Or you should change reasons/grounds for Scalping Long Entry in long DownTrend.
// Note2. Before applying this indicator or switching resolution, please confirm DFMA resolution Setting. It can't chenge automatically.
// Function1. Difference from Moving Average Arrow from Multi_SMA
// This indicator will plot chart Arrow above or below candle stick when DFMA marked over range.
//
// Function2. When candle touch Quad_Bollinger band, background color will chengeing.
// Function3.

Forex Scalping Pro [PlungerMen]Hello!
This free community edition is very good for all time frame , for all the crypto
This Script recognized overbought area and over-selling area extremely accurate
This Script is very well used as it works by itself and very well used in conjunction with the "Forex scalping " script, both compliment for each other. the "Forex Scalping" script is Free, you can find it
If you want to be more accurate and more efficient, more comfortable when you do not want to see too many other indicators, you can register for our Professional edition.
- The Professional Edition supports Level 1 and Level 2 commands, which are very effective in allocating funds and optimizing your profits
Besides that,You will be supported by personal preferences, profit maximization
- Register for a Professional version will be used 2 Script,Bimex Scalping Pro and Bitmex Long Short Pro
- We will invite you to the signal channel with the announcement of the bottom and the peak of the BTC 0.33% ,the big variable variable has exists
We hope you enjoy this script. Your support will help us develop more good quality scripts in the future to serve the community
**Remember, Like this script and posivite feedback if you are satisfied**
if you have any questions Plz 0.00% post a comment ... below here

Bitmex margin PRO [PlungerMen]Hello!
this is Update of Bitmex Scalping PRO , mix 2 indicaror in it for exactly Signal
Bitmex margin PRO can use for every coin
Bitmex margin PRO is available for all frames
This Script is perfectly functional and works well by me and the best way to use this script is to use it with “Bitmex Long Short" script, both compliment for each other. the "Bitmex Long Short" script is Free, you can find it by searching “Bimex”
If you want to be more accurate and more efficient, more comfortable when you do not want to see too many other indicators, you can register for our Professional edition.
- The Professional Edition supports Level 1 and Level 2 commands ( display at chart : LONG+, long-, SHORT,+,short- ), which are very effective in allocating funds and optimizing your profits
Besides that,You will be supported by personal preferences, profit maximization
- Register for a Professional version will be used 2 Script, Bitcoin -1.30% -3.21% -3.33% -3.27% Scalping Pro and Bitmex Long Short Pro
- We will invite you to the signal channel Telgram with the announcement of the bottom and the peak of the BTC -1.30% -3.21% -3.33% -3.27% 0.60% -0.13% ,the big variable variable has exists
**We hope you enjoy this script. Your support will help us develop more good quality scripts in the future to serve the community **
**Remember, Like this script and posivite feedback if you are satisfied**
if you have any questions, post a comment ... below here
*********** Guide:
+ option for all frames : Click setting and input high and low for time inteval
+ hide wave trend : Click setting -> click Style --> Up trend Fill or Down trend fill
******
New features: this time we add two lines that can help traders trader safer. When the red line cross above the green line means we are in the downtrend and when the green line cross above the red line, which means we are in a uptrend. This new features will help traders do a safer trade at small time frame.
We have the Script free for the user pass, search keyword " Bitmex Scalping PlungerMen"
-->> 0.2 eth/1 month will be used Script: Bitmex margin PRO an Super Bot alert telegram <--

BEM Scalping & Trend Continuation ToolThe BEM Scalping & Trend Continuation Tool highlights 3-candle pullback structures into moving averages and visualizes potential continuation areas within ongoing trends. The script includes two pullback detectors using configurable moving averages, a trend-direction average, VWAP, signal markers, and dynamic swing-level tracking. These elements are designed to support visual analysis of short-term momentum, pullbacks, and structural behavior across different markets and timeframes.
How It Works:
The script identifies descending 3-bar patterns (for bullish pullbacks) and ascending 3-bar patterns (for bearish pullbacks). Pullbacks are highlighted when they interact with a selected moving average and meet additional structural criteria. Optional markers plot when such patterns occur.
Swing levels are detected using pivots, extended forward, and removed when invalidated.
Intended Use:
This tool supports discretionary and rule-assisted chart analysis by highlighting pullbacks, trend context, and market structure. It does not generate predictions or financial advice, and its signals do not imply performance or outcomes.
⭐ Core Features
1️⃣ Highlighted Pullback Bars (Fast + Deep Retracements)
The tool uses two customizable moving averages:
MA1 (default 9) → Fast trend pullback
MA2 (default 45) → Deeper retracement pullback
The script highlights candles when the price creates a structured 3-bar pullback into either moving average. Colors automatically reflect bullish or bearish continuation conditions.
2️⃣ Trend Direction Filter
A longer moving average (default 102) provides directional bias.
This helps traders visually stay aligned with the dominant trend.
3️⃣ VWAP Integration
VWAP is included as a dynamic institutional support/resistance level.
Useful for intraday bias, mean reversion, and trend continuation confluence.
4️⃣ Automated Pullback Signals
Triangle signals appear when a pullback meets all conditions:
Bullish/Short-term long
Bearish/Short-term short
Deep Bullish pullback (MA45)
Deep Bearish pullback (MA45)
These optional markers provide clear visual confirmation.
5️⃣ Smart Swing Lines (Auto-Structure Tracking)
Swing highs and lows are automatically detected and projected forward.
Broken levels self-remove to keep the chart clean.
Great for structure trading, liquidity analysis, and break-of-structure confirmation. To help identify the best possible scenario for the trend continuation pullback work A+.
🔍 How the Pullback Logic Works
The BEM Scalping & Trend Continuation Tool uses a 3-bar structural pattern:
Bullish Pullback Pattern
The High of the first candle needs to be higher than the second one, and the high of the second needs to be higher than the third, moving down in a pullback to the moving average.
Price wicks into MA
Open above MA (rejection)
Continuation expected upward
Bearish Pullback Pattern
The Low of the first candle needs to be lower than the second one, and the low of the second one needs to be lower than the third one, moving upward to the moving average.
Price wicks into MA
Open below MA (rejection)
Continuation expected downward
Bars are highlighted in different colors based on MA1(fast) or MA2(slow and deeper) pullback.
📘 How to Trade the System (Optional Use Case)
(Not predictive; for discretionary workflow support.)
LONG Scenario
Price above Trend MA
Price above VWAP (optional confluence)
Gold (MA9) or Blue (MA45) bullish pullback highlight
Bullish triangle plotted
Entry: candle close or break of signal candle high
Stop: below MA or swing low
Target: next liquidity level, swing high, or trail with MA9
SHORT Scenario
Price below Trend MA
Price below VWAP
Purple (MA9) or Deep Violet (MA45) bearish pullback highlight
Bearish triangle plotted
Entry: candle close or break of signal candle low
Stop: above MA or swing high
Target: next swing low or break structure
*
This tool is for charting and better visualization of pullback and trend continuation only.
It does not guarantee profits.
Always combine with proper risk management.

VWAP + EMA9 + RSI Scalping (Edu)VWAP + EMA9 + RSI Scalping (Edu) is an intraday scalping indicator combining VWAP, EMA9 and RSI to identify high-probability long and short entries. Designed for low timeframes (1m–5m), it aligns micro-trend and momentum to generate clean and fast setups. Works on stocks, indices, forex and crypto.

Nifty Scalping System by Rakesh Sharma🎯 What This Indicator Does:
Core Features:
✅ Fast Entry/Exit Signals - Quick BUY/SELL labels on chart
✅ 3 Signal Modes:
Aggressive - More signals, faster entries
Moderate - Balanced (Recommended)
Conservative - Fewer but high-quality signals
✅ Automatic Target & Stop Loss - Plotted on chart as soon as you enter
✅ Time Filter - Only trades during your specified hours (9:20 AM - 3:15 PM default)
✅ Trade Statistics - Win rate, W/L ratio tracked automatically
✅ Live Dashboard - Shows trend, RSI, VWAP position, current trade status
Indicators Used:
📊 3 EMAs (9, 21, 50) - Trend direction
📈 Supertrend - Primary trend filter
💪 RSI - Momentum & overbought/oversold
💜 VWAP - Intraday support/resistance
📉 ATR - Dynamic stop loss & targets
📊 Volume - Confirmation of moves
⚙️ Best Settings for Nifty/Bank Nifty:
For 5-Minute Charts (Most Popular):
Signal Mode: Moderate
Target R:R: 1.5 (1:1.5 risk-reward)
Time Filter: 9:20 AM to 3:15 PM
For 3-Minute Charts (More Scalps):
Signal Mode: Aggressive
Target R:R: 1.0 (quick exits)
Time Filter: 9:20 AM to 3:15 PM
For 15-Minute Charts (Swing Scalping):
Signal Mode: Conservative
Target R:R: 2.0 (bigger targets)
Time Filter: 9:30 AM to 3:00 PM
💡 How to Use:
Step 1: Setup
Add indicator to 5-min Nifty or Bank Nifty chart
Choose your Signal Mode (start with Moderate)
Set Risk:Reward (1.5 is balanced)
Enable Time Filter (avoid first 10 mins)
Step 2: Trading
BUY Signal appears = Go LONG
Green label shows entry price
Green line = Target
Red line = Stop Loss
SELL Signal appears = Go SHORT
Red label shows entry price
Green line = Target
Red line = Stop Loss
Exit automatically when Target or SL is hit
Step 3: Risk Management
Automatic SL based on ATR (volatility)
Adjustable R:R ratio
Never trade outside session hours
🎯 Trading Rules (Important!):
✅ Take the Trade When:
Signal appears during trading session
Dashboard shows strong trend
Volume spike present
Price above/below VWAP (for buy/sell)
❌ Avoid Trading When:
First 10 minutes (9:15-9:25 AM)
Last 15 minutes (3:15-3:30 PM)
Dashboard shows "SIDEWAYS"
Major news events
📊 Dashboard Explained:
FieldWhat It MeansModeYour current signal sensitivityTrendOverall market directionRSIOverbought/Oversold/NeutralPrice vs VWAPAbove = Bullish, Below = BearishCurrent TradeShows if you're in a positionSessionTrading time active or notWin RateYour success %
🚀 Pro Tips for Nifty/Bank Nifty:
Best Timeframe: 5-minute chart
Best Time: 9:30 AM - 2:30 PM (avoid opening/closing rushes)
Risk per Trade: 1-2% of capital max
Follow the Trend: Take only BUY in uptrend, SELL in downtrend
Use Alerts: Set alerts so you don't miss signals
Start Small: Paper trade first with 1 lot
⚡ Quick Start Guide:
For Bank Nifty (5-min chart):
1. Signal Mode: Moderate
2. Target R:R: 1.5
3. Trading Hours: 9:20 AM - 3:15 PM
4. Watch for 3-5 signals per day
5. Average 30-50 points per trade
For Nifty 50 (5-min chart):
1. Signal Mode: Moderate
2. Target R:R: 1.5
3. Trading Hours: 9:20 AM - 3:15 PM
4. Watch for 3-5 signals per day
5. Average 15-30 points per trade
📈 Expected Performance:
Conservative Mode: 2-4 trades/day, 65-70% win rate
Moderate Mode: 4-8 trades/day, 55-65% win rate
Aggressive Mode: 8-15 trades/day, 45-55% win rate
This is a complete scalping system, Rakesh! All you need to do is:
Add to chart
Wait for signals
Follow the targets/stop losses
Track your stats
Ready to test it? Let me know if you want any adjustments! 🎯💰Claude can make mistakes. Please double-check responses.

Renko ScalperWhat it is-
A lightweight Renko Scalper that combines Renko brick direction with an internal EMA trend filter and MACD confirmation to signal high-probability short-term entries. EMAs are used internally (hidden from the chart) so the visual remains uncluttered.
Signals-
Buy arrow: Renko direction turns bullish AND EMA trend up AND MACD histogram positive.
Sell arrow: Renko direction turns bearish AND EMA trend down AND MACD histogram negative.
Consecutive same-direction signals are suppressed (only one arrow per direction until opposite signal).
Visuals-
Buy / Sell arrows (large) above/below bars.
Chart background tints green/red after the respective signal for easy glance recognition.
Inputs:-
Renko Box Size (points)
EMA Fast / EMA Slow
MACD fast/slow/signal lengths
How to use-
Add to chart
Use smaller Renko box sizes for scalping, larger for swing-like entries.
Confirm signal with price action and volume—this indicator is a signal generator, not a full automated system.
Use alerts (built in) to receive Buy / Sell arrow notifications.
Alerts-
Buy Arrow — buySignal
Sell Arrow — sellSignal
Buy Background / Sell Background — background-color state alerts
Recommended settings-
Timeframes: 1m–15m for scalping, 5m for balanced intraday.
Symbols: liquid futures/currency pairs/major crypto.
Disclaimer
This script is educational and not financial advice. Backtest and forward test on a demo account before live use. Past performance is not indicative of future results. Use proper risk management.

Confluence Engine [BullByte]CONFLUENCE ENGINE
Multi-Factor Technical Analysis Framework
OVERVIEW
Confluence Engine is a multi-dimensional technical analysis framework that evaluates market conditions across five distinct analytical pillars simultaneously. Rather than relying on a single indicator or signal source, this tool synthesizes Structure, Momentum, Volume, Volatility, and Pattern analysis into a unified scoring system that identifies high-probability trading opportunities when multiple technical factors align.
The core philosophy behind this indicator stems from a fundamental observation: isolated signals frequently fail, but when multiple independent analytical methods agree, the probability of a successful trade increases substantially. This indicator was developed after extensive research into why traders often receive conflicting signals from different indicators on their charts, leading to analysis paralysis and poor decision-making.
THE PROBLEM AND SOLUTION
The Problem:
Most traders use multiple indicators independently, often receiving contradictory signals. One indicator says "buy" while another says "wait." This creates confusion and leads to missed opportunities, premature entries based on incomplete analysis, difficulty quantifying how strong a setup actually is, and inconsistent decision-making across different market conditions.
The Solution:
Confluence Engine addresses this by providing a single, unified score (0-100) that represents the aggregate strength of a trading setup. Instead of mentally weighing five different indicators, traders receive a clear numerical score indicating setup quality, visual tier classification (ULTRA, HIGH, STANDARD), specific identification of which factors are strong or weak, and actionable guidance on what to watch for next.
THE FIVE ANALYTICAL DIMENSIONS
Each dimension was selected because it measures a fundamentally different aspect of market behavior:
STRUCTURE ANALYSIS
Evaluates price position relative to key levels and recent swing points. Markets respect structure - previous highs, lows, and areas where price reversed. This dimension identifies when price interacts with these critical levels and measures the quality of that interaction.
What it detects: Price approaching or sweeping swing highs/lows, reclaim patterns after false breakouts, EMA alignment and trend structure, exhaustion after extended moves.
MOMENTUM ANALYSIS
Measures the underlying strength and direction of price movement. Strong moves are characterized by momentum preceding price. This dimension evaluates whether momentum supports the current price direction.
What it detects: Oversold/overbought conditions with reversal potential, momentum divergence states, directional movement strength (ADX-based), momentum shifts before price confirmation.
VOLUME ANALYSIS
Volume validates price movement. Significant moves require participation. This dimension measures current volume relative to recent averages to determine if market participants are genuinely committing to the move.
What it detects: Volume spikes confirming price action, below-average volume warning of weak moves, climactic volume at potential reversals, volume confirmation of rejection patterns.
VOLATILITY ANALYSIS
Markets alternate between compression (low volatility) and expansion (high volatility). This dimension identifies these phases and recognizes when compression is likely to resolve into directional movement.
What it detects: Volatility squeeze conditions (Bollinger inside Keltner), squeeze release direction, ATR expansion indicating breakout potential, compression duration for timing breakouts.
PATTERN ANALYSIS
Candlestick patterns reflect the battle between buyers and sellers within each bar. This dimension evaluates the quality and context of reversal and continuation patterns.
What it detects: Engulfing patterns with quality scoring, hammer and shooting star formations, rejection wicks indicating trapped traders, pattern confluence with other factors.
WHAT MAKES THIS INDICATOR ORIGINAL Not a mashup
This is NOT a mashup of indicators displayed together. The Confluence Engine represents an integrated analytical framework with the following unique characteristics:
Unified Scoring System: All five dimensions feed into a proprietary scoring algorithm that weights and combines their signals. The output is a single 0-100 score, not five separate readings.
Multi-Factor Gate: Beyond just scoring, the system requires a minimum number of factors to be "active" (meeting their individual thresholds) before allowing signals. This prevents signals based on one extremely strong factor masking four weak ones.
Regime-Aware Adjustments: The engine detects the current market regime (trending, ranging, volatile, weak) and automatically adjusts factor weights and score multipliers. A structure signal means something different in a trending market versus a ranging market.
Adaptive Risk Management: Take-profit and stop-loss levels are not static. They adapt based on current volatility, market regime, and signal quality - providing tighter targets in low-volatility environments and wider targets when volatility expands.
Liquidity Sweep Detection: A distinctive feature that identifies when price has swept beyond a swing high/low and then reclaimed back inside. This pattern often indicates stop hunts followed by reversals.
Signal Quality Tiers: Rather than just "signal" or "no signal," the engine classifies setups into tiers. ULTRA (80+) represents highest probability setups with all factors aligned. HIGH (70-79) represents strong setups with multiple factors confirming. STANDARD meets minimum threshold for acceptable setups.
HOW THE SCORING WORKS
Each of the five factors generates a raw score from 0-100 based on current market conditions. These raw scores are then weighted according to the selected trading style (Balanced, Scalper, Swing, Range, Trend), adjusted based on current market regime detection, modified by higher timeframe alignment (if enabled), bonused when multiple factors exceed their activation thresholds simultaneously, and multiplied by session factors (if session filter is enabled).
The result is a final Bull Score and Bear Score, each ranging from 0-100, representing the current strength of long and short setups respectively.
Signal Generation Requirements:
- Score meets minimum threshold (configurable: 60-95)
- Required number of factors are "active" (default: 3 of 5)
- Market regime is not blocked (if blocking enabled)
- Higher timeframe alignment passes (if required)
- Cooldown period from last signal has elapsed
UNDERSTANDING THE DASHBOARDS
Main Dashboard (Top Right)
The main dashboard displays real-time scores and market context:
LONG Score - Current bullish setup strength (0-100) with quality tier displayed
SHORT Score - Current bearish setup strength (0-100) with quality tier displayed
Regime - Current market state showing TREND UP, TREND DN, VOLATILE, RANGE, or WEAK
HTF - Higher timeframe alignment showing BULL, BEAR, NEUT, or OFF
Squeeze - Volatility state showing SQZ (in squeeze), REL+ (bullish release), REL- (bearish release), or NORM
Gate - Factor count versus requirement, for example 4/3 means 4 factors active with 3 required
Sweep L/S - Liquidity sweep status for long and short setups
ATR% - Current ATR as percentile of recent range indicating relative volatility
Vol - Current volume relative to 20-period average
R:R - Current risk-reward ratio based on adaptive TP/SL calculations
Trade - Active trade status and unrealized profit/loss percentage
Analysis Dashboard (Bottom Left)
The analysis dashboard provides actionable guidance:
Signal Readiness - Visual progress bars showing how close each direction is to generating a signal
Blocking Factors - Identifies which specific factor is weakest and preventing signals
Recommended Action - Context-aware guidance such as WATCH, WAIT, MANAGE, or SCAN
Watch For - Specific events to monitor for setup completion
Opportunity Level - Overall market opportunity rating from EXCELLENT to VERY POOR
Timing - Contextual timing guidance based on current conditions
Status Bar (Bottom Center)
Compact view displaying Long Score, Gate Status, Current State, Gate Status, and Short Score in a single row for quick reference.
Dashboard Size - Auto Mode Explained
When Dashboard Size is set to "Auto", the indicator intelligently adjusts text size based on your current chart timeframe to optimize readability:
Auto-Sizing Logic:
1-Minute to 5-Minute Charts → Tiny
- Lower timeframes show more bars on screen
- Tiny text prevents dashboard from obscuring price action
- Recommended for scalping and high-frequency monitoring
15-Minute Charts → Small
- Balanced size for intraday trading
- Readable without being intrusive
1-Hour to Daily Charts → Normal
- Standard size for most trading styles
- Optimal readability for swing trading
Weekly and Monthly Charts → Large
- Larger text for position trading
- Fewer bars visible so space is available
Manual Override:
You can override auto-sizing for any dashboard individually:
- Dashboard Size (All): Sets master size applied to all dashboards
- Main Dashboard Size: Override for top-right dashboard specifically
- Analysis Panel Size: Override for bottom-left panel specifically
- Status Bar Size: Override for bottom-center bar specifically
Example Use Case:
Trading on 5m chart (default = Tiny) but you have good eyesight and large monitor:
- Set "Dashboard Size (All)" to "Small" or "Normal" for better readability
- Individual dashboards will use your override instead of auto-sizing
Recommendation:
Start with Auto mode and only adjust if dashboards are too large or too small for your monitor/eyesight.
UNDERSTANDING SIGNAL LABELS
When a signal generates, a label appears with trade information:
Minimal Style Example:
LONG 85
Shows tier icon, direction, and score only.
Detailed Style Example:
ULTRA LONG
Score: 85
Entry: 50250.50
TP1: 50650.25
TP2: 51500.75
SL: 49850.25
R:R 1:2.5
Regime: TREND UP
HTF: BULL
Tier Icons Explained:
indicates ULTRA quality with score 80 or higher
indicates HIGH quality with score between 70 and 79
indicates STANDARD quality with score meeting minimum threshold
UNDERSTANDING TRADE ZONES
When a signal generates, visual elements appear on the chart:
Entry Line (Purple) marks the entry price level
TP1 Line (Blue Dashed) marks the first take-profit target
TP2 Line (Cyan Dashed) marks the final take-profit target
SL Line (Orange Dotted) marks the stop-loss level
Trade Zone Box shows shaded area from SL to TP2
These elements extend forward as price progresses. When TP1 is hit, its line becomes solid to indicate achievement. When the trade completes at either TP2 or SL, all elements are cleaned up and the entry label converts to a compact ghost label for historical reference.
Exit Labels Explained:
+X.XX% indicates first target reached with partial profit secured
+X.XX% indicates full target reached with maximum profit achieved
-X.XX% indicates stop-loss triggered
TP1 Hit, SL... indicates stopped out after TP1 was already hit (optional display)
OPPOSITE SIGNAL HANDLING
When market conditions shift dramatically, the engine may generate a signal in the opposite direction while an existing trade is active. This represents a significant change in confluence and is handled automatically:
Automatic Trade Reversal Process:
1. Detection: New signal triggers opposite to current trade direction (e.g., SHORT signal while LONG trade is active)
2. Current Trade Closure:
- All visual elements (entry line, TP/SL lines, trade zone) are deleted
- Current trade is marked as closed
3. Entry Label Conversion:
- The detailed entry label is converted to a compact ghost label
- Ghost label shows direction + score (e.g., "LONG 75")
- Marked with "OPP" outcome to indicate opposite signal closure
- Moved to a non-interfering position below/above price
4. New Trade Initialization:
- Fresh entry label created for new direction
- New TP1, TP2, SL levels calculated based on new signal quality
- Trade zone and price lines drawn for new trade
Example Scenario:
You enter a LONG trade at score 72. Price moves sideways for 8 bars, then market structure breaks down. Confluence shifts heavily bearish with a sweep reclaim bear + momentum + volume spike, generating a SHORT signal at score 81. The engine automatically:
- Closes the LONG trade
- Converts "LONG 72" entry label to a small ghost label
- Opens new SHORT trade at current price
- Displays new SHORT entry label with full trade details
Trading Implication:
This behavior ensures the engine is always aligned with the highest-probability direction based on current confluence. It prevents you from holding a position when all five factors have flipped against you.
Note: This does NOT happen for every small score change. The opposite signal must meet all signal generation requirements (minimum score, gate pass, regime check, HTF alignment) before triggering. Typically occurs during strong trend reversals or major support/resistance breaks.
EXAMPLE TRADE : LONG
Instrument and Exchange: Bitcoin / TetherUS (BTC/USDT) on Binance
Timeframe: 5-minute
Timestamp: Nov 27, 2025 12:39 UTC
Indicator Script: Confluence Engine v1.0
Trade Type: Long (Example Trade)
Setting Used: Default
Signal Details:
- Tier: HIGH
- Score: 70
- Entry Price: 90040.70
- TP1 Target: 90868.63
- TP2 Target: 92110.52
- Stop Loss: 89325.94
- Risk Reward: 1:2.9
Trade Outcome:
- TP1 hit after 12 bars (+0.95%)
- TP2 hit after 28 bars (+2.85%)
- Total gain: +2.85% on full position
EXAMPLE TRADE : SHORT with Dashboard Explanation and interpretation
Instrument and Exchange: Ethereum / U.S. Dollar (ETH/USD) — Coinbase
Timeframe: 1-hour
Timestamp (screenshot): Nov 28, 2025 16:41 UTC
Indicator Script: Confluence Engine v1.0
Trade Type: Short (Example Trade)
Setting Used: Default
Signal Details
-Tier: STANDARD (STD)
-Score: 64
-Entry Price: 3037.26
-TP1 Target: 2981.61 (-55.65 pts)
-TP2 Target: 2898.12 (-139.14 pts)
-Stop Loss: 3099.79 (+62.53 pts)
-Risk:Reward: ≈ 1 : 2.2 (TP2/SL)
-Market Context at Signal
-Regime: TREND UP (contextual regime at time of signal) — mixed environment for shorts
-HTF Alignment: OFF (no higher-timeframe confirmation)
-Gate Status: 3 / 3 (minimum factor groups active — gate passed)
-Squeeze Status: NORM (no active compression breakout)
-Volume: ~1.8× average (elevated participation)
-ATR%: 57% (elevated volatility)
Analysis Dashboard Reading (what the user sees)
-Long Readiness: Needs +36 points to qualify.
-Short Readiness: Needs +11 points to qualify (closer but not auto-entering).
-Blocking Factors: Structure = 0 — the single decisive blocker preventing fresh signals.
-Opportunity Level: VERY POOR (roughly 20 / 100) — low quality environment for adding positions.
-Timing: Wait for better setup (do not add new positions).
-Trade Outcome (screenshot moment)
-Trade state: Active SHORT (opened earlier).
-Live P&L (snapshot): +0.14% (managing trade).
-TP1/TP2: Targets shown on chart (TP1 2981.61, TP2 2898.12). Not closed yet at screenshot.
-Visuals: Entry label, TP/SL lines and trade zone are displayed and being extended while trade is active.
Interpretation
The engine produced a standard short (Score 64) while the market showed elevated volume and volatility but no HTF confirmation. Although the Gate passed (3/3), Structure = 0 blocks the indicator from issuing fresh entries — this is intentional and by design: one missing factor (structure) is enough to prevent new signals even when other factors look supportive. The currently open short is being managed (partial targets and SL visible), but the system's recommendation is to manage the existing trade only and not open new shorts until structure or HTF alignment improves.
Why this example matters (teaching point)
-Gate ≠ Go: Gate pass (factor count) alone does not force fresh trades — the system enforces additional checks (structure, regime, HTF) to avoid lower-quality setups.
-Volume & Volatility are necessary but not sufficient: High volume and wide ATR create movement but do not replace structural validation.
-Active trade vs new entries: The script will continue to manage an already open trade but will not create a new signal while a blocking factor remains. This prevents overtrading and reduces false positives.
-Practical trader actions shown by the example
-Manage existing SHORT only: Trail to breakeven if TP1 is taken; scale out at TP1; hold remaining if price respects trend and structure reclaims.
-Do not add fresh positions: Wait for Structure > 0 or a HTF alignment that lifts the block.
-Watch for signals that matter: Sweep reclaim, HTF alignment turning bullish for shorts (i.e., HTF changes to BEAR), or a squeeze release with volume spike — these can clear the blocker and validate new entries.
RECOMMENDED TIMEFRAMES
For Scalping on 1m, 5m, or 15m charts: Use higher factor thresholds and shorter cooldowns. The faster pace requires stricter filtering.
For Day Trading on 15m, 30m, or 1H charts: This provides a balance of signal frequency and reliability suitable for most active traders.
For Swing Trading on 1H, 4H, or Daily charts: Expect higher quality signals with longer hold periods and fewer false signals.
For Position Trading on Daily or Weekly charts: Focus on ULTRA signals only for maximum conviction on longer-term positions.
Higher Timeframe Alignment Recommendations:
When trading 5m, use 1H as your HTF
When trading 15m, use 1H or 4H as your HTF
When trading 1H, use 4H or Daily as your HTF
When trading 4H, use Daily as your HTF
The general rule is to select an HTF that is 4 to 12 times your trading timeframe.
TRADING STYLE PRESETS
Balanced (Default)
Equal weighting across all five factors at 20% each. Suitable for most market conditions and recommended as starting point.
Scalper
Emphasizes Volume at 30% and Volatility at 30%. Designed for quick in-and-out trades on lower timeframes where immediate momentum and volatility expansion matter most.
Swing Trader
Emphasizes Structure at 30% and Momentum at 30%. Focuses on catching larger moves where trend direction and key levels are paramount.
Range Trader
Emphasizes Structure at 35% and Pattern at 25%. Optimized for sideways markets where support/resistance levels and reversal patterns dominate.
Trend Follower
Emphasizes Momentum at 40%. Designed for trending markets where staying with the dominant direction is the priority.
QUALITY MODE SETTINGS
Custom Mode
Set your own minimum score threshold. Lower thresholds between 60 and 65 generate more signals but with lower average quality. Higher thresholds of 75 or above generate fewer but higher-quality signals.
High Quality Mode
Uses minimum score of 70. Recommended for most users as it filters out marginal setups while still providing reasonable signal frequency.
Ultra Only Mode
Uses minimum score of 80 for maximum selectivity. Only the highest-conviction setups generate signals. Recommended for swing and position traders or during uncertain market conditions.
REGIME DETECTION
The engine continuously evaluates market conditions and classifies them into five states:
TREND UP
Characteristics: Strong ADX reading with EMAs aligned in bullish order
Trading Implications: Long signals receive score boost while short signals are suppressed. Momentum factor gains additional weight.
TREND DN
Characteristics: Strong ADX reading with EMAs aligned in bearish order
Trading Implications: Short signals receive score boost while long signals are suppressed. Momentum factor gains additional weight.
VOLATILE
Characteristics: High ATR percentile, wide Bollinger Bands, elevated volume
Trading Implications: Both directions remain viable but wider stops are recommended. Volume factor gains additional weight.
RANGE
Characteristics: Low ADX reading, narrow Bollinger Bands, low ATR percentile
Trading Implications: Structure signals are emphasized while momentum signals are suppressed. Pattern recognition becomes more important.
WEAK
Characteristics: Unclear or mixed conditions that do not fit other categories
Trading Implications: Reduced confidence in all signals. Consider waiting for clearer market conditions.
Filter Mode Options:
Off - Regime is detected and displayed but no score adjustments are applied
Adjust Scores - Automatically modifies factor weights based on current regime
Block Weak Regimes - Prevents signals from generating when regime is RANGE or WEAK
VOLATILITY SQUEEZE DETECTION
A volatility squeeze occurs when Bollinger Bands contract inside the Keltner Channel, indicating reduced volatility and potential energy building for a breakout.
Squeeze States Explained:
SQZ with bar count (example: SQZ 15)
Indicates currently in squeeze for the displayed number of bars. A score penalty is applied during this phase because compression represents uncertainty about direction.
REL+ (Release Bullish)
Indicates squeeze has released with price above the basis line. Score bonus is applied for long setups as this often precedes strong upward moves.
REL- (Release Bearish)
Indicates squeeze has released with price below the basis line. Score bonus is applied for short setups as this often precedes strong downward moves.
NORM (Normal)
No active squeeze detected. Standard scoring applies.
Trading Implication:
Squeeze releases often produce strong directional moves. The engine detects both the squeeze duration and the release direction, awarding bonus points to signals that align with the release. Longer squeeze duration often corresponds to more powerful breakouts.
LIQUIDITY SWEEP DETECTION
Markets often sweep beyond obvious support and resistance levels to trigger stops before reversing. The engine detects these patterns:
Bullish Sweep Reclaim
Price sweeps below recent swing low, triggering stop losses, then reclaims back above the swing low. This often indicates smart money accumulation after retail stops are collected.
Bearish Sweep Reclaim
Price sweeps above recent swing high, triggering stop losses, then reclaims back below the swing high. This often indicates smart money distribution after retail stops are collected.
Sweep Status in Dashboard:
RCL (Reclaim) - Reclaim has been confirmed. This receives highest structure score as the pattern is complete.
PND (Pending) - Sweep has occurred and price is near the level but full reclaim not yet confirmed. Watching for completion.
ACT (Active) - Sweep is currently in progress with price beyond the swing level.
Dash (-) - No sweep activity detected.
MULTI-FACTOR GATE SYSTEM
Beyond overall score, the engine counts how many individual factors meet their activation threshold.
Example Calculation:
Structure score 45 with threshold 35 equals ACTIVE
Momentum score 25 with threshold 30 equals INACTIVE
Volume score 50 with threshold 35 equals ACTIVE
Volatility score 40 with threshold 30 equals ACTIVE
Pattern score 35 with threshold 30 equals ACTIVE
Result: 4 of 5 factors are active
If minimum required factors is set to 3, this example passes the gate and receives a 4-factor bonus.
Gate Bonuses:
4 factors active adds 8 points to final score (default setting)
5 factors active adds 15 points to final score (perfect confluence)
Purpose:
This mechanism prevents scenarios where one extremely high factor score masks four weak factors. A score of 75 with only 2 active factors is less reliable than a score of 70 with 4 active factors.
ADAPTIVE RISK MANAGEMENT
Take-profit and stop-loss distances adjust dynamically based on three inputs:
Volatility Influence (default 40% weight)
Low ATR percentile produces tighter targets
High ATR percentile produces wider targets
This ensures stops are not too tight in volatile conditions or too wide in calm conditions.
Regime Influence (default 30% weight)
Trending market with aligned signal produces extended targets
Ranging market produces contracted targets
Volatile regime produces wider stops for protection
Score Influence (default 30% weight)
ULTRA signals (high conviction) receive extended targets
STANDARD signals receive standard targets
Higher conviction justifies larger profit expectations.
You can configure the weight of each influence in settings to match your trading style.
SESSION FILTER (Optional Feature)
When enabled, the engine applies score multipliers based on the trading session:
Asian Session (default 0.9x multiplier)
Characterized by lower volatility and ranging tendency. Score reduction reflects reduced opportunity.
London Session (default 1.1x multiplier)
Characterized by high volatility and trend initiation. Score boost reflects increased opportunity.
London/NY Overlap (default 1.2x multiplier)
Characterized by highest liquidity and strongest moves. Maximum score boost reflects peak trading conditions.
New York Session (default 1.05x multiplier)
Characterized by volatility but typically after initial moves have occurred.
Configure your UTC offset in settings to align session detection with your chart timezone.
ALERT SYSTEM
The indicator provides comprehensive alerts with dynamic data:
Signal Alerts:
- ULTRA Long Signal with full trade details
- ULTRA Short Signal with full trade details
- HIGH Long Signal with key levels
- HIGH Short Signal with key levels
- Any Long Signal with basic info
- Any Short Signal with basic info
Trade Management Alerts:
- TP1 Reached with profit percentage
- TP2 Full Target with total profit
- Stop Loss Hit with loss percentage and status
Technical Event Alerts:
- Squeeze Release
- Liquidity Sweep
- Perfect Confluence
- Regime Change
All alerts include actual calculated values such as score, entry price, target levels, stop level, and risk-reward ratio at the time of trigger.
AUTOMATIC SETTINGS VALIDATION
The indicator performs comprehensive validation when first loaded on a chart. If configuration errors are detected, a warning label appears on the chart with specific guidance.
Critical Errors (Prevent Signal Generation):
ULTRA threshold must exceed HIGH threshold
- Example error: HIGH = 75, ULTRA = 70
- Fix: Ensure ULTRA threshold is higher than HIGH threshold
- Default safe values: HIGH = 70, ULTRA = 80
Minimum factors cannot exceed 5
- The gate requires 3 to 5 factors (you cannot require 6 of 5 factors)
- Fix: Set minimum active factors to 3, 4, or 5
TP2 multiplier must exceed TP1 multiplier
- Example error: TP1 = 3.0 ATR, TP2 = 2.0 ATR
- Fix: Ensure TP2 (final target) is farther than TP1 (partial target)
- Default safe values: TP1 = 2.0, TP2 = 5.0
Swing lookback minimum is 3 bars
- Liquidity sweep detection requires at least 3 bars to identify swing highs/lows
- Fix: Increase swing lookback period to 3 or higher
ATR period minimum is 5 bars
- ATR calculation requires sufficient data for accuracy
- Fix: Increase ATR period to 5 or higher (14 recommended)
Higher timeframe must be larger than chart timeframe
- Example error: Trading on 1H chart with MTF set to 15m
- Fix: Select HTF that is 4-12x your chart timeframe
- Example: If trading 15m, use 1H or 4H as HTF
Warnings (Signal Generation Continues):
Score threshold below 50 generates many signals
- Lower thresholds increase signal frequency but reduce quality
- Recommendation: Use minimum 60 for active trading, 70+ for swing trading
Cooldown below 3 bars may cause signal clustering
- Very short cooldowns can produce multiple signals in quick succession
- Recommendation: Use 5+ bars for lower timeframes, 3+ for higher timeframes
Validation Label Display:
When errors are detected, a label appears at the top of the chart showing:
SETTINGS QUICK REFERENCE
Signal Quality Section:
Quality Mode: High Quality recommended for most users
Custom Minimum Score: Used when Quality Mode is set to Custom (range 30-95)
HIGH Threshold: Score required for HIGH tier classification (default 70)
ULTRA Threshold: Score required for ULTRA tier classification (default 80)
Regime Engine Section:
Enable Regime Detection: Activates automatic market state classification
Filter Mode: Off, Adjust Scores, or Block Weak Regimes
ADX Strong Threshold: ADX level indicating strong trend (default 25)
ADX Weak Threshold: ADX level indicating ranging conditions (default 15)
Show Regime Background: Displays subtle background color for current regime
Liquidity and Squeeze Section:
Enable Liquidity Sweep Detection: Activates sweep and reclaim pattern detection
Swing Lookback Period: Bars used to identify swing highs and lows (default 8)
Reclaim Threshold: Percentage of range price must reclaim after sweep (default 15%)
Enable Volatility Squeeze Detection: Activates Bollinger/Keltner squeeze detection
Keltner Channel Multiplier: Width multiplier for Keltner Channel (default 1.5)
Squeeze Penalty: Points subtracted during active squeeze (default 25)
Squeeze Release Bonus: Points added on squeeze release (default 20)
Enable Multi-Factor Gate: Requires minimum factors active before signaling
Minimum Active Factors: How many factors must meet threshold (default 3)
Individual Factor Thresholds: Customize activation threshold for each factor
4-Factor Bonus: Points added when 4 of 5 factors active (default 8)
5-Factor Bonus: Points added when all 5 factors active (default 15)
MTF Confluence Section:
Enable MTF Confluence: Activates higher timeframe trend analysis
Higher Timeframe: Select timeframe for trend alignment (recommend 4-12x chart TF)
Require HTF Alignment: Block signals opposing higher timeframe trend
Show HTF EMAs: Display higher timeframe EMA 21 and EMA 50 on chart
Trading Style Section:
Enable Style Weighting: Activates factor weight adjustments based on style
Trading Style: Balanced, Scalper, Swing Trader, Range Trader, or Trend Follower
Custom Weights: Individual weight sliders when fine-tuning is needed
Session Filter Section:
Enable Session Filter: Activates session-based score multipliers
Your UTC Offset: Your timezone offset for accurate session detection
Session Multipliers: Individual multipliers for Asian, London, New York, and Overlap sessions
Risk Parameters Section:
ATR Period: Period for Average True Range calculation (default 14)
TP1 ATR Multiple: First target distance as ATR multiple (default 2.0)
TP2 ATR Multiple: Final target distance as ATR multiple (default 5.0)
SL ATR Multiple: Stop loss distance as ATR multiple (default 2.0)
Enable Adaptive TP/SL: Activates dynamic adjustment based on conditions
Volatility Weight: Influence of ATR percentile on adaptive calculation (default 40%)
Regime Weight: Influence of market regime on adaptive calculation (default 30%)
Score Weight: Influence of signal score on adaptive calculation (default 30%)
Appearance Section:
Color Theme: Matrix (green/red), Dark (modern dark), or Light (clean light)
Label Detail: Minimal (score only), Standard (key info), or Detailed (full breakdown)
Dashboard Size Controls: Master size and individual overrides for each dashboard
Show Trade Zones: Display shaded box from SL to TP2 for active trades
Show TP/SL Labels: Display price labels on target and stop lines
Show Trailing Exit Labels: Display exit label when stopped after TP1 hit
Show Main Dashboard: Toggle main dashboard visibility (top right)
Show Analysis Dashboard: Toggle analysis panel visibility (bottom left)
Show Status Bar: Toggle compact status bar visibility (bottom center)
Performance Section:
Performance Mode: Reduces visual elements on lower timeframes automatically
Max Ghost Labels: Maximum historical signal labels to retain (default 50)
Signal Cooldown: Minimum bars between signals in same direction (default 5)
Enable Script Alerts: Controls whether alert() calls fire automatically (default ON)
- ON: Dynamic alerts with calculated values fire automatically
- OFF: alert() suppressed, alertcondition() still available for manual creation
- Use OFF when testing settings or monitoring multiple instruments visually
- Toggle per-chart for selective alert coverage across watchlist
Show Factor Markers: Display shapes on chart when 3, 4, or 5 factors align
Show Score Breakdown: Display detailed factor scores table in debug panel
Show Regime Debug: Display regime state and ADX value in debug panel
Show MTF Debug: Display higher timeframe status in debug panel
DEBUG MODE AND FACTOR MARKERS
The indicator includes optional debug tools for traders who want deeper insight into the scoring mechanics and factor analysis. These features are disabled by default to keep the chart clean but can be enabled in the Debug Mode settings group.
FACTOR MARKERS
When "Show Factor Markers" is enabled, visual shapes appear on the chart indicating confluence states:
Perfect Confluence (5/5 Factors Active)
A circle appears below the bar for bullish or above the bar for bearish setups. This represents maximum confluence where all five analytical dimensions meet their activation thresholds simultaneously. A small label showing "5/5" also appears. This is a rare occurrence and typically precedes the highest quality signals. Background color shifts to highlight this exceptional alignment.
Strong Confluence (4/5 Factors Active)
A diamond shape appears below the bar for bullish or above the bar for bearish setups. This represents strong confluence with four of five factors active. A label showing "4/5" appears when this state is first achieved. This level of confluence is associated with high-quality setups.
Ready Confluence (3/5 Factors Active)
A triangle appears below the bar (pointing up) for bullish or above the bar (pointing down) for bearish setups. This represents the minimum confluence level required when gate is set to 3 factors. No label appears for this level to reduce visual clutter.
Confluence Background
When factor markers are enabled, a subtle background color appears indicating the current confluence state. Stronger colors indicate higher confluence levels. Bullish confluence shows green tints while bearish confluence shows red tints.
Purpose of Factor Markers:
These markers help traders visualize when confluence is building before a signal triggers. You might see a 4/5 diamond appear one or two bars before the actual signal, giving you advance notice that conditions are aligning. This can help with preparation and timing.
DEBUG PANEL (Bottom Right)
When any debug option is enabled, a debug panel appears in the bottom right corner of the chart providing detailed scoring information.
Score Breakdown Table
When "Show Score Breakdown" is enabled, the panel displays:
Factor column showing Structure, Momentum, Volume, Volatility, and Pattern
Bull column showing raw score (0-100) for each bullish factor
Bear column showing raw score (0-100) for each bearish factor
Weight column showing current percentage weight for each factor
Below the factor rows :
FINAL row shows the calculated final Bull and Bear scores after all adjustments
Adj row shows total adjustments applied including gate bonus, squeeze adjustment, and exhaustion adjustment with positive or negative sign
This breakdown allows you to see exactly which factors are contributing to the score and which are lagging. If you notice Structure consistently low, you know to wait for better price positioning relative to swing levels.
Regime Debug
When "Show Regime Debug" is enabled, the panel displays:
Current regime state (TREND UP, TREND DN, VOLATILE, RANGE, WEAK)
Current ADX value driving the regime classification
This helps you understand why certain score adjustments are being applied and verify the regime detection is working as expected for current market conditions.
MTF Debug
When "Show MTF Debug" is enabled, the panel displays:
Current MTF alignment status (BULL, BEAR, NEUT)
The higher timeframe being analyzed
This confirms the higher timeframe data is being read correctly and shows you the trend bias from the larger timeframe perspective.
Using Debug Mode Effectively
For Learning: Enable all debug options when first using the indicator to understand how scores are calculated and what drives signal generation.
For Optimization: Use score breakdown to identify which factors are consistently weak in your chosen market and timeframe. This can inform whether to adjust factor thresholds or switch trading styles.
For Troubleshooting: If signals seem inconsistent, enable debug to see exactly what values the engine is working with. This helps identify if a specific factor is behaving unexpectedly.
For Live Trading: Disable debug features to keep chart clean and reduce visual distraction. The main dashboards provide sufficient information for trade execution.
Debug Settings Summary:
Show Factor Markers - Displays shapes on chart when 3, 4, or 5 factors align. Useful for seeing confluence build before signals trigger.
Show Score Breakdown - Displays detailed table with all raw factor scores, weights, and adjustments. Useful for understanding exactly how final score is calculated.
Show Regime Debug - Adds regime state and ADX value to debug panel. Useful for verifying regime detection accuracy.
Show MTF Debug - Adds higher timeframe status and timeframe to debug panel. Useful for confirming MTF data is loading correctly.
PERFORMANCE CONSIDERATIONS
On lower timeframes such as 1-minute and 5-minute charts, the indicator creates visual elements including labels, lines, and boxes that may impact performance on slower devices.
Performance Mode automatically reduces visual elements, optimizes calculation frequency, and limits historical ghost labels when enabled.
Configure Max Ghost Labels (default 50) to control how many historical signal labels are retained on the chart.
NON-REPAINTING DESIGN
Signal Integrity:
All entry and exit signals generate only on confirmed (closed) bars using barstate.isconfirmed checks. This ensures signals do not appear and disappear during bar formation.
Higher Timeframe Data:
MTF analysis uses request.security with lookahead disabled (barmerge.lookahead_off) to prevent future data from influencing current calculations.
Visual Elements:
Lines, boxes, and labels for active trades update in real-time for monitoring purposes but this visual updating does not affect signal generation logic. Entry decisions are made solely on confirmed bar data.
DISCLAIMER
Trading financial instruments involves substantial risk of loss and is not suitable for all investors. Past performance does not guarantee future results. This indicator is a technical analysis tool provided for educational purposes only. It does not constitute financial advice, trading recommendations, or solicitation to buy or sell any financial instrument.
The developer makes no representations regarding the accuracy of signals or the profitability of trading based on this indicator. Users assume full responsibility for their trading decisions and should conduct their own analysis before entering any trade.
Always use proper risk management. Never risk more than you can afford to lose. Consider consulting a qualified financial advisor before making trading decisions.
VERSION HISTORY
v1.0 - Initial Release
- Five-factor confluence scoring system
- Regime detection and automatic adaptation
- Liquidity sweep and reclaim detection
- Volatility squeeze state machine
- Multi-factor gate with bonus system
- Adaptive risk management
- Comprehensive alert system
- Three dashboard display panels
- Session filter with multipliers
- Multiple trading style presets
- Theme customization options
Developed by BullByte
Pine Script v6
2025

Ata✨ScalpingТолько для часовика! Скальп на движении.
Ata✨Scalping is a multi-functional scalping indicator for TradingView.
It features customizable moving averages (SMA, EMA, WMA, HMA), a visual volume profile, and automatic support/resistance level detection with strength ratings.
The script is designed for active traders and scalpers, providing clear visual cues for trend, volume, and key price levels, as well as optional breakout alerts.

Alzeerr Scalping StrategyAlzeerr Scalping Strategy
A high-precision intraday scalping strategy that combines VWAP, support/resistance levels, volume confirmation, RSI momentum shifts, and reversal candlestick patterns to identify low-risk, high-accuracy trade entries. The strategy only trades in the direction of the trend relative to VWAP, focuses on high-probability pullback entries, and uses tight stop-losses with small, consistent profit targets. Designed to maximize accuracy and minimize drawdown during high-liquidity market sessions.
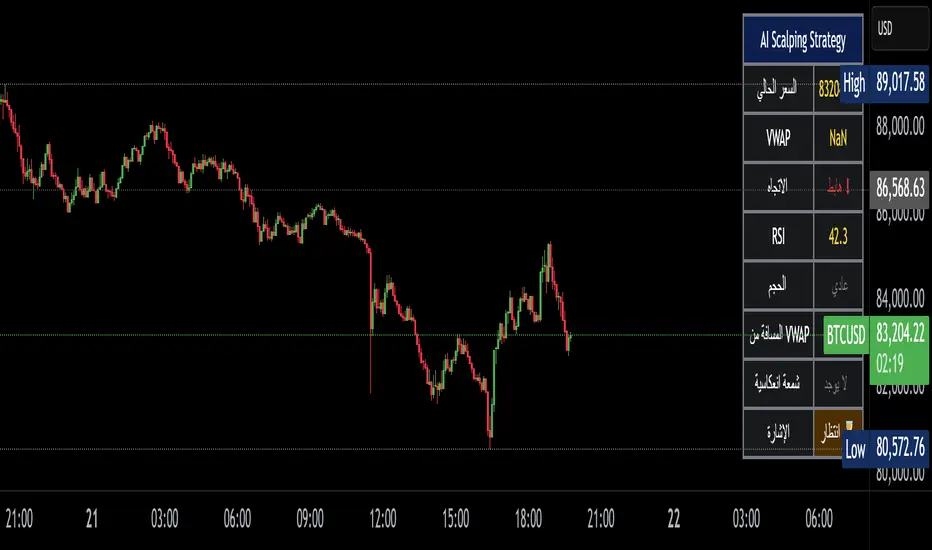
9/15 EMA Scalper 9/15 EMA Scalper — by uzairbaloch
This script is a price-action based scalping system built around the 9 EMA and 15 EMA trend structure.
It identifies short-term reversal points where the market pulls back into the EMAs and confirms direction with a strong candle signal.
The strategy looks for:
• A clear EMA trend (9 above 15 for buys, 9 below 15 for sells)
• Pullback into EMA9/EMA15 with candle bodies touching the fast EMA
• Strong confirmation candle (engulfing / strong momentum / controlled wick)
• Optional slope filter to avoid flat, choppy sessions
• Automatic trade labels showing Entry, SL and TP (based on R:R)
The script is designed for scalping on gold, indices, and high-volatility FX pairs.
It resets trade logic immediately after SL or TP is hit, so it can catch the next valid signal without delay.
This tool is meant as an indicator — not a full strategy — and can be used to visually mark high-probability EMA pullback setups with precise levels.
Author: uzairbaloch

MACD Volume VWAP Scalping (2min) by Obiii📘 Strategy Description (for TradingView)
MACD Volume VWAP Scalping Strategy (2-Minute Intraday Momentum)
This strategy is designed for scalpers and short-term intraday traders who focus on capturing small, high-probability moves during the most active hours of the trading session — typically between 9:45 AM and 11:30 AM (New York time).
The system combines three key momentum confirmations:
MACD crossovers to detect short-term trend shifts,
Volume spikes to validate real market participation, and
VWAP / EMA alignment to filter trades in the direction of the prevailing intraday trend.
🔹 Entry Logic
Long Entry:
MACD line crosses above the signal line
Both MACD and Signal are above zero
Current volume > average of the last 10 candles
Price is above VWAP and (optionally) above EMA 9 and EMA 20
Short Entry:
MACD line crosses below the signal line
Both MACD and Signal are below zero
Current volume > average of the last 10 candles
Price is below VWAP and (optionally) below EMA 9 and EMA 20
🎯 Exit Logic
Fixed Take Profit: +0.25%
Fixed Stop Loss: -0.15% to -0.20%
Optionally, switch to the 5-minute chart after entry to monitor momentum and manage exits more smoothly.
⚙️ Recommended Settings
Timeframe: 2 minutes (entries), 5 minutes (monitoring)
Market Session: 9:45 AM – 11:30 AM EST
Assets: Highly liquid instruments such as SPY, QQQ, NVDA, TSLA, AAPL, or large-cap momentum stocks.
💡 Notes
This is a momentum-based scalping strategy — precision and discipline are key.
It performs best in high-volume environments where clear direction emerges after the morning volatility settles.
The system can be fine-tuned for different profit targets, MACD settings, or volume thresholds depending on volatility.

Bollinger Adaptive Trend Navigator [QuantAlgo]🟢 Overview
The Bollinger Adaptive Trend Navigator synthesizes volatility channel analysis with variable smoothing mechanics to generate trend identification signals. It uses price positioning within Bollinger Band structures to modify moving average responsiveness, while incorporating ATR calculations to establish trend line boundaries that constrain movement during volatile periods. The adaptive nature makes this indicator particularly valuable for traders and investors working across various asset classes including stocks, forex, commodities, and cryptocurrencies, with effectiveness spanning multiple timeframes from intraday scalping to longer-term position analysis.
🟢 How It Works
The core mechanism calculates price position within Bollinger Bands and uses this positioning to create an adaptive smoothing factor:
bbPosition = bbUpper != bbLower ? (source - bbLower) / (bbUpper - bbLower) : 0.5
adaptiveFactor = (bbPosition - 0.5) * 2 * adaptiveMultiplier * bandWidthRatio
alpha = math.max(0.01, math.min(0.5, 2.0 / (bbPeriod + 1) * (1 + math.abs(adaptiveFactor))))
This adaptive coefficient drives an exponential moving average that responds more aggressively when price approaches Bollinger Band extremes:
var float adaptiveTrend = source
adaptiveTrend := alpha * source + (1 - alpha) * nz(adaptiveTrend , source)
finalTrend = 0.7 * adaptiveTrend + 0.3 * smoothedCenter
ATR-based volatility boundaries constrain the final trend line to prevent excessive movement during volatile periods:
volatility = ta.atr(volatilityPeriod)
upperBound = bollingerTrendValue + (volatility * volatilityMultiplier)
lowerBound = bollingerTrendValue - (volatility * volatilityMultiplier)
The trend line direction determines bullish or bearish states through simple slope comparison, with the final output displaying color-coded signals based on the synthesis of Bollinger positioning, adaptive smoothing, and volatility constraints (green = long/buy, red = short/sell).
🟢 Signal Interpretation
Rising Trend Line (Green): Indicates upward direction based on Bollinger positioning and adaptive smoothing = Potential long/buy opportunity
Falling Trend Line (Red): Indicates downward direction based on Bollinger positioning and adaptive smoothing = Potential short/sell opportunity
Built-in Alert System: Automated notifications trigger when bullish or bearish states change, allowing you to act on significant development without constantly monitoring the charts
Candle Coloring: Optional feature applies trend colors to price bars for visual consistency
Configuration Presets: Three parameter sets available - Default (standard settings), Scalping (faster response), and Swing Trading (slower response)
