In den Scripts nach "rsi" suchen


RSI +This enhanced RSI script, titled "RSI +", is designed to provide traders with more detailed and nuanced information about market conditions.
// INPUTS
The length input allows you to specify the number of periods used in the RSI calculation, with a default value of 14.
The Source input designates the price used for the calculations, typically the closing price.
// CALCULATIONS + PLOTTING
The RSI itself is then calculated as 50 plus 50 times the ratio of two RMAs (Running Moving Averages) - one of the gain_loss, and another of the absolute value of gain_loss. Both RMAs use the specified length.
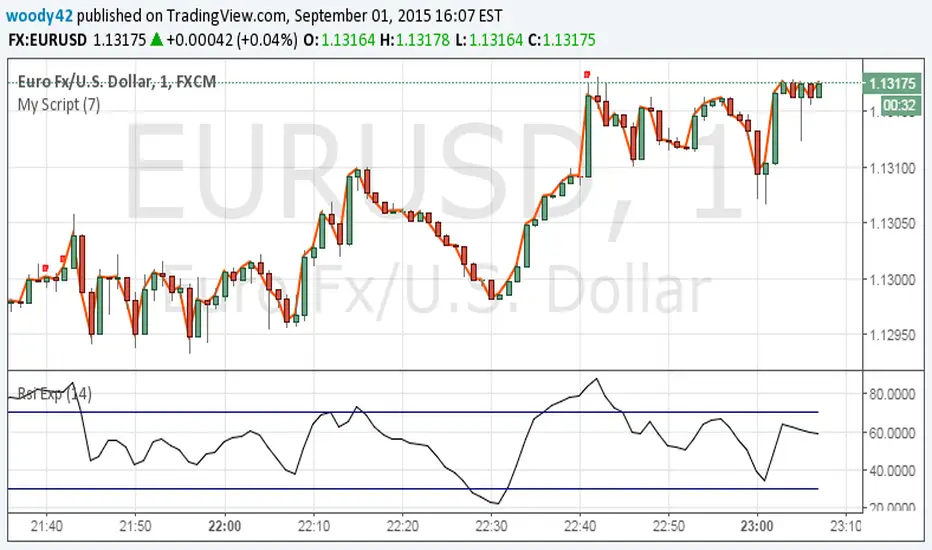
This script also plots several horizontal lines (bands) at fixed levels: 70, 60, 50, 40, and 30. These bands help to visually delineate areas of potential overbought (above 70) and oversold (below 30) conditions, as well as median levels. The color of the plotted RSI line changes depending on its relation to these bands and its own simple moving average (Moving_Average), providing an additional visual cue.
----------------------
What sets this script apart from a standard RSI is its unique calculation method. Unlike the traditional RSI, which simply compares the magnitude of recent gains to recent losses, this script incorporates a normalization factor (norm), calculated as the average of the current and previous period's source prices. The gain or loss (gain_loss) is then determined by dividing the change in the source price by this normalization factor. This method can potentially reduce noise and improve accuracy.
Always remember, though, that no indicator should be used in isolation. The best results are often achieved when they're used as part of a comprehensive trading strategy that considers multiple aspects of market analysis. This script, with its unique enhancements, could be used with other technical indicators like Moving Averages to ascertain the direction of the prevailing trend, while volume-based indicators like Volume-Weighted Average Price (VWAP) could provide insights into the strength behind price movements.

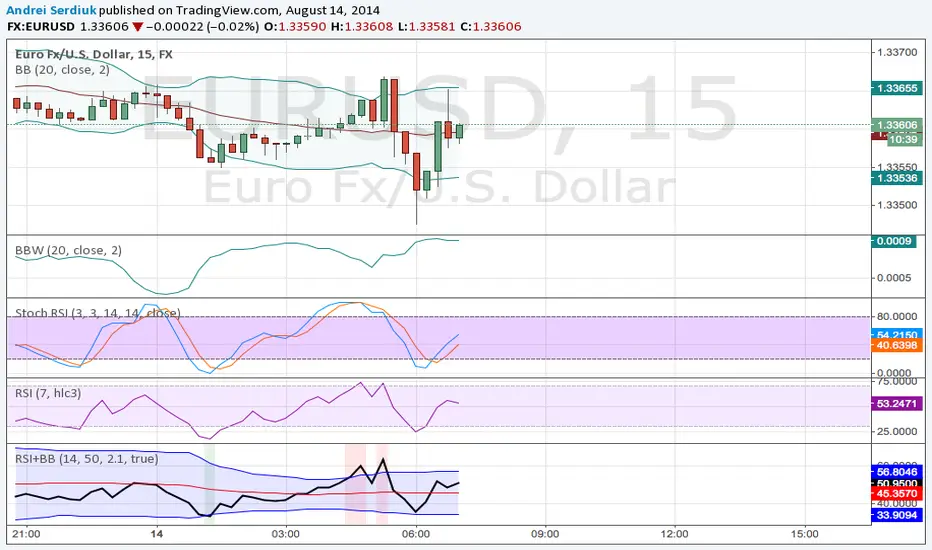
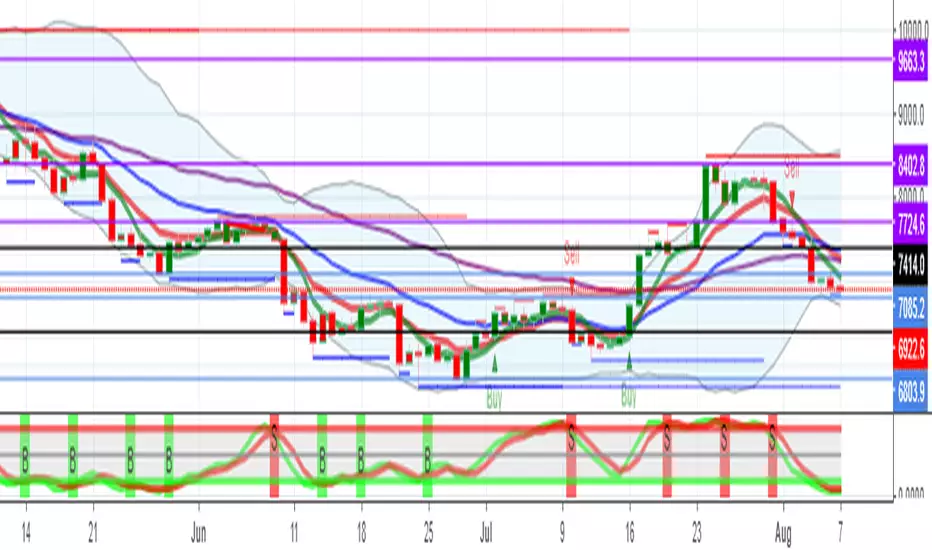
RSI+The Relative Strength Index can be used to determine Overbought and Oversold market conditions. This RSI+ indicator is set to a length faster then normal and changes color depending on momentum. When the RSI is Overbought a red shadow appears to indicate a sell is setting up. When the RSI is Oversold a green shadow appears to indicate a buy is setting up
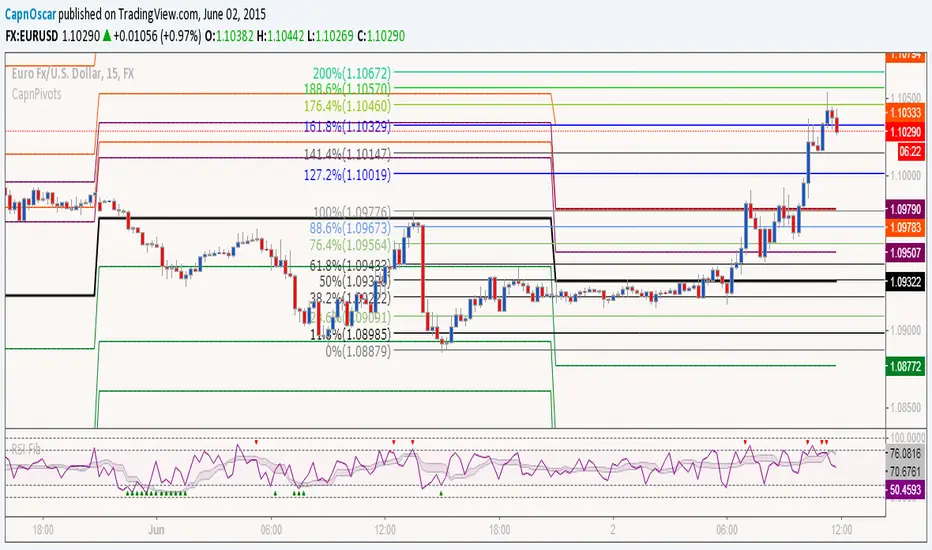
RSI+A free addon for Profitable RSI . Equipped with RSI Values Distribution Profile, Point of Control, Value Area (customizable % based) and alert system.

RSI +++Customizable RSI indicator with bullish and bearish color coding and pivot dots when RSI crosses its moving average.

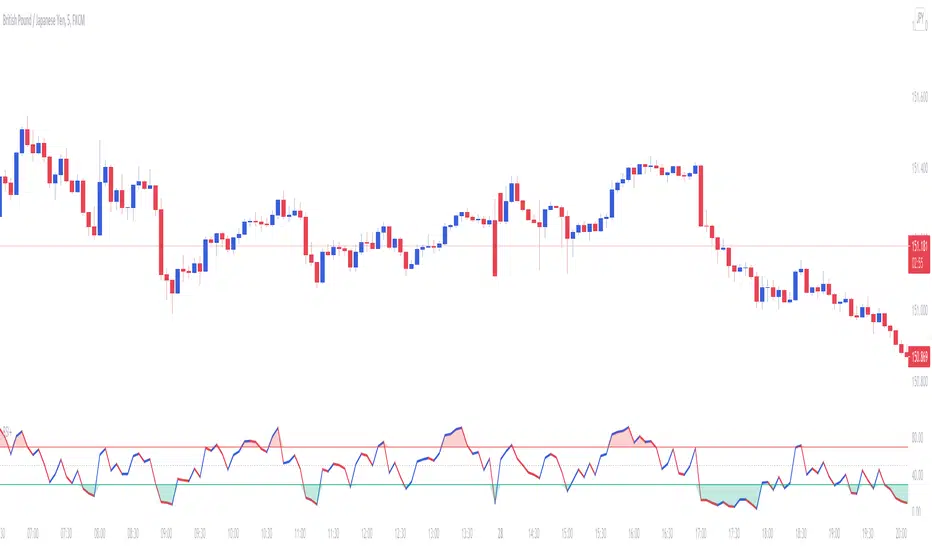
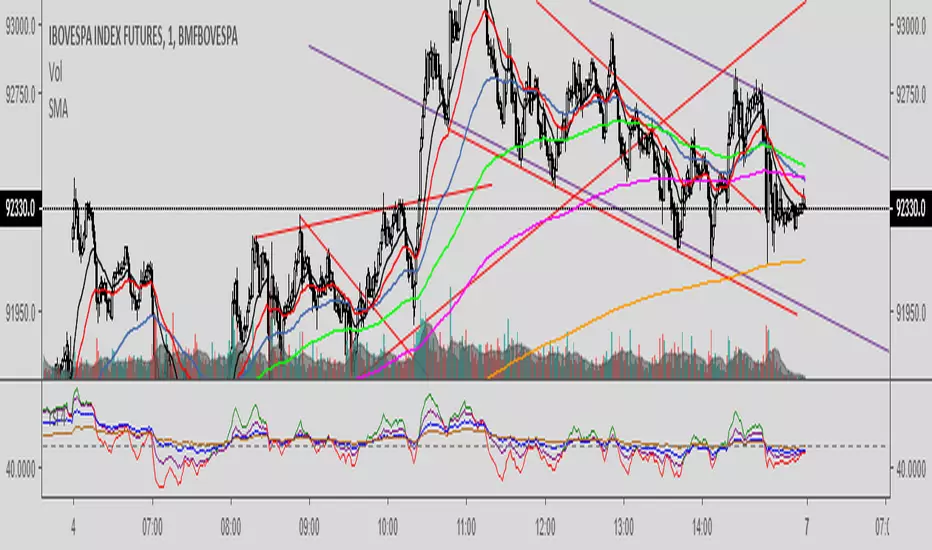
RSI-VA modified RSI script with a a slight modified net volume formula
red is bearish
green is bullish
just attempt to make the RSI more easy and better to use
best entry is when green bellow 30
and vice versa when red start to cross down the 70

RSIStandard RSI that uses the highest and lowest output plots of the RSI formula using open, high, low, close formulas.


RSI Divergence + MTF Table FinalThis is a professional, high-impact English description for your RSI Divergence + MTF Table Final script, designed to attract users on TradingView by highlighting its institutional-grade features.
Institutional RSI Divergence & MTF Confluence Heatmap
Overview
The Institutional RSI Divergence & MTF Confluence Heatmap is a professional-grade analytical tool designed for high-precision traders. It combines Automated RSI Divergence Detection with a Multi-Timeframe (MTF) Heatmap Table, allowing you to monitor market momentum across 8 different timeframes (from 1-minute to 1-day) without ever switching charts.
Key Features
🔍 Automated Divergence Detection: Instantly identifies Regular Bullish and Bearish divergences on the RSI oscillator, marking them with clear "Bull" and "Bear" labels.
📊 MTF Heatmap Grid: A real-time monitoring table that tracks RSI values across: 1m, 5m, 15m, 30m, 1h, 4h, 12h, and 1D.
🎨 Dynamic "Institutional" Color Logic: The table uses a sophisticated color-coded system to highlight extreme exhaustion and momentum:
Ultra Overbought (RSI > 90): Bright Red (Extreme Reversal Zone).
Overbought (RSI > 80): Orange (High Momentum/Caution).
Oversold (RSI < 26): Lime Green (Potential Accumulation).
Neutral: Gray (Consolidation).
🛠️ Flexible Layout Engine: Toggle between Vertical or Horizontal layouts to fit your chart workspace perfectly.
🚀 Pine Script v6 Optimized: Built with the latest TradingView engine for ultra-fast performance and minimal lag.
Trading Strategy: The Power of Confluence
Cross-Timeframe Confirmation: The strongest reversals occur when multiple timeframes (e.g., 15m, 1h, and 4h) all turn Orange/Red or Lime simultaneously. This represents a massive momentum exhaustion.
Divergence Validation: Use the table to see if a detected "Bull" divergence on your current timeframe is backed by "Oversold" conditions on higher timeframes.
Institutional Sniping: Combined with Demand/Supply zones, this script helps you "snipe" entries at the exact moment market momentum peaks or bottoms out.
Settings & Customization
Toggle Compact Mode: Display a minimal version of the table for a cleaner interface.
Custom Thresholds: Modify RSI levels to suit your specific trading style (Scalping vs. Swing Trading).
Table Position: Move the heatmap to any corner of your screen (Top Right, Bottom Left, etc.).
